Black versus Dark: Rapid Growth of Supermassive Black Holes in Dark Matter Halos at
Abstract
We report on the relation between the mass of supermassive black holes (SMBHs; ) and that of hosting dark matter halos () for 49 quasi-stellar objects (QSOs) with [C II]158m velocity-width measurements. Here, we estimate assuming that the rotation velocity from is equal to the circular velocity of the halo; we have tested this procedure using QSOs that also have clustering-based estimates. We find that a vast majority of the SMBHs are more massive than expected from the local – relation, with one-third of the sample by factors . The median mass ratio of the sample, , means that of the baryons in halos are locked up in SMBHs. The mass growth rates of our SMBHs amount to of the star formation rates (SFRs), or of the mean baryon accretion rates, of the hosting galaxies. A large fraction of the hosting galaxies are consistent with average galaxies in terms of SFR and perhaps of stellar mass and size. Our study indicates that the growth of SMBHs () in luminous QSOs greatly precedes that of hosting halos owing to efficient gas accretion even under normal star formation activities, although we cannot rule out the possibility that undetected SMBHs have local ratios. This preceding growth is in contrast to much milder evolution of the stellar-to-halo mass ratio.
1 Introduction
Observations have identified more than 200 supermassive black holes (SMBHs) shining as QSOs in the early universe before the end of cosmic reionization, or , with the most distant one being located at (Venemans et al. (2017)) and the most massive ones having order . How these SMBHs grow so massive in such early epochs remains a topic of debate. To resolve this, it is key to reveal what galaxies host these SMBHs, because SMBHs and galaxies are thought to co-evolve by affecting each other, as is inferred from various correlations between them seen locally (e.g., Kormendy & Ho (2013) for a review).
At high redshifts like , the parameters of hosting galaxies that are often examined are central velocity dispersion () and dynamical mass (), with the latter being a proxy of stellar mass (). The relations between these parameters and black hole mass () are then compared with the corresponding local relations for ellipticals and bulges. It has been found that the – relation at is not significantly different from the local one (e.g., Willott et al. (2017)). On the other hand, SMBHs appear to be overmassive compared with local counterparts with the same bulge mass (e.g., Decarli et al. (2018)), although faint QSOs are on the local relation (Izumi et al. (2018)). Note that these comparisons are not so straightforward because the stellar components of QSOs may not be bulge-like and may also be greatly contaminated by cold gas (e.g., Venemans et al. (2017), Feruglio et al. (2018)).
The relation between and the mass of hosting dark halos (; Ferrarese (2002)) provides different insights into co-evolution, by directly constraining the SMBH growth efficiency in halos. For example, let us assume two cases: (1) that stellar components and SMBHs grow at similarly high paces, or (2) that they grow at similarly low paces. Both cases give similar – relations, but the former predicts a higher – relation. Cold gas in a halo is used for both star formation and SMBH growth, with shares and consumption rates being controlled by various physical processes. The – relation at high redshifts may lead to the disentangling of some of these processes.
In this Letter, we derive the – relation for QSOs and compare it with the local relation. We also examine the efficiency of SMBH growth by comparing the growth rate with the star formation rate (SFR) of hosting galaxies and the baryon accretion rate (BAR) of hosting halos. We estimate from [C II]158m line widths, assuming that lines are broadened by disk rotation and that the rotation velocity is equal to the circular velocity of hosting halos. We show that this procedure appears to be valid, using lower- QSOs.
2 Sample and halo mass estimation
We use 49 QSOs with and data in the literature, where most of the data were taken with the Atacama Large Millimeter/submillimeter Array (ALMA) at a high spatial resolution. Among them, 20 have an measurement based on a broad emission line (Mg II in most cases), while the remaining 29 have only a minimum value calculated from the 1450Å luminosity () on the assumption of Eddington-limited accretion 111Objects with Mg II (or C IV)-based (): J00550146 (Willott et al. (2015)), J01002802 (Wang et al. (2016)), J01093047 (Venemans et al. (2016)), J02100456 (Willott et al. (2013)), PSOJ03603 (Bañados et al. (2015)), J03053150 (Venemans et al. (2016)), J10440125 (Wang et al. (2013)), J11200641 (Venemans et al. (2012)), J11485251 (Walter et al. (2009)), J13420928 (Venemans et al. (2017)), PSOJ32312 (Mazzucchelli et al. (2017)), J21001715, J22291457 (Willott et al. (2015)), J033829 (Mazzucchelli et al. (2017)), J23290301 (Willott et al. (2017)), J23483054 (Venemans et al. (2016)), PSOJ16713 (Venemans et al. (2015)), PSOJ23120 (Mazzucchelli et al. (2017)), J08590022 (Izumi et al. (2018)), J22160010 (Izumi et al. (2018))). Those without (): J01290035 (Wang et al. (2013)), J13190950 (Wang et al. (2013)), J20540005 (Wang et al. (2013)), VMOS2911 (Willott et al. (2017)), J23101855 (Wang et al. (2013)), J11520055 (Izumi et al. (2018)), J12020057 (Izumi et al. (2018)), and 22 objects given in Table 2 of Decarli et al. (2018) after excluding those without data and PSOJ23120.. The systematic uncertainty in broad line-based estimates is dex (e.g., Shen (2013) for a review of estimation). Shown in Figure 1 are the redshift and rest frame Å absolute magnitude () distributions of the 49 objects.

For each object, we calculate the rotation velocity as following Wang et al. (2013), assuming that the [C II] line is broadened solely by disk rotation. Here, is the inclination angle of the disk, with and being the minor and major axes, respectively, of the deconvolved [C II] image. We set (average value for randomly inclined disks) when data are unavailable (e.g., Willott et al. (2017))222The average value of the objects with data is .. We then assume that is equal to the circular velocity of the hosting dark matter halo, , and convert into using the spherical collapse model (equation [25] of Barkana & Loeb (2001)).
This procedure to derive from contains several assumptions that cannot be completely verified by current data. One is that [C II] emitting regions are rotating disks. A velocity gradient has been found for several QSOs (e.g., Wang et al. (2013),Willott et al. (2013)). With high-resolution ALMA data, Shao et al. (2017) have derived a rotation curve of the QSO ULAS J13190950 that is flat at kpc radii. This object is included in our sample, and we find that the calculated agrees with the flat rotation velocity. On the other hand, Venemans et al. (2016) have ruled out a flat rotation for QSO J03053150. In any case, the number of QSOs with high-quality [C II] data is still very limited. We note that if we assume that [C II] line widths are solely due to random motion and if velocity dispersion is converted into by , we obtain lower and hence lower because of . As found in Section 3, adopting lower values enlarges the offset of our QSOs from the local – relation.
Another key assumption that cannot be tested is . While local spiral galaxies have –, it is not clear whether high- QSO host galaxies have also similarly high ratios; if they have such high ratios, our procedure will be overestimating by a factor of ––. On the other hand, Chen & Gnedin (2018) have shown by imposing that the duty cycle defined as the ratio of the number density of QSOs to that of hosting dark halos has to be less than unity.
We cannot thoroughly verify the assumptions one by one, so we indirectly test our procedure as a whole by comparing derived from our procedure with those based on clustering analysis at high redshifts. We do so at as there is no clustering study at . The best sample for this test is Trainor & Steidel (2012)’s sample, for which both a clustering-based estimate and FWHM data are available. Trainor & Steidel (2012) have obtained a median halo mass of 15 QSOs at to be from cross-correlation with galaxies around them. Among them, 12 have CO(32) velocity-width measurements by Hill et al. (2019) 333Since CO and [C II] lines trace different regions of a galaxy, we check if they give similar FWHM values, using eight objects from our sample with CO(65) FWHM measurements. We find that is smaller than on average, but this difference is not statistically significant when the errors in both measurements are considered. (The mean relative errors in and are and , respectively.). We apply our procedure to nine of the 12 objects (after excluding three with a complex line profile), finding – with a median of . This median value is consistent with that from the clustering analysis within the error in the latter. See Table 1 for a summary of the comparison.
As an additional but less stringent test, we compare of QSOs at with clustering results at similar redshifts. Here, is the lowest redshift at which the C II line is accessible from the ground, and roughly corresponds to the maximum redshift where clustering data are available. We use nine QSOs with data (Wagg et al. (2010),Wagg et al. (2012), Trakhtenbrot et al. (2017)), and find that their masses are in the range with the median . This mass range is comparable to estimates for a large number of – QSOs from correlation analysis, – (Shen et al. (2009), He et al. (2018), Timlin et al. (2018); Table 1). We regard this rough agreement as modest support for our procedure, because the range of the QSOs is broad and because FWHM-based and clustering-based masses are compared for different samples.
| [] | [] | ||
|---|---|---|---|
| Clustering | FWHM | ||
| – | a) | [–] | |
| – | – | – | … |
| – | … | [–] | |
Notes. Underscored numbers mean the median value, while others correspond to the full range over the sample. The of the sample are based on broad emission lines, while those of the other samples are calculated from on the assumption of the Eddington-limited accretion. References. Trainor & Steidel (2012), He et al. (2018), Shen et al. (2009), Timlin et al. (2018), Wagg et al. (2010), Wagg et al. (2012), Trakhtenbrot et al. (2017).
These comparisons indicate that this procedure can be used as a rough estimator of at least in the statistical sense, although the evaluation of its uncertainty is limited by that in Trainor & Steidel (2012)’s mass estimate. Our procedure gives a 0.4 dex higher median mass than that of Trainor & Steidel (2012). However, because this difference is within the error in their estimate, dex, we do not correct our procedure for this possible systematic overestimation. The comparison also indicates that the underestimation by this procedure, if any, appears modest, dex. Our main result that the SMBHs in QSOs have higher than local values is robust, because this result holds as long as the systematic underestimation of is dex.
The values of our QSOs thus obtained are less than except for two objects. The median of the entire sample is , with a central range of –. These relatively low masses are consistent with the halo mass distribution of QSOs constrained from the statistics of companion galaxies by Willott et al. (2005).
3 Results and Discussion
3.1 Mass vs. mass
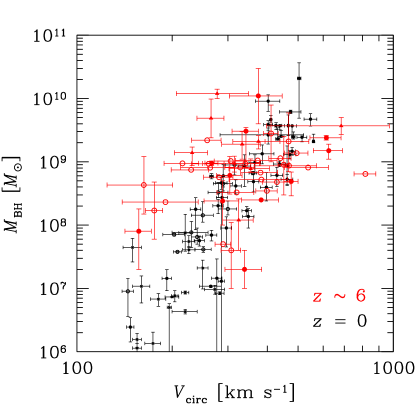
Figure 2 shows against for the 49 QSOs, together with local galaxies taken from Kormendy & Ho (2013) for which we convert central velocity dispersions into using the formula given in Pizzella et al. (2005). The very weak correlation seen in the sample is partly due to large intrinsic errors in both and . If the observed values are taken at face value, about two-thirds of the QSOs are consistent with the distribution of local galaxies, while the remaining one-third have higher .
Figure 3 plots versus . In contrast to Figure 2, most of the QSOs deviate from the local relation (Ferrarese (2002)) toward higher , or lower . This is because at a fixed decreases with redshift as . Most of the QSOs have a times more massive SMBH than local counterparts with the same , with one-third by factor . Thus, at the growth of SMBHs precedes that of hosting halos at least for most luminous QSOs. This is in contrast to a roughly redshift-independent – relation of average galaxies (e.g., Behroozi et al. (2018)).
The overmassive trend observed here may be due to selection effects because the sample is biased for luminous QSOs (e.g., Schulze and Wisotzki (2014)). We cannot rule out the possibility that SMBHs at are in fact distributed around the local relation with a large scatter and that we are just observing its upper envelope truncated at beyond which objects are too rare to find because of an exponentially declining halo mass function (for the halo mass function, see, e.g., Murray et al. (2013)). The results obtained in this study apply only to luminous QSOs detectable with current surveys.
The median ratio of the entire sample is with a central tile of –. Even when limited to the objects with relatively reliable and data shown by red filled circles, we find a large scatter in at a fixed , suggesting a wide spread in SMBH growth efficiency. We calculate the fraction of baryons in the hosting dark halo that are locked up in the SMBH, as , where is the total mass of baryons in a halo. Our sample has a median of , with some well above .
In Figure 3(b), QSOs with brighter magnitudes tend to have higher ratios. This trend appears to be reasonable because at a given , those with a higher can be brighter because the Eddington luminosity is proportional to . Note that some of the faint objects also have very high ratios, far above the local values.
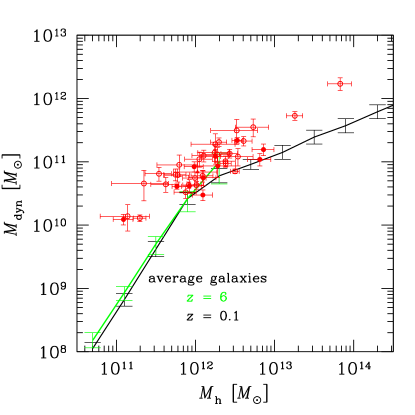
We compare with for 41 objects with size data in Figure 4444We use , with (Willott et al. (2015)). In this definition of , vs. is essentially equivalent to vs. if ., finding a nearly linear correlation with a median ratio of (central : ). Although our objects are distributed nearly a factor of two above the relation of average galaxies (Behroozi et al., 2018), the difference is probably insignificant when various uncertainties in these quantities are considered. For example, may be significantly contaminated by molecular gas mass as reported for some QSOs (e.g., Venemans et al. (2017), Feruglio et al. (2018)).
We also compare the [C II] emission radii of our objects with the virial radii () of the hosting halos ( where is the gravitational constant), finding a median ratio of 0.04 (central : ). This result appears to be consistent with rest-ultraviolet (UV) effective radius-to- ratios, typically , obtained for galaxies (Kawamata et al. (2018)), suggesting that galaxies hosting QSOs do not have extreme sizes.
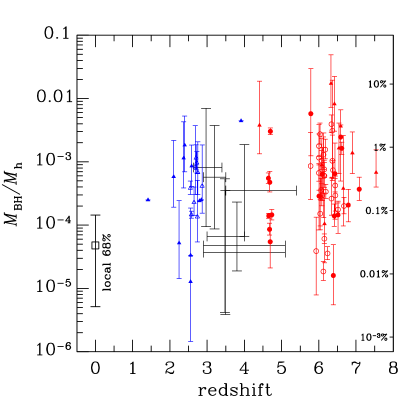
Figure 5 shows as a function of for our sample and several supplementary QSO samples at lower redshifts (whose UV magnitudes are distributed in the range ). This figure indicates that luminous QSOs at tend to have overmassive SMBHs irrespective of redshift. We also see a rough agreement of between the clustering-based and FWHM-based results. Note that the lower- QSOs plotted here are unlikely to be descendants of the QSOs because QSOs’ lifetimes, typically yr (e.g., Martini (2004)), are much shorter than the time intervals between and these lower redshifts.
3.2 Growth rate vs. growth rate
We then compare the mass growth rate of SMBHs with the SFR and the mean BAR of hosting halos (BAR); we use BAR because halos at a fixed can take a wide range of BAR values (e.g., Fakhouri et al. (2010)) and we cannot tell what value each of our objects actually has. For this comparison, we only use 18 objects with broad line-based data and infrared (IR) luminosity data555Fifteen objects from Decarli et al. (2018), two from Izumi et al. (2018), and one (J21001715) from Walter et al. (2018). In the calculation of IR luminosities, a dust temperature of K and a dust emissivity power-law spectral index of have been assumed except for J21001715 for which Walter et al. (2018) have obtained K.. SMBH mass growth rates (black hole accretion rates: BHARs) are calculated from as BHAR , where (fixed) is the mass-energy conversion efficiency, and is the bolometric luminosity estimated using the formula: (Venemans et al. (2016)). SFRs are obtained from IR luminosities using Kennicutt & Evans (2012)’s conversion formula: SFR. Mean BARs BAR are calculated using the formula given in Fakhouri et al. (2010). Fakhouri et al. (2010) have obtained at a given and a given from the mean growth of over a small time step calculated from main branches of merger trees constructed from the Millennium and Millennium II -body simulations.
Figure 6(a) plots BHAR against BAR. With a large scatter, our QSOs have high BHARBAR ratios with a median of . Yang et al. (2018) present time-averaged BHARs as a function of over using the X-ray luminosity function down to erg s-1 combined with the stellar mass function and the – relation. Their study covers , including 2 dex fainter objects than our sample, which is in the range . In their BHAR calculation, all galaxies at given are considered. Their results give much lower BHARBAR– for – roughly independent of redshift. If we assume that counterparts to their galaxies also have similarly low time-averaged BHAR/BAR values, then it is implied that the SMBHs of our QSOs are growing times more efficiently than of average galaxies, maybe being in one of many short growth phases as suggested by Novak et al. (2011).
In Figure 6(b), BHAR correlates with SFR relatively well with a typical ratio of BHAR/SFR , although the correlation may be artificial due to selection effects (Venemans et al. (2018)). This ratio is close to those from the average relation of bright QSOs at by Wang et al. (2011) (dotted line), but higher than the of local galaxies. Hence, such high ratios should last only for a short period of cosmic time.
Figure 6(c) is a plot of SFR versus BAR, showing that our QSOs are distributed around the average relation of galaxies (e.g., Behroozi et al. (2013), Harikane et al. (2018)), or SFR BAR, but with a very large scatter. About an half of the objects are consistent with average galaxies. Objects far above the average relation may be starbursts due, e.g., to galaxy merging (when BAR also increases temporarily); the BHAR of these objects is as high as BAR.
Finally, we compare the specific growth rates of SMBHs, dark halos, and stellar components. The 18 SMBHs grow at – times of the Eddington limit accretion rate, with being comparable to or higher than the specific halo growth rate, BAR; the SMBHs are growing faster than the hosting halos on average. We also find the BHAR to be comparable to the specific SFR (SFR) but with a large scatter 666We have assumed that of baryons are in stars.. This means that for QSOs, SMBHs and stellar components grow at a similar pace on average, confirming the result obtained by Feruglio et al. (2018) using .
4 Concluding Remarks
We have estimated for QSOs from . This procedure appears to be valid as a rough estimator.
We have found that the SMBHs of luminous QSOs are greatly overmassive with respect to the local – relation. This is contrasted with a much milder evolution of the – relation of average galaxies over . We have also found that our SMBHs are growing at high paces, amounting to SFR, or BAR, and that the SFR of hosting galaxies is widely scattered around the SFR–BAR relation of average galaxies. A large fraction of the hosting galaxies appear to be consistent with average galaxies in terms of SFR, stellar mass, and size, although this result is relatively sensitive to the accuracy of estimates.
Our study indicates that at the growth of SMBHs in luminous QSOs greatly precedes that of hosting halos owing to efficient mass accretion under a wide range of star formation activities including normal star formation, although the existence of faint, undetected SMBHs consistent with the local – relation cannot be ruled out. These high mass growth paces can last for only a short period, in order to be consistent with the relatively low and values of local galaxies.
The trend that SMBHs at are overmassive vanishes if we are underestimating by factor 10. Although there is currently no hint of such underestimation, future tests of the procedure using high- [C II] data and clustering analysis will be useful. Simulation studies of the internal structure of high- galaxies may also be helpful777Lupi et al. (2019) have performed a very high-resolution simulation of a QSO and virtually measured its [C II] emission by mimicking ALMA observations. Applying our procedure to measured gives – depending on the degraded angular resolution, being consistent with the correct value, . Note also that the host galaxy has a rotating gas disk..
SMBH evolution has been implemented in many state-of-the-art galaxy formation models, while detailed comparison with our results is beyond the scope of this Letter. An increasing trend of with redshift is seen in the semi-analytical model by Shirakata et al. (2019) (H. Shirakata, private communication). Some hydrodynamical simulations show that halos can have an SMBH as massive as (e.g., Costa et al. (2014), Tenneti et al. (2019)), but based on only several examples. Our results can be used to calibrate the efficiency of SMBH growth in the early cosmic epoch.
References
- Bañados et al. (2015) Bañados, E., Decarli, R., Walter, F., et al. 2015, ApJ, 805, L8
- Barkana & Loeb (2001) Barkana, R., & Loeb, A. 2001, Phys.Rep., 349, 125
- Behroozi et al. (2013) Behroozi, P. S., Wechsler, R. H., & Conroy, C. 2013, ApJ, 770, 57
- Behroozi et al. (2018) Behroozi, P. S., Wechsler, R. H., Hearin, A. P., Conroy, C. 2018, MNRAS, submitted (ArXiv:1806.07893)
- Chen & Gnedin (2018) Chen, H, & Gnedin, N. Y. 2018, ApJ, 868, 126
- Coppin et al. (2008) Coppin, K. E. K., et al. 2008, MNRAS, 389, 45
- Costa et al. (2014) Costa, T., Sijacki, D., Trenti, M., Haehnelt, M. G. 2014, MNRAS, 439, 2146
- Decarli et al. (2018) Decarli, R., Walter, F., Venemans, B. P., et al. 2018, ApJ, 854, 97
- Fakhouri et al. (2010) Fakhouri, O., Ma, C-P., Boylan-Kolchin, M. 2010, MNRAS, 406, 2267
- Ferrarese (2002) Ferrarese, L. 2002, ApJ, 578, 90
- Feruglio et al. (2018) Feruglio, C., Fiore, F., Carniani, S., et al. 2018, A&A, 619, A39
- Harikane et al. (2018) Harikane, Y., Ouchi, M., Ono, Y., et al. 2018, PASJ, 70, S11
- He et al. (2018) He, W., Akiyama, M., Bosch, J., et al. 2018, PASJ, 70, S33
- Hill et al. (2019) Hill, R., Chapman, S. C., Scott, D., et al. 2019, MNRAS, 433, xxx (arXiv:1810.10655)
- Izumi et al. (2018) Izumi, T., Onoue, M., Shirakata, H., et al. 2018, PASJ, 70, 36
- Kawamata et al. (2018) Kawamata, R., Ishigaki, M., Shimasaku, K., Oguri, M., Ouchi, M., Tanigawa, S. 2018, ApJ, 855, 4
- Kennicutt & Evans (2012) Kennicutt, R. C., & Evans, N. J. 2012, ARA&A, 50, 531
- Kormendy & Ho (2013) Kormendy, J., & Ho, L. C. 2013, ARA&A, 51, 511
- Lupi et al. (2019) Lupi, A., Volonteri, M., Decarli, R., Bovino, S., Silk, J., Bergeron, J. 2019, MNRAS, submitted
- Martini (2004) Martini, P. 2004, in Coevolution of Black Holes and Galaxies, ed. L. C. Ho (Cambridge: Cambridge Univ. Press), 169
- Mazzucchelli et al. (2017) Mazzucchelli, C., Bañados, E., Venemans, B. P., et al. 2017, ApJ, 849, 91
- Murray et al. (2013) Murray, S. G.., Power, C., Robotham, A. S. G. 2013, Astronomy and Computing, 3, 23
- Novak et al. (2011) Novak, G. S., Ostriker, J. P., Ciotti, L. 2011, ApJ, 737, 26
- Pizzella et al. (2005) Pizzella, A., Corsini, E. M., Dalla Bontà, E., Sarzi, M., Coccato, L., Bertola F. 2005, ApJ, 631, 785
- Schulze and Wisotzki (2014) Schulze, A., Wisotzki, L. 2014, MNRAS, 438, 3422
- Shao et al. (2017) Shao, Y., Wang, R., Jones, G. C., et al. 2017, ApJ, 845, 138
- Shen (2013) Shen, Y. 2009, Bulletin of the Astronomical Society of India, 41, 61
- Shen et al. (2009) Shen, Y., Strauss, M. A., Ross, N. P., et al. 2009, ApJ, 697, 1656
- Shields et al. (2006) Shields, G. A., Menezes, K. L., Massart, C. A., Vanden Bout, P. 2006, ApJ, 641, 683
- Shirakata et al. (2019) Shirakata, H., Okamoto, T., Kawaguchi, T., et al. 2019, MNRAS, 482, 4846
- Tenneti et al. (2019) Tenneti, A., Wilkins, S. M., Matteo, T. Di., Croft, R. A. C., Feng, Y. 2019, MNRAS, 483, 1388
- Timlin et al. (2018) Timlin, J. D., Ross, N. P., Richards, G. T., et al. 2018, ApJ, 859, 20
- Trainor & Steidel (2012) Trainor, R. F., & Steidel, C. C. 2012, ApJ, 752, 39
- Trakhtenbrot et al. (2017) Trakhtenbrot, B., Lira, P., Netzer, H., Cicone, C., Maiolino, R., & Shemmer, O. 2017, ApJ, 836, 8
- Venemans et al. (2012) Venemans, B. P., McMahon, R. G., Walter, F., et al. 2012, ApJ, 751, L25
- Venemans et al. (2015) Venemans, B. P., Bañados, E., Decarli, R., et al. 2015, ApJ, 801, L11
- Venemans et al. (2016) Venemans, B. P., Walter, F., Zschaechner, L., et al. 2016, ApJ, 816, 37
- Venemans et al. (2017) Venemans, B. P., Walter, F., Decarli, R., et al. 2017, ApJ, 851, L8
- Venemans et al. (2018) Venemans, B. P., Decarli, R., et al. 2018, ApJ, 866, 159
- Wagg et al. (2010) Wagg, J., Carilli, C. L., Wilner, D. J., et al. 2010, A&A, 519, L1
- Wagg et al. (2012) Wagg, J., Wiklind, T., Carilli, C. L., et al. 2012, ApJ, 752, L30
- Walter et al. (2009) Walter, F., Riechers, D., Cox, P., Neri, R., Carilli, C., Bertoldi, F., Weiss, A., Maiolino, R. 2009, Nature, 457, 699
- Walter et al. (2018) Walter, F., Riechers, D., Novak, M., et al. 2018, ApJ, 869, L22
- Wang et al. (2011) Wang, R., Wagg, J., Carilli, C. L., et al. 2011, AJ, 142, 101
- Wang et al. (2013) Wang, R., Wagg, J., Carilli, C. L., et al. 2013, ApJ, 773, 44
- Wang et al. (2016) Wang, R., Wu, X.-B., Neri, R., et al. 2016, ApJ, 830, 53
- Willott et al. (2005) Willott, C. J., Percival, W. J., McLure, R. J., et al. 2005, ApJ, 626, 657
- Willott et al. (2013) Willott, C. J., Omont, A., & Bergeron, J. 2013, ApJ, 770, 13
- Willott et al. (2015) Willott, C. J., Omont, A., & Bergeron, J. 2015, ApJ, 801, 123
- Willott et al. (2017) Willott, C. J., Bergeron, J., & Omont, A. 2017, ApJ, 850, 108
- Yang et al. (2018) Yang, G., Brandt, W. N., Vito, F., et al. 2018, MNRAS, 475, 1887