Rapid “Turn-on” of type 1 AGN in a quiescent early type galaxy SDSS1115+0544
Abstract
We present a detailed study of a transient in the center of SDSS1115+0544 based on the extensive UV, optical, mid-IR light curves (LC) and spectra over 1200 days. The host galaxy is a quiescent early type galaxy at = 0.0899 with a blackhole mass of . The transient underwent a 2.5 magnitude brightening over days, reaching a peak -band luminosity (extinction corrected) of magnitude, then fading 0.5 magnitude over 200 days, settling into a plateau of days. Following the optical brightening are the significant mid-IR flares at and m, with a peak time delay of days. The mid-IR LCs are explained as the echo of UV photons by a dust medium with a radius of cm, consistent with of 0.58 inferred from the spectra. This event is very energetic with an extinction corrected erg s-1. Optical spectra over 400 days in the plateau phase revealed newly formed broad H emission with a FWHM of km s-1 and narrow coronal lines such as [Fe VII], [Ne V]. This flare also has a steeply rising UV continuum, detected by multi-epoch Swift data at to days post optical peak. The broad Balmer lines and the UV continuum do not show significant temporal variations. The slow evolving LCs over 1200 days, the constant Balmer lines and UV continuum at late-times rule out TDE and SN IIn as the physical model for this event. We propose that this event is a “turn-on” AGN, transitioning from a quiescent state to a type 1 AGN with a sub-Eddington accretion rate of /yr. This change occurred on a very short time scale of days. The discovery of such a rapid “turn-on” AGN poses challenges to accretion disk theories and may indicate such event is not extremely rare.
1. Introduction
In the past decade, time domain astronomy has made big strides forward with the advent of several wide area transient surveys, including the Panoramic Survey Telescope & Rapid Response System (Pan-STARRS; Kaiser et al., 2002), the Palomar Transient Factory (PTF; Law et al., 2009; Rau et al., 2009), and the Catalina Real-Time Transient Survey (CRTS; Drake et al., 2009), All-Sky Automated Survey for Supernovae (ASASSN) 111http://www.astronomy.ohio-state.edu/assassin/index.shtml, The Asteroid Terrestrial-impact Last Alert System (ATLAS; Tonry et al., 2018) , and the most recently, Zwicky Transient Facility (ZTF; Graham et al. in prep, Bellm et al. in prep). One particular area of the recent advances is transients detected in the centers of galaxies, especially quiescent galaxies where no previous nuclear activities were detected. This type of transients includes both Tidal Disruption Events (TDEs) and Changing-Look AGNs (CLAGNs). The first phenomenon is the optical/UV flares generated by the disruption of a star when it gets too close to the central blackhole and was theoretically predicted in 1980s (Hills, 1976; Rees, 1988; Phinney, 1989). The second type, CLAGNs, is due to the change of AGN accretion rates. The changing states include transformation from quiescent, non-accreting blackholes to active accreting type 1 or 2 AGNs (e.g. Gezari et al., 2017), or spectral change between a type 2 and a type 1 AGN (e.g Ruan et al., 2016; Runnoe et al., 2016), or periodic photometric variations (several years time scale) in some AGNs (Oknyanskij, 1978; Oknyanskij & Lyuty, 2007; Graham et al., 2015; Jun et al., 2015; Bon et al., 2016). Both TDEs and CLAGNs have become the focus of many recent studies (Gezari et al., 2012; Yang et al., 2013; MacLeod et al., 2016; Ruan et al., 2016; Runnoe et al., 2016; Gezari et al., 2017; Yang et al., 2017; Arcavi et al., 2014; Holoien et al., 2014, 2016; Blagorodnova et al., 2017a; Oknyansky et al., 2019). As the referee of this paper pointed out, spectral variations on time scales of years have been observed amongst nearby AGNs (e.g NGC4151, NGC3516) since 1960s (Andrillat, 1968; Tohline & Osterbrock, 1976; Lyutyj et al., 1984; Penston & Perez, 1984). The renewed interests may lead us to deeper understanding this subject since we are now supplemented with more statistics and better data from large transient surveys.
Photometric surveys cannot immediately distinguish these two types of transients without additional follow-up spectroscopy. This explains the recent surge of studies of CLAGNs, some are by-products from searches for TDEs. Observational separations of TDEs and CLAGNs are not always clear (e.g. Blanchard et al., 2017) due to the similar fundamental physics governing both types of sources. This confusion is also due to the small numbers of TDEs and CLAGNs discovered so far. The increasing sample sizes in the future should help us build more complete empirical characterizations, thus also a coherent picture of accretion physics explaining both types of flaring events.
After a half dozen of optical/UV TDEs were discovered, it became apparent that the host galaxies of TDEs are one specific type – post-starburst galaxies with characteristic spectral features of E + A galaxies (Arcavi et al., 2014; French et al., 2016). A hotly debated question is whether this is intrinsic or due to the TDE selection bias in the optical/UV wavelength. One way to address this question is to examine if using infrared variability could be an effective means to identify TDE candidates because it is less biased against dusty star forming galaxies. This motivated us to carry out a systematic search for mid-infrared flare sources using the data taken by the Wide-field Infrared Space Explorer (Wright et al., 2010) from 2009 to 2017. The detailed description of this search is prepared in a separate publication (Jiang et al. in prep). Here we summarize briefly the sample. First, we impose four limits on our search – (1) we focus only on the SDSS galaxies which have spectroscopic data. This gives us the critical information on the pre-flare properties of the host galaxies. (2) we limit our search to . This condition is very conservative, and can be easily extended in future studies. (3) we only select sources whose mid-IR flares are still recent, i.e. their light curves (LC) are either still rising or have just turned over the peak, but not yet reached completely quiescent levels. This criterion is chosen to give us sufficient time to take follow-up spectra. (4) we focus only on variations on time scales 2 weeks. Therefore, we can coadd the single frame photometries taken within one week time span, thus reducing the photometric errors. All single frame source photometry is made available by the WISE and NEOWISE-R (Mainzer et al., 2014) surveys through the IRSA data archive222https://irsa.ipac.caltech.edu/cgi-bin/Gator/nph-scanmission=irsa&submit=Select&projshort=WISE. We found a total of 28 galaxies with mid-IR flares with a magnitude change 0.5 magnitude (Vega). As shown in the histogram of WISE magnitude variation in Figure 1 of Stern et al. (2018), such a brightness change is significant, indicative of intrinsic physical variation. The sample light curves and the selection details are presented in Jiang et al. (in prep).
This paper is dedicated to a single object SDSS J111536.57+054449.7 (hereafter SDSS1115+0544), which has a rich suite of data, including optical and mid-IR light curves, a spectral sequence over a time scale year, and new Swift observations. As our analyses show below, this object may represent a class of early type galaxies, rapidly transforming from quiescent states over only a few hundred days to actively accreting type 1 AGNs. We demonstrate that there are some ambiguities between this type of transients and peculiar type II supernovae, and larger samples of such events over several years would help to firmly establish the classification criteria.
2. The quiescent state of the host galaxy
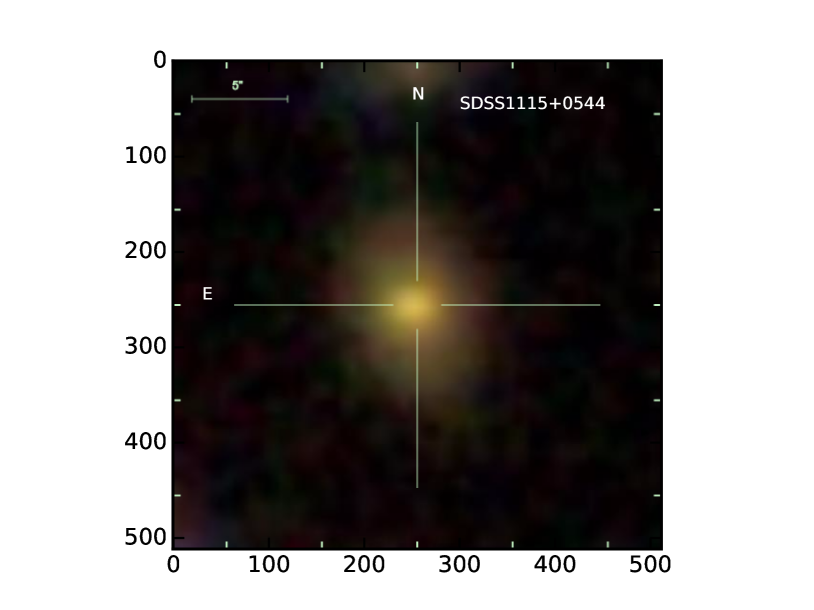
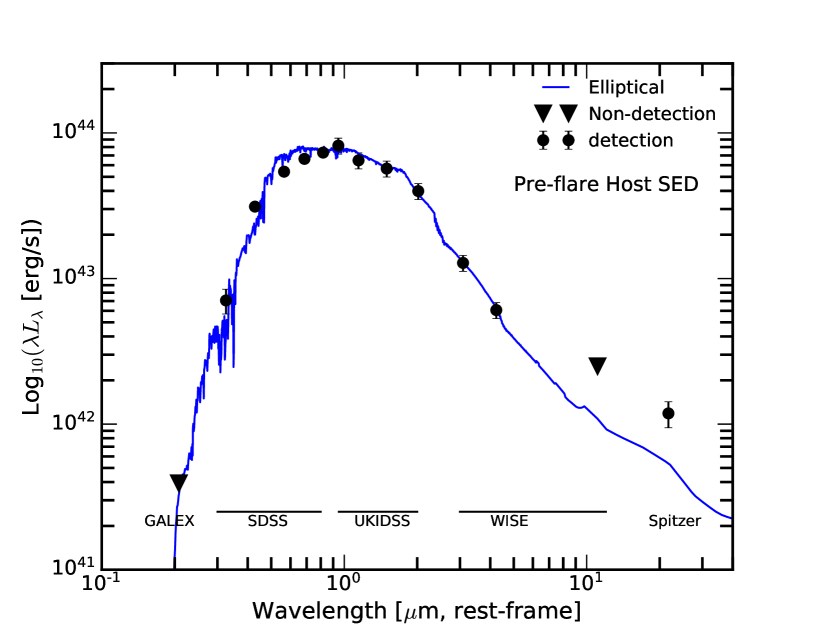
SDSS115+0544 has the sky position of RA = 11:15:36.57 and DEC = 05:44:49.73 Equinox J2000.0 and at redshift of 0.08995. Before SDSS1115+0544 displayed optical and infrared flare in 2015, its quiescent state has multi-band photometry in (SDSS), (UKIDSS), and 3.4 (), 4.6 (), 12 (, not detected) and 12m (, not detected) (ALLWISE) and 24m (Spitzer). SDSS1115+0544 is a fairly bright, bulge dominated galaxy with & magnitude of 17.96 and 17.06 mag (AB) respectively. Its pre-flare, panchromatic photometry is shown in the bottom panel of Figure 1, and at the optical/near-IR wavelength, is well fit by the spectral energy distribution (SED) template of an elliptical galaxy (Polletta et al., 2007). In its quiescent state, the host galaxy was not detected in the near-UV (2267Å) by GALEX ( mag), in the WISE W3 and W4 bands, and in the FIRST 20cm survey ( = 0.15 mJy).
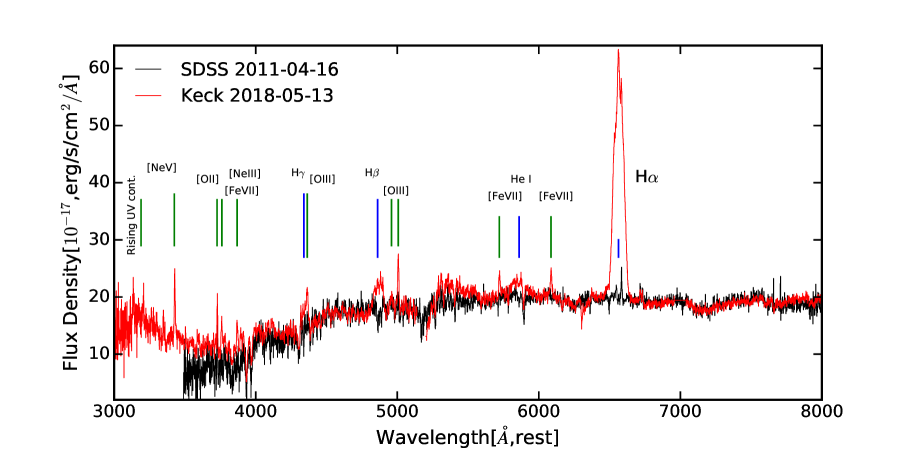
The pre-flare SDSS spectrum is shown in Figure 2, characteristic of a passive evolving early type galaxy, with strong absorption lines such as Ca H+K, Ca I, Mg I 5175Å from a dominant old stellar population. The spectral models from the SDSS DR14 show that this galaxy has no current star formation activity. However, SDSS1115+0544 is detected by Spitzer at 24m in 2006 and 2007. The dust obscured star formation rate (SFR) could be as much as /yr based on the calibration relation (Calzetti, 2013). In comparison with the Milky Way /yr (Robitaille & Whitney, 2010), SDSS1115+0544 has a lower star formation rate.
The SDSS DR14 archive lists several derived parameters based on absorption lines, specifically, the velocity dispersion is km s-1 (Wisconsin method, Maraston models) and the stellar mass = based on the Portsmouth method (passive model). Assuming the M relation of (McConnell & Ma, 2013), we infer the blackhole mass of .
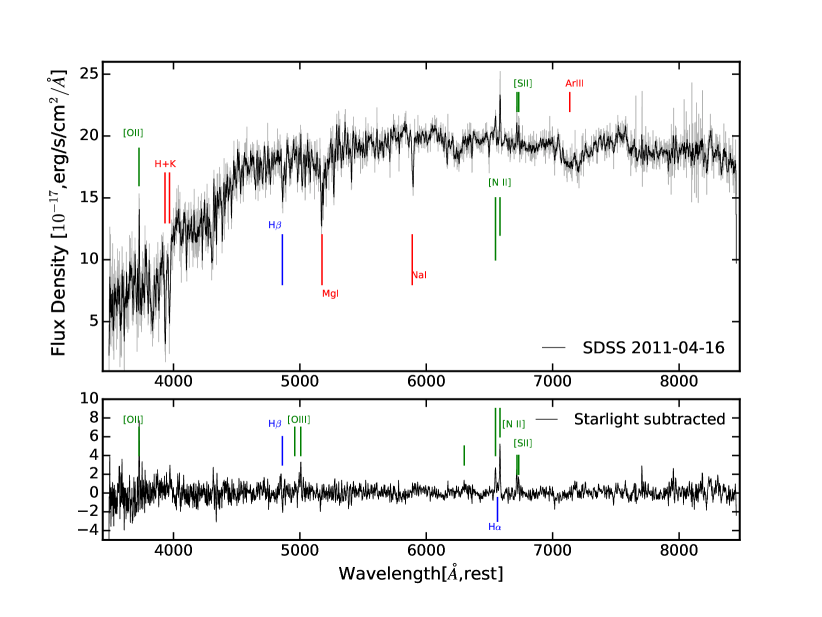
Besides absorption lines, SDSS115+0544 also displays weak nebular emission lines. To measure the reliable emission line ratios, we subtract the synthetic star light spectrum, made by the FIREFLY models for the eBOSS spectra (SDSS DR14) (Figure 2) (Comparat et al., 2017) 333https://www.sdss.org/dr14/spectro/eboss-firefly-value-added-catalog/. The star light subtracted spectrum reveals [O III] 4959,5007Å and [N II] 6548,6583Å doublets, but very little H and H, yielding line ratios of and . For comparison, star forming galaxies generally have , and strong AGNs have . SDSS1115+0544 falls within the lower-right region of the diagram, i.e. Baldwin, Phillips & Telervich (BPT) diagram. Kauffmann & Heckman (2005) classification of LINERs have and . The very weak H and H lines and the corresponding line ratios indicate that SDSS1115+0544 is aligned with the definition of a Low Ionization Nuclear Emission Line Region (LINER), based on the diagnostics by Kewley et al. (2006); Cid Fernandes et al. (2010). The SDSS DR14 archive also classified this object as a LINER.
The physical nature of the emission lines from a LINER is still a subject of debate. Some LINERs are thought to be weak AGNs. However, some emission lines in some LINERs are thought to be mainly produced by evolved stars during a short but very energetic post-AGB phase, as shown by a study of integral field spectroscopy of nearby LINERs (Singh et al., 2013). We will discuss the implications of the transient flare in a LINER in § 6.
3. Transient Observations in SDSS1115+0544
3.1. Light Curves
SDSS1115+0544 has optical light curve from CRTS (Drake et al., 2009), between January 2006 to May 2017. The photometry comes from both the 1.5 meter Mt. Lemmon Survey telescope and the 0.7 meter Catalina Sky Survey telescope. We perform image subtraction analyses using the custom software, Fpipe (Fremling et al., 2016). The reference images are constructed using the CRTS images taken during the quiescent phase (before 2015). The transient photometry is measured by PSF fitting and calibrated on to the standard Johnson-Cousins -band using SDSS photometry of the stars within the same images. Our optical photometry is in AB magnitude.
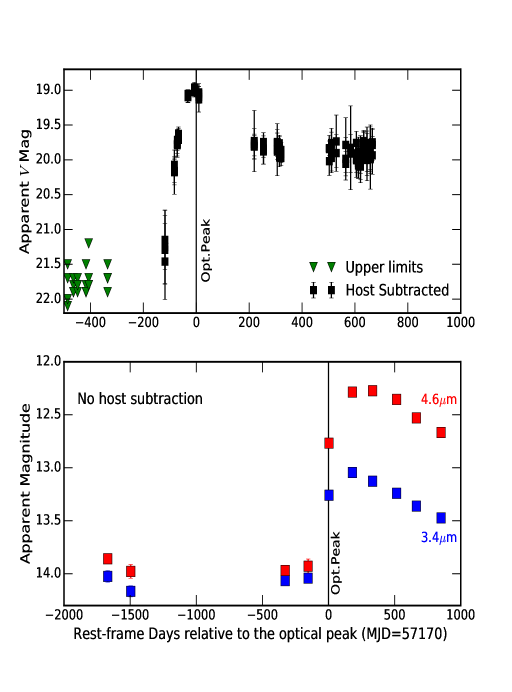
The mid-infrared photometry is from WISE (Wright et al., 2010) and NEOWISE (Mainzer et al., 2014) catalogs, covering a time span of 2010 to 2018. There’s a gap between 2011 and 2013 because the WISE space telescope was placed in hibernation after the exhaustion of its cryogen at the end of the primary mission. Except this gap, the WISE has visited SDSSJ1115+0544 at W1 (m) and W2 (m) every half year, with single exposures from each visit. We simply retrieved the W1 and W2 PSF profile-fit magnitudes from the catalogs, assuming that SDSS1115+0544 is a point-like source in the WISE images. We have searched the catalogs and there are no photometric contaminations from other sources within of our target. Data with poor quality frame (), charged particle hits (), scattered moon light () and artifacts () are rejected. The MIR photometry for SDSSJ1115+0544 is distributed over 10 epochs with intervals of six months. No reliable short time scale variability is detected within each individual epoch and thus we have binned the data every half year and computed the median values following our previous work (Jiang et al., 2016, 2017). The magnitudes in the first four epochs show little change. However, the fifth epoch presents a sudden brightening of 0.5 magnitudes in both bands (Figure 3). The light curves reach their peak at the sixth epoch and then decline. The mean magnitudes of the first four epochs are and magnitude at m and m respectively. The color in the quiescent state is 0.173, 0.8 magnitude, above which is the selection for mid-IR AGNs (Stern et al., 2012; Yan et al., 2013). This suggests that SDSS1115+0544 is a normal, non-AGN host in its quiescent state. We note here that mid-IR magnitudes are all in Vega system as provided by the WISE archive.
Figure 3 displays the optical (top) and mid-IR LCs (bottom) covering a time range of 12000 days. Here the apparent magnitudes are used to illustrate the brightness changes in the observed frame. The photometric flare in SDSS1115+0544 is significant and well captured by the CRTS and WISE observations.
Additional photometric data is from the Swift, including both UV Optical Telescope (UVOT) and X-ray Telescope (XRT). SDSS1115+0544 is not detected in the UV by GALEX before the flare, and after the 2015 flare, it is significantly detected by Swift. The three epochs of Swift UV photometry were obtained on UT 2017-07-02, 2017-07-13 and 2017-12-26, see Table Rapid “Turn-on” of type 1 AGN in a quiescent early type galaxy SDSS1115+0544 for the details, which are at the tail end of optical and mid-IR flares. The data were reduced using the standard software tool, uvotimsum, provided by High Energy Astrophysics Software (HEASoft) from NASA Goddard Space Flight Center (NGFS). The photometry is measured using a radius aperture, which is corrected out to in radius for the total flux. The Swift XRT data was taken on the same three dates, and no detections were found at the position of SDSS1115+0544. Coadding all of the XRT data with a total of 4.27 kseconds, we derived a upper limit of erg s-1 cm-2 in the Swift X-ray band.
3.2. Spectroscopy
The earliest spectrum is from Sloan Digital Sky Survey (SDSS) taken in UT 2011-04-16. After discovering the strong mid-infrared flare in early 2017, we began our spectroscopic monitoring through UT 2018-05-13. The optical spectra were taken with both the Double Spectrograph (DBSP, Oke & Gunn, 1983) mounted on the Hale 200 inch telescope at Palomar Observatory as well as the Low Resolution Imager and Spectrograph (LRIS, Oke et al., 1995) on the Keck 10 meter telescope. These observations were taken under various different conditions, thus extra cares are taken when we compare line fluxes from different epochs as in § 4.2.
The DBSP observations used the D550 dichroic which splits the incoming light at 5500Å into the blue and red beam for two different grism/grating. The pixel scales are and per pixel for the red and blue CCD respectively. The slit width of either or was used depending on the seeing condition. All of the DBSP spectra were reduced using a python script written by Eric Bellm (University of Washington) and Kevin Burdge (Caltech). The spectra are flux calibrated using standard star observations from the same night. The Keck LRIS spectroscopy used the D560 dichroic in combination with the blue grism of 600 line per mm & blazed at 4000 Å and the red grating of 400 line per mm blazed at 8500 Å. The long slit has a width of 1′′. This setup achieved a spectral resolution of Å for the full wavelength range of Å. The observation was taken under excellent weather, with seeing of and clear photometric conditions. The LRIS data was reduced by co-author Daniel Stern using his well tested pipeline from previous studies. Table Rapid “Turn-on” of type 1 AGN in a quiescent early type galaxy SDSS1115+0544 shows the technical details of these observations.
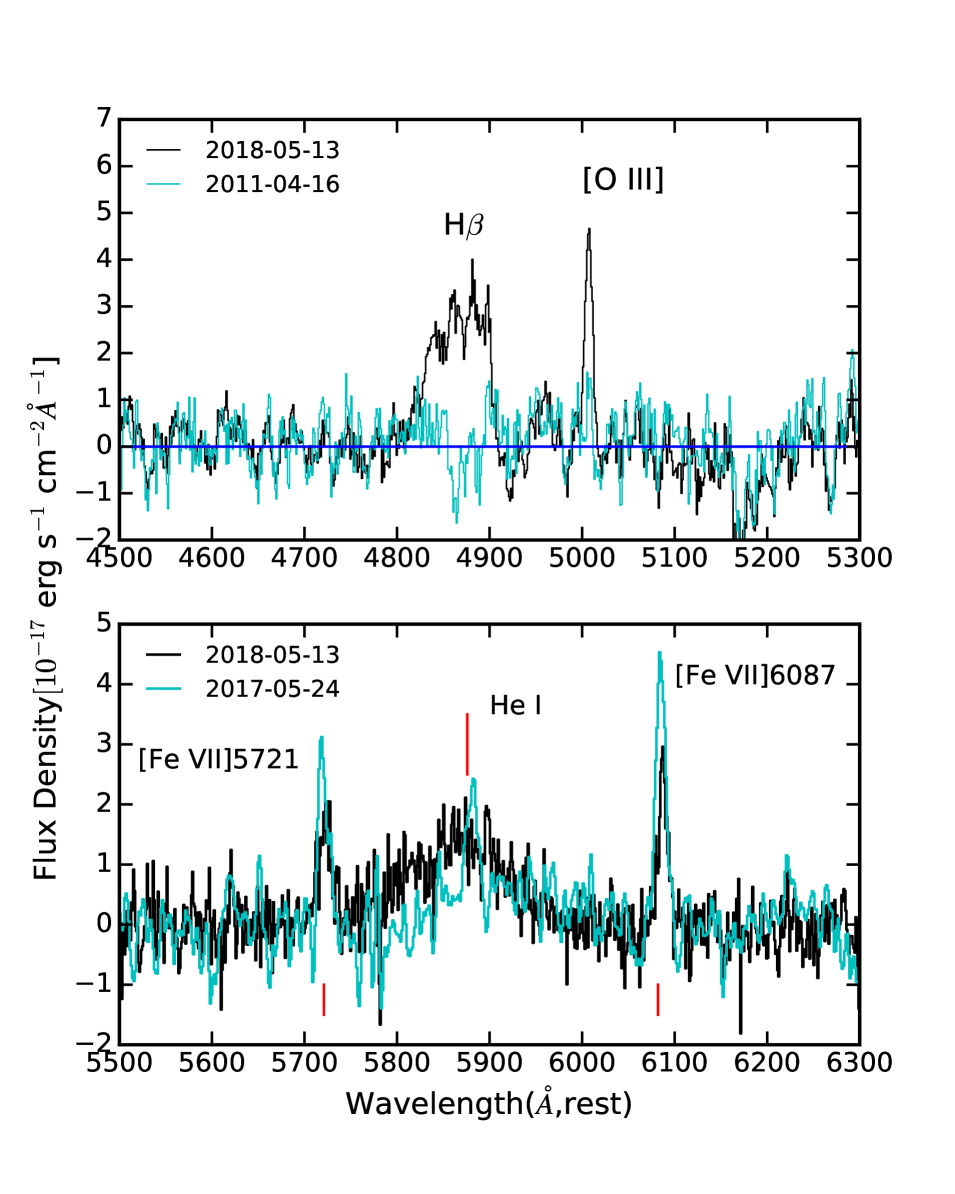
Figure 4 compares the pre-flare (UT 2011-04-16 SDSS) and post-flare (UT 2018-05-13 LRIS) optical spectra, revealing striking newly formed features, including the rising UV continuum, prominent broad H emission lines as well as high ionization metal emission lines. The post-flare Keck spectrum is available for download as ascii tables as the part of this paper. See full discussions in § 4.2.
4. Analyses and Results
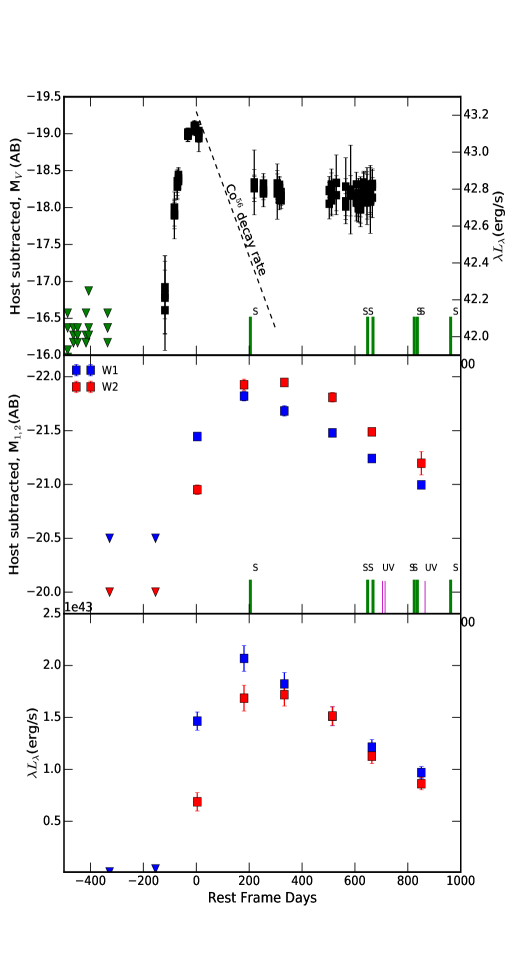
We convert the temporal variations in apparent brightness (Figure 3) to host-subtracted absolute magnitudes and monochromatic luminosity . The results are shown in Figure 5. For both optical and mid-IR, the host-subtracted light curves are available for download in ascii tables. We release the apparent magnitudes as functions of time with the explanatory information included in the headers of the ascii tables. The absolute magnitudes are calculated from , where = 414 Mpc is the co-moving luminosity distance and is the K-correction. At , is relatively small ( magitude) (e.g. Hogg et al., 2002), and ignored by our analysis since our mid-IR flares are not measured from image subtractions, thus the systematic uncertainties in the MIR light curves could be as large as 0.05 magnitude. Mid-IR Vega magnitudes are converted to AB system to be consistent with that of optical LC. The transformation between = 444http://wise2.ipac.caltech.edu/docs/release/allsky/expsup/. The conversion factor in is large, which explains why the flare has smaller color in AB magnitude than in the Vega system.
In addition, the apparent magnitudes are converted into flux densities in erg s-1 cm-2 Å-1 using the zero points tabulated in the WISE Explanatory Supplement. The mid-IR photometry at the first four epochs does not vary and the galaxy is in the quiescent state (Figure 3). The mean magnitudes of these four epochs are taken to represent the host galaxy emission at the level of = 14.075 and =13.934 mag respectively. These host emissions are removed to produce the host-subtracted light curves. The three panels in Figure 5 illustrate several important results, which are discussed in the following subsections.
4.1. Mid-Infrared Time Lag
The mid-Infrared flare is clearly delayed by about days () relative to the optical flare (peak-to-peak). Independent of the physical processes of the central UV/optical flare, the mid-Infrared LCs are likely the product of the dust echo of the UV/optical flares. The basic idea is that UV/optical photons travel a distance , and get absorbed by the dust grains, which in turn re-radiate the excess energy in the infrared. Roughly speaking, the time delay is , where is the speed of light. days implies that the dusty medium is at a distance of cm from the UV/optical source. For comparison, the dust sublimation radius is , with the size of dust grain and the grain sublimation temperature (Barvainis, 1987). With the extinction corrected erg s-1 (see § 4.3), and assuming graphite dust grains (their K and ), we have the sublimation radius = 0.13 pc = cm, which is comparable to the radius of the dust shell computed from the time lag between the optical and mid-IR LCs.
The optical and mid-IR LCs also constrain the geometry, orientation and thickness of the dusty gas. For example, the fact that optical and UV flare signals are observed can rule out the spherical dust distribution with high filling factors (or high optical depths). Detailed modelings of the LC shape can constrain the physical parameters of the dusty medium. One simple example is the tilted dust ring which is inferred from the mid-IR flare in IRAS F010042237 (Dou et al., 2017). For our sample of mid-IR flares, the LC modeling is planned for a separate paper (Wang et al. in prep).
4.2. Dramatic spectral changes
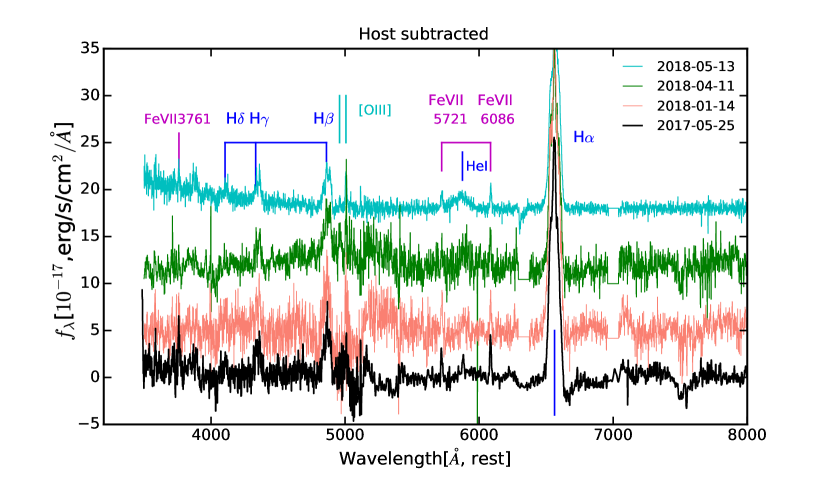
A rich set of new spectral features emerged in the post-flare optical spectra (Figure 4). This includes strong & broad H, H and He I 5875 Å, steeply rising UV continuum (Å), narrow metal lines, and most interestingly [Fe VII] coronal lines. Inspection of the 2-dimensional spectra found that H is from the central spatially unresolved region. This rules out supernova exploded at a distance from the center (angular size distance of 2.5 kpc).
Six optical spectra were obtained between UT 2017-05-24 and 2018-05-13 (Table Rapid “Turn-on” of type 1 AGN in a quiescent early type galaxy SDSS1115+0544). The P200 spectra were extracted using an aperture of , roughly times of the typical seeing. This is large enough to capture most of the line emission from the central point source. For comparison, the Petrosian radius containing 50% of the total flux is for the host galaxy SDSS1115+0544. Each flux calibrated spectrum is matched to the SDSS spectral continuum and Ca H+K absorption features to produce the host galaxy subtracted, flare spectrum. Figure 6 displays the host subtracted spectra from four different epochs. Broadly speaking, these flare spectra do not show prominent variation during one year period from . The last epochal spectrum was taken with LRIS on the Keck under extremely good condition, with clear sky and seeing. The Keck spectrum was extracted with a ( seeing) aperture, capturing most of the H emission from the central unresolved region, with the total line flux of erg s-1 cm-2, thus = erg s-1.
All emission line measurements are made with the host subtracted spectra. Table Rapid “Turn-on” of type 1 AGN in a quiescent early type galaxy SDSS1115+0544 tabulates the line wavelengths, integrated fluxes and line widths (FWHM) measured from the Keck spectrum (UT 2018-05-13).
4.2.1 High dust content and the inferred
In its quiescent state, SDSS1115+0544 was detected by Spitzer at 24m, with the flux in access to the SED of a pure early type galaxy, as shown in Figure 1. This mid-infrared excess suggest that the galaxy contains a substantial amount of warm dust.
The UV/optical flare ionized neutral hydrogen, producing Balmer recombination lines. In the Keck spectrum, the H-to-H line ratio is 5.45, significantly larger than 3.1, a value commonly found for blue AGNs (Dong et al., 2008). We adopt the relation derived by Caplan & Deharveng (1986), = , where H/H is the line flux ratio, is the electron temperature in units of K. The standard extinction curve with (Table 7.1 Osterbrock & Ferland, 2006) gives . Combining these two equations, we derive = 0.58 and = 1.8 magnitude. The extinction corrected -band peak luminosity is erg s-1, making it comparable to that of most luminous supernovae and TDEs.
Dust absorption can also explain the Swift X-ray non-detections. The flux limit is erg s-1 cm-2 at the 90% confidence, corresponding to the luminosity limit of erg s-1. A previous study of a sample of 63 AGNs (Gelbord et al., 2009) has found that the soft X-ray luminosity is correlated with the coronal line luminosity, with = . This sets the expected intrinsic soft X-ray luminosity to erg s-1, which is higher than the Swift non-detection limit by a factor of . Non-detection in X-ray can be explained if the expected intrinsic soft X-ray flux is absorbed by a gas column density of cm-2.
4.2.2 Temporal behavior – constant broad H line and variable narrow [O III] 5007 & [Fe VII] 6086Å lines
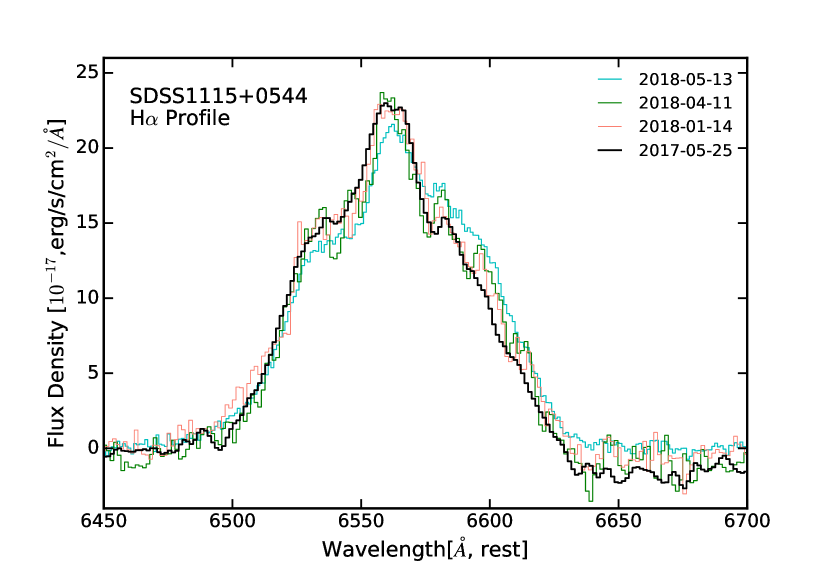
We measured the broad H line fluxes using the four epochal P200 spectra, and do not find significant temporal variations, with the line fluxes in a narrow range, erg s-1 for UT 2018-04-11, 2018-01-14, 2017-11-24, and 2017-05-24 respectively. These values are similar to the integrated flux measured from the Keck spectrum as well. In addition, SDSS1115+0544 was observed by LAMOST (spectral fiber diameter ) on UT 2016-01-06 (Yang et al., 2017). With the same method, we measured the H line flux of erg s-1. We infer erg s-1. The broad H FWHM has a velocity width of km s-1 after corrected for the instrumental resolution. Similar to the constant line flux, the line width does not change with time. He I 5876Å and H line widths are consistent with that of H.
Figure 8 compares the local continuum subtracted spectra around [O III] 5007 Å doublet and [Fe VII] 5721,6082 Å lines pre- and post-flare. It is clear that after the flare, [O III] 5007Å became stronger, with line flux roughly a factor of 2 higher than that of the SDSS spectrum from 2011. For DBSP spectra, [O III] 5007Å falls near the D550 dichroic beam splitter, thus no reliable information available. We interpret the line flux increase between these two epochs is due to the increase of the ionization continuum. [Fe VII] 5721 6087Å lines are detected at four different epochs. Using the same method, we measured = (5.8, 4.3, 4.1, 3.8) erg s-1 cm-2 at UT 2017-05-24, 2018-01-14, 2018-04-11, and 2018-05-13 respectively. We conclude that coronal line flux is decreasing with time. The [Fe VII] line flux changes in these four epochs echo the variation of the ionization continuum with time (optical LC) and show time delays in relation to the continuum changes because ionizing photons need time to travel the size of the narrow line regions. For details, see Section 4.2.3. As noted in many studies of local AGNs displaying temporal spectral variabilities (e.g. NGC548 and NGC4151) (Landt et al., 2015; Rose et al., 2015; Oknyansky et al., 2019), [Fe X] variability is usually associated with that of [Fe VII]. However, [Fe X] line is not detected in our data. Detailed discussion on various coronal lines are in § 5.3.
4.2.3 Sizes, gas density and temperature of the broad and narrow line emitting regions
Regardless what physical processes are producing the flare, several properties of the broad and narrow line emitting regions can be inferred from time lags between continuum and spectral lines, and line ratio diagnostics.
The energetic UV/optical flare is likely to drive kinematic motions. The broad Balmer emission lines probably come from photo-ionized gas clumps moving at a velocity of km s-1. We can estimate the size of broad line region (BLR) using , here is time and is cloud velocity. If we take days, the time between the rise time of the optical flare and the first detection of H (LAMOST data), and assuming clouds moving at km s-1, we have a BLR radius of cm pc.
The size of the narrow line emitting region (NLR) can be estimated in two ways, using time lag and kinematics. The [O III] and [Fe VII] temporal behaviors can be understood in the context of the time variation of the ionizing continuum. The post-flare [O III] 5007 Å line flux is higher than pre-flare because more ionized O+4 ions are produced by the UV/optical flare photons. For a NLR with a radius of , the UV ionizing photons will take = to travel from the center to the line emitting ions. Therefore, there is a time delay of between the productions of UV ionizing photons and narrow emission lines. The [Fe VII] line fluxes are stronger at UT 2017-05-24 than UT 2018-05-13. This is due to higher ionizing UV continuum at the LC peak, between May 2015 and May 2016, prior to the -band LC plateau. The UV ionizing continuum responsible for the 2018-05-13 [Fe VII] emission is likely from the time when the LC has faded, reaching to the plateau in 2017. Our data can only give an approximate limit on 770 days. The narrow region has a size cm pc.
Another way to estimate the NLR size is to use the measured [Fe VII] line width. From the Keck spectrum on 2018-05-13, the [Fe VII] 6087Å FWHM is Å (rest-frame), which translates to a velocity of km s-1. Taking into account of the LRIS-R spectral resolution = 6.9Å, we have the intrinsic line velocity width = 703 km s-1. Assuming this line width is due to narrow line emitting gas moving in the gravitational potential of a blackhole, we have = = cm. These two crude estimates are roughly consistent, and the NLR is more than an order of magnitude larger than the BLR.
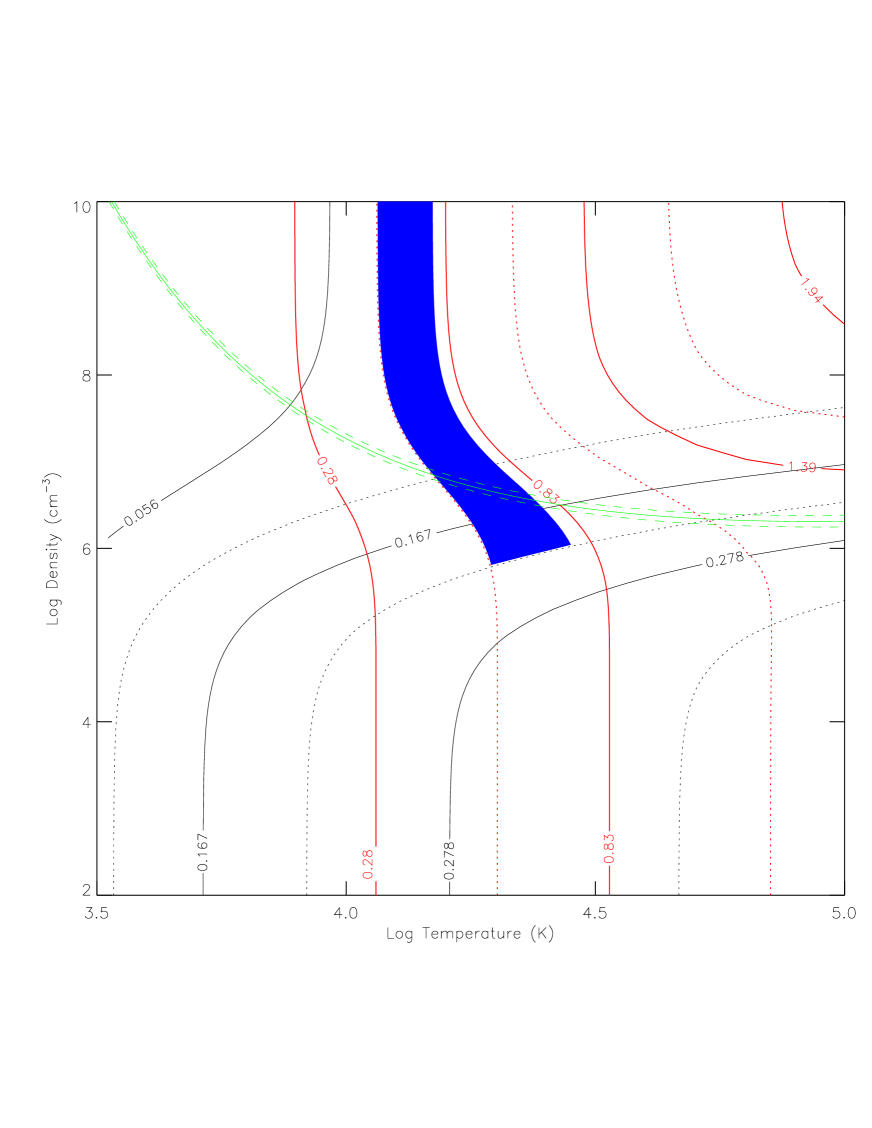
Regardless of the physical nature of the flare, the observed line ratios from [Fe VII] & [O III] can be used to constrain the gas density and temperature, as described in standard text books (e.g Osterbrock & Ferland (2006)). These line ratios are computed for a grid of density and temperature. Figure 9 shows the [Fe VII] 3760/[Fe VII] 6087 ratio in red lines (dashed line for the averaged value between the two solid lines), [Fe VII] 5160/[Fe VII] 6087 in black, and [O III] 4959+5007/[O III] 4636 in green. The solid blue area marks the region which is consistent with the observed coronal line ratios of = , 0.22 ( 0.8 erg s-1 cm-2), and = . The and values are constraint by the intersection between the green line and the solid blue area, with cm-3 and K. The derived values suggest that the narrow line emitting gas is photo-ionized by the UV/optical flare.
Noteworthy is that these density and temperature values are consistent with what have been derived for coronal line AGNs (Rose et al., 2015) as well as post-shocked CSM in type IIn SN, e.g. SN 2010jl and SN 2006jd (Fransson et al., 2014; Stritzinger et al., 2012). We discuss this ambiguity further in the section below.
4.3. The flare SED from UV to mid-IR and its energetics
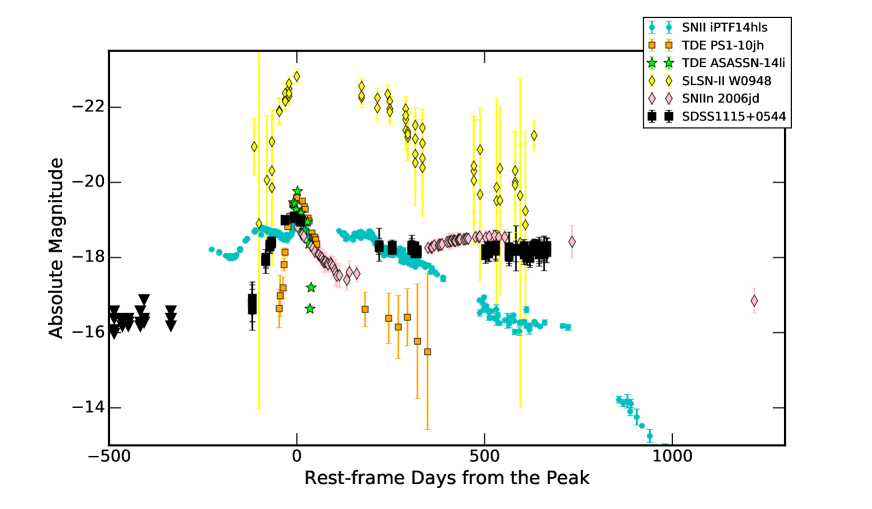
The observed -band peak luminosity is mag ( = erg s-1). With , the extinction corrected optical peak luminosity is magnitude (AB). This value is comparable to that of most luminous SN IIn and TDEs (see Figure 10). The host subtracted, peak mid-IR luminosity is mag (AB) at and m (Figure 5), very energetic and consistent with having large dust extinction. This is much higher than the peak infrared luminosities of many normal, nearby supernovae ( to , AB), compiled by SPitzer InfraRed Intensive Transients Survey (SPIRITS) (Kasliwal et al., 2017; Tinyanont et al., 2016; Fox et al., 2016). However, two mid-IR luminous supernovae indeed exist. They are SDWFS-MT-1, a self-obscured supernova at with (Kozłowski et al., 2010) and SN2003ma, an unusual SN IIn in a dense CSM (Rest et al., 2011). Thus, the optical and mid-IR peak luminosities alone can not discriminate the three possible physical models between SN IIn, TDE and “turn-on” AGN.
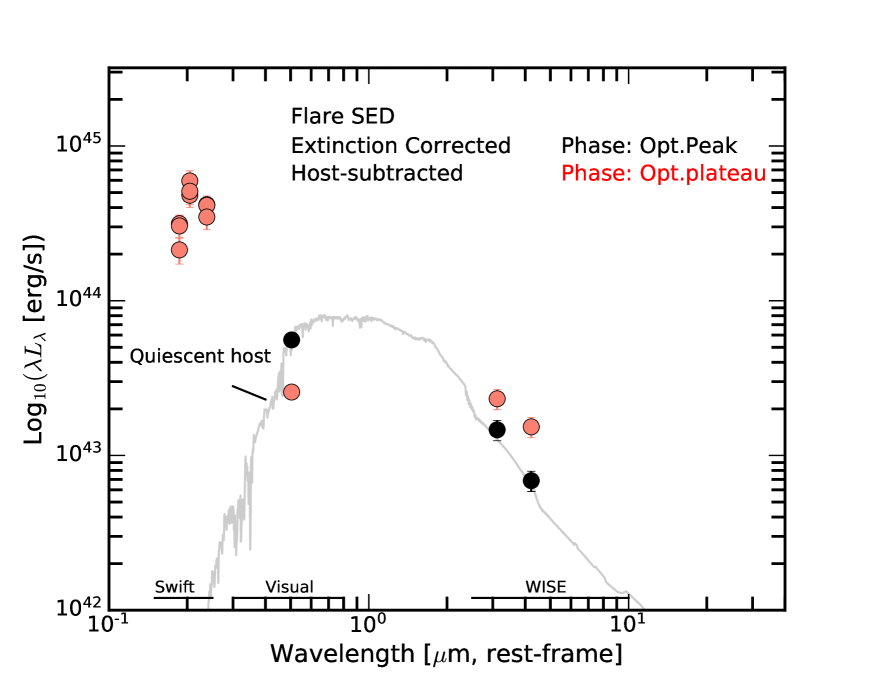
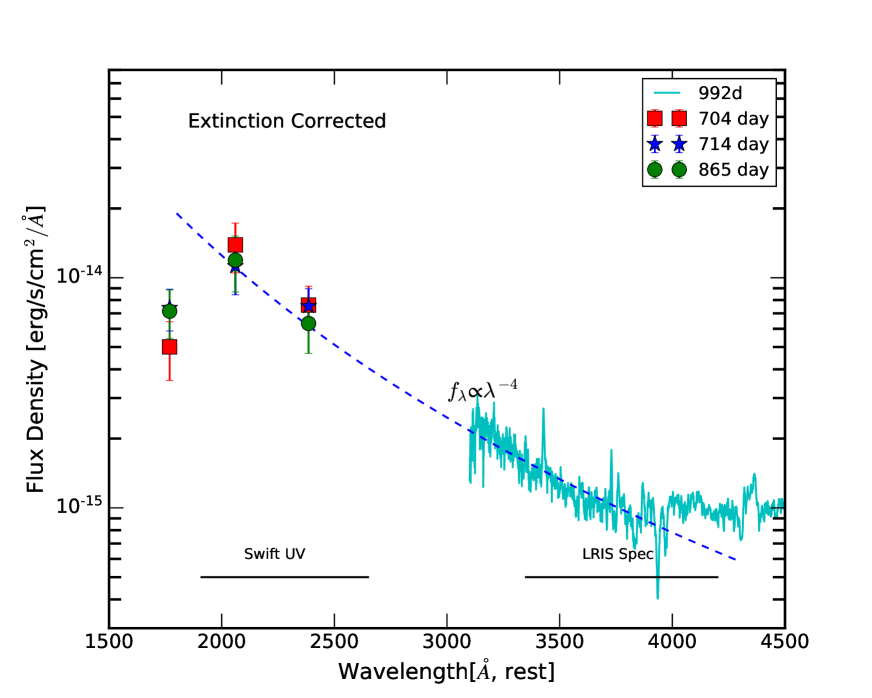
The Swift UV data were taken after the optical peak date of UT 2015-05-28 (MJD = 57071) and at UT 2017-07-02, 2017-07-13, and 2017-12-25. The UV fluxes do not show significant time variation (see Table Rapid “Turn-on” of type 1 AGN in a quiescent early type galaxy SDSS1115+0544). The extinction corrected flare SED is shown in Figure 11 as from UV, optical to mid-IR for two different phases. The pink symbols correspond to the mid-IR peak phase while the optical LC is at the plateau (Figure 5), and the black symbols are for the earlier, optical peak phase, when the mid-IR LCs are just starting to rise.
The striking feature of the flare SED is its steep rising SED out to the UV wavelength. Clearly the bulk of the intrinsic energy from the flare event is coming out at the UV. Although the observed UV luminosity integrated from 1928Å (UVW2) to 2600Å (UVW1) is only erg s-1, the extinction corrected is high, erg s-1. Integrated over the flare SED, we infer the extinction corrected, pseudo-bolometric luminosity from the UV to infrared is erg s-1, comparable to that of most luminous SN IIn and TDEs.
5. Discussion: How to distinquish a SN IIn, a TDE and a “turn-on” AGN?
Possible physical explanation for the SDSS1115+0544 flare is one of the three scenarios – an unusual type II SN, a TDE or a “turn-on” AGN from a quiescent state. Identification of the true nature of such a flare can be ambiguous if the available observations are not sufficient. Here we make extensive comparative studies and highlight the observed properties which have and do not have discriminative powers.
5.1. Light Curve comparisons with TDE and type II SN
Optical light curves of most normal SNe have rise time scales (from explosion to peak) roughly days, with Superluminous Supernovae (SLSN) being the slowest (Yan et al., 2015, 2017; De Cia et al., 2018). Normal SNe fade away over time scales of days. SDSS1115+0544 clearly evolves on much longer time scales, with a bright & 600 day plateau. SN II P have post-peak plateaus, but only lasting 100 days or less, then fade rapidly (Rubin et al., 2016). SDSS1115+0544 is clearly not a normal type II SN.
However, there are unusual type II (or IIn) SNe, which evolve slowly and their ejecta interact with dense circumstellar medium (CSM). Some examples are iPTF14hls, a type II core collapse SN (Arcavi et al., 2017), SN 2006jd, an extremely well studied SN IIn (Stritzinger et al., 2012) and WISEA J094806.56+031801.7 (W0948+0318), a possible H-rich SLSN-II in a mid-IR selected AGN (Assef et al., 2018). Figure 10 compares their LCs with that of SDSS1115+0544 over a time span of 1500 days. Noteworthy is that the post-peak LC of SN 2006jd (pink diamond) has the most striking similarity to that of SDSS1115+0544 (black square). Comparisons with the LCs of TDEs are also displayed in Figure 10, including two archetypal UV/optical discovered TDEs, ASASSN-14li and PS1-10jh (Brown et al., 2017; Gezari et al., 2012).
From a pure energetics point of view, the peak luminosity and total radiated energy from the SDSS1115+0544 flare have little discriminative power among the three possible physical models, and are all consistent with what have been previously observed. The strongest argument against SDSS1115+0544 being a TDE is its long time scales, for both light curve and spectral line evolution. Slow rise-time of 120 days and light curve plateau lasting over 600 days have not been seen among any confirmed TDEs so far. However, some TDE light curves seem to show flattening, but only in UV bands, e.g. AT2018zr (PS16kh), ASASSN-14li (Holoien et al., 2018; van Velzen et al., 2018; Brown et al., 2017). And their time scales are a factor of 5 or 10 shorter. The constant H emission over one year is also unlike any known TDEs. Larger and more complete TDE samples from future transient surveys, such as ZTF, may find slow evolving TDEs. We conclude that the SDSS1115+0544 is probably not a typical TDE and its slow evolving LC by itself cannot rule out the possibility of being an unusual type II SN.
In the context of SN IIn versus TDE, we note relevant points. One is that the empirical characteristics of TDEs are not yet completely known. For example, not well studied flare events include partial destruction of a star or stripping of stars (Campana et al., 2015), and events occurred in AGN host galaxies where larger accretion disks already exists prior to the disruption events (Ivanov et al., 2018; Blanchard et al., 2017). On the nuclear supernovae, they do explode near the centers of galaxies. Villarroel et al. (2017) examined the large sample of SNe discovered by PTF since 2009, and found 16 core-collapse supernovae within the projected distances kpc from the centers of the host type-2 AGNs at . Their results suggest that we can not rule out SDSS1115+0544 being a supernova based on the physical location.
5.2. Broad Balmer and He I lines
Broad Balmer emission lines with velocity widths of km s-1 have been observed among type II SNe, AGNs and TDEs. Broad He I 5876 Å in the SDSS1115+0544 spectrum at +944 days was also seen in type IIn SN 2010jl at +461 days, and also in SN 2006jd at +1544 days (Fransson et al., 2014; Stritzinger et al., 2012), as well as in TDE iPTF16fnl (Blagorodnova et al., 2017b). Therefore, these lines and their velocity widths can not discriminate the possible three scenarios. However, the absence of variable narrow H line is the evidence against the type IIn SN hypothesis because it is the hallmark of the slow moving, dense CSM. However, like the LC morphology, this does not rule out that SDSS1115+0544 may be an unusual type II SN, like iPTF14hls and SN2003ma, where the narrow H line was absent or emerged only at day post-peak (Sollerman et al., 2018; Rest et al., 2011).
5.3. Coronal Fe lines
The formation of coronal [Fe VII] lines requires energetic ionizing photons with 100 eV and a sufficient amount of gas phase Fe atoms which are not locked up by dust grains 555In most galactic ISM, 99% of Fe element is in solid phase due to dust depletion (Savage & Sembach, 1996).. Independent of flare models, the detections of [Fe VII] lines suggest that SDSS1115+0544 must have had a soft X-ray outburst around the time of the -band flare and the coronal line emitting regions must be relatively dust free during the period between the onset of the flare in 2015 and the last optical spectrum in May 2018. The dust sublimation radius, the size computed from the mid-IR LC time lag, and the NLR size, are consistent, cm. This supports the story that coronal lines are from the inner, ionized gas.
The potential association between coronal lines and TDEs has been extensively studied by Komossa et al. (2008, 2009); Wang et al. (2011, 2012); Yang et al. (2013). These studies found several so called “Extreme Coronal Line Emitters” (ECLE), which are believed to be possible TDE candidates. Unusually strong [Fe X], [Fe XI], [Fe XIV] and [Fe VII] emission lines are found in their initial SDSS spectra, but disappeared in the follow-up spectra taken years later. Some of these ECLEs also have variable broad H and He II emission. The time scales of optical LC and spectral evolution for these ECLEs are not constraint because of poor cadence in their spectral observations. In SDSS1115+0544, only [Fe VII] 5721,6087Å were observed. [Fe X] would have been detected if it had the [Fe X]/[Fe VII] ratio (Wang et al., 2012).
Coronal lines have been observed for decades among type I and II AGNs (Appenzeller & Oestreicher, 1988; Korista & Ferland, 1989; Appenzeller & Wagner, 1991; Ferguson et al., 1997; Tran et al., 2000; Nagao et al., 2000; Gelbord et al., 2009; Landt et al., 2015; Oknyansky et al., 2019). The inner wall of the AGN dust torus is usually heavily irradiated, and just lie at the sublimation radius of the most refractive dust (Krolik & Kriss, 1995). From certain viewing angles, this photo-ionized gas can produce spectra with many coronal lines (Rose et al., 2015; Glidden et al., 2016). The [Fe VII] line luminosity from SDSS1115+0544 is comparable to that of Seyfert galaxies (Nagao et al., 2000; Gelbord et al., 2009), but its [Fe VII]/[O III] ratio of 0.4 is much higher than AGNs. This is similar to ECLEs, with unusually strong coronal lines relative to [O III] 5007Å doublet.
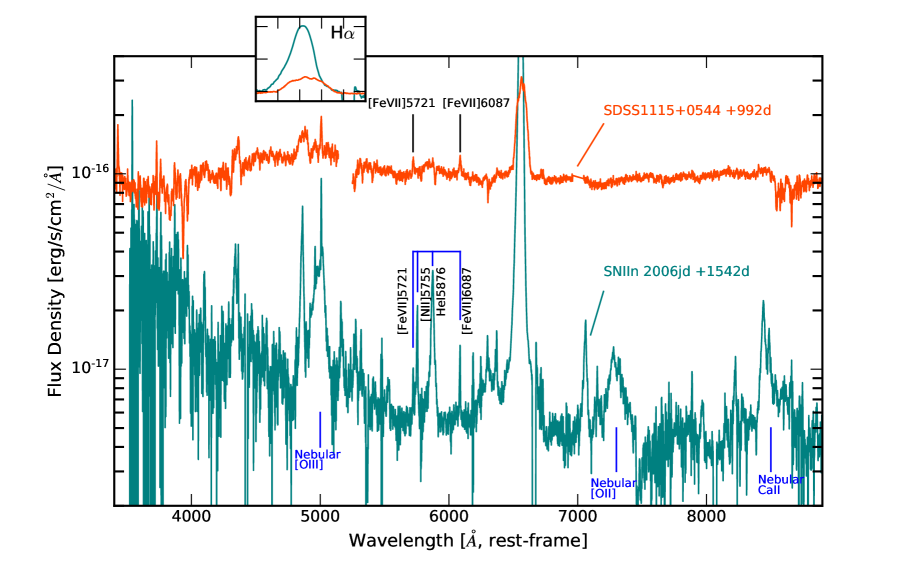
Finally, coronal lines have also been detected in type IIn SNe, especially ones with dense CSM and whose progenitor stars have experienced significant mass losses. Figure 12 compares the SDSS1115+0544 spectrum at +992 days with the late-time spectrum of SN IIn 2006jd (Stritzinger et al., 2012). Coronal Fe lines for SN2006jd only appear at several 100 days post-peak and become steadily the stronger (higher equivalent width) with time, particularly at +1544 days. This is mostly due to the declining of the continuum. Similar to AGNs, photoionization by X-rays from shocks is responsible for producing coronal emitting gas.
In conclusion, we find that high ionization coronal lines have no discriminative power among SN IIn, TDE and AGNs.
5.4. Evidence for “turn-on” AGN – constant UV emission and lack of O & Ca broad lines at late-times
The strongest evidence for a “turn-on” AGN model and against a type IIn SN or a TDE model is the strong, constant UV continuum emission at very late times. The host galaxy has no pre-flare UV emission, and the newly formed UV emission is associated with the flare event. Figure 13 shows the zoom-in portion of the intrinsic (dust extinction corrected) UV SED for the flare at the post-peak to days. The three Swift UV fluxes show little changes with time, and the UV spectral slope is extremely steep, with . UV emissions from supernova and TDE can be strong at early times and usually fade quickly with time. This observation supports the AGN scenario because the newly “turn-on” accretion disk can be an efficient source of UV emission.
One additional argument against SN IIn model is lack of broad emission lines from O and Ca elements in the +992 day Keck spectrum (Figure 12). Late-time variable O and Ca line emission are very common among SN IIn. The examples of slow evolving, unusual type II SNe, such as SN 2006jd, iPTF14hls, SN2010jl, SN2003ma and SN2005ip, all display changes in the continua and spectral features, with broad emission lines from H, O and Ca elements emerging at late phases.
In summary, the flare in SDSS1115+0544 is likely a “turn-on” AGN, changing from a quiescent galaxy to a type 1 AGN.
5.5. SDSS1115+0544 as a “turn-on” AGN: accretion rate change and space density
In this scenario, how much increase would be the blackhole accretion rate? Taking into account of dust extinction corrections to both optical and Swift UV fluxes, the bolometric luminosity for the flare is erg s-1. If this flare is due to matter being accreted onto the blackhole, we have = and the matter to radiative efficiency . This gives the change in accretion rate /yr. This is a reasonable value for AGNs.
In the standard picture of broad line regions around a blackhole, H line width is correlated with the central blackhole mass. We adopt the following relation established by Vestergaard & Peterson (2006), where With = 3271 km s-1 and the extinction corrected L = erg s-1 ( = 2.1 mag), the inferred is , confirming the value based on the SDSS velocity dispersion. Using and values, we estimate the Eddington ratio , indicating low accretion rate.
If SDSS1115+0544 is a “turn-on” AGN, how are its H and [O III] line luminosities compared with that of known AGNs and QSOs? For low type 1 AGN, its typical to ratio is at erg s-1, based on the correlation derived by Greene & Ho (2005), erg s-1, and the typical to ratio is 320 (Kauffmann & Heckman, 2005). At the plateau phase, SDSS1115+0544 flare has a -band luminosity (host-subtracted) of erg s-1, / of and / 588. This implies that SDSS1115+0544 flare has a typical as that of type 1 AGN, but its is too weak, erg s-1, just below the dividing line between weak and strong AGNs, as defined by SDSS AGN studies (Kauffmann & Heckman, 2005). Thus we conclude that similar to iPTF16bco, the NLR for SDSS1115+0544 is still developing, consistent with brightening of [O III] strength. Future optical spectra will further confirm this result.
In addition, SDSS1115+0544 optical LC suggests that its continuum has changed from quiescent to the peak of flaring in only 200 days. For a radiation-dominated, Shakura-Sunyaev disk, the viscous radial inflow time scale (Shakura & Sunyaev, 1973; LaMassa et al., 2015),
| (1) |
where is the Shakura & Sunyaev viscosity parameter, is the gravitational radius (). If , and are assumed to be 0.1, 0.1 and 50 (optical emission typically comes from ) respectively, the viscous inflow time scale at is 978 years, much longer than 200 days continuum “turn-on” time scale measured from the SDSS1115+0544 LC. This “viscosity crisis” has been noted, and is the focus of a recent paper by Lawrence (2018).
SDSS1115+0544 is a case of a quiescent LINER transitioning into an AGN in a short time scale year. It is the first rapid “turn-on” AGN with a well constraint rise time scale based on its extensive CRTS light curve. iPTF16bco is another such an event at (Gezari et al., 2017). Its quiescent host is also a LINER, and the transformation was characterized by optical flare (iPTF LC), increasing UV continuum emission and newly formed broad H emission, similar to that of SDSS1115+0544. It is attempting to speculate that the short “turn-on” time scales found in these two cases may be associated with LINERs where rapid accretion rate changes or disk instability may likely occur. However, better understanding requires more such events to be discovered by ongoing and future transient surveys.
AGNs have been known and studied more than a half-century. The actively accreting phase, i.e. AGN phase, is thought to last roughly a few times years (so called duty cycle) (Combes, 2000; Haehnelt & Rees, 1993). “Turn-on” AGNs like SDSS1115+0544 and iPTF16bco have a flare time scale of days. By scaling these two time scales, we infer that “turn-on” AGN is only of the parent AGN population. Counting low luminosity AGNs, the space density of Seyfert 1 is roughly Mpc-3 at low redshift (Osterbrock & Ferland, 2006). Thus, events like SDSS1115+0544 should have space density of Mpc-3. However, without any systematic searches, two rapid “turn-on” type 1 AGN/QSO have been found with the flaring peak time separated by only a year. This may indicate that our calculation could significantly under-estimate the true value. Perhaps the AGN duty cycle is not the proper time scale to use for this calculation. Because duty cycle of year only counts for the total time when AGN is active. This does not distinguish various flare episodes which will have a distribution of different time scales. Upcoming large transient surveys should produce actual measurements of this distribution.
6. Summary
SDSS1115+0544 is a transient first selected as a part of our systematic search for infrared flare galaxies within the SDSS area. The host galaxy is a quiescent, early type galaxy at with M, M, SFR24μm of /yr. Its SDSS optical spectrum has the characteristics of a LINER with a non-accreting blackhole and weak narrow forbidden emission lines. In Janurary 2015, SDSS1115+0544 underwent a strong optical flare, with a rise of 2.5 magnitude (-band) over days. Declining from the peak magnitude (host-subtracted) of After +200 days post-peak, its optical LC reached a prolonged plateau, 1.8 magnitude brighter than the quiescent level and lasting over 600 days. This optical flare was followed by mid-infrared flares at and m with amplitudes of magnitude over 600 days. The time lag between the infrared and optical peak is days. SDSS1115+0544 displayed excess UV continuum emission which were measured by Swift UV observations at three epochs, days post-peak (optical LC). This excess UV emission shows no temporal variation, likely to be on a plateau similar to the optical. A series of optical spectra of this flare event were obtained between 2016-01-06 and 2018-05-13. Compared to the SDSS spectrum taken in 2011, the new spectra taken after the optical flare show a rich suite of newly formed emission lines, including broad Balmer and helium lines with velocity widths km s-1, and narrow high ionization forbidden lines such as [Fe VII], [Ne V].
We made extensive comparisons of the SDSS1115+0544 properties with known TDEs and unusual type II SN. Although the newly formed coronal Fe lines link this event to Extreme Coronal Line Emitters (ECLE), the slow evolving optical LC over 1200 days and its non-variant broad Balmer lines at very late-times argue against SDSS1115+0544 flare being a typical UV/optically selected TDE. We find that LC energetics, morphology, time scale as well as spectral features, including broad Balmer emission and narrow coronal lines, can not serve as clear discriminants between “turn-on” AGN and an unusual type II SN. This highlights the ambiguity in identifications of many transients discovered in the nuclear regions of quiescent galaxies.
In the case of SDSS1115+0544, the strongest evidence against the scenario of unusual type II SNe is the strong UV continuum observed at to days without any temporal variations. In addition, our Keck spectrum at days does not show any broad O and Ca emission lines commonly seen in the late-time spectra of type II SN, as in examples of unusual type II SN SN2006jd, iPTF14hls, SN2005ip and SN2010jl. We conclude that the flare in SDSS1115+0544 is from a newly “turn-on” accretion disk around the supermassive blackhole, transforming the previously quiescent early type galaxy into a type 1 AGN, with a sub-Eddington accretion rate of 0.02/yr.
This newly “turn-on” accretion disk produces significantly soft X-ray and UV photons which are responsible for both continuum flare, the emergence of broad Balmer emission lines as well as narrow high ionization metal lines. The radiative feedback from the accretion can drive gas outflows, naturally producing a broad Balmer line emitting region with a size likely cm. SDSS1115+0544 contains a substantial dusty ISM, with a column density of cm-2 (). This dusty medium produces the infrared echos of the optical flare, generating the infrared variability. The time lag between the IR and optical LCs implies that the dusty ISM is about cm from the central accretion disk.
It is interesting to note that if the rise time scale determines the AGN “turn-on” time scale, it is very short for SDSS1115+0544, days from the well sampled CRTS LC. This discovery suggests that the changing state phenomenon among AGNs could be associated with violent instabilities in accretion disks occurring on time scales of a few 100 days. More events such as SDSS1115+0544 from future transient surveys should provide better constraints on the event rates as well as theoretical understanding of accretion disks around supermassive blackholes.
References
- Andrillat (1968) Andrillat, Y. 1968, AJ, 73, 862
- Appenzeller & Oestreicher (1988) Appenzeller, I., & Oestreicher, R. 1988, AJ, 95, 45
- Appenzeller & Wagner (1991) Appenzeller, I., & Wagner, S. J. 1991, A&A, 250, 57
- Arcavi et al. (2014) Arcavi, I., Gal-Yam, A., Sullivan, M., et al. 2014, ApJ, 793, 38
- Arcavi et al. (2017) Arcavi, I., Howell, D. A., Kasen, D., et al. 2017, Nature, 551, 210
- Assef et al. (2018) Assef, R. J., Prieto, J. L., Stern, D., et al. 2018, ArXiv e-prints, arXiv:1807.07985
- Barvainis (1987) Barvainis, R. 1987, ApJ, 320, 537
- Blagorodnova et al. (2017a) Blagorodnova, N., Gezari, S., Hung, T., et al. 2017a, ApJ, 844, 46
- Blagorodnova et al. (2017b) —. 2017b, ApJ, 844, 46
- Blanchard et al. (2017) Blanchard, P. K., Nicholl, M., Berger, E., et al. 2017, ApJ, 843, 106
- Bon et al. (2016) Bon, E., Zucker, S., Netzer, H., et al. 2016, ApJS, 225, 29
- Brown et al. (2017) Brown, J. S., Holoien, T. W.-S., Auchettl, K., et al. 2017, MNRAS, 466, 4904
- Calzetti (2013) Calzetti, D. 2013, Star Formation Rate Indicators, ed. J. Falcón-Barroso & J. H. Knapen, 419
- Campana et al. (2015) Campana, S., Mainetti, D., Colpi, M., et al. 2015, A&A, 581, A17
- Caplan & Deharveng (1986) Caplan, J., & Deharveng, L. 1986, A&A, 155, 297
- Cid Fernandes et al. (2010) Cid Fernandes, R., Stasińska, G., Schlickmann, M. S., et al. 2010, MNRAS, 403, 1036
- Combes (2000) Combes, F. 2000, in Astronomical Society of the Pacific Conference Series, Vol. 197, Dynamics of Galaxies: from the Early Universe to the Present, ed. F. Combes, G. A. Mamon, & V. Charmandaris, 15
- Comparat et al. (2017) Comparat, J., Maraston, C., Goddard, D., et al. 2017, ArXiv e-prints, arXiv:1711.06575
- De Cia et al. (2018) De Cia, A., Gal-Yam, A., Rubin, A., et al. 2018, ApJ, 860, 100
- Dong et al. (2008) Dong, X., Wang, T., Wang, J., et al. 2008, MNRAS, 383, 581
- Dou et al. (2017) Dou, L., Wang, T., Yan, L., et al. 2017, ApJ, 841, L8
- Drake et al. (2009) Drake, A. J., Djorgovski, S. G., Mahabal, A., et al. 2009, ApJ, 696, 870
- Ferguson et al. (1997) Ferguson, J. W., Korista, K. T., Baldwin, J. A., & Ferland, G. J. 1997, ApJ, 487, 122
- Fox et al. (2016) Fox, O. D., Johansson, J., Kasliwal, M., et al. 2016, ApJ, 816, L13
- Fransson et al. (2014) Fransson, C., Ergon, M., Challis, P. J., et al. 2014, ApJ, 797, 118
- Fremling et al. (2016) Fremling, C., Sollerman, J., Taddia, F., et al. 2016, A&A, 593, A68
- French et al. (2016) French, K. D., Arcavi, I., & Zabludoff, A. 2016, ApJ, 818, L21
- Gelbord et al. (2009) Gelbord, J. M., Mullaney, J. R., & Ward, M. J. 2009, MNRAS, 397, 172
- Gezari et al. (2012) Gezari, S., Chornock, R., Rest, A., et al. 2012, Nature, 485, 217
- Gezari et al. (2017) Gezari, S., Hung, T., Cenko, S. B., et al. 2017, ApJ, 835, 144
- Glidden et al. (2016) Glidden, A., Rose, M., Elvis, M., & McDowell, J. 2016, ApJ, 824, 34
- Graham et al. (2015) Graham, M. J., Djorgovski, S. G., Stern, D., et al. 2015, Nature, 518, 74
- Greene & Ho (2005) Greene, J. E., & Ho, L. C. 2005, ApJ, 630, 122
- Haehnelt & Rees (1993) Haehnelt, M. G., & Rees, M. J. 1993, MNRAS, 263, 168
- Hills (1976) Hills, J. G. 1976, Astrophys. Lett., 17, 95
- Hogg et al. (2002) Hogg, D. W., Baldry, I. K., Blanton, M. R., & Eisenstein, D. J. 2002, ArXiv Astrophysics e-prints, astro-ph/0210394
- Holoien et al. (2014) Holoien, T. W.-S., Prieto, J. L., Bersier, D., et al. 2014, MNRAS, 445, 3263
- Holoien et al. (2016) Holoien, T. W.-S., Kochanek, C. S., Prieto, J. L., et al. 2016, MNRAS, 455, 2918
- Holoien et al. (2018) Holoien, T. W.-S., Huber, M. E., Shappee, B. J., et al. 2018, ArXiv e-prints, arXiv:1808.02890
- Ivanov et al. (2018) Ivanov, P. B., Zhuravlev, V. V., & Papaloizou, J. C. B. 2018, MNRAS, 481, 3470
- Jiang et al. (2016) Jiang, N., Dou, L., Wang, T., et al. 2016, ApJ, 828, L14
- Jiang et al. (2017) Jiang, N., Wang, T., Yan, L., et al. 2017, ApJ, 850, 63
- Jun et al. (2015) Jun, H. D., Stern, D., Graham, M. J., et al. 2015, ApJ, 814, L12
- Kaiser et al. (2002) Kaiser, N., Aussel, H., Burke, B. E., et al. 2002, Pan-STARRS: A Large Synoptic Survey Telescope Array, doi:10.1117/12.457365
- Kasliwal et al. (2017) Kasliwal, M. M., Bally, J., Masci, F., et al. 2017, ApJ, 839, 88
- Kauffmann & Heckman (2005) Kauffmann, G., & Heckman, T. M. 2005, Philosophical Transactions of the Royal Society of London Series A, 363, 621
- Kewley et al. (2006) Kewley, L. J., Groves, B., Kauffmann, G., & Heckman, T. 2006, MNRAS, 372, 961
- Komossa et al. (2008) Komossa, S., Zhou, H., Wang, T., et al. 2008, ApJ, 678, L13
- Komossa et al. (2009) Komossa, S., Zhou, H., Rau, A., et al. 2009, ApJ, 701, 105
- Korista & Ferland (1989) Korista, K. T., & Ferland, G. J. 1989, ApJ, 343, 678
- Kozłowski et al. (2010) Kozłowski, S., Kochanek, C. S., Stern, D., et al. 2010, ApJ, 722, 1624
- Krolik & Kriss (1995) Krolik, J. H., & Kriss, G. A. 1995, ApJ, 447, 512
- LaMassa et al. (2015) LaMassa, S. M., Cales, S., Moran, E. C., et al. 2015, ApJ, 800, 144
- Landt et al. (2015) Landt, H., Ward, M. J., Steenbrugge, K. C., & Ferland, G. J. 2015, MNRAS, 454, 3688
- Law et al. (2009) Law, N. M., Kulkarni, S. R., Dekany, R. G., et al. 2009, PASP, 121, 1395
- Lawrence (2018) Lawrence, A. 2018, Nature Astronomy, 2, 102
- Lyutyj et al. (1984) Lyutyj, V. M., Oknyanskij, V. L., & Chuvaev, K. K. 1984, Soviet Astronomy Letters, 10, 335
- MacLeod et al. (2016) MacLeod, C. L., Ross, N. P., Lawrence, A., et al. 2016, MNRAS, 457, 389
- Mainzer et al. (2014) Mainzer, A., Bauer, J., Cutri, R. M., et al. 2014, ApJ, 792, 30
- McConnell & Ma (2013) McConnell, N. J., & Ma, C.-P. 2013, ApJ, 764, 184
- Nagao et al. (2000) Nagao, T., Taniguchi, Y., & Murayama, T. 2000, AJ, 119, 2605
- Oke & Gunn (1983) Oke, J. B., & Gunn, J. E. 1983, ApJ, 266, 713
- Oke et al. (1995) Oke, J. B., Cohen, J. G., Carr, M., et al. 1995, PASP, 107, 375
- Oknyanskij & Lyuty (2007) Oknyanskij, V., & Lyuty, V. 2007, Peremennye Zvezdy Prilozhenie, 7
- Oknyanskij (1978) Oknyanskij, V. L. 1978, Peremennye Zvezdy, 21, 71
- Oknyansky et al. (2019) Oknyansky, V. L., Winkler, H., Tsygankov, S. S., et al. 2019, MNRAS, 483, 558
- Osterbrock & Ferland (2006) Osterbrock, D. E., & Ferland, G. J. 2006, Astrophysics of gaseous nebulae and active galactic nuclei
- Penston & Perez (1984) Penston, M. V., & Perez, E. 1984, MNRAS, 211, 33P
- Phinney (1989) Phinney, E. S. 1989, in IAU Symposium, Vol. 136, The Center of the Galaxy, ed. M. Morris, 543
- Polletta et al. (2007) Polletta, M., Tajer, M., Maraschi, L., et al. 2007, ApJ, 663, 81
- Rau et al. (2009) Rau, A., Kulkarni, S. R., Law, N. M., et al. 2009, PASP, 121, 1334
- Rees (1988) Rees, M. J. 1988, Nature, 333, 523
- Rest et al. (2011) Rest, A., Foley, R. J., Gezari, S., et al. 2011, ApJ, 729, 88
- Robitaille & Whitney (2010) Robitaille, T. P., & Whitney, B. A. 2010, ApJ, 710, L11
- Rose et al. (2015) Rose, M., Elvis, M., & Tadhunter, C. N. 2015, MNRAS, 448, 2900
- Ruan et al. (2016) Ruan, J. J., Anderson, S. F., Green, P. J., et al. 2016, ApJ, 825, 137
- Rubin et al. (2016) Rubin, A., Gal-Yam, A., De Cia, A., et al. 2016, ApJ, 820, 33
- Runnoe et al. (2016) Runnoe, J. C., Cales, S., Ruan, J. J., et al. 2016, MNRAS, 455, 1691
- Savage & Sembach (1996) Savage, B. D., & Sembach, K. R. 1996, ARA&A, 34, 279
- Shakura & Sunyaev (1973) Shakura, N. I., & Sunyaev, R. A. 1973, A&A, 24, 337
- Singh et al. (2013) Singh, R., van de Ven, G., Jahnke, K., et al. 2013, A&A, 558, A43
- Sollerman et al. (2018) Sollerman, J., Taddia, F., Arcavi, I., et al. 2018, ArXiv e-prints, arXiv:1806.10001
- Stern et al. (2012) Stern, D., Assef, R. J., Benford, D. J., et al. 2012, ApJ, 753, 30
- Stern et al. (2018) Stern, D., McKernan, B., Graham, M. J., et al. 2018, ArXiv e-prints, arXiv:1805.06920
- Stritzinger et al. (2012) Stritzinger, M., Taddia, F., Fransson, C., et al. 2012, ApJ, 756, 173
- Tinyanont et al. (2016) Tinyanont, S., Kasliwal, M. M., Fox, O. D., et al. 2016, ApJ, 833, 231
- Tohline & Osterbrock (1976) Tohline, J. E., & Osterbrock, D. E. 1976, ApJ, 210, L117
- Tonry et al. (2018) Tonry, J. L., Denneau, L., Heinze, A. N., et al. 2018, PASP, 130, 064505
- Tran et al. (2000) Tran, H. D., Cohen, M. H., & Villar-Martin, M. 2000, AJ, 120, 562
- van Velzen et al. (2018) van Velzen, S., Gezari, S., Cenko, S., et al. 2018, ArXiv e-prints, arXiv:1809.02608
- Vestergaard & Peterson (2006) Vestergaard, M., & Peterson, B. M. 2006, ApJ, 641, 689
- Villarroel et al. (2017) Villarroel, B., Nyholm, A., Karlsson, T., et al. 2017, ApJ, 837, 110
- Wang et al. (2012) Wang, T.-G., Zhou, H.-Y., Komossa, S., et al. 2012, ApJ, 749, 115
- Wang et al. (2011) Wang, T.-G., Zhou, H.-Y., Wang, L.-F., Lu, H.-L., & Xu, D. 2011, ApJ, 740, 85
- Wright et al. (2010) Wright, E. L., Eisenhardt, P. R. M., Mainzer, A. K., et al. 2010, AJ, 140, 1868
- Yan et al. (2013) Yan, L., Donoso, E., Tsai, C.-W., et al. 2013, AJ, 145, 55
- Yan et al. (2015) Yan, L., Quimby, R., Ofek, E., et al. 2015, ApJ, 814, 108
- Yan et al. (2017) Yan, L., Lunnan, R., Perley, D. A., et al. 2017, ApJ, 848, 6
- Yang et al. (2013) Yang, C.-W., Wang, T.-G., Ferland, G., et al. 2013, ApJ, 774, 46
- Yang et al. (2017) Yang, Q., Wu, X.-B., Fan, X., et al. 2017, ArXiv e-prints, arXiv:1711.08122
| Obs.Date | MJD | Filter | AB mag | ||||
|---|---|---|---|---|---|---|---|
| days | Hz | mJy | mJy | mag | mag | ||
| 2017-07-02 | 57936.943 | UVW2 | 1.475 | 0.0084 | 0.0016 | 21.59 | 0.21 |
| 2017-07-02 | 57936.933 | UVM2 | 1.345 | 0.0141 | 0.0023 | 21.03 | 0.18 |
| 2017-07-02 | 57936.953 | UVW1 | 1.157 | 0.0209 | 0.0029 | 20.58 | 0.15 |
| 2017-07-13 | 57947.872 | UVW2 | 1.475 | 0.0124 | 0.0017 | 21.16 | 0.15 |
| 2017-07-13 | 57947.875 | UVM2 | 1.345 | 0.0114 | 0.0019 | 21.26 | 0.18 |
| 2017-07-13 | 57947.878 | UVW1 | 1.157 | 0.0207 | 0.0026 | 20.60 | 0.14 |
| 2017-12-26 | 58112.816 | UVW2 | 1.475 | 0.0120 | 0.0019 | 21.20 | 0.17 |
| 2017-12-26 | 58112.817 | UVM2 | 1.345 | 0.0121 | 0.0022 | 21.19 | 0.20 |
| 2017-12-26 | 58112.819 | UVW1 | 1.157 | 0.0174 | 0.0030 | 20.79 | 0.18 |