Multicolor study of V1009 Per, a close binary system at the beginning of the overcontact phase, and of CRTS J031642.2+332639, a new binary system in the same field
Abstract
The first multicolor observations, and light curve solutions, of the eclipsing binary systems V1009 Per and CRTS J031642.2+332639 are presented. Using the 2005 version of the Wilson-Devinney code, both systems are found to be W UMa contact binaries. V1009 Per has a mass ratio of and a shallow fill out parameter of while CRTS J031642.2+332639 has a mass ratio of and a fill out of . High orbital inclinations, for V1009 Per and for CRTS J031642.2+332639, implies that both systems are total eclipsing binaries and that the photometric parameters here obtained are reliable. Based on 16 times of minimum, the orbital period variations of V1009 Per are discussed. The absolute dimensions of the systems are estimated and, from the logM-logL diagram, it is found that both components of the systems follow the general pattern of the W subtype W Ursae Majoris systems.
Se presentan las primeras observaciones multicolor, y ajustes a las curvas de luz, de los sistemas binarios eclipsantes V1009 Per y CRTS J031642.2+332639. Usando la versión 2005 del código Wilson-Devinney, se encuentra que ambos sistemas son binarias en contacto del tipo W UMa. V1009 Per tiene un cociente de masas de y un factor de llenado de mientras que CRTS J031642.2+332639 tiene los valores de y . Las altas inclinaciones orbitales, para V1009 Per e para CRTS J031642.2+332639, implican que ambas son binarias totalmente aclipsantes y que los parametros fotométricos obtenidos son confiables. En base a 16 tiempos de mínimo, se discuten las variaciones del periodo orbital de V1009 Per. También se calculan las dimensiones absolutas de los sistemas y, con el diagrama logM-logL, se encuentra que ambos componentes de los sistemas siguen el patrón general del subtipo W de las W Ursae Majoris.
techniques: photometric \addkeywordbinaries: eclipsing \addkeywordstars: individual: V1009 Per \addkeywordstars: individual: CRTS J031642.2+332639
0.1 Introduction
The creation of a stellar evolutionary scheme requires a knowledge of the fundamental parameters of stars in different stages of their evolution. Eclipsing binary systems, especially the W Ursae Majoris type, are among the most important sources of such information (Kjurkchieva et al., 2017).
W UMa systems have orbital periods, typically, between 0.2 days and 0.8 days and consists of two dwarf stars with spectral types ranging from A to K sharing a common convective envelope resulting in a near equalization of the surface temperature with differences not more than a few percent (Christopoulou et al., 2011).
Light curves of W UMa stars show continuous changes in brightness with nearly equal depth minima and maxima that are not always symmetric. This difference in maximum light levels, sometimes referred to as the O’Connell effect (O’Connell, 1951), is caused by the inhomogeneity in the surface brightness distribution, on one or both stars, commonly associated with dark or hot spots. The difference between the maxima can change from orbit to orbit because of the motion and evolution of these active regions. This phenomenon may indicate the presence of an activity cycle similar to that of the Sun (Mitnyan et al., 2018).
In our modern understanding, these systems are most likely formed from the moderate close binaries (Chen et al., 2016) through either nuclear evolution of the most massive component in the detached phase or angular momentum evolution of the two component stars within a convective envelope (Hilditch et al., 1988); (Tutukov et al., 2004); (Yildiz & Doğan, 2013).
V1009 Per (GSC 2344-00092, NSVS 6662264, ) was first reported by Kuruslov (2011) as a short-period contact eclipsing binary candidate with an orbital period of about 0.23414 days. The published light curve presented the typical EW-type behaviour however, the data in its light curve are scattered to some extent, and it is not clear that the light curve shows the O’Connell effect or argue about the features of the light curve at the time of the observations. We found the O’Connell effect in our observed light curves and adopt a bright spot model to interpret it.
CRTS J031642.2+332639 (hereinafter J031642, ) is listed as variable star, with a period of 0.3009380 days, in the Catalina Surveys Periodic Variable Star Catalog (Drake et al., 2014). This object also shows the typical behaviour of W UMa type systems.
Because no photometric or spectroscopic studies are found in the literature, the aim of the present study is to analyze our , , and light curves to obtain the first orbital and fundamental parameters of these eclipsing binaries.
0.2 Observations
Photometric observations were carried out at the San Pedro Martir Observatory, on December 16, 2017 and January 18, 2018, with the 0.84-m telescope, a filter-wheel and the Spectral Instruments 1 CCD detector (a deep depletion e2v CCD42-40 chip with gain of 1.39 e-/ADU and readout noise of 3.54 e-). The field of view was and binning 22 was used during all the observations. Alternated exposures were taken in filters , , and with exposure times of 40, 25, 15 and 15 seconds respectively. A total of 371 target images were acquired during the first night covering an interval of 5.7 hours while 414 images were acquired during the second night for 6.3 hours. Flat field and bias frames were taken during both observing runs.
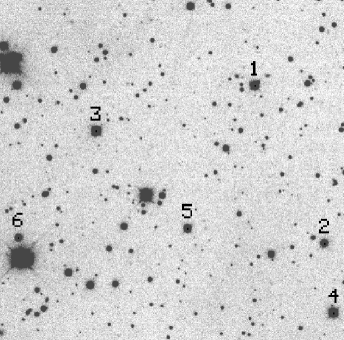
All images were processed using IRAF111IRAF is distributed by the National Optical Observatories, operated by the Association of Universities for Research in Astronomy, Inc., under cooperative agreement with the National Science Foundation. routines. Images were bias subtracted and flat field corrected before the instrumental magnitudes of the marked stars in Figure 1 were computed with the standard aperture photometry method. This field was also calibrated in the system and the results, along with the 2MASS magnitudes, are presented in Table 1. Based on this information, we decided to use object #3 as comparison star since it has similar magnitude and color to both V1009 Per and J031642, making differential extinction corrections negligible. Objects #4, #5 and #6 were used as check stars to confirming that the comparison star is not variable. Any part of the data can be provided by the first author upon request.
| ID | Name | RA (2000) | DEC (2000) | ||||||||
|---|---|---|---|---|---|---|---|---|---|---|---|
| 1 | V1009 Per | 49.206375 | 33.504269 | 15.938 | 15.406 | 14.351 | 13.716 | 13.112 | 12.307 | 11.734 | 11.619 |
| 2 | CRTS J031642.2+332639 | 49.175527 | 33.444546 | 16.397 | 16.002 | 15.046 | 14.437 | 13.920 | 13.207 | 12.737 | 12.599 |
| 3 | LAM260516231 | 49.278550 | 33.487820 | 15.482 | 15.071 | 14.109 | 13.567 | 13.042 | 12.228 | 11.779 | 11.681 |
| 4 | LAM260516226 | 49.171755 | 33.418138 | 15.461 | 15.157 | 14.227 | 13.698 | 13.205 | 12.452 | 12.061 | 11.935 |
| 5 | 2MASSJ03165701+3327025 | 49.237512 | 33.450702 | 16.434 | 15.955 | 14.987 | 14.458 | 13.988 | 13.186 | 12.837 | 12.680 |
| 6 | 2MASSJ03171542+3326522 | 49.314234 | 33.447899 | 16.961 | 16.525 | 15.523 | 14.927 | 14.401 | 13.602 | 13.131 | 13.012 |
0.3 Light elements and orbital period variations of V1009 Per
The measured times of minimum (ToM), determined by the polynomial fits, of J031642 are presented in Table 2. These new data permit us to refine the orbital period as:
| (1) |
| HJD | Epoch | O-C |
|---|---|---|
| 2458102.665 | -114 | 0 |
| 2458136.671 | -0.5 | -0.0005 |
| 2458136.822 | 0 | 0.0005 |
Based on a careful search for all available eclipsing times of V1009 Per, we collected a total of 16 ToM that, with the new four ToM observed by us (Table 3), permit the revision of the ephemerid and the construction of its O-C diagram depicted in Figure 2.
| Band | HJD | Epoch | O-C | Source |
|---|---|---|---|---|
| Rotse | 2451491.536 | 0 | -0.0143 | Kuruslov (2011) |
| Rotse | 2451491.653 | 0.5 | -0.014 | NSVS |
| SWASP | 2453250.281 | 7511.5 | 0.0111 | SWASP |
| SWASP | 2453250.397 | 7512 | 0.0109 | SWASP |
| SWASP | 2454045.87 | 10909.5 | 0.0031 | SWASP |
| SWASP | 2454045.988 | 10910 | 0.0045 | SWASP |
| SWASP | 2454320.981 | 12084.5 | 0.0039 | SWASP |
| SWASP | 2454321.098 | 12085 | 0.0037 | SWASP |
| CCD | 2455846.852 | 18601.5 | 0.0043 | Diethelm (2012) |
| CCD | 2455846.968 | 18602 | 0.0031 | Diethelm (2012) |
| CCD(V) | 2456227.909 | 20229 | 0.0034 | Diethelm (2013) |
| CCD | 2457387.23 | 25180.5 | -0.0037 | Nosal P. |
| BVRI | 2458102.635 | 28236 | -0.0038 | This paper |
| BVRI | 2458102.752 | 28236.5 | -0.0046 | This paper |
| BVRI | 2458136.702 | 28381.5 | -0.0039 | This paper |
| BVRI | 2458136.819 | 28382 | -0.0037 | This paper |
| (2) |
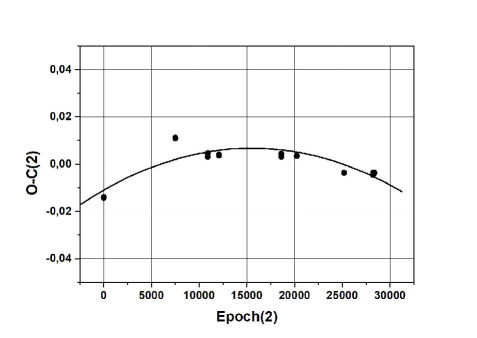
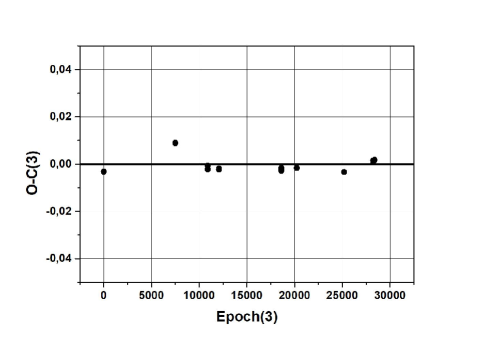
Applying the ephemeris of Eq. 2 to those minima, we notice that the trend of the residual has a parabolic shape as shown in Figure 2. A second order polynomial ephemeris, fitting to all the minima, gives:
| (3) |
whose residuals behaviour is showed in Figure 3.
Since the temporal distribution of the O-C values is rather small (covering only 18 years, spanning nearly 28,400 orbits), the downward parabolic change shown in Figure 2 may be only a part of a long-period cyclic oscillation that may be caused be the presence of a third body. To confirm this conclusion, more times of light minimum are required in the future.
From the quadratic term of Eq.(3), it follows that the orbital period may be decreasing at a rate of . With the orbital period decrease, the primary component transfer mass to the secondary one, the mass ratio increases and eventually the system evolve into the contact phase. Period decrease might be caused by mass or angular momentum loss (AML) due to magnetic stellar wind (magnetic breaking) and/or mass transfer from the more massive to the less massive component.
According to the formula given by Bradstreet & Guinan (1994): , this suggests that magnetic breaking is not the main cause of period decrease. The mass transfer from to or the mass loss from the system can be evaluated using Equations 4 and 5 of Hilditch (2001) for conservative and non-conservative mass loss, respectively. We obtain for V1009 Per and for conservative and non conservative mass transfer, respectively.
The timescale of the conservative mass transfer ( i.e. the dynamical timescale) can be estimated to be approximately dy= yrs and yrs for non conservative mass transfer.
On the other hand, the thermal timescale of the massive component can be estimated as yrs (Hilditch, 2001) which is longer than the conservative mass-transfer duration. This suggests that the primary component cannot stay in thermal equilibrium and the mass transfer in V1009 Per is unstable.
0.4 PHOTOMETRIC ANALYSIS USING THE WD CODE
There are no reported spectroscopic mass ratios for these systems. In order to derive reliable geometric and astrophysical elements, the present observations were analyzed simultaneously using the 2003 (October 2005 revision) version of the Wilson–Devinney (WD) program Wilson & Devinney (1971); Wilson (1990); Wilson (1994); Wilson & van Hamme (2004).
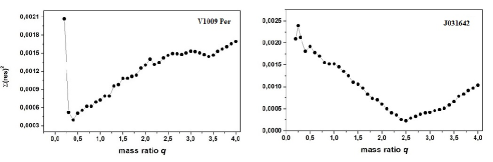
We applied the –search method to find the best initial value to be used for during the light curve analysis.
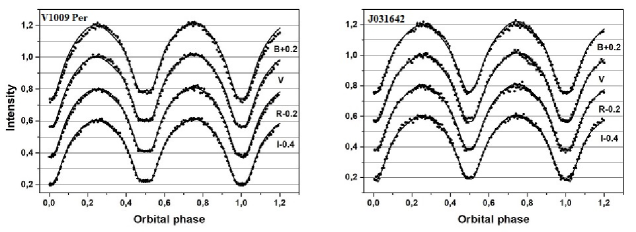
From Figure 4 left, it is clearly seen that the light curves of V1009 Per presents a flatter bottom secondary eclipse covering approximately 0.07 in phase; this possibly indicates a total eclipse configuration of the system.
We used the NASA IPAC database (NASA, 2015), interstellar extinction and reddening calculator to compute the value for both the systems which, due to the low Galactic latitude (), could be significant.
We have checked the consistence of our determined values using the period-color relation discovered by Eggen and revised by Wang (1994) as . The results are the following:
For V1009 Per; NASA’s calculator gives a value of i.e. , while Wang’s equation gives i.e. (difference of ). For CRTS J031642; NASA’s calculator gives i.e. , while Wang’s equation gives i.e. (difference of ). The differences between the two values are smaller than the error bars. The color values obtained by our observations were corrected with the relative and the resulted values of were adopted in the determination of the temperature of star 1.
Following Lucy (1967), the gravity-darkening coefficients of the two components were taken to be 0.32 and bolometric albedo coefficients were set at 0.50 for stars with a convective envelope, Ruciński (1973). Limb-darkening coefficients of the components were interpolated for square root law from van Hamme (1993) tables.
The shapes of the light curves of these systems are similar to the most frequent light curve shapes of the W UMa-type binary stars, this suggested us to start the W-D analysis directly in Mode 3. Mode 3 in the W-D Code is for over contact binaries (W UMa stars) in which the adjustable parameters used in the Differential Correction calculation are the orbital inclination, , the mean surface effective temperature of the secondary component, , the dimensionless surface potentials of the two components, , and the monochromatic luminosity of the primary component .
Due to the common occurrence of third bodies in WUMa systems (Pribulla & Ruciński, 2006), the third light was included as an adjustable parameter. The results showed that the values of the third light were negligible and less than the uncertainties. To search for a reliable mass ratio , we made test solutions at the outset using the four light curves in colors simultaneously.
The test solutions were computed at a series of assumed mass ratios , with the values from 0.2 to 4 in steps of 0.1 for both the systems, and the behaviour of the sum of squares of residuals, , was used to estimate its value. The relation between the resulting sum of weighted square deviations and is plotted in Figure 5. A minimum value was obtained at for V1009 Per and for J031642. Therefore, we chose the above initial values of mass ratios and made its an adjustable parameter. Then, we performed a differential correction until it converged and final solutions were derived (Table 4). It should be noted that the errors of the parameters given in this paper are the formal errors from the WD code and are known to be unrealistically small (Maceroni & Ruciński, 1997). For a discussion see Barani et al. (2017).
| V1009 Per | J032642 | |
| 85.9710.145 | 83.2450.148 | |
| 5280∗ | 5544∗ | |
| 52536 | 54166 | |
| 2.5340.004 | 5.872+0.009 | |
| 0.3620.002 | 0.3980.006 | |
| 0.5∗ | 0.5∗ | |
| 0.32∗ | 0.32∗ | |
| 0.6810.002 | 0.3180.002 | |
| 0.6870.001 | 0.3110.001 | |
| 0.6870.001 | 0.3080.001 | |
| 0.6900.001 | 0.3070.001 | |
| 0.2680.002 | 0.6340.003 | |
| 0.2670.002 | 0.6390.003 | |
| 0.2690.002 | 0.6450.002 | |
| 0.2710.002 | 0.6540.002 | |
| 0.1180.06 | 0.1360.04 | |
| 0.749∗ | 0.624∗ | |
| 0.422∗ | 0.319∗ | |
| 0.244∗ | 0.168∗ | |
| 0.131∗ | 0.075∗ | |
| 0 | 0 | |
| 0.4530.001 | 0.2890.001 | |
| 0.4880.001 | 0.3020.001 | |
| 0.5910.001 | 0.3390.002 | |
| 0.2890.001 | 0.4290.001 | |
| 0.3030.001 | 0.4700.001 | |
| 0.2470.003 | 0.4990.001 | |
| lat spot | 891.8 | 512 |
| long spot | 310.13.1 | 270.42.7 |
| radius | 24.80.92 | 25.40.88 |
| Temp fac.Spot | 1.0550.017 | 1.030.02 |
| Star | 2 | 2 |
| Sum (res)2 | 0.00030 | 0.00022 |
Results of our analysis confirm that both the system are shallow contact binaries in good thermal contact. For systems exhibiting high inclination, the mass ratios can be inferred from purely geometric arguments even in the absence of complementary spectroscopic data (Terrell & Wilson, 2005). As shown in Figure 4, the light curves of both the systems display an inverse O’Connell effect (O’Connell, 1951). The maximum at phase 0.25 (Max I) is slightly fainter than the one at phase 0.75 (Max II), see Table 5.
| V1009 Per | J032642 | |
|---|---|---|
| Max II-Max I B | 0.008 | 0.011 |
| Max II-Max I V | 0.007 | 0.006 |
| Max II-Max I R | 0.016 | 0.008 |
| Max II-Max I I | 0.006 | 0.006 |
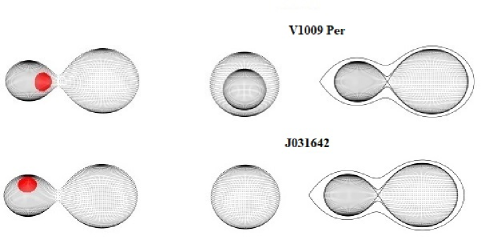
These features usually indicate wavelength-dependent hot spot activity (rather than a cool spot) on the surface of one component of the system due to the probable impact from mass transfer between the components. The final synthetic light curves calculated by using the whole set of parameters of Table 4 are shown in Figure 4 as continuous lines. The observed and the theoretical light curves are in good agreement. A graphic representations and the Roche geometries of the systems are shown in Figure 6.
0.5 EVOLUTIONARY STATE OF THE SYSTEMS and conclusions
Since there is no spectroscopic measurement of the orbital elements available presently, the absolute parameters of the system cannot be determined directly. We use the 3D empirical laws of Gazeas (2009) where the physical parameters of contact binaries are closely correlated with the orbital period and mass ratio. Then using the mass ratio determined from the photometry, we can derive the individual masses and radii.
Luminosities were calculated using the Stefan-Boltzmann law. The physical parameters listed in Table 6, are used to investigate the current evolutionary status of both the systems.
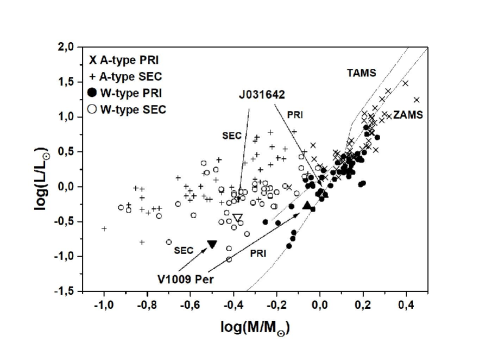
Recently, Yildiz & Doğan (2013), developed a method for computation of initial masses of contact binaries based on stellar modelling with mass loss. Their main assumption is that the mass transfer starts near or after the TAMS phase of the massive component (the progenitor of the secondary component). Moreover they found that binary systems with initial mass of the secondary, , higher than become A-subtype and if it is lower than 1.8M⊙; then the systems exhibit W-subtype properties. Applying this method we find for V1009 Per and for J031642. These results agree with the determination of the W-subtype based on the above criterion for the initial mass of the secondary.
In Fig. 7, we plotted the components of V1009 Per and J031642 together with other W- and A-type W UMa systems collected by Yildiz & Doğan (2013) in the logarithmic mass-luminosity (M-L) relations along with the ZAMS and TAMS computed by Girardi et al. (2000). It is clear that both components of our systems follow the general pattern of the W-subtype systems and seem to be in good agreement with the well known W-type W UMa systems on the logM-logL plane.
| V1009 Per | J032642 | |
|---|---|---|
| Primary star, Secondary star | Primary star, Secondary star | |
| Mass () | 0.8740.001, 0.3170.007 | 1.0370.010, 0.4140.030 |
| Radius () | 0.8650.003, 0.4740.003 | 1.0020.009, 0.6610.014 |
| Luminosity () | 0.5210.004, 0.1530.002 | 0.7700.010, 0.3700.020 |
| a () | 1.6940.006 | 2.1330.029 |
In both the systems the light curves exhibit the inverse O’Connell effect with the maximum at phase 0.25 (Max I) slightly fainter than that at phase 0.75 (Max II).
For this reason a hot spot, indicating a probable impact from mass transfer between the components, was placed on the surface of the secondary component.
Acknowledgements.
Acknowledgments
RM acknowledge the financial support from the UNAM under DGAPA grant PAPIIT IN 100918. This paper is based on observations acquired at the OAN-SPM, Baja California, Mexico. This research has made use of the International Variable Star Index (VSX) database, operated at AAVSO, Cambridge, Massachusetts, USA, of the VizieR catalogue access tool, CDS, Strasbourg, France. The original description of the VizieR service was published in A&AS 143, 23.
We acknowledge our anonymous referee for comments that helped to improve this work.
References
- Barani et al. (2017) Barani, C., Martignoni, M., Acerbi, F., 2017, NewAst 50, 73.
- Bradstreet & Guinan (1994) Bradstreet, D.H., Guinan, E.F, 1994, in ASP Conf, Ser. 56, Interacting Binaries, ed. A.W. Shafter (San Francisco, CA:ASP), 228.
- Chen et al. (2016) Chen, X., Deng, L., de Grijs, R., Zhang, X., Xin, Y., Wang, K., Luo, C., Yan, Z., Tian, J., Sun, J., Liu, Q., Zhou, Q., Luo, Z., 2016, AJ 152, 129.
- Christopoulou et al. (2011) Christopoulou, P.-E., Parageorgiou, A., Chrysopoulos, I., 2011, AJ 142, 99.
- Diethelm (2012) Diethelm, R., 2012. IBVS 6011.
- Diethelm (2013) Diethelm, R., 2013. IBVS 6042.
- Drake et al. (2014) Drake, A.J., Graham, M.J., Djorgovski, S.G., Catelan, M., Mahabal, A.A., Torrealba, G., Garcia-Alvarez, D., Donalek, C., Prieto, J.L., Williams, R.; Larson, S., Christensen, E., Belokurov, V., Koposov, S.E., Beshore, E.; Boattini, A., Gibbs, A., Hill, R., Kowalski, R.; Johnson, J., Shelly, F., 2014. ApJS 213,9.
- Gazeas (2009) Gazeas, K.D., 2009. CoAst 159, 129.
- Girardi et al. (2000) Girardi, L., Bressan, A., Bertelli, G., Chiosi, C., 2000. AAS 141, 371.
- Hilditch et al. (1988) Hilditch, R.W., King, D.J., McFarlane, T.M., 1988, MNRAS 231, 341.
- Hilditch (2001) Hilditch, R.W., 2001, An introduction to Close Binary Stars (Cambridge, UK: Cambridge University Press).
- Kjurkchieva et al. (2017) Kjurkchieva, D.P., Popov, V.A., Ibryamov, S.I., Vasileva, D.l., Petrov, N.I., 2017, RAA 17, 42.
- Kuruslov (2011) Kuruslov, A.V., 2011. PZP 11, 1.
- Lucy (1967) Lucy, L.B., 1967. ZA 65, 89.
- Maceroni & Ruciński (1997) Maceroni, C., Ruciński, S.M., 1997. PASP 109, 782.
- Mitnyan et al. (2018) Mitnyan, T., Bódi, A., Szalai, T., Vinkó, J., Szatmáry, K., Borkovits, T., Bíró, B.I., Hegedüs, T., Vida, K., Pál, A., 2018, A&A 612, 91.
- NASA (2015) NASA: http://irsa.ipac.caltech.edu/applications/DUST/ (2015)
- Nosal (2222) Nosal, P., O-C gateway, http://var2.astro.cz/ocgate/
- O’Connell (1951) O’Connell, D.J.K., 1951. PRCO 2, 85.
- Pribulla & Ruciński (2006) Pribulla, T., Ruciński, S.M., 2006. AJ 131, 2986.
- Ruciński (1973) Ruciński, S.M., 1973. AcA 23, 79.
- Terrell & Wilson (2005) Terrell, D., Wilson, R.E., 2005. Ap&SS 296, 221.
- Tutukov et al. (2004) Tutukov, A.N., Dremova, G.N., Svechnikov, M.A., 2004, ARep 48, 219.
- van Hamme (1993) van Hamme, W., 1993. AJ 106, 2096.
- Wang (1994) Wang, J.M., 1994. ApJ 434, 277.
- Wilson & Devinney (1971) Wilson, R.E., Devinney, E.J., 1971. ApJ 166, 605.
- Wilson (1990) Wilson, R.E., 1990. ApJ 356, 613.
- Wilson (1994) Wilson, R.E., 1994. PASP 106, 921.
- Wilson & van Hamme (2004) Wilson, R.E., van Hamme, W., 2004. Computing binary stars observables. http://ftp.astro.ufl.edu, directory pub/wilson/lcdc2003.
- Worthey & Lee (2011) Worthey, G., Lee, H.C., 2011. ApJs 193, 1.
- Yildiz & Doğan (2013) Yildiz, M., Doğan, T., 2013, MNRAS 430, 2029.