ALMA Spatially-resolved Dense Molecular Gas Survey of Nearby Ultraluminous Infrared Galaxies
Abstract
We present the results of our ALMA HCN J=3–2 and HCO+ J=3–2 line observations of a uniformly selected sample (25) of nearby ultraluminous infrared galaxies (ULIRGs) at 0.15. The emission of these dense molecular gas tracers and continuum are spatially resolved in the majority of observed ULIRGs for the first time with achieved synthesized beam sizes of 02 or 500 pc. In most ULIRGs, the HCN-to-HCO+ J=3–2 flux ratios in the nuclear regions within the beam size are systematically higher than those in the spatially extended regions. The elevated nuclear HCN J=3–2 emission could be related to (a) luminous buried active galactic nuclei, (b) the high molecular gas density and temperature in ULIRG’s nuclei, and/or (c) mechanical heating by spatially compact nuclear outflows. A small fraction of the observed ULIRGs display higher HCN-to-HCO+ J=3–2 flux ratios in localized off-nuclear regions than those of the nuclei, which may be due to mechanical heating by spatially extended outflows. The observed nearby ULIRGs are generally rich in dense (105 cm-3) molecular gas, with an estimated mass of 109M⊙ within the nuclear (a few kpc) regions, and dense gas can dominate the total molecular mass there. We find a low detection rate (20%) regarding the possible signature of a vibrationally excited (v2=1f) HCN J=3–2 emission line in the vicinity of the bright HCO+ J=3–2 line that may be due, in part, to the large molecular line widths of ULIRGs.
1 Introduction
Ultraluminous infrared galaxies (ULIRGs) emit very strong infrared radiation, with infrared (8–1000 m) luminosity of LIR 1012L⊙. ULIRGs are mostly found in gas-rich major galaxy mergers in the nearby universe at 0.15 (e.g.) (Sanders et al., 1988; Clements et al., 1996; Murphy et al., 1996; Duc et al., 1997). The large observed infrared luminosities indicate the presence of luminous energy sources; however, these sources may be hidden and/or surrounded by dust. Numerical simulations of gas-rich major galaxy mergers predict not only that active star formation (a starburst) is triggered but also that existing supermassive black holes (SMBHs) can achieve high mass accretion rates and become luminous active galactic nuclei (AGNs); both are likely to occur in heavily dust-obscured regions (Hopkins et al., 2006). It is important to observationally test this widely accepted scenario, if we are to understand the nature of the ULIRG population in the local universe (Sanders et al., 1988; Alexander & Hickox, 2012).
For this purpose, it is necessary to conduct observations using wavelengths of low dust extinction, given that the ULIRG energy sources, particularly AGNs, are buried deep in the nuclear gas and dust. Dust extinction effects are much reduced in the infrared and hard X-ray range, compared to the optical range. Spectroscopic investigations of such buried AGNs in nearby ULIRGs have been undertaken using an infrared range of 2.5–35 m (e.g.) (Genzel et al., 1998; Imanishi & Dudley, 2000; Soifer et al., 2002; Imanishi et al., 2006a; Imanishi, 2006; Armus et al., 2007; Imanishi et al., 2007a; Nardini et al., 2008; Imanishi et al., 2008; Nardini et al., 2009; Veilleux et al., 2009; Imanishi, 2009; Imanishi et al., 2010a, b; Nardini et al., 2010; Lee et al., 2012; Ichikawa et al., 2014; Alonso-Herrero et al., 2016) and hard X-ray range of 10 keV (e.g.) (Teng et al., 2015; Oda et al., 2017; Ricci et al., 2017; Iwasawa et al., 2017). This is because AGNs and starbursts display different relative strengths of polycyclic aromatic hydrocarbon (PAH) emission features and dust continuum emission in the infrared, and also have different hard X-ray to bolometric luminosity ratios. In fact, these observations have revealed optically elusive, but intrinsically luminous, buried AGNs in many nearby ULIRGs. However, there remains a large fraction of nearby ULIRGs for which no clear AGN signature has been detected in infrared and hard X-ray surveys. It remains unclear whether the non-detection of AGN signatures in these sources is due to the fact that (a) AGNs are not sufficiently luminous (i.e., mass accretion rates onto SMBHs are not so high) to be detectable relative to strong starbursts, or (b) luminous AGNs are present but are too highly obscured to be detectable even in the infrared and X-ray range. Observations at wavelengths of even stronger dust/gas penetration power may reveal extremely deeply buried AGNs ( 1 at infrared 2.5–35 m and X-ray 10 keV) in nearby ULIRGs.
(Sub)millimeter wavelengths at 0.3–3.6 mm (84–950 GHz) are of particular interest in this regard. If the Galactic extinction curve by gas and dust is assumed, the extinction is a factor of 30 smaller than those at infrared 20 m and X-ray 10 keV (Hildebrand, 1983). With the Atacama Large Millimeter Array (ALMA), it is now possible to conduct high-sensitivity and high-spatial-resolution observations of nearby ULIRGs in this potentially powerful (sub)millimeter wavelength range. As the energy-generation mechanisms are different between a starburst and AGN (nuclear fusion versus a mass-accreting SMBH, respectively), the physical/chemical effects to the surrounding molecular gas are expected to differ between the two energy sources. Rotational J-transition lines of many molecules reside in the (sub)millimeter wavelength range, and multiple molecular line flux ratios can differ depending on the primary energy sources. In fact, (sub)millimeter molecular rotational J-transition line flux ratios have been used to separate AGNs from starbursts in nearby optically identified luminous AGNs and starburst galaxies (e.g.) (Kohno, 2005; Krips et al., 2008). (Sub)millimeter molecular line observations have been applied also to a limited number of nearby ULIRGs, using pre-ALMA observing facilities and the early phase of ALMA. Some fraction of ULIRGs had been diagnosed to contain optically elusive, but infrared-detectable luminous buried AGNs. A trend was found that such ULIRGs displayed different molecular rotational J-transition line flux ratios from starburst-dominated galaxies, although a small fraction of infrared-classified starbursts showed similar molecular line flux ratios to AGN-important galaxies (e.g.) (Imanishi et al., 2004, 2006b, 2007b, 2009a; Costagliola et al., 2011; Imanishi & Nakanishi, 2014; Privon et al., 2015; Izumi et al., 2016; Imanishi et al., 2016c, 2018). Compared to old single dish telescope data, the trend has been seen more clearly in recent interferometric data, most likely because (a) only nuclear molecular gas significantly affected by luminous AGNs is selectively probed (with reduced contaminations from spatially extended starburst-dominated emission) and (b) multiple molecular line data were taken simultaneously (which minimized possible systematic uncertainties in molecular line flux ratios).
Based on sensitive ALMA studies, a few candidates of optically/infrared/X-ray-elusive but (sub)millimeter-detectable extremely deeply buried AGNs have been found (Imanishi et al., 2016c, 2018). This has been accomplished (a) by finding molecular rotational J-transition line flux ratios (at the vibrational ground level; v=0) usually seen in AGN-important galaxies and (b) by detecting molecular J-transition lines at a vibrationally excited (v2=1, l=1f; hereafter v2=1f) level. The latter detection can be the signature of a luminous buried AGN, particularly if the vibrationally excited (v2=1f) molecular line luminosity, relative to vibrational ground (v=0) molecular line and/or infrared luminosity, is significantly higher than those seen in active star-forming regions (Aalto et al., 2015a, b; Imanishi et al., 2016c, 2018). This is because (a) molecular vibrational excitation is most likely to be caused by mid-infrared (5–25 m) radiative pumping (Sakamoto et al., 2010) and (b) the mid-infrared to bolometric luminosity ratio in an AGN can be much higher than a starburst, due to AGN-heated hot dust emission. However, these molecular line observations of nearby ULIRGs have only been conducted for arbitrarily selected interesting sources with known luminous AGN signatures at other wavelengths and/or some other unique observational properties. Target selection has been non-uniform, hampering any statistical discussion about the nature of the nearby ULIRG population in general. Specifically, it is still unclear (a) whether ULIRGs with infrared-identified luminous buried AGNs consistently show molecular line flux ratios expected for AGN-important galaxies and (b) what fraction of nearby ULIRGs contain infrared/X-ray-elusive, but (sub)millimeter-detectable, extremely deeply buried AGNs ( 1 at 2.5–35 m and 10 keV). It is a natural next step to apply the powerful (sub)millimeter molecular line method to an extended number of carefully and uniformly selected nearby ULIRG samples, using the highly sensitive ALMA.
In this paper, we present the results of ALMA molecular line observations of an increasing number of nearby ULIRGs. Molecular line and continuum emission were spatially resolved in the majority of observed ULIRGs, allowing for the first time detailed and systematic investigations of the internal spatial variation of molecular line flux ratios in a statistically significant number of the nearby ULIRG population. Throughout this paper, we adopt H0 71 km s-1 Mpc-1, = 0.27, and = 0.73. Unless otherwise stated, “molecular line flux ratio” refers to the “rotational J-transition line flux ratio at the vibrational ground level (v=0)”.
2 Selected Targets and Molecular Lines
Our targets are nearby ULIRGs in the IRAS 1 Jy sample (Kim & Sanders, 1998). Optical spectroscopic classifications (Veilleux et al., 1999; Yuan et al., 2010), as well as infrared spectroscopic energy diagnostics (a) at 5–35 m using Spitzer IRS (e.g.) (Veilleux et al., 2009; Imanishi et al., 2007a; Imanishi, 2009; Imanishi et al., 2010a; Nardini et al., 2008, 2009, 2010) and (b) at 2.5–5 m using AKARI IRC (e.g.) (Imanishi et al., 2008, 2010b), have extensively been conducted for this sample. We selected ULIRGs classified optically as LINERs or HII-regions (i.e., no obvious optical AGN signature) (Veilleux et al., 1999) at 0.15 and at declinations 20∘ to be best observable from the ALMA site in Chile. Our primary goal was to unveil optically and/or infrared/X-ray-elusive, but intrinsically luminous, buried AGNs in nearby ULIRGs, based on the proposed powerful (sub)millimeter approach.
In nearby ULIRGs, which are mostly gas-rich major galaxy mergers, molecular gas is concentrated in the nuclear regions (e.g.) (Downes & Solomon, 1998; Evans et al., 2002; Pereira-Santaella et al., 2018), and gas density becomes high there (Scoville et al., 2015). Observations using dense gas tracers are crucial to understanding the physical properties of molecular gas in nearby ULIRGs (Gao & Solomon, 2004a, b). HCN and HCO+ rotational J-transition lines are better probes of such dense molecular gas, due to larger dipole moments, than the widely used bright CO low-J (J=1–0 or J=2–1) transition lines (Shirley, 2015). Furthermore, the trend of higher HCN-to-HCO+ line flux ratios in AGNs than in starbursts have been argued mostly in recent high-quality interferometric data (where HCN and HCO+ lines were observed simultaneously), at J=1–0 (Kohno, 2005; Krips et al., 2008; Imanishi et al., 2006b, 2007b, 2009a), J=3–2 (Krips et al., 2008; Imanishi et al., 2016a, c), and J=4–3 (Izumi et al., 2013; Imanishi & Nakanishi, 2014; Garcia-Burillo et al., 2014; Izumi et al., 2015, 2016; Imanishi et al., 2018). Thus, observing both HCN and HCO+ lines can be an effective way to disentangle the energetic role of AGNs and starbursts.
Our next step was to select ULIRGs with modestly bright dense molecular emission lines from the nuclear regions, where the effects of the putative AGNs to molecular line flux ratios are expected to be strong. Regarding the nuclear buried energy sources of ULIRGs, it is expected that dense molecular emission line luminosity correlates with infrared dust emission luminosity (Gao & Solomon, 2004a, b), regardless of whether the energy sources are stars and/or AGNs, because both dense molecular gas and spatially coexisting dust are heated and produce dense molecular line and infrared dust continuum emission, respectively. Although the infrared luminosities of ULIRGs are usually derived from IRAS’s large-aperture (60′′) measurements (Table 1), the bulk of the infrared luminosities in nearby ULIRGs originate in nuclear (a few kpc) regions, with small contributions from spatially extended (3 kpc) star formation in the host galaxies (Soifer et al., 2000; Diaz-Santos et al., 2010; Imanishi et al., 2011). Namely, ULIRGs with high IRAS-based infrared fluxes strongly suggest high nuclear infrared dust continuum emission fluxes and thereby high nuclear dense molecular emission line fluxes (Imanishi & Nakanishi, 2014).
Next, we determined which rotational J-transition lines should be observed. Historically, HCN and HCO+ J=1–0 lines have long been used to diagnose energy sources (e.g.) (Kohno, 2005; Krips et al., 2008; Imanishi et al., 2004, 2006b, 2007b, 2009a; Costagliola et al., 2011; Privon et al., 2015). However, using ALMA, the J=1–0 lines can be observed only for nearby sources at 0.05; above this redshift, the lines are redshifted beyond the frequency coverage of band 3 (84–116 GHz), the longest wavelength band of the current ALMA. Many interesting nearby ULIRGs in the IRAS 1 Jy sample are at 0.05 (Kim & Sanders, 1998).
Higher J-transition lines at higher frequencies (shorter wavelengths) can be covered with ALMA for higher redshift sources. More importantly, higher J-transition lines probe denser and warmer molecular gas, due to higher critical density and excitation energy level, than lower J-transition lines (Shirley, 2015). Given that dense, warm molecular gas locates preferentially in the nuclear regions of galaxies, molecular emission line flux ratios at higher-J should be more sensitive to the properties of molecular gas in close vicinity to the ULIRG’s nuclear primary energy sources (a few kpc), with small contaminations from low dense and cool molecular gas in the spatially extended (3 kpc) host galaxies. Given that the J=2–1 lines of HCN and HCO+ for nearby sources at 0.15 were not observable before ALMA Cycle 4 (due to the unavailability of band 5 [163–211 GHz] at that time), we started our dense molecular line observations of nearby ULIRGs at J=4–3 (Imanishi & Nakanishi, 2014; Izumi et al., 2016; Imanishi et al., 2018) and J=3–2 (Imanishi et al., 2016c). We decided to expand our HCN and HCO+ line survey of nearby ULIRGs at J=3–2 in band 6 (211–275 GHz) for the following reasons. First, due to less requirements for weather conditions in band 6, the chance of program execution is higher than that in band 7 (275–373 GHz) where J=4–3 lines of HCN and HCO+ are observable for nearby sources. Second, at J=3–2, in addition to the widely used HCN and HCO+ rotational J-transition lines at the vibrational ground level (v=0), we can simultaneously cover the vibrationally excited (v2=1f) emission lines of both HCN and HCO+ in ALMA band 6, which can provide additional signatures of luminous buried AGNs surrounded by a large column density of dense molecular gas and dust (1).
Assuming a fixed HCN J=3–2 to J=1–0 flux ratio, we ordered ULIRGs in the IRAS 1 Jy sample at 0.15 and declinations +20∘, from the highest infrared flux. We selected 26 sources with infrared fluxes above a certain threshold, which are summarized in Table 1. Of these, HCN J=3–2 and HCO+ J=3–2 emission line data of three ULIRGs (IRAS 121120305, IRAS 204141651, and IRAS 224911808) had been obtained during ALMA Cycle 2 or 3 (Imanishi et al., 2016c). We thus observed the remaining 23 ULIRGs in Cycle 5. These 26 ULIRGs were selected solely based on the infrared flux (or expected nuclear HCN J=3–2 emission line flux). This flux limited sample was complete and unbiased with respect to the energetic importance of optically elusive, but infrared-detected, buried AGNs.
3 Observations and Data Analyses
Our HCN J=3–2 and HCO+ J=3–2 observations of 23 ULIRGs in band 6 (211–275 GHz) were conducted using our ALMA Cycle 5 program 2017.1.00057.S (PI = M. Imanishi). The observation details are summarized in Table 2. Observations of the majority of the ULIRGs were conducted in 2017 December with the longest baseline of 2500 m, excluding IRAS 213292346 and IRAS 222062715 whose observations were made in 2018 April with the 500 m longest baseline. We adopted the widest 1.875 GHz width mode and three spectral windows to simultaneously cover HCN J=3–2 ( = 265.886 GHz), HCO+ J=3–2 ( = 267.558 GHz) and HCN v2=1f J=3–2 ( = 267.199 GHz), and HCO+ v2=1f J=3–2 ( = 268.689 GHz) lines in each of the windows.
We started our data reduction from calibrated data provided by ALMA, using CASA (https://casa.nrao.edu). Based on channels that did not show obvious emission and/or absorption lines, we determined the continuum level, and subtracted it using the CASA task “uvcontsub”. Then we applied the “clean” task (Briggs-weighting; robust 0.5 and gain 0.1) for the continuum-only and continuum-subtracted molecular line data to create maps. The final velocity resolution was 20 km s-1. The pixel scales were 002 pixel-1 for the majority of the observed ULIRGs with a final synthesized beam size of 01–02 (150–530 pc), except IRAS 213292346 and IRAS 222062715, for which 004 pixel-1 was adopted due to the larger (06–08 or 1.3–1.7 kpc) synthesized beam sizes. According to the ALMA Cycle 5 Proposer’s Guide, the maximum recoverable scale (MRS) is 1–3′′ (1.4–7.5 kpc) for sources with 01–02 synthesized beam sizes and 7–9′′ (15–21 kpc) for the two sources with 06–08 synthesized beam sizes. Diffuse continuum and molecular line emission with a spatial scale larger than the MRS can be missed in our ALMA data. The absolute flux calibration uncertainty of band 6 data is expected to be 10% in ALMA Cycle 5.
4 Results
Figure 1 and Table 3 show the continuum maps and detailed continuum emission properties, respectively. Significant continuum emission was detected from all sources, except IRAS 104851447 and IRAS 024110353. Multiple continuum emission components are clearly seen in the five ULIRGs IRAS 041032838 (Fig. 1c), IRAS 090390503 (Fig. 1d), IRAS 110950238 (Fig. 1f), IRAS 133352612 (Fig. 1g), and IRAS 143481447 (Fig. 1h). Other specific comments on the continuum emission for several selected sources are provided in the Appendices A and D.
Figure 2 (left) displays the continuum-subtracted full frequency coverage spectra at the continuum peak position within the synthesized beam size. Gaussian fits for the detected HCN J=3–2 and HCO+ J=3–2 emission lines were applied, after removing data points possibly affected by other emission and/or absorption features, and fitting results are listed in Tables 4 and 5, respectively. The best Gaussian fits are shown in the Appendix B. Figure 3 shows integrated intensity (moment 0) maps of the HCN J=3–2 and HCO+ J=3–2 emission lines, by summing velocity channels with significant line signals. The peak flux values of the HCN J=3–2 and HCO+ J=3–2 emission lines in the moment 0 maps are summarized in Tables 4 and 5, respectively. These values roughly agree with the Gaussian fit estimates (columns 2 and 8 in Tables 4 and 5). For the HCN J=3–2 and HCO+ J=3–2 emission line fluxes, Gaussian fit estimates will be used in our discussion. For the HCO+ J=3–2 emission line flux estimates, possible contamination from the nearby vibrationally excited (v2=1f) HCN J=3–2 emission lines cannot be completely removed. However, their contributions should be negligible given much smaller fluxes than the HCO+ J=3–2 emission line fluxes (see 5.2).
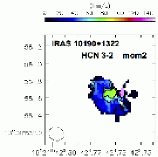
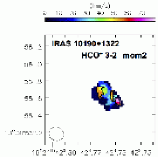
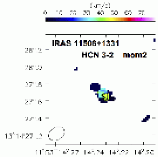
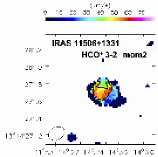
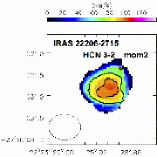
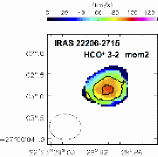
Intensity-weighted mean velocity (moment 1) and intensity-weighted velocity dispersion (moment 2) maps for HCN J=3–2 and HCO+ J=3–2 emission lines are shown in the Appendix C for selected ULIRGs with bright molecular lines.
Table 6 tabulates the estimated intrinsic emission sizes of the ALMA-detected continuum, HCN J=3–2, and HCO+ J=3–2 lines after deconvolution, using the CASA task “imfit”. These values will be used for the comparison of the spatial extents of molecular line and continuum emission, with respect to beam sizes. For most of the sources observed with small beam sizes (01–02 or 150–530 pc in physical scale), the deconvolved intrinsic emission sizes are significantly larger than the beam sizes, suggesting that the emission is spatially resolved. We extracted spectra within 1′′ (1.4–2.5 kpc) diameter circular apertures around the continuum peak positions, which are displayed in Figure 2 (right). This aperture size was adopted, as ULIRG’s continuum and dense molecular line emission are usually concentrated in compact nuclear (a few kpc) regions (e.g.) (Wilson et al., 2008; Imanishi & Nakanishi, 2014; Scoville et al., 2015; Tunnard et al., 2015; Martin et al., 2016; Imanishi et al., 2016c; Sakamoto et al., 2017; Manohar & Scoville, 2017; Sliwa & Downes, 2017; Barcos-Munoz et al., 2017, 2018; Imanishi et al., 2018). IRAS 090390503 (Figs. 3g and 3h) and IRAS 110950238 (Figs. 3k and 3l) show double nuclear molecular line emission with the separation of 05, for which we created spatially integrated spectra with 15 diameter circular apertures centered at the middle point of the two nuclei, to include emission from both nuclei (Figs. 2d’ and 2h’). In general, the molecular line peak fluxes are higher in these spatially integrated spectra than the peak-position beam-sized spectra (Fig. 2, left), due to the contribution from spatially resolved (a few 100 pc to a few kpc) nuclear emission components.
For IRAS 213292346, IRAS 222062715, IRAS 121120305, IRAS 204141651, and IRAS 224911808 which were observed with larger beam sizes (05–09 or 0.9–1.7 kpc), we created spatially integrated spectra with 15 or 2′′ diameter circular apertures (Figs. 2o’, 2aa’, 2ab’, 2ac’, 2ad’, and 2ae’). For these five ULIRGs, the flux increase from the peak position within the beam size (Tables 4 and 5), to the integrated area (Table 7), is relatively modest (20–30%) compared to other ULIRGs observed with small 01–02 synthesized beam sizes, as expected, because the bulk of molecular line fluxes in these five ULIRGs have already been covered in the peak-position beam-sized spectra.
Figure 4 compares the intrinsic deconvolved size of continuum versus HCN J=3–2 and HCO+ J=3–2 emission lines (left) and HCN J=3–2 vs. HCO+ J=3–2 (right). While the HCN J=3–2 line emission size is comparable to the continuum emission size (Fig. 4, left), the emission size of the HCO+ J=3–2 line is larger overall than those of the continuum and HCN J=3–2 line (Fig. 4, left and right). The more spatially extended emission for HCO+ J=3–2 than for HCN J=3–2 is reasonable, given that the critical density of HCO+ J=3–2 is a factor of 5 smaller than that of HCN J=3–2 (Shirley, 2015). Thus, HCO+ can be collisionally excited to J=3 to a greater extent than HCN by spatially extended low-density and low-temperature molecular gas (compared to nuclear dense, warm molecular gas).
5 Discussion
5.1 HCN-to-HCO+ J=3–2 Flux Ratios
Table 8 tabulates the HCN-to-HCO+ J=3–2 flux ratios based on Gaussian fit measurements in the nuclear beam-sized spectra and spatially integrated spectra for the 24 ULIRGs with significant dense molecular line detection in both spectra, excluding IRAS 104851447 and IRAS 024110353. These measurements are compared in Figure 5. The ratios in the beam-sized spectra at the nuclear peak position tend to be higher than those in the spatially integrated spectra, because most objects are located below the thick solid line in Fig. 5. This suggests that the HCN-to-HCO+ J=3–2 flux ratios are generally higher at the compact nuclear cores than in spatially resolved regions.
To better investigate the enhanced HCN J=3–2 emission at the compact nuclear cores, we created maps of the ratios of the HCN J=3–2 to HCO+ J=3–2 flux (in Jy km s-1) for ULIRGs observed with small (01–02) beam sizes (Fig. 6). ULIRGs observed with larger beam sizes (05–09) are not plotted, as we were unable to obtain meaningful information regarding the spatial variation in the HCN-to-HCO+ J=3–2 flux ratios. If an AGN produces stronger HCN emission than star formation (1), it is expected that the HCN-to-HCO+ J=3–2 flux ratios are higher at the compact nuclear cores where AGNs reside than in spatially resolved off-nuclear regions where star formation is usually energetically dominant. This trend is clearly seen in the nearby well-studied optically identified luminous AGN, NGC 7469 (z = 0.016), in which the HCN-to-HCO+ J=3–2 flux ratio is significantly higher at the AGN-dominated nuclear core than off-nuclear bright star-forming knots (Fig. 6a). In Figure 6, HCN-to-HCO+ J=3–2 flux ratios in nearby ULIRGs are also generally higher in the compact nuclear cores than the spatially resolved regions. AGN effects are a plausible scenario. In fact, an enhanced HCN abundance, relative to HCO+, in molecular gas in the close vicinity of luminous AGNs is observationally suggested (Nakajima et al., 2018; Imanishi et al., 2018; Saito et al., 2018), which can explain the elevated HCN emission of compact nuclear cores 111 A decreased HCO+ abundance is another possibility and is argued in highly turbulent regions (Papadopoulos, 2007). However, we regard that this could happen in wide areas of merging ULIRGs, rather than only at the compact nuclear cores. . Alternatively, the volume number density and temperature of molecular gas are expected to be very high in the nuclei of ULIRGs (Scoville et al., 2015). More HCN collisional excitation by nuclear dense and warm molecular gas than in the spatially resolved regions (Imanishi et al., 2018) can explain the observed HCN J=3–2 flux enhancement in ULIRG’s nuclei as well. ALMA multiple J-transition HCN and/or HCO+ observations (e.g., J=2–1 and J=4–3, in addition to J=3–2) with similar beam sizes (01–02) are needed to constrain the spatial variation in molecular gas density and temperature, and thereby excitation conditions, in the observed ULIRGs. It is also possible that mechanical heating by shocks caused by spatially compact nuclear outflows (Aalto et al., 2012, 2017; Privon et al., 2017; Barcos-Munoz et al., 2018) contributes a lot for the observed nuclear molecular line flux ratios. An AGN is a plausible origin for such a compact outflow (Aalto et al., 2012, 2017), but a very compact starburst remains an alternative origin.
Several ULIRGs show higher HCN-to-HCO+ J=3–2 flux ratios in off-nuclear local regions than the nuclear cores. Examples include IRAS 232340946 and IRAS 010042237, in which excesses in the HCN-to-HCO+ J=3–2 flux ratios are found both at the southeastern and northwestern sides of nuclei in Figures 6l and 6o. Such off-nuclear local regions with enhanced HCN-to-HCO+ J=3–2 flux ratios are also seen in the western part of the nuclei for IRAS 001880856 and IRAS 012980744 (Figs. 6b and 6q). Although molecular line emission is generally fainter in off-nuclear edge regions than in nuclei, we display in Figure 6 only regions with 3 HCO+ J=3–2 emission line detection in the moment 0 maps in Figure 3. Mechanical heating by spatially extended outflow-related shocks may be responsible for these high HCN-to-HCO+ J=3–2 flux ratios at off-nuclear regions (Izumi et al., 2013). It is also possible that molecular gas becomes locally dense and warm in off-nuclear regions through merger-induced processes.
Figure 7 is a plot of the nuclear HCN-to-HCO+ J=3–2 flux ratios as a function of the infrared spectroscopically estimated AGN bolometric contribution (Nardini et al., 2010). ULIRGs with significant infrared-estimated AGN contributions tend to show HCN-to-HCO+ J=3–2 flux ratios larger than unity, as expected for AGN-important galaxies (Krips et al., 2008; Imanishi et al., 2016c). Not only the infrared-identified AGN-significant ULIRGs but also the majority of ULIRGs with no significant infrared-detected AGNs show HCN J=3–2 emission stronger than HCO+ J=3–2 emission. The HCN-to-HCO+ J=3–2 flux ratios in known-starburst-dominated regions (mostly less infrared luminous than ULIRGs) are usually less than unity (Krips et al., 2008; Imanishi et al., 2016c). Plausible scenarios include (a) the presence of infrared-elusive but (sub)millimeter-detectable extremely deeply buried ( 1 at infrared 2.5–35 m) luminous AGNs and their effects to nuclear molecular line fluxes (including both AGN radiative effects and mechanical heating by AGN-related compact outflow shocks) and/or (b) more HCN excitation to J=3 than in less infrared luminous starburst galaxies due to dense and warm molecular gas in ULIRG’s nuclei.
5.2 Vibrationally Excited HCN J=3–2 Emission Lines
Vibrationally excited (v2=1f) HCN J=3–2 emission lines at = 267.199 GHz were detected in several buried-AGN-hosting infrared luminous galaxies and such candidates (Sakamoto et al., 2010; Aalto et al., 2015a, b; Martin et al., 2016; Imanishi et al., 2016b). This emission is believed to be vibrationally excited by infrared radiative pumping, by absorbing 14 m infrared photons, rather than collisionally excited (Sakamoto et al., 2010; Aalto et al., 2015b). Because an AGN can emit 14 m infrared photons more efficiently than star formation for given bolometric luminosity, due to AGN-heated hot dust thermal radiation, detection of the strong HCN v2=1f J=3–2 emission line can be used to argue for the presence of a luminous AGN, particularly if the HCN v2=1f J=3–2 to HCN J=3–2 (v=0) and/or infrared luminosity ratio is significantly larger than those found in pure star-forming regions (Aalto et al., 2015b; Imanishi et al., 2016c, 2017). We thus searched for signatures of the HCN v2=1f J=3–2 emission line.
The detection of the HCN v2=1f J=3–2 emission line is straightforward if the molecular line widths are small, say 200 km s-1 full width at half maximum (FWHM), because we can clearly separate the contribution from the nearby strong HCO+ J=3–2 (v=0) emission line at = 267.558 GHz (400 km s-1 separation) (Sakamoto et al., 2010; Aalto et al., 2015b; Martin et al., 2016; Imanishi et al., 2016b). However, the detection is not easy for the majority of ULIRGs whose molecular line widths are usually large. The nuclear beam-sized spectra of IRAS 103781108, IRAS 110950238 NE, IRAS 143481447 SW, and IRAS 160900139 show possible signatures of the excess emission on the lower-frequency side of the HCO+ J=3–2 line emission (Figs. 2f, 2h, 2l, and 2n), which may be attributable to the contribution from the HCN v2=1f J=3–2 emission line. We compared the emission line profiles of HCN J=3–2 and HCO+ J=3–2 in detail, after normalizing peak flux values, and looked for sources that showed significant flux excess at the lower-frequency (high-velocity) side of the HCO+ J=3–2 line, compared to the HCN J=3–2 line. IRAS 103781108 and IRAS 110950238 NE may correspond to such cases (Fig. 8). If the excess is due to the vibrationally excited HCN v2=1f J=3–2 emission line, then its estimated fluxes are roughly 0.1 (Jy km s-1) for both sources. The HCN v2=1f to v=0 flux ratios at J=3–2 are 0.05, which is as high as an AGN-hosting ULIRG with a clearly detected HCN v2=1f J=3–2 emission line (i.e., IRAS 205514250) (Imanishi et al., 2016b, 2017), but smaller than other such ULIRGs (Aalto et al., 2015b; Martin et al., 2016).
The detection rate of the HCN v2=1f J=3–2 emission line in ULIRGs observed in ALMA Cycle 5 is at most 9 % (=2/23). Because IRAS 121120305 NE and IRAS 224911808, and possibly IRAS 204141651, observed in ALMA Cycle 2 or 3, display some signs of the HCN v2=1f J=3–2 emission lines (Imanishi et al., 2016c), the detection rate in the complete sample could be as high as 19 % (=5/26), which is still low. However, wide molecular emission lines in ULIRGs preclude the identification of the faint HCN v2=1f J=3–2 emission line inside the emission tail of the bright HCO+ J=3–2 (v=0) emission line. The limited S/N ratios can also hamper the recognition of the HCN v2=1f J=3–2 emission line. The actual fraction of ULIRGs showing the HCN v2=1f J=3–2 emission lines could be higher. It is also possible that emission from the vicinity of a buried AGN is opaque even to the (sub)millimeter continuum (Aalto et al., 2015b), in which case the equivalent width of the HCN v2=1f J=3–2 emission line could be low. If this were the case, it would mean that luminous buried AGNs can be elusive even through (sub)millimeter observations.
The signatures of the HCO+ v2=1f J=3–2 ( = 268.689 GHz) emission lines were searched for in the obtained ALMA spectra, but were not detected clearly in any of the observed ULIRGs.
5.3 Molecular Inflow and Outflow
IRAS 000910738 (Fig. 2q) shows double-peaked emission line profiles for HCN J=3–2 and HCO+ J=3–2. For HCO+ J=3–2, because the flux at the central dip is below the continuum level, the double-peaked profile of the HCO+ J=3–2 emission line cannot be solely due to rotation (Scoville et al., 2017) or self-absorption (Aalto et al., 2015b). Foreground absorption in front of the molecular line-emitting region is required at least for HCO+ J=3–2. We created an integrated intensity (moment 0) map of this HCO+ J=3–2 absorption component only (below the continuum level) and confirmed that the peak position of this absorption component spatially agrees with the continuum emission peak position in Table 3, supporting the foreground absorption scenario. IRAS 010042237 (Fig. 2s) also displays an absorption feature at the lower-frequency side of the HCO+ J=3–2 emission line. This absorption peak position is also spatially coincident with the continuum emission peak position in Table 3 within 1 pixel (002). These absorption features may be related to inflowing and/or outflowing molecular gas.
Molecular outflow signatures in nearby ULIRGs are usually seen as broad emission wings for bright molecular lines, mostly in CO J-transition lines (e.g.) (Maiolino et al., 2012; Cicone et al., 2014; Garcia-Burillo et al., 2015; Veilleux et al., 2017; Imanishi et al., 2017; Pereira-Santaella et al., 2018). The detection of the broad emission line wings in the HCN and HCO+ lines in nearby ULIRGs has been limited (Aalto et al., 2015a; Privon et al., 2017; Barcos-Munoz et al., 2018), simply due to the fainter emission line fluxes of these dense gas tracers compared to the brightest CO lines. The broad emission wings in HCN J=3–2 and HCO+ J=3–2 lines were not clearly seen in any of the observed ULIRGs in this paper (Fig. 2).
5.4 Nuclear Dense Molecular Mass
The luminosities of the HCN J=3–2 and HCO+ J=3–2 emission lines are summarized in Table 9; equations (1) and (3) of Solomon & Vanden Bout (2005) were used for the calculations from the estimated fluxes in spatially integrated (1–2′′) spectra (Table 7). These luminosities can be converted into the mass of dense (105 cm-3) molecular gas within the nuclear (a few kpc) regions of the observed ULIRGs. When molecular gas emission lines are optically thick and thermally excited, i.e., where the excitation temperature Tex equals the gas kinetic temperature Tkin (Tex Tkin), the molecular line luminosities in units of [K km s-1 pc2] should be comparable with respect to different J-transition lines. The conversion factor from molecular line luminosity to dense molecular gas mass is estimated to be =6–40 for HCN J=1–0 in various starbursts and AGNs (Mdense = 6–40 HCN J=1–0 luminosity [M⊙ (K km s-1 pc2)-1]) (Gao & Solomon, 2004a; Krips et al., 2008; Greve et al., 2009; Leroy et al., 2015). Although the value has some uncertainty, assuming the lower range of = 10, the derived dense molecular gas mass from the HCN J=3–2 emission line luminosity is as high as 109M⊙ for the observed nearby ULIRGs, except IRAS 104851447, IRAS 024110353, and IRAS 121120305 SW. Because the conversion factor () is estimated to be comparable for HCN J=1–0 and HCO+ J=1–0 (Leroy et al., 2015, 2017), we obtain similarly a high dense molecular gas mass of 109M⊙ from the HCO+ J=3–2 emission line luminosity. When HCN and HCO+ are only sub-thermally excited at J=3–2 (Tex Tkin), the luminosity in units of [K km s-1 pc2] is expected to be higher at J=1–0 than at J=3–2, so that the dense molecular gas mass will be even higher. The observed nearby ULIRGs are dense molecular gas-rich in the nuclear few-kpc regions.
The total molecular mass within a certain volume is often estimated from CO J=1–0 and/or CO J=2–1 emission line luminosities (Bolatto et al., 2013). For IRAS 143481447 SW and NE and IRAS 121120305 NE and SW, the total molecular mass in the nuclear regions (using the adopted cosmological parameters in Table 1) are estimated to be 12 109M⊙, 7.4 109M⊙, 11 109M⊙, and 3.6 109M⊙, respectively, from pre-ALMA interferometric CO J=1–0 observations (Evans et al., 2000, 2002). The dense molecular masses estimated from HCN J=3–2 data (Table 9, column 4) are 5.2 109M⊙, 3.0 109M⊙, 4.8 109M⊙, and 0.3 109M⊙, respectively, where =10 is assumed conservatively and the lower limit means that HCN could be sub-thermally excited at J=3–2. With the exception of the faint secondary nucleus, IRAS 121120305 SW, dense molecular gas masses can account for the bulk of the nuclear total molecular masses. For IRAS 224911808, we can estimate the nuclear total molecular gas mass from the ALMA-measured CO J=2–1 flux of 57.40.1 (Jy km s-1) (Pereira-Santaella et al., 2018) to be 6 109M⊙, where the conversion factor from CO luminosity in (K km s-1 pc2) to molecular gas mass with =1.5 (Evans et al., 2002) and optically thick thermal excitation for CO J=2–1 (Tex Tkin) are assumed. The dense molecular mass based on HCN J=3–2 data (Table 9, column 4) is 4.3 109M⊙, which is as high as the total molecular mass in the IRAS 224911808 nucleus. Comparisons of the nuclei of these selected ULIRGs suggest that dense gas is the dominant molecular phase in the nuclei of nearby ULIRGs in general.
5.5 Relation between Dense Molecular Line and Infrared Luminosity
For energy sources surrounded by dense molecular gas and dust as in the nuclear regions of ULIRGs, whatever the energy sources are (either buried AGNs and/or nuclear starbursts), HCN and HCO+ emission line luminosities (=mass tracers of dense molecular gas excited by energy sources) are expected to roughly correlate with infrared luminosity (=mass tracer of infrared continuum emitting dust heated by energy sources) at a first approximation, because these luminosities become higher for more luminous energy sources (2). Their correlation has been found in Galactic star-forming regions and various types of external galaxies (Gao & Solomon, 2004a; Wu et al., 2005; Evans et al., 2006; Gracia-Carpio et al., 2008; Ma et al., 2013; Zhang et al., 2014; Liu et al., 2016; Tan et al., 2018; Imanishi et al., 2018). Figure 9 shows a comparison of the HCN J=3–2 and HCO+ J=3–2 emission line luminosities measured with 1–2′′ diameter circular apertures, with IRAS-measured infrared luminosity. As the energetically essential nuclear regions (a few kpc) of nearby ULIRGs are covered (2), the bulk of dense molecular gas emission in individual sources is expected to be included in our ALMA measurements.
The best-fits for HCN J=4–3, HCO+ J=4–3, and HCN J=1–0 (Gao & Solomon, 2004b; Zhang et al., 2014; Tan et al., 2018) are plotted together. For sub-thermal excitation at J=4–3, the best-fit lines at J=4–3 should be at the left side of those at J=1–0. This is the case both for HCN and HCO+. For HCN, our data at J=3–2 are located to the right of the best-fit lines for J=4–3 (solid and dotted straight lines in Fig. 9a), but left of that for J=1–0 (dashed straight line in Fig. 9a). These trends can be explained if HCN is sub-thermally excited at J=3–2 and J=4–3, and the deviation below the thermal excitation is larger at J=4–3 than at J=3–2. For HCO+, the two best-fit lines for J=4–3 (Zhang et al., 2014; Tan et al., 2018) are largely different, possibly because of different individual sources used for the fitting; however, our HCO+ J=3–2 data are located on the left side of the best-fit line for J=1–0 (dashed straight line in Fig. 9b). Sub-thermal HCO+ excitation at J=3–2 is indicated.
HCN J=3–2 emission in these ULIRGs is estimated to be sub-thermally excited, and yet shows higher HCN-to-HCO+ J=3–2 flux ratios than known less-infrared luminous starburst-dominated galaxies (5.1). This suggests that in the comparison starburst sample, the ratio of HCN J=3–2 excitation temperature to molecular gas kinetic temperature (Tex/Tkin) is even lower (more sub-thermal further below thermal excitation) than the observed ULIRGs.
5.6 Spatially Integrated Continuum Emission and Spectral Energy Distribution
Table 10 summarizes spatially integrated continuum fluxes for the observed ULIRGs. The same aperture size as employed for molecular line flux measurement (Table 7) is used for individual sources. Namely, a circular aperture with a diameter of 1–2′′ is adopted, depending on the synthesized beam size and emission morphology. The spatially integrated continuum fluxes shown in Table 10 are substantially (a factor of 1.5–6) larger than the continuum fluxes at the nuclear peak positions within the beam size listed in Table 3, particularly for sources observed with small (01–02 or 150–530 pc) beam sizes, suggesting the presence of a strong, spatially resolved (a few 100 pc to a few kpc) continuum emission component at 240 GHz. While the continuum emission from a compact nuclear core should come from an AGN and/or very compact (500 pc) starbursts, the spatially resolved continuum emission is most likely to come from a few kpc-scale starburst activity. The following three physical mechanisms in starbursts can contribute to the observed spatially resolved continuum fluxes: (1) dust thermal radiation, (2) free-free emission from HII-regions, and (3) synchrotron radiation. Although the third synchrotron radiation component is important at lower frequencies (20 GHz), 240 GHz continuum emission from starbursts is usually dominated by dust thermal radiation and free-free emission. We thus estimated these two components.
For a small fraction of the observed ULIRGs, there are photometric data by Herschel at 250 m, 350 m, and 500 m (Clements et al., 2018), which are usually dominated by dust thermal radiation. These data, together with IRAS 60 m and 100 m fluxes and our ALMA spatially integrated continuum fluxes at 240 GHz (1250 m), are plotted in Figure 10. Although the aperture sizes of the Herschel and IRAS data are much larger, our ALMA measurements roughly agree with the extrapolation from the shorter-wavelength Herschel and IRAS data (Clements et al., 2018), supporting the scenario that nearby ULIRGs are energetically dominated by compact nuclear (a few kpc) regions (Soifer et al., 2000; Diaz-Santos et al., 2010; Imanishi et al., 2011), and that our ALMA data recover the bulk of the nuclear continuum emission. The ALMA data point in IRAS 110950238 (Figure 10c) is significantly higher than the extrapolation, which may indicate a significant contribution from additional free-free emission. For IRAS 224911808 (Figure 10g), the ALMA data point is slightly below the extrapolation, which may be due to the fit because (1) the longest wavelength Herschel data point is also below the fit and (2) the maximum recoverable scale is large (i.e., ALMA missing flux is expected to be small) among the observed ULIRGs (3). For the remaining ULIRGs, such Herschel photometric measurements are not reported, which hampers the reliable estimate of the contribution from the dust thermal radiation at 240 GHz.
On the other hand, the contributions from the free-free emission in HII-regions can be estimated for all sources, from the far-infrared (40–500 m) luminosities obtained from IRAS data (Table 1). The flux of the free-free emission from HII-regions (in mJy) is expressed as
| (1) |
(Nakanishi et al., 2005), where D is the luminosity distance (in Mpc), Te is the electron temperature (in K), is the frequency (in GHz), and LFIR is the far-infrared luminosity (in L⊙). In fact, an AGN can also contribute to the far-infrared luminosity, so that the actual free-free continuum flux from HII-regions in starbursts is even smaller. These estimates of the free-free emission are shown in Table 10 (column 3), where Te = 104 K is assumed. In the majority of the observed ULIRGs, the observed continuum flux is significantly higher than the upper limit of the free-free emission from HII-regions in starbursts, suggesting that dust thermal radiation has an important contribution at 240 GHz.
No clear continuum emission was detected at the nuclear peak positions of IRAS 104851447 and IRAS 024110353. For both sources, we obtained continuum fluxes within a 1′′ diameter circular aperture of 2 mJy at 240 GHz, whereas the estimated free-free continuum fluxes at 240 GHz from the far-infrared luminosity measured with IRAS’s large aperture (60′′) are 0.5 mJy. The faint continuum fluxes in IRAS 104851447 and IRAS 024110353, as measured with our ALMA data, do not pose any serious inconsistencies.
For IRAS 104851447, radio synchrotron emission is detected with fluxes of 6.45 mJy and 3.37 mJy at 1.4 GHz and 4.8 GHz, respectively (Baan & Klckner, 2006). By fitting these radio data with a power law function and extrapolating to our ALMA frequency, the synchrotron emission component at 240 GHz is estimated to be 0.4 mJy, which is again sufficiently small compared to the observed flux upper limit. It is possible that the observed 1.4 GHz flux is significantly attenuated by free-free absorption. If we make a power law fit using an intrinsic 1.4 GHz flux, the extrapolated synchrotron emission flux at 240 GHz will be even smaller.
6 Summary
We presented our ALMA Cycle 5 observational results of the complete sample of 26 nearby ( 0.15) ULIRGs with no obvious signatures of optically detectable luminous AGNs, in the HCN J=3–2 and HCO+ J=3–2 lines. The sample was selected from the IRAS 1 Jy sample, based on the declination of +20∘ and infrared flux above a certain threshold to secure sufficiently high nuclear dense molecular emission line peak flux. The majority of the ULIRGs were observed with a 01–02 (150–530 pc) synthesized beam size; 05–09 (0.9–1.7 kpc) was used for the remaining small fraction of ULIRGs. We found the following main results.
-
1.
The continuum, HCN J=3–2, and HCO+ J=3–2 emission lines were spatially resolved in the majority of the observed ULIRGs. The HCN J=3–2 and continuum emission sizes are roughly comparable; however, HCO+ J=3–2 emission is spatially more extended than the HCN J=3–2 emission. This can naturally be explained by the smaller critical density of HCO+ J=3–2 than that of HCN J=3–2, where low density and temperature molecular gas in spatially resolved regions outside compact nuclear cores can collisionally excite HCO+ to J=3 more than HCN, and produce stronger HCO+ J=3–2 emission there.
-
2.
The HCN-to-HCO+ J=3–2 flux ratios at the compact nuclear cores of the ULIRGs, within the beam size, are generally higher than (a) unity, (b) those seen in less-infrared luminous starburst-dominated galaxies, and (c) those in spatially integrated areas of the same ULIRGs measured with 1–2′′ diameter circular apertures. For ULIRGs observed with small synthesized beam sizes with 01–02, we created the maps of the HCN-to-HCO+ J=3–2 flux ratios and investigated their spatial variation. In the majority of the ULIRGs, the regions of elevated HCN-to-HCO+ J=3–2 flux ratios spatially coincide with nuclear cores. It is likely that the putative buried AGNs and/or high HCN collisional excitation by dense and warm molecular gas at the nuclear cores are responsible for the enhanced HCN emission there. Mechanical heating by shocks originated in spatially compact nuclear outflows can also contribute.
-
3.
Several ULIRGs show higher HCN-to-HCO+ J=3–2 flux ratios at off-nuclear local regions than the nuclear cores, which is difficult to explain with the above scenario. Mechanical heating by spatially extended outflow-origin shock activity may be responsible.
-
4.
We estimated that in the majority of the observed ULIRGs, dense (105 cm-3) molecular gas mass within the nuclear few kpc regions is as high as 109M⊙, based on the observed HCN J=3–2 and HCO+ J=3–2 emission line luminosities, suggesting that nearby ULIRG’s nuclei are dense molecular gas rich. For selected ULIRGs with available nuclear total molecular masses based on interferometric CO J-transition line data, dense molecular masses can be as high as the nuclear total molecular masses in most cases, suggesting that dense gas is a dominant molecular phase in nearby ULIRG’s nuclei.
-
5.
A comparison of the HCN J=3–2 and HCO+ J=3–2 emission line luminosities with infrared luminosity suggests that HCN and HCO+ are only sub-thermally excited at J=3–2. Even with this sub-thermal HCN J=3–2 excitation in ULIRGs, their HCN-to-HCO+ J=3–2 flux ratios are higher than starburst galaxies. The ratios of HCN J=3–2 excitation temperature to molecular gas kinetic temperature (Tex/Tkin) in the comparison starburst sample are suggested to be even smaller than the ULIRG sample.
-
6.
Signatures of the excess emission at the lower-frequency side of the HCO+ J=3–2 (v=0) emission lines are recognizable in IRAS 103781108 and IRAS 110950238, in addition to three ULIRGs reported in Imanishi et al. (2016c) (IRAS 121120305, IRAS 204141651, and IRAS 224911808), out of the 26 observed ULIRGs. The excess emission can be due to contributions from vibrationally excited (v2=1f) HCN J=3–2 emission lines. The HCN v2=1f to v=0 flux ratios at J=3–2 could be as high as an AGN-hosting ULIRG with a clearly detected HCN v2=1f J=3–2 emission line. If the HCN vibrational excitation to v2=1f is due to infrared radiative pumping, by absorbing infrared 14 m photons coming from AGN-heated hot dust grains, these five ULIRGs may contain (sub)millimeter-detectable deeply buried AGNs. The low detection rate (5/26 19) of the signatures of the HCN v2=1f J=3–2 emission lines may be due to the combination of limited signal to noise ratios and large molecular line widths in ULIRGs that hamper the identification of faint HCN v2=1f J=3–2 emission lines, by clearly separating from the nearby much brighter HCO+ J=3–2 (v=0) emission lines. Signatures of the HCO+ v2=1f J=3–2 emission lines were not seen in any of the observed ULIRGs.
-
7.
High HCN-to-HCO+ J=3–2 flux ratios are found in (a) all ULIRGs with significant (20) energetic contributions from infrared-spectroscopically identified luminous buried AGNs, and (b) some fraction of ULIRGs without such infrared-identified luminous buried AGNs. Although the HCN v2=1f J=3–2 emission lines (=another potential AGN indicator) were not clearly detected in the majority of these ULIRGs, if the observed high HCN-to-HCO+ J=3–2 flux ratios are due to AGN effects (including both AGN radiation feedback and mechanical feedback by AGN-origin compact nuclear outflows), then our (sub)millimeter molecular line method (a) provides a consistent picture with the infrared spectroscopic method about the presence of energetically significant luminous buried AGNs for the former ULIRGs, and (b) may suggest the presence of infrared-elusive but (sub)millimeter-detectable extremely deeply buried luminous AGNs for the latter ULIRGs.
-
8.
Molecular outflows have usually been discussed based on the detection of broad components in the bright CO emission lines, but no such broad components were clearly seen in the HCN J=3–2 and HCO+ J=3–2 emission lines in the observed ULIRGs.
-
9.
Spatially integrated continuum fluxes at 240 GHz are significantly higher than the estimated free-free emission fluxes from HII-regions in spatially resolved (a few kpc) starbursts, suggesting that thermal radiation from dust contributes significantly to the continuum flux in band 6 (240 GHz).
Appendix A Comments on Continuum Emission for Selected Galaxies
For IRAS 041032838, the HCN J=3–2 and HCO+ J=3–2 emission line peaks are significantly displaced from the continuum peak (04 12 19.445, 28 30 25.00)ICRS (Fig. 1c). The spectrum in Figure 2c was extracted at the peak position of the HCN J=3–2 and HCO+ J=3–2 emission lines.
IRAS 090390503 is a single-nucleus ULIRG in seeing-sized optical and near-infrared K-band (2.2 m) images (Kim et al., 2002). However, our high-spatial-resolution ALMA molecular line and continuum data reveal double nuclear morphology (SW and NE), with 05 separation in Figures 1d, 3g, and 3h. The spectra shown in Figures 2d and 2e were extracted for both nuclei separately.
IRAS 110950238 is also a single-nucleus ULIRG in the optical and near-infrared (Kim et al., 2002); however, our ALMA data show a faint secondary emission component in the 05 southwestern part of the main nucleus in the continuum and HCO+ J=3–2 line maps (Figs. 1f and 3l). The HCO+ J=3–2 emission line shows a significant feature in-between these two continuum-emitting regions in IRAS 110950238 (Fig. 1f).
For IRAS 011660844, continuum and molecular line emission were detected at the SE nucleus, but not at the NW nucleus (Kim et al., 2002).
For IRAS 104851447, neither the continuum nor HCN J=3–2 and HCO+ J=3–2 emission lines were detected. No detectable CO J=1–0 emission line was seen in pre-ALMA interferometric observations (Dinh-V-Trung et al., 2001). Thus, IRAS 104851447 may be deficient in molecular gas.
Appendix B Comments on Selected Galaxies
In Figure 11, the best Gaussian fits for the detected molecular emission lines are overplotted on the actual data.
Appendix C Intensity-weighted Mean Velocity and Intensity-weighted Velocity Dispersion Maps
Figures 12 and 13 display intensity-weighted mean velocity (moment 1) and intensity-weighted velocity dispersion (moment 2) maps of HCN J=3–2 and HCO+ J=3–2 emission lines of selected ULIRGs, for which we can obtain meaningful dynamical information of these dense gas tracers (mostly 10 detection in their integrated intensity [moment 0] maps). For most of the ULIRGs with spatially resolved molecular line emission, a rotation pattern with blueshifted and redshifted components are visible (Fig. 12).
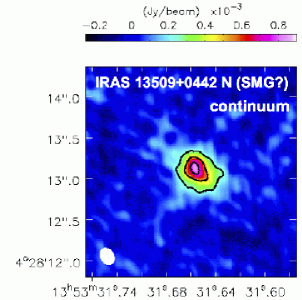
Appendix D A Continuum-emitting Source within the IRAS 135090442 Field
A bright continuum-emitting source was detected at the 10′′ northern side of IRAS 135090442 at 235 GHz and 310 GHz (Imanishi et al., 2016c, 2018). This source is considered a distant submillimeter galaxy (SMG) candidate (Imanishi et al., 2016c, 2018). We made a clean map with a wider field of view (1024 1024 pixels of 002 pixel-1) to investigate this source in our ALMA Cycle 5 high-spatial-resolution data.
A continuum map created using all channels (because there are no obvious emission lines in this source) is displayed in Figure 14 (left). The continuum emission is clearly detected with the peak flux of 0.84 (mJy beam-1) (16) and is spatially resolved with the beam size of 220 (mas) 160 (mas) (position angle = 29∘ east of north). The estimated intrinsic deconvolved emission size is 42143 (mas) 32335 (mas) (position angle is 5623∘ east of north). The spatially integrated continuum flux within a 1′′ diameter circular aperture is 3.6 (mJy). Figure 14 (right) shows a spectrum without continuum subtraction at the peak position within the beam size. No significant emission line is recognizable.
References
- Aalto et al. (2015b) Aalto, S., Costagliola, S., Martin F., et al. 2015b, A&A, 584, A42
- Aalto et al. (2015a) Aalto, S., Garcia-Burillo, S., Muller, S., et al. 2015a, A&A, 574, A85
- Aalto et al. (2012) Aalto, S., Muller, S., Sakamoto, K., et al. 2012, A&A, 546, A68
- Aalto et al. (2017) Aalto, S., Muller, S., Costagliola, F., et al. 2017, A&A, 608, A22
- Alexander & Hickox (2012) Alexander, D. M., & Hickox, R. C. 2012, NewAR, 56, 93
- Alonso-Herrero et al. (2016) Alonso-Herrero, A., Poulton, R., Roche, P. F., et al. 2016, MNRAS, 463, 2405
- Armus et al. (2007) Armus, L., Charmandaris, V., Bernard-Salas, J., et al. 2007, ApJ, 656, 148
- Baan & Klckner (2006) Baan, W. A., & Klckner, H. -R. 2006, A&A, 449, 559
- Barcos-Munoz et al. (2018) Barcos-Munoz, L., Aalto, S., Thompson, T. A., et al. 2018, ApJL, 853, L28
- Barcos-Munoz et al. (2017) Barcos-Munoz, L., Leroy, A. K., Evans, A. S., et al. 2017, ApJ, 843, 117
- Bolatto et al. (2013) Bolatto, A. D., Wolfire, M., & Leroy, A. K. 2013, ARA&A, 51, 207
- Cicone et al. (2014) Cicone, C., Maiolino, R., Sturm, E., et al. 2014, A&A, 562, 21
- Clements et al. (1996) Clements, D. L., Sutherland, W. J., McMahon, R. G., & Saunders, W. 1996, MNRAS, 279, 477
- Clements et al. (2018) Clements, D. L., Pearson, C., Farrah, D., et al. 2018, MNRAS, 475, 2097
- Costagliola et al. (2011) Costagliola, F., Aalto, S., Rodriguez, M. I., et al. 2011, A&A, 528, 30
- Diaz-Santos et al. (2010) Diaz-Santos, T., Charmandaris, V., Armus, L., et al. 2010, ApJ, 723, 993
- Dinh-V-Trung et al. (2001) Dinh-V-Trung, Lo, K. Y., Kim, D.-C., Gao, Y., & Gruendl, R. A. 2001, ApJ, 556, 141
- Downes & Solomon (1998) Downes, D., & Solomon, P. M. 1998, ApJ, 507, 615
- Duc et al. (1997) Duc, P.-A., Mirabel, I. F., & Maza, J. 1997, A&AS, 124, 533
- Evans et al. (2002) Evans, A. S., Mazzarella, J. M., Surace, J. A., & Sanders, D. B. 2002, ApJ, 580, 749
- Evans et al. (2006) Evans, A. S., Solomon, P. M., Tacconi, L. J., Vavilkin, T., & Downes, D. 2006, ApJ, 132, 2398
- Evans et al. (2000) Evans, A. S., Surace, J. A., & Mazzarella, J. M. 2000, ApJL, 529, L85
- Gao & Solomon (2004a) Gao, Y., & Solomon, P. M. 2004a, ApJS, 152, 63
- Gao & Solomon (2004b) Gao, Y., & Solomon, P. M. 2004b, ApJ, 606, 271
- Garcia-Burillo et al. (2014) Garcia-Burillo, S., Combes, F., Usero, A., et al. 2014, A&A, 567, 125
- Garcia-Burillo et al. (2015) Garcia-Burillo, S., Combes, F., Usero, A., et al. 2015, A&A, 580, A35
- Genzel et al. (1998) Genzel, R. et al. 1998, ApJ, 498, 579
- Gracia-Carpio et al. (2008) Gracia-Carpio, J., Garcia-Burillo, S., Planesas, P., Fuente, A., & Usero, A. 2008, A&A, 479, 703
- Greve et al. (2009) Greve, T. R., Papadopoulos, P. P., Gao, Y., & Radford, S. J. E. 2009, ApJ, 692, 1432
- Hildebrand (1983) Hildebrand, R. H. 1983, QJRAS, 24, 267
- Hopkins et al. (2006) Hopkins, P. F., Hernquist, L., Cox, T. J., et al. 2006, ApJS, 163, 1
- Ichikawa et al. (2014) Ichikawa, K., Imanishi, M., Ueda, Y., et al. 2014, ApJ, 794, 139
- Imanishi (2006) Imanishi, M. 2006, AJ, 131, 2406
- Imanishi (2009) Imanishi, M. 2009, ApJ, 694, 751
- Imanishi & Dudley (2000) Imanishi, M., & Dudley, C. C. 2000, ApJ, 545, 701
- Imanishi et al. (2006a) Imanishi, M., Dudley, C. C., & Maloney, P. R. 2006a, ApJ, 637, 114
- Imanishi et al. (2007a) Imanishi, M., Dudley, C. C., Maiolino, R., et al. 2007a, ApJS, 171, 72
- Imanishi et al. (2011) Imanishi, M., Imase, K., Oi, N., & Ichikawa, K. 2011, AJ, 141, 156
- Imanishi et al. (2010a) Imanishi, M., Maiolino, R., & Nakagawa, T. 2010a, ApJ, 709, 801
- Imanishi et al. (2008) Imanishi, M., Nakagawa, T., Ohyama, Y., et al. 2008, PASJ, 60, S489
- Imanishi et al. (2010b) Imanishi, M., Nakagawa, T., Shirahata, M., Ohyama, Y., & Onaka, T. 2010b, ApJ, 721, 1233
- Imanishi & Nakanishi (2014) Imanishi, M., & Nakanishi, K. 2014, AJ, 148, 9
- Imanishi et al. (2016a) Imanishi, M., Nakanishi, K., & Izumi, T. 2016a, ApJL, 822, L10
- Imanishi et al. (2016b) Imanishi, M., Nakanishi, K., & Izumi, T. 2016b, ApJ, 825, 44
- Imanishi et al. (2016c) Imanishi, M., Nakanishi, K., & Izumi, T. 2016c, AJ, 152, 218
- Imanishi et al. (2017) Imanishi, M., Nakanishi, K., & Izumi, T. 2017, ApJ, 849, 29
- Imanishi et al. (2018) Imanishi, M., Nakanishi, K., & Izumi, T. 2018, ApJ, 856, 143
- Imanishi et al. (2006b) Imanishi, M., Nakanishi, K., & Kohno, K. 2006b, AJ, 131, 2888
- Imanishi et al. (2004) Imanishi, M., Nakanishi, K., Kuno, N., & Kohno, K. 2004, AJ, 128, 2037
- Imanishi et al. (2007b) Imanishi, M., Nakanishi, K., Tamura, Y., Oi, N., & Kohno, K. 2007b, AJ, 134, 2366
- Imanishi et al. (2009a) Imanishi, M., Nakanishi, K., Tamura, Y., & Peng, C. -H. 2009a, AJ, 137, 3581
- Iwasawa et al. (2017) Iwasawa, K., Spoon, H. W. W., Comastri, A., et al. 2017, A&A, 606, A117
- Izumi et al. (2015) Izumi, T., Kohno, K., Aalto, S., et al. 2015, ApJ, 811, 39
- Izumi et al. (2016) Izumi, T., Kohno, K., Aalto, S., et al. 2016, ApJ, 818, 42
- Izumi et al. (2013) Izumi, T., Kohno, K., Martin, S., et al. 2013, PASJ, 65, 100
- Kim & Sanders (1998) Kim, D. -C., & Sanders, D. B. 1998, ApJS, 119, 41
- Kim et al. (2002) Kim, D. -C., Veilleux, S., & Sanders, D. B., 2002, ApJS, 143, 277
- Kohno (2005) Kohno, K. 2005, in AIP Conf. Ser. 783, The Evolution of Starbursts, ed. S. Hüttemeister, E. Manthey, D. Bomans, & K. Weis (New York: AIP), 203 (astro-ph/0508420)
- Krips et al. (2008) Krips, M., Neri, R., Garcia-Burillo, S., et al. 2008, ApJ, 677, 262
- Lee et al. (2012) Lee, J. C., Hwang, H. S., Lee, M. G., et al. 2012, ApJ, 756, 95
- Leroy et al. (2015) Leroy, A. K., Bolatto, A. D., Ostriker, E. C., et al. 2015, ApJ, 801, 25
- Leroy et al. (2017) Leroy, A. K., Usero, A., Schruba, A., et al. 2017, ApJ, 835, 217
- Liu et al. (2016) Liu, T., Kim, K-T., Yoo, H., et al. 2016, ApJ, 829, 59
- Ma et al. (2013) Ma, B., Tan, J. C., & Barnes, P. J. 2013, ApJ, 779, 79
- Maiolino et al. (2012) Maiolino, R., Gallerani, S., Neri, R., et al. 2012, MNRAS, 425, L66
- Manohar & Scoville (2017) Manohar, S, & Scoville, N. 2017, ApJ, 835, 127
- Martin et al. (2016) Martin, S., Aalto, S., Sakamoto, K., et al. 2016, A&A, 590, A25
- Murphy et al. (1996) Murphy, T. W. J., Armus, L., Matthews, K., et al. 1996, AJ, 111, 1025
- Nakajima et al. (2018) Nakajima, T., Takano, S., Kohno, K., Harada, N., & Herbst, E. 2018, PASJ, 70, 7
- Nakanishi et al. (2005) Nakanishi, K., Okumura, S. K., Kohno, K., Kawabe, R., & Nakagawa, T. 2005, PASJ, 57, 575
- Nardini et al. (2008) Nardini, E., Risaliti, G., Salvati, M., et al. 2008, MNRAS, 385, L130
- Nardini et al. (2009) Nardini, E., Risaliti, G., Salvati, M., et al. 2009, MNRAS, 399, 1373
- Nardini et al. (2010) Nardini, E., Risaliti, G., Watabe, Y., Salvati, M., & Sani, E. 2010, MNRAS, 405, 2505
- Oda et al. (2017) Oda, S., Tanimoto, A., Ueda, Y., et al. 2017, ApJ, 835, 179O
- Papadopoulos (2007) Papadopoulos, P. P. 2007, ApJ, 656, 792
- Pereira-Santaella et al. (2018) Pereira-Santaella, M., Colina, L., Garcia-Burillo, S., et al. 2018, A&A, 616, A171
- Privon et al. (2017) Privon, G. C., Aalto, S., Falstad, N., et al. 2017, ApJ, 835, 213
- Privon et al. (2015) Privon, G. C., Herrero-Illana, R., Evans, A. S., et al. 2015, ApJ, 814, 39
- Ricci et al. (2017) Ricci, C., Bauer, F. E., Treister, E., et al. 2017, MNRAS, 468, 1273
- Saito et al. (2018) Saito, T., Iono, D., Espada, D., et al. 2018, ApJ, 863, 129
- Sakamoto et al. (2017) Sakamoto, K., Aalto, S., Barcos-Munoz, L., et al. 2017, ApJ, 849, 14
- Sakamoto et al. (2010) Sakamoto, K., Aalto, S., Evans, A. S., Wiedner, M., & Wilner, D. 2010, ApJ, 725, L228
- Sanders & Mirabel (1996) Sanders, D. B., & Mirabel, I. F. 1996, ARA&A, 34, 749
- Sanders et al. (1988) Sanders, D. B., Soifer, B. T., Elias, J. H., et al. 1988, ApJ, 325, 74
- Scoville et al. (2017) Scoville, N., Murchikova, L., Walter, F., et al. 2017, ApJ, 836, 66
- Scoville et al. (2015) Scoville, N., Sheth, K., Walter, F., et al. 2015, ApJ, 800, 70
- Shirley (2015) Shirley, Y. L. 2015, PASP, 127, 299
- Sliwa & Downes (2017) Sliwa, K., & Downes, D. 2017, A&A, 604, A2
- Soifer et al. (2002) Soifer, B. T., Neugebauer, G., Matthews, K., Egami, E., & Weinberger, A. J. 2002, AJ, 124, 2980
- Soifer et al. (2000) Soifer, B. T., Neugebauer, G., Matthews, K., et al. 2000, AJ, 119, 509
- Solomon & Vanden Bout (2005) Solomon, P. M., & Vanden Bout, P. A. 2005, ARA&A, 43, 677
- Tan et al. (2018) Tan, Q-H., Gao, Y., Zhang, Z-Y., et al. 2018, ApJ, 860, 165
- Teng et al. (2015) Teng, S. H., Rigby, J. R., Stern, D,. et al. 2015, ApJ, 814, 56
- Tunnard et al. (2015) Tunnard, R., Greve, T. R., Garcia-Burillo, S., et al. 2015, ApJ, 800, 25
- Veilleux et al. (2017) Veilleux, S., Bolatto, S., Tombesi, F., et al. 2017, ApJ, 843, 18
- Veilleux et al. (1999) Veilleux, S., Kim, D. -C., & Sanders, D. B. 1999, ApJ, 522, 113
- Veilleux et al. (2009) Veilleux, S., Rupke, D. S. N., Kim, D.-C., et al. 2009, ApJS, 182, 628
- Wilson et al. (2008) Wilson, C. D., Petitpas, G. R., Iono, D., et al. 2008, ApJS, 178, 189
- Wu et al. (2005) Wu, J., Evans II, N. J., Gao, Y., et al. 2005, ApJ, 635, L173
- Yuan et al. (2010) Yuan, T. -T., Kewley, L. J., Sanders, D. B. 2010, ApJ, 709, 884
- Zhang et al. (2014) Zhang, Z-Y., Gao, Y., Henkel, C., et al. 2014, ApJL, 784, L31
| Object | Redshift AA For some fraction of sources, the observed peak frequencies of the detected HCN J=3–2 and HCO+ J=3–2 emission lines in our ALMA spectra are significantly offset from the expected frequencies from optically-derived redshifts (Kim & Sanders, 1998). For them, our ALMA molecular line redshifts are adopted, and the optically-derived redshifts are shown in parentheses. | dL | Scale | f12 | f25 | f60 | f100 | log LIR | log LFIR | Optical | IR-AGN |
|---|---|---|---|---|---|---|---|---|---|---|---|
| [Mpc] | [kpc/′′] | [Jy] | [Jy] | [Jy] | [Jy] | [L⊙] | [L⊙] | Class | Fraction [%] | ||
| (1) | (2) | (3) | (4) | (5) | (6) | (7) | (8) | (9) | (10) | (11) | (12) |
| IRAS 001880856 | 0.1285 (0.128) | 596 | 2.3 | 0.12 | 0.37 | 2.59 | 3.40 | 12.4 | 12.3 | LINER | 354 |
| IRAS 032501606 | 0.1286 (0.129) | 596 | 2.3 | 0.10 | 0.15 | 1.38 | 1.77 | 12.1 | 12.0 | LINER | 0.2 |
| IRAS 041032838 | 0.118 | 543 | 2.1 | 0.08 | 0.54 | 1.82 | 1.71 | 12.2 | 12.0 | LINER | 5.40.8 |
| IRAS 090390503 | 0.1257 BBThis is the redshift of the SW nucleus. The redshift of the NE nucleus is z 0.125. | 578 | 2.2 | 0.07 | 0.12 | 1.48 | 2.06 | 12.1 | 12.0 | LINER | 5.8 |
| IRAS 103781108 | 0.1365 (0.136) | 636 | 2.4 | 0.11 | 0.24 | 2.28 | 1.82 | 12.3 | 12.2 | LINER | 142 |
| IRAS 104851447 | 0.133 | 619 | 2.3 | 0.11 | 0.25 | 1.73 | 1.66 | 12.2 | 12.1 | LINER | 5.71.0 |
| IRAS 110950238 | 0.1066 CCThis is the redshift of the NE nucleus. The redshift of the SW nucleus is z 0.106. | 484 | 1.9 | 0.06 | 0.42 | 3.25 | 2.53 | 12.3 | 12.1 | LINER | 604 |
| IRAS 133352612 | 0.125 DDThis is the redshift of the N nucleus. The redshift of the S nucleus is z 0.1257. | 578 | 2.2 | 0.13 | 0.14 | 1.40 | 2.10 | 12.1 | 12.0 | LINER | 0.03 |
| IRAS 143481447 | 0.083 EEThis is the redshift of the SW nucleus. The redshift of the NE nucleus is z 0.0825. | 373 | 1.5 | 0.07 | 0.49 | 6.87 | 7.07 | 12.3 | 12.3 | LINER | 3.91.1 |
| IRAS 160900139 | 0.1334 (0.134) | 621 | 2.4 | 0.09 | 0.26 | 3.61 | 4.87 | 12.6 | 12.5 | LINER | 243 |
| IRAS 213292346 | 0.125 | 578 | 2.2 | 0.05 | 0.12 | 1.65 | 2.22 | 12.2 | 12.1 | LINER | 2.9 |
| IRAS 232340946 | 0.128 | 593 | 2.3 | 0.06 | 0.08 | 1.56 | 2.11 | 12.1 | 12.1 | LINER | 1.7 |
| IRAS 000910738 | 0.118 | 543 | 2.1 | 0.07 | 0.22 | 2.63 | 2.52 | 12.3 | 12.2 | HII | 586 |
| IRAS 004562904 | 0.110 | 504 | 2.0 | 0.08 | 0.14 | 2.60 | 3.38 | 12.2 | 12.1 | HII | 0.05 |
| IRAS 010042237 | 0.118 | 543 | 2.1 | 0.11 | 0.66 | 2.29 | 1.79 | 12.3 | 12.1 | HII | 504 |
| IRAS 011660844 | 0.1172 (0.118) | 539 | 2.1 | 0.07 | 0.17 | 1.74 | 1.42 | 12.1 | 12.0 | HII | 88 |
| IRAS 012980744 | 0.1368 (0.136) | 638 | 2.4 | 0.12 | 0.19 | 2.47 | 2.08 | 12.4 | 12.3 | HII | 75 |
| IRAS 015692939 | 0.1402 (0.141) | 655 | 2.5 | 0.11 | 0.14 | 1.73 | 1.51 | 12.3 | 12.1 | HII | 183 |
| IRAS 024110353 | 0.144 | 676 | 2.5 | 0.08 | 0.22 | 1.37 | 1.95 | 12.3 | 12.1 | HII | 0.9 |
| IRAS 101901322 | 0.0762 (0.077) | 341 | 1.4 | 0.07 | 0.38 | 3.33 | 5.57 | 12.0 | 12.0 | HII | 0.02 |
| IRAS 115061331 | 0.127 | 588 | 2.2 | 0.10 | 0.19 | 2.58 | 3.32 | 12.4 | 12.3 | HII | 4.5 |
| IRAS 135090442 | 0.1365 (0.136) | 636 | 2.4 | 0.10 | 0.23 | 1.56 | 2.53 | 12.3 | 12.2 | HII | 0.03 |
| IRAS 222062715 | 0.132 | 614 | 2.3 | 0.10 | 0.16 | 1.75 | 2.33 | 12.2 | 12.1 | HII | 0.5 |
| IRAS 121120305 FFObserved in ALMA Cycle 2 or 3, and presented by Imanishi et al. (2016c). | 0.0730 | 326 | 1.4 | 0.12 | 0.51 | 8.50 | 9.98 | 12.3 | 12.3 | LINER | 0.7 |
| IRAS 204141651 FFObserved in ALMA Cycle 2 or 3, and presented by Imanishi et al. (2016c). | 0.0870 (0.086) | 392 | 1.6 | 0.65 | 0.35 | 4.36 | 5.25 | 12.3 | 12.1 | HII | 0.1 |
| IRAS 224911808 FFObserved in ALMA Cycle 2 or 3, and presented by Imanishi et al. (2016c). | 0.0776 (0.076) | 347 | 1.5 | 0.05 | 0.55 | 5.44 | 4.45 | 12.2 | 12.1 | HII | 0.07 |
Note. — Col.(1): Object name. Col.(2): Redshift. Col.(3): Luminosity distance (in Mpc). Col.(4): Physical scale (in kpc arcsec-1). Col.(5)–(8): f12, f25, f60, and f100 are IRAS fluxes at 12 m, 25 m, 60 m, and 100 m, respectively, taken from Kim & Sanders (1998). Col.(9): Decimal logarithm of infrared (81000 m) luminosity in units of solar luminosity (L⊙), calculated with D(Mpc)2 (13.48 + 5.16 + ) (ergs s-1) (Sanders & Mirabel, 1996). Col.(10): Decimal logarithm of far-infrared (40500 m) luminosity in units of solar luminosity (L⊙), calculated with (Mpc)2 () (ergs s-1) (Sanders & Mirabel, 1996). Col.(11): Optical spectroscopic classification by Veilleux et al. (1999). “LINER” and “HII” refer to LINER and HII-region, respectively. Col.(12): Infrared-spectroscopically estimated bolometric contribution of AGNs (in %) by Nardini et al. (2010).
| Object | Date | Antenna | Baseline | Integration | Calibrator | ||
|---|---|---|---|---|---|---|---|
| [UT] | Number | [m] | [min] | Bandpass | Flux | Phase | |
| (1) | (2) | (3) | (4) | (5) | (6) | (7) | (8) |
| IRAS 001880856 | 2017 December 17 | 45 | 15–2517 | 36 | J00060623 | J00060623 | J00170512 |
| IRAS 032501606 | 2017 December 10 | 46 | 15–3321 | 39 | J02381636 | J02381636 | J03091029 |
| IRAS 041032838 | 2017 December 9 | 44 | 15–3083 | 15 | J05223627 | J05223627 | J03482749 |
| IRAS 090390503 | 2017 December 23 | 48 | 15–2517 | 22 | J08542006 | J08542006 | J09140245 |
| IRAS 103781108 | 2017 December 17 | 45 | 15–2517 | 28 | J10580133 | J10580133 | J10251253 |
| IRAS 104851447 | 2017 December 11 | 44 | 15–3321 | 18 | J10372934 | J10372934 | J10481909 |
| IRAS 110950238 | 2017 December 11 | 44 | 15–3321 | 12 | J12290203 | J12290203 | J10580133 |
| IRAS 133352612 | 2017 December 23 | 42 | 15–2517 | 21 | J13371257 | J13371257 | J13512912 |
| IRAS 143481447 | 2017 December 12 | 44 | 15–3321 | 8 | J15172422 | J15172422 | J14451629 |
| IRAS 160900139 | 2017 December 16 | 43 | 15–2517 | 8 | J15172422 | J15172422 | J15570001 |
| IRAS 213292346 | 2018 April 12 | 44 | 15–500 | 21 | J22582758 | J22582758 | J21012933 |
| IRAS 232340946 | 2017 December 10 | 44 | 15–2933 | 36 | J22531608 | J22531608 | J23270940 |
| IRAS 000910738 | 2017 December 16 | 45 | 15–3083 | 16 | J22582758 | J22582758 | J00060623 |
| IRAS 004562904 | 2017 December 16 | 45 | 15–3083 | 12 | J22582758 | J22582758 | J00382459 |
| IRAS 010042237 | 2017 December 16 | 45 | 15–3083 | 12 | J00060623 | J00060623 | J01172111 |
| IRAS 011660844 | 2017 December 9–10 | 45 | 15–3321 | 16 | J00060623 | J00060623 | J01161136 |
| IRAS 012980744 | 2017 December 10 | 45 | 15–3321 | 24 | J00060623 | J00060623 | J01410928 |
| IRAS 015692939 | 2017 December 10 | 46 | 15–3321 | 21 | J00060623 | J00060623 | J01202701 |
| IRAS 024110353 | 2017 December 9 | 47 | 15–3321 | 22 | J02381636 | J02381636 | J02390416 |
| IRAS 101901322 | 2017 December 23 | 45 | 15–2517 | 9 | J10580133 | J10580133 | J10251253 |
| IRAS 115061331 | 2017 December 15 | 45 | 15–2517 | 20 | J12290203 | J12290203 | J11571638 |
| IRAS 135090442 | 2017 December 17 | 44 | 15–2517 | 26 | J12560547 | J12560547 | J13590159 |
| IRAS 222062715 | 2018 April 12 | 44 | 15–500 | 25 | J21480657 | J21480657 | J22582758 |
| IRAS 121120305 AAObserved in ALMA Cycle 2 or 3. | 2015 May 14 | 37 | 23–558 | 5 | J10580133 | Ganymede | J12290203 |
| IRAS 204141651 AAObserved in ALMA Cycle 2 or 3. | 2016 March 26 | 38 | 15–460 | 11 | J19242914 | Pallas | J20111546 |
| IRAS 224911808 AAObserved in ALMA Cycle 2 or 3. | 2015 May 24 | 34 | 21–539 | 5 | J22582758 | Titan | J20564714 |
Note. — Col.(1): Object name. Col.(2): Observation date in UT. Col.(3): Number of antennas used for observations. Col.(4): Baseline length in meters. Minimum and maximum baseline lengths are shown. Col.(5): Net on source integration time in minutes. Cols.(6), (7), and (8): Bandpass, flux, and phase calibrator for the target source, respectively.
| Object | Frequency | Peak flux | Peak coordinate | rms | Synthesized beam |
|---|---|---|---|---|---|
| [GHz] | [mJy/beam] | (RA,DEC)ICRS | [mJy/beam] | [′′ ′′] (∘) | |
| (1) | (2) | (3) | (4) | (5) | (6) |
| IRAS 001880856 | 234.7–239.7 | 1.4 (35) | (00 21 26.514, 08 39 26.01) | 0.040 | 0.180.13 (79∘) |
| IRAS 032501606 | 234.6–239.6 | 0.41 (14) | (03 27 49.812, 16 16 59.31) | 0.029 | 0.130.10 (28∘) |
| IRAS 041032838 N | 236.9–241.8 | 0.21 (4.4) | (04 12 19.445, 28 30 25.00) | 0.047 | 0.110.10 (73∘) |
| IRAS 041032838 S | 236.9–241.8 | 0.18 (3.9) | (04 12 19.445, 28 30 25.14) | 0.047 | 0.110.10 (73∘) |
| IRAS 041032838 NE | 236.9–241.8 | 0.18 (3.9) | (04 12 19.440, 28 30 24.90) | 0.047 | 0.110.10 (73∘) |
| IRAS 090390503 SW | 235.4–240.3 | 0.83 (19 | (09 06 34.027, 04 51 27.43) | 0.044 | 0.180.14 (77∘) |
| IRAS 090390503 NE | 235.4–240.3 | 0.46 (10) | (09 06 34.045, 04 51 27.87) | 0.044 | 0.180.14 (77∘) |
| IRAS 103781108 | 233.0–238.0 | 1.5 (33) | (10 40 29.170, 10 53 18.15) | 0.045 | 0.170.15 (81∘) |
| IRAS 104851447 | 233.7–238.6 | 0.14 (3) AANo emission with 3 is detected within 02 around the near-infrared K-band (2.2 m) peak position of IRAS 104851447 E at (10 51 03.67, 15 03 19.8) in J2000 (Kim et al., 2002). | (10 51 03.67, 15 03 19.8) AANo emission with 3 is detected within 02 around the near-infrared K-band (2.2 m) peak position of IRAS 104851447 E at (10 51 03.67, 15 03 19.8) in J2000 (Kim et al., 2002). | 0.044 | 0.130.10 (78∘) |
| IRAS 110950238 NE | 239.4–244.3 | 1.2 (18) | (11 12 03.383, 02 54 22.96) | 0.066 | 0.130.12 (83∘) |
| IRAS 110950238 SW | 239.4–244.3 | 0.43 (6.5) | (11 12 03.357, 02 54 23.30) | 0.066 | 0.130.12 (83∘) |
| IRAS 133352612 N | 235.4–240.3 | 1.2 (26) | (13 36 22.290, 26 27 32.78) | 0.048 | 0.160.12 (87∘) |
| IRAS 133352612 S | 235.4–240.3 | 0.37 (7.8) | (13 36 22.297, 26 27 34.38) | 0.048 | 0.160.12 (87∘) |
| IRAS 143481447 SW | 244.5–249.5 | 1.4 (21) | (14 37 38.281, 15 00 24.21) | 0.070 | 0.140.10 (56∘) |
| IRAS 143481447 NE | 244.5–249.5 | 0.99 (14) | (14 37 38.397, 15 00 21.27) | 0.070 | 0.140.10 (56∘) |
| IRAS 160900139 | 233.6–238.5 | 1.4 (20) | (16 11 40.422, 01 47 06.34) | 0.070 | 0.170.15 (83∘) |
| IRAS 213292346 | 235.4–240.2 | 1.4 (21) | (21 35 45.861, 23 32 35.35) | 0.071 | 0.750.59 (87∘) |
| IRAS 232340946 | 234.7–239.7 | 0.45 (20) | (23 25 56.142, 10 02 49.61) | 0.023 | 0.150.13 (33∘) |
| IRAS 000910738 | 236.8–241.8 | 5.5 (59) | (00 11 43.273, 07 22 07.35) | 0.094 | 0.180.13 (79∘) |
| IRAS 004562904 | 238.5–243.4 | 1.2 (25) | (00 48 06.774, 28 48 18.52) | 0.050 | 0.160.12 (73∘) |
| IRAS 010042237 | 236.9–241.8 | 0.64 (14) | (01 02 49.992, 22 21 57.28) | 0.047 | 0.170.12 (71∘) |
| IRAS 011660844 SE | 236.8–241.8 | 0.68 (17) | (01 19 07.856, 08 29 12.03) | 0.041 | 0.120.092 (71∘) |
| IRAS 012980744 | 233.0–238.0 | 2.4 (58) | (01 32 21.413, 07 29 08.34) | 0.042 | 0.150.12 (55∘) |
| IRAS 015692939 | 232.2–237.2 | 0.70 (17) | (01 59 13.792, 29 24 35.03) | 0.040 | 0.110.11 (70∘) |
| IRAS 024110353 | 231.5–236.4 | 0.13 (3) | (02 43 46.032, 04 06 37.93) BBHCO+ J=3–2 emission line peak. | 0.041 | 0.130.10 (50∘) |
| IRAS 101901322 | 246.1–251.0 | 1.3 (16) | (10 21 42.753, 13 06 55.60) | 0.081 | 0.170.15 (70∘) |
| IRAS 115061331 | 234.9–239.8 | 0.58 (12) | (11 53 14.230, 13 14 27.70) | 0.049 | 0.200.14 (63∘) |
| IRAS 135090442 | 233.1–238.0 | 0.56 (12) | (13 53 31.566, 04 28 04.83) | 0.045 | 0.220.16 (26∘) |
| IRAS 222062715 | 234.0–238.9 | 1.7 (24) | (22 23 28.900, 27 00 02.84) | 0.069 | 0.750.60 (88∘) |
| IRAS 121120305 NE CCTaken from Imanishi et al. (2016c). | 246.8–251.3 | 8.3 (46 | (12 13 46.057, 02 48 41.49) | 0.18 | 0.730.55 (66∘) |
| IRAS 121120305 SW CCTaken from Imanishi et al. (2016c). | 246.8–251.3 | 0.80 (4 | (12 13 45.944, 02 48 39.09) | 0.19 | 0.730.55 (66∘) |
| IRAS 204141651 CCTaken from Imanishi et al. (2016c). | 243.9–248.6 | 5.2 (38 | (20 44 18.165, 16 40 16.84) | 0.14 | 0.760.66 (89∘) |
| IRAS 224911808 CCTaken from Imanishi et al. (2016c). | 246.1–250.7 | 4.7 (19 | (22 51 49.349, 17 52 24.16) | 0.25 | 0.920.59 (67∘) |
Note. — Col.(1): Object name. Col.(2): Frequency range (in GHz) used for continuum extraction. Frequencies of obvious emission lines and absorption features are removed. Col.(3): Flux (in mJy beam-1) at the emission peak. Value at the highest flux pixel (002–004 pixel-1) is extracted. The detection significance relative to the root mean square (rms) noise is shown in parentheses. Possible systematic uncertainties, coming from the absolute flux calibration ambiguity in individual ALMA observation and choice of frequency range for the continuum level determination, are not included. Col.(4): Coordinate of the continuum emission peak in ICRS. Col.(5): The rms noise level (1) (in mJy beam-1), derived from the standard deviation of sky signals in each continuum map. Col.(6): Synthesized beam (in arcsec arcsec) and position angle (in degrees). The position angle is 0∘ along the north–south direction and increases in the counterclockwise direction.
| Object | Integrated intensity (moment 0) map | Gaussian fit | |||||
|---|---|---|---|---|---|---|---|
| Peak | rms | Beam | Velocity | Peak | FWHM | Flux | |
| [Jy beam-1 km s-1] | [′′ ′′] (∘) | [km s-1] | [mJy] | [km s-1] | [Jy km s-1] | ||
| (1) | (2) | (3) | (4) | (5) | (6) | (7) | (8) |
| IRAS 001880856 | 1.6 (25) | 0.065 | 0.180.13 (79∘) | 385446 | 5.50.2 | 35513 | 1.90.1 |
| IRAS 032501606 | 0.56 (11) | 0.049 | 0.130.10 (28∘) | 3857226 | 1.30.1 | 52660 | 0.630.09 |
| IRAS 041032838 AAHCN J=3–2 emission line peak at (04 12 19.448, 28 30 24.92)ICRS. | 0.44 (7.3 | 0.060 | 0.110.10 (73∘) | 3533926 | 1.40.2 | 40769 | 0.530.12 |
| IRAS 090390503 SW | 0.86 (13) | 0.067 | 0.190.14 (78∘) | 3768516 | 2.40.2 | 41941 | 0.960.12 |
| IRAS 090390503 NE | 0.67 (10) | 0.067 | 0.190.14 (78∘) | 3752812 | 2.60.3 | 23645 | 0.570.12 |
| IRAS 103781108 | 1.9 (26) | 0.074 | 0.170.15 (83∘) | 409466 | 5.80.2 | 41112 | 2.20.1 |
| IRAS 104851447 | 0.24 (3) BBNo emission with 3 is detected within 02 around the near-infrared K-band peak position at (10 51 03.67, 15 03 19.8) in J2000 (Kim et al., 2002). | 0.078 | 0.130.10 (78∘) | — | — | — | — |
| IRAS 110950238 NE | 1.7 (14) | 0.11 | 0.130.12 (60∘) | 3195610 | 4.10.2 | 43729 | 1.70.1 |
| IRAS 110950238 SW | 0.35(3) | 0.11 | 0.130.12 (60∘) | 3177040 | 0.90.3 | 301206 | 0.270.21 |
| IRAS 133352612 N | 0.82 (8.7) | 0.094 | 0.160.13 (86∘) | 3729861,3780646 | 1.40.1,1.10.3 | 517148,29999 | 0.960.24 |
| IRAS 133352612 S | 0.40 (4.6) | 0.087 | 0.160.13 (86∘) | 3772521 | 1.10.2 | 30149 | 0.330.07 |
| IRAS 143481447 SW | 1.9 (26) | 0.072 | 0.140.11 (60∘) | 248476 | 6.70.2 | 31713 | 2.10.1 |
| IRAS 143481447 NE | 0.86 (12) | 0.069 | 0.140.11 (60∘) | 2453416,2480311 | 1.80.5,3.10.3 | 16264,22924 | 0.980.17 |
| IRAS 160900139 | 2.7 (26) | 0.10 | 0.170.17 (53∘) | 400338 | 6.30.2 | 53917 | 3.50.2 |
| IRAS 213292346 | 1.5 (15) | 0.098 | 0.760.60 (87∘) | 3739626,3771931 | 3.60.3,2.80.4 | 28461,26661 | 1.70.3 |
| IRAS 232340946 | 0.39 (10) | 0.039 | 0.160.13 (33∘) | 3814625,3851118 | 0.790.12,1.00.1 | 22361,26747 | 0.430.08 |
| IRAS 000910738 | 2.8 (17) | 0.17 | 0.180.13 (78∘) | 3514510,3564320 | 5.60.4,3.40.4 | 26227,44488 | 2.80.4 |
| IRAS 004562904 | 1.5 (20) | 0.076 | 0.160.12 (75∘) | 329446 | 6.30.2 | 28412 | 1.70.1 |
| IRAS 010042237 | 0.82 (15) | 0.055 | 0.170.12 (70∘) | 353667 | 4.70.5 | 20122 | 0.890.13 |
| IRAS 011660844 SE | 1.1 (16) | 0.067 | 0.120.093 (60∘) | 3512615 | 2.60.2 | 47636 | 1.20.1 |
| IRAS 012980744 | 1.3 (19) | 0.072 | 0.150.12 (55∘) | 4102814 | 2.60.1 | 62147 | 1.50.1 |
| IRAS 015692939 | 1.1 (16) | 0.069 | 0.110.11 (69∘) | 4186521,4227717 | 2.00.2,2.30.2 | 35149,26843 | 1.20.2 |
| IRAS 024110353 | 0.22 (3.5) | 0.064 | 0.130.11 (50∘) | 42990179 | 0.390.11 | 715(fix) | 0.260.08 |
| IRAS 101901322 | 1.2 (12) | 0.096 | 0.180.15 (72∘) | 2285610 | 3.30.2 | 37925 | 1.20.1 |
| IRAS 115061331 | 0.43 (9.0) | 0.047 | 0.200.14 (63∘) | 3812914 | 2.00.2 | 23534 | 0.440.08 |
| IRAS 135090442 | 0.30 (7.0) | 0.044 | 0.220.16 (24∘) | 4097812 | 1.80.2 | 20328 | 0.350.06 |
| IRAS 222062715 | 2.2 (20) | 0.11 | 0.750.60 (88∘) | 394906 | 6.30.2 | 41314 | 2.40.1 |
| IRAS 121120305 NE CCTaken from Imanishi et al. (2016c). | 8.3 (28) | 0.30 | 0.730.54 (66∘) | 2166118,2195820 | 15.01.4,14.61.2 | 28334,27346 | 8.11.2 |
| IRAS 121120305 SW CCTaken from Imanishi et al. (2016c). | 0.72 (4.2) | 0.17 | 0.730.54 (66∘) | 2197034 | 2.00.5 | 32375 | 0.640.22 |
| IRAS 204141651 CCTaken from Imanishi et al. (2016c). | 3.9 (26 | 0.15 | 0.760.66 (88∘) | 2582911,2621612 | 7.4,8.2 | 25024,30928 | 4.30.3 |
| IRAS 224911808 CCTaken from Imanishi et al. (2016c). | 7.3 (26) | 0.28 | 0.950.60 (65∘) | 233096 | 18.00.5 | 45813 | 8.10.3 |
Note. — Col.(1): Object name. Col.(2): Integrated intensity of the HCN J=3–2 emission line (=265.886 GHz) (in Jy beam-1 km s-1) at the emission peak. Detection significance relative to the rms noise (1) in the moment 0 map is shown in parentheses. Possible systematic uncertainty is not included. Col.(3): The rms noise (1) level in the moment 0 map (in Jy beam-1 km s-1), derived from the standard deviation of sky signals in each moment 0 map. Col.(4): Beam size (in arcsec arcsec) and position angle (in degrees). Position angle is 0∘ along the north-south direction, and increases counterclockwise. Cols.(5)–(8): Gaussian fit of the HCN J=3–2 emission line in the spectrum at the continuum peak position, within the beam size. For faint emission lines, we fixed some parameters to the best fit or fiducial values. Col.(5): Optical local standard of rest (LSR) velocity (vopt) of emission line peak (in km s-1). Col.(6): Peak flux (in mJy). Col.(7): Observed full width at half maximum (FWHM) (in km s-1). Col.(8): Flux (in Jy km s-1). For the flux estimate, the observed FWHM (in km s-1) in column 7 is divided by () to obtain the intrinsic FWHM (in km s-1).
| Object | Integrated intensity (moment 0) map | Gaussian fit | |||||
|---|---|---|---|---|---|---|---|
| Peak | rms | Beam | Velocity | Peak | FWHM | Flux | |
| [Jy beam-1 km s-1] | [′′ ′′] (∘) | [km s-1] | [mJy] | [km s-1] | [Jy km s-1] | ||
| (1) | (2) | (3) | (4) | (5) | (6) | (7) | (8) |
| IRAS 001880856 | 0.86 (15) | 0.056 | 0.180.13 (79∘) | 3853810 | 3.10.2 | 34523 | 1.00.1 |
| IRAS 032501606 | 0.40 (8.5) | 0.047 | 0.130.10 (28∘) | 3855829 | 0.980.11 | 53559 | 0.490.08 |
| IRAS 041032838 AAHCO+ J=3–2 emission line peak at (04 12 19.448, 28 30 24.92)ICRS. | 0.40 (6.4) | 0.062 | 0.110.10 (74∘) | 3534618 | 1.60.2 | 30048 | 0.460.09 |
| IRAS 090390503 SW | 0.46 (7.4) | 0.062 | 0.180.14 (80∘) | 3772123 | 1.40.2 | 41358 | 0.560.10 |
| IRAS 090390503 NE | 0.55 (8.9) | 0.062 | 0.180.14 (80∘) | 3755512 | 2.10.2 | 25732 | 0.510.08 |
| IRAS 103781108 | 1.8 (24) | 0.075 | 0.170.15 (81∘) | 409487 | 5.30.2 | 39917 | 2.00.1 |
| IRAS 104851447 | 0.23 (3) BBNo emission with 3 is detected within 02 around the near-infrared K-band peak position at (10 51 03.67, 15 03 19.8) in J2000 (Kim et al., 2002). | 0.076 | 0.130.10 (76∘) | — | — | — | — |
| IRAS 110950238 NE | 0.89 (10) | 0.087 | 0.130.12 (63∘) | 3201726 | 2.10.2 | 46768 | 0.920.16 |
| IRAS 110950238 SW | 0.41 (4.8) | 0.087 | 0.130.12 (63∘) | 3181349 | 1.00.2 | 468124 | 0.470.15 |
| IRAS 133352612 N | 0.58 (7.4) | 0.079 | 0.160.13 (87∘) | 3722956,3771330 | 0.870.18,1.10.2 | 30764,36670 | 0.620.12 |
| IRAS 133352612 S | 0.25 (3.1) | 0.079 | 0.160.13 (87∘) | 3771831 | 0.780.19 | 23577 | 0.170.07 |
| IRAS 143481447 SW | 1.2 (14) | 0.091 | 0.150.12 (55∘) | 248637 | 4.40.2 | 31816 | 1.40.1 |
| IRAS 143481447 NE | 0.61 (7.2) | 0.085 | 0.140.11 (57∘) | 2455034,24814(fix) | 1.40.5,2.0(fix) | 148(fix),231(fix) | 0.650.07 |
| IRAS 160900139 | 2.1 (18) | 0.12 | 0.170.17 (66∘) | 4002416 | 4.60.2 | 56037 | 2.70.2 |
| IRAS 213292346 | 1.6 (16) | 0.095 | 0.750.59 (87∘) | 3738812,3772313 | 3.80.2,3.30.2 | 28329,24230 | 1.80.2 |
| IRAS 232340946 | 0.37 (9.8) | 0.038 | 0.160.13 (33∘) | 3840827 | 0.840.08 | 54569 | 0.430.07 |
| IRAS 000910738 | 1.5 (15) | 0.10 | 0.190.13 (80∘) | 3515111,3576217 | 3.10.4,3.40.3 | 17221,37836 | 1.70.2 |
| IRAS 004562904 | 0.76 (14) | 0.056 | 0.160.12 (74∘) | 329387 | 3.40.2 | 26616 | 0.870.07 |
| IRAS 010042237 | 0.82 (15) | 0.054 | 0.170.12 (72∘) | 353646 | 5.00.3 | 19512 | 0.930.08 |
| IRAS 011660844 SE | 0.71 (10) | 0.071 | 0.120.095 (61∘) | 3518525 | 1.80.2 | 43060 | 0.750.13 |
| IRAS 012980744 | 1.1 (14) | 0.077 | 0.150.12 (55∘) | 4105721 | 2.00.1 | 63457 | 1.20.1 |
| IRAS 015692939 | 1.1 (14) | 0.078 | 0.110.11 (60∘) | 4179034,4227942 | 1.60.2,1.70.1 | 36979,47194 | 1.30.2 |
| IRAS 024110353 | 0.18 (3.4) | 0.052 | 0.130.10 (50∘) | 43162111 | 0.420.29 | 633 (fix) | 0.250.17 |
| IRAS 101901322 | 1.0 (11) | 0.094 | 0.170.15 (69∘) | 2284517 | 2.80.2 | 39637 | 1.10.1 |
| IRAS 115061331 | 0.53 (10) | 0.052 | 0.200.14 (64∘) | 3812812 | 2.40.2 | 25823 | 0.580.07 |
| IRAS 135090442 | 0.30 (7.5) | 0.041 | 0.220.16 (26∘) | 4094417 | 1.50.2 | 23142 | 0.330.08 |
| IRAS 222062715 | 1.5 (16) | 0.091 | 0.750.60 (87∘) | 395009 | 4.60.2 | 39819 | 1.70.1 |
| IRAS 121120305 NE CCTaken from Imanishi et al. (2016c). | 4.5 (17) | 0.26 | 0.760.62 (68∘) | 216657,219796 | 11.10.7,12.40.8 | 18518,20820 | 4.60.4 |
| IRAS 121120305 SW CCTaken from Imanishi et al. (2016c). | 1.4 (6.6) | 0.21 | 0.760.62 (62∘) | 2188817, 2207116 | 4.50.5, 4.30.8 | 18637, 12533 | 1.40.3 |
| IRAS 204141651 CCTaken from Imanishi et al. (2016c). | 2.6 (13) | 0.21 | 0.760.67 (88∘) | 2583412,2625912 | 5.80.5,6.30.5 | 23531,27332 | 3.00.3 |
| IRAS 224911808 CCTaken from Imanishi et al. (2016c). | 3.5 (14) | 0.25 | 0.950.60 (66∘) | 2325511 | 9.70.5 | 37130 | 3.60.3 |
Note. — Col.(1): Object name. Col.(2): Integrated intensity of the HCO+ J=3–2 emission line (=267.558 GHz) (in Jy beam-1 km s-1) at the emission peak. Detection significance relative to the rms noise (1) in the moment 0 map is shown in parentheses. Possible systematic uncertainty is not included. Col.(3): The rms noise (1) level in the moment 0 map (in Jy beam-1 km s-1), derived from the standard deviation of sky signals in each moment 0 map. Col.(4): Beam size (in arcsec arcsec) and position angle (in degree). Position angle is 0∘ along the north-south direction, and increases counterclockwise. Cols.(5)–(8): Gaussian fit of the HCO+ J=3–2 emission line in the spectrum at the continuum peak position, within the beam size. For faint emission lines, we fixed some parameters to the best fit or fiducial values. Col.(5): Optical LSR velocity (vopt) of emission line peak (in km s-1). Col.(6): Peak flux (in mJy). Col.(7): Observed FWHM (in km s-1). Col.(8): Flux (in Jy km s-1).
| Object | continuum | HCN J=3–2 | HCO+ J=3–2 | Beam size |
|---|---|---|---|---|
| [mas mas (∘)] | [mas mas (∘)] | [mas mas (∘)] | [mas mas (∘)] | |
| (1) | (2) | (3) | (4) | (5) |
| IRAS 001880856 | 24819 15011 (936) | 33229 17716 (915) | 35238 21824 (8710) | 180 130 (79) |
| IRAS 032501606 | 31440 28439 (452) | 22632 18628 (13676) | 44086 25453 (216) | 130 100 (28) |
| IRAS 041032838 | 380112 10554 (1617) | 16552 12050 (5240) | 28471 12338 (8811) | 110 100 (73) |
| IRAS 090390503 SW | 25454 15653 (2929) | 40185 30571 (5745) | 705117 46783 (1718) | 180 140 (77) |
| IRAS 090390503 NE | 587143 398104 (4029) | 38786 31177 (5241) | 54190 40071 (4255) | 180 140 (77) |
| IRAS 103781108 | 13722 13025 (4984) | 22022 16222 (3217) | 26324 16321 (429) | 170 150 (81) |
| IRAS 110950238 NW | 20843 15935 (233) | 22439 16533 (1225) | 49586 20541 (527) | 130 120 (83) |
| IRAS 133352612 N | 13717 4418 (896) | 27856 17846 (5831) | 24260 22464 (6983) | 160 120 (87) |
| IRAS 133352612 S | 29271 15240 (9318) | 24799 6761 (13329) | 269125 183124 (8552) | 160 120 (87) |
| IRAS 143481447 SW | 16626 14824 (11989) | 22232 20435 (1066) | 32645 27342 (3540) | 140 100 (56) |
| IRAS 143481447 NE | 25947 21245 (16049) | 33544 20029 (8912) | 35773 24256 (3424) | 140 100 (56) |
| IRAS 160900139 | 30139 26035 (17039) | 28520 20317 (2689) | 38935 26425 (309) | 170 150 (83) |
| IRAS 213292346 | 42976 303127 (14234) | 43689 387135 (17066) | 56862 371112 (17861) | 750 590 (87) |
| IRAS 232340946 | 30340 27737 (14888) | 41368 27847 (2322) | 42767 27344 (2416) | 150 130 (33) |
| IRAS 000910738 | 9617 6015 (8522) | 20528 13222 (8218) | 17039 12737 (8989) | 180 130 (79) |
| IRAS 004562904 | 23234 18935 (3840) | 24025 18826 (2825) | 33644 24037 (5622) | 160 120 (73) |
| IRAS 010042237 | 16340 11738 (8972) | 15831 13528 (11282) | 14935 8658 (6028) | 170 120 (71) |
| IRAS 011660844 SE | 11928 8234 (5143) | 16932 10122 (10722) | 19449 15243 (10963) | 120 90 (60) |
| IRAS 012980744 | 8211 7110 (12269) | 13221 8717 (12530) | 20036 16736 (8954) | 150 120 (55) |
| IRAS 015692939 | 10920 6123 (11917) | 20028 16924 (14833) | 26035 21230 (1926) | 110 110 (70) |
| IRAS 101901322 | 48947 26727 (426) | 45044 30931 (5311) | 53950 26426 (475) | 170 150 (70) |
| IRAS 115061331 | 48149 26335 (467) | 28262 19761 (6537) | 31866 25064 (1048) | 200 140 (63) |
| IRAS 135090442 | 47556 36646 (5430) | 48082 37771 (7131) | 49681 42376 (11753) | 220 160 (23) |
| IRAS 222062715 | 31088 140128 (16570) | 40197 204148 (16061) | 457104 217143 (14625) | 750 600 (88) |
| IRAS 121120305 NE AATaken from Imanishi et al. (2016c). | 25040 23040 (8584) | 36030 14060 (15513) | 37090 150140 (12827) | 730 550 (66) |
| IRAS 204141651 AATaken from Imanishi et al. (2016c). | 40040 32050 (16825) | 47060 300110 (17859) | 520120 410160 (10582) | 760 660 (89) |
| IRAS 224911808 AATaken from Imanishi et al. (2016c). | 430 110 (—) | 210100 15080 (1064) | could not deconvolve | 920 590 (67) |
Note. — Col.(1): Object name. Cols.(2),(3),(4): Intrinsic emission size (in mas) along the major and minor axis, after deconvolution, using the CASA task “imfit”, for the continuum, HCN J=3–2, and HCO+ J=3–2, respectively. The position angle (in degrees) is shown in parentheses. Col.(5): Synthesized beam size for the continuum data shown for comparison, because it is difficult to constrain the intrinsic emission size much smaller than the beam size. The size (in mas) along the major and minor axis, and the position angle (in degrees) (in parentheses) are shown.
| Object | Gaussian fit (HCN J=3–2) | Gaussian fit (HCO+ J=3–2) | ||||||
|---|---|---|---|---|---|---|---|---|
| Velocity | Peak | FWHM | Flux | Velocity | Peak | FWHM | Flux | |
| [km s-1] | [mJy] | [km s-1] | [Jy km s-1] | [km s-1] | [mJy] | [km s-1] | [Jy km s-1] | |
| (1) | (2) | (3) | (4) | (5) | (6) | (7) | (8) | (9) |
| IRAS 001880856 | 385486 | 191 | 33914 | 6.10.3 | 3851410 | 121 | 31920 | 3.50.3 |
| IRAS 032501606 | 3862028 | 5.80.6 | 54054 | 2.90.4 | 3865226 | 6.80.6 | 52058 | 3.30.5 |
| IRAS 041032838 | 3532786 | 4.91.9 | 382 (fix) | 1.80.7 | 3526757 | 7.01.8 | 315 (fix) | 2.10.5 |
| IRAS 090390503 (15) | 3758312 | 191 | 37629 | 6.80.7 | 3756911 | 191 | 38426 | 7.01.2 |
| IRAS 103781108 | 409119 | 161 | 38424 | 5.80.5 | 408959 | 161 | 37823 | 5.70.4 |
| IRAS 110950238 (15) | 3194940 | 142 | 458114 | 6.11.9 | 3190331 | 142 | 39786 | 5.51.5 |
| IRAS 133352612 N | 3748652 | 4.30.6 | 785136 | 3.20.7 | 3747164 | 3.30.7 | 646122 | 2.00.6 |
| IRAS 133352612 S | 3771862 | 2.81.0 | 338 (fix) | 0.890.33 | 3768179 | 1.90.5 | 460 (fix) | 0.810.22 |
| IRAS 143481447 SW | 2485010 | 241 | 37827 | 8.80.8 | 2484210 | 282 | 30221 | 8.30.8 |
| IRAS 143481447 NE | 2469122 | 121 | 41558 | 5.10.9 | 2471031 | 102 | 34668 | 3.40.9 |
| IRAS 160900139 | 4005413 | 211 | 53431 | 111 | 4009015 | 221 | 57638 | 121 |
| IRAS 213292346 (15) | 3752313 | 4.10.2 | 54430 | 2.10.2 | 3754815 | 4.90.3 | 52337 | 2.40.2 |
| IRAS 232340946 | 3838921 | 4.20.3 | 58543 | 2.30.2 | 3841123 | 4.70.4 | 53143 | 2.30.3 |
| IRAS 000910738 | 3518115,3560421 | 131,101 | 283,283 (fix) | 6.10.4 | 3516829,3572729 | 5.70.9,8.90.9 | 283,283 (fix) | 3.90.4 |
| IRAS 004562904 | 3293110 | 191 | 29921 | 5.50.5 | 3292412 | 161 | 28760 | 4.41.0 |
| IRAS 010042237 | 3538732 | 7.81.3 | 38383 | 2.80.8 | 3535927 | 7.51.0 | 381 (fix) | 2.70.4 |
| IRAS 011660844 SE | 3514140 | 8.91.1 | 384 (fix) | 3.30.4 | 3512334 | 7.91.3 | 38572 | 2.90.7 |
| IRAS 012980744 | 4097850 | 5.30.8 | 634117 | 3.10.8 | 4103145 | 5.90.8 | 662115 | 3.70.8 |
| IRAS 015692939 | 4199443 | 6.30.8 | 643108 | 3.80.8 | 4200632 | 8.50.7 | 73179 | 5.80.8 |
| IRAS 101901322 | 2280715 | 181 | 42932 | 7.70.8 | 2283519 | 161 | 44436 | 7.00.8 |
| IRAS 115061331 | 3810420 | 6.91.3 | 24554 | 1.60.5 | 3812715 | 9.81.4 | 25235 | 2.30.5 |
| IRAS 135090442 | 4092815 | 7.10.8 | 26731 | 1.80.3 | 4090712 | 8.80.8 | 24830 | 2.00.3 |
| IRAS 222062715 (15) | 394846 | 7.40.2 | 40315 | 2.80.1 | 395038 | 5.50.2 | 38619 | 2.00.1 |
| IRAS 121120305 NE (2′′) | 2183311 | 211 | 52023 | 111 | 216749,219569 | 132,161 | 15925,20126 | 5.30.7 |
| IRAS 121120305 SW (2′′) | 2195834 | 3.51.3 | 190 (fix) | 0.670.24 | 2195840 | 3.70.9 | 280 (fix) | 1.00.3 |
| IRAS 204141651 (15) | 2582311,2620411 | 8.20.5,9.40.4 | 23724,33024 | 5.00.3 | 2583511,2625012 | 7.10.6,7.40.6 | 22725,26331 | 3.50.4 |
| IRAS 224911808 (2′′) | 233139 | 191 | 45019 | 8.40.5 | 2326415 | 101 | 31439 | 3.30.5 |
Note. — Col.(1): Object name. Cols.(2)–(5): Gaussian fit of the HCN J=3–2 emission line (=265.886 GHz) (in Jy km s-1) in the spectrum within a 1–2′′ diameter circular aperture around the continuum peak position. Col.(2): Optical LSR velocity (vopt) of the emission line peak (in km s-1). Col.(3): Peak flux (in mJy). Col.(4): Observed FWHM (in km s-1). Col.(5): Flux (in Jy km s-1). Cols.(6)–(9): Gaussian fit of the HCO+ J=3–2 emission line (=267.558 GHz) (in Jy km s-1) in the spectrum within a 1–2′′ diameter circular aperture around the continuum peak position. Col.(6): Optical LSR velocity (vopt) of the emission line peak (in km s-1). Col.(7): Peak flux (in mJy). Col.(8): Observed FWHM (in km s-1). Col.(9): Flux (in Jy km s-1).
| Object | Peak (beam size) | Spatially integrated |
|---|---|---|
| (1) | (2) | (3) |
| IRAS 001880856 | 1.90.2 | 1.70.2 |
| IRAS 032501606 | 1.30.3 | 0.90.2 |
| IRAS 041032838 | 1.20.3 | 0.80.4 |
| IRAS 090390503 SW | 1.70.4 | 1.00.2 AAA 15 diameter circular aperture measurement. Fluxes from both nuclei are included. |
| IRAS 090390503 NE | 1.10.3 | 1.00.2 AAA 15 diameter circular aperture measurement. Fluxes from both nuclei are included. |
| IRAS 103781108 | 1.10.1 | 1.00.1 |
| IRAS 110950238 NE | 1.90.4 | 1.10.5 AAA 15 diameter circular aperture measurement. Fluxes from both nuclei are included. |
| IRAS 110950238 SW | 0.60.5 | 1.10.5 AAA 15 diameter circular aperture measurement. Fluxes from both nuclei are included. |
| IRAS 133352612 N | 1.50.5 | 1.60.6 |
| IRAS 133352612 S | 1.90.8 | 1.10.5 |
| IRAS 143481447 SW | 1.50.1 | 1.10.1 |
| IRAS 143481447 NE | 1.50.3 | 1.50.5 |
| IRAS 160900139 | 1.30.1 | 0.90.1 |
| IRAS 213292346 | 0.90.2 | 0.90.1 BB A 15 diameter circular aperture measurement. |
| IRAS 232340946 | 1.00.2 | 1.00.2 |
| IRAS 000910738 | 1.60.3 | 1.60.2 |
| IRAS 004562904 | 2.00.2 | 1.20.3 |
| IRAS 010042237 | 1.00.2 | 1.00.3 |
| IRAS 011660844 SE | 1.60.3 | 1.10.3 |
| IRAS 012980744 | 1.30.2 | 0.90.3 |
| IRAS 015692939 | 1.00.2 | 0.70.2 |
| IRAS 101901322 | 1.10.2 | 1.10.2 |
| IRAS 115061331 | 0.80.2 | 0.70.2 |
| IRAS 135090442 | 1.00.3 | 0.90.2 |
| IRAS 222062715 | 1.40.1 | 1.40.1 BB A 15 diameter circular aperture measurement. |
| IRAS 121120305 NE | 1.80.3 CC Adopted from Imanishi et al. (2016c). | 2.00.3 DD A 2′′ diameter circular aperture measurement. |
| IRAS 121120305 SW | 0.50.2 CC Adopted from Imanishi et al. (2016c). | 0.70.3 DD A 2′′ diameter circular aperture measurement. |
| IRAS 204141651 | 1.40.2 CC Adopted from Imanishi et al. (2016c). | 1.40.2 BB A 15 diameter circular aperture measurement. |
| IRAS 224911808 | 2.30.2 CC Adopted from Imanishi et al. (2016c). | 2.60.4 DD A 2′′ diameter circular aperture measurement. |
Note. — Col.(1): Object name. Col.(2): The ratio of HCN J=3–2 to HCO+ J=3–2 flux (in Jy km s-1) at the nuclear peak position within the beam size. Col.(3): The ratio of HCN J=3–2 to HCO+ J=3–2 flux (in Jy km s-1) within a 1′′ diameter circular aperture (unless otherwise noted).
| Object | HCN J=3–2 | HCO+ J=3–2 | HCN J=3–2 | HCO+ J=3–2 |
|---|---|---|---|---|
| 105 [L⊙] | 105 [L⊙] | 107 [K km s-1 pc2] | 107 [K km s-1 pc2] | |
| (1) | (2) | (3) | (4) | (5) |
| IRAS 001880856 | 5.30.3 | 3.00.3 | 885 | 504 |
| IRAS 032501606 | 2.60.4 | 2.90.4 | 426 | 487 |
| IRAS 041032838 | 1.30.5 | 1.50.4 | 228 | 256 |
| IRAS 090390503 (15) | 5.60.6 | 5.81.0 | 939 | 9416 |
| IRAS 103781108 | 5.70.5 | 5.70.4 | 958 | 937 |
| IRAS 104851447 | 0.23 AABased on the peak value in the integrated intensity (moment 0) map. | 0.22 AABased on the peak value in the integrated intensity (moment 0) map. | 3.8 AABased on the peak value in the integrated intensity (moment 0) map. | 3.6 AABased on the peak value in the integrated intensity (moment 0) map. |
| IRAS 110950238 (15) | 3.61.1 | 3.20.9 | 6018 | 5314 |
| IRAS 133352612 N | 2.60.6 | 1.70.5 | 449 | 277 |
| IRAS 133352612 S | 0.730.27 | 0.670.18 | 125 | 113 |
| IRAS 143481447 SW | 3.10.3 | 3.00.3 | 525 | 495 |
| IRAS 143481447 NE | 1.80.3 | 1.20.3 | 305 | 205 |
| IRAS 160900139 | 9.90.7 | 111 | 16512 | 18215 |
| IRAS 213292346 (15) | 1.70.1 | 2.00.2 | 292 | 323 |
| IRAS 232340946 | 2.00.2 | 2.00.2 | 333 | 334 |
| IRAS 000910738 | 4.50.3 | 2.90.3 | 755 | 474 |
| IRAS 004562904 | 3.50.3 | 2.80.6 | 585 | 4610 |
| IRAS 010042237 | 2.10.6 | 2.00.3 | 349 | 324 |
| IRAS 011660844 SE | 2.30.3 | 2.10.5 | 395 | 349 |
| IRAS 012980744 | 3.10.8 | 3.70.8 | 5212 | 6013 |
| IRAS 015692939 | 3.90.8 | 6.00.8 | 6514 | 9814 |
| IRAS 02411+0353 | 0.240.07 AABased on the peak value in the integrated intensity (moment 0) map. | 0.200.06 AABased on the peak value in the integrated intensity (moment 0) map. | 4.01.1 AABased on the peak value in the integrated intensity (moment 0) map. | 3.31.0 AABased on the peak value in the integrated intensity (moment 0) map. |
| IRAS 101901322 | 2.30.2 | 2.10.3 | 384 | 344 |
| IRAS 115061331 | 1.40.4 | 2.00.4 | 237 | 326 |
| IRAS 135090442 | 1.70.3 | 2.00.3 | 295 | 335 |
| IRAS 222062715 (15) | 2.60.1 | 1.80.1 | 432 | 302 |
| IRAS 121120305 NE (2′′) | 2.90.2 | 1.50.2 | 483 | 243 |
| IRAS 121120305 SW (2′′) | 0.180.07 | 0.280.07 | 3.01.1 | 4.61.2 |
| IRAS 204141651 (15) | 1.90.1 | 1.40.1 | 322 | 222 |
| IRAS 224911808 (2′′) | 2.60.1 | 1.00.2 | 432 | 173 |
Note. — Col.(1): Object name. Cols.(2) and (3): Luminosity of the HCN J=3–2 and HCO+ J=3–2 emission lines (in units of L⊙), respectively, derived from the spatially integrated (1–2′′) emission line flux (Table 7). Cols.(4) and (5): Luminosity of the HCN J=3–2 and HCO+ J=3–2 emission lines (in units of K km s-1 pc2), respectively, derived from the spatially integrated (1–2′′) emission line flux (Table 7).
| Object | Observed flux | Free-free emission |
|---|---|---|
| [mJy] | [mJy] | |
| (1) | (2) | (3) |
| IRAS 001880856 | 4.0 | 0.8 |
| IRAS 032501606 | 2.6 | 0.5 |
| IRAS 041032838 | 0.71 | 0.5 |
| IRAS 090390503 (15) | 3.8 | 0.5 |
| IRAS 103781108 | 3.2 | 0.6 |
| IRAS 104851447 | 2 | 0.5 |
| IRAS 110950238 (15) | 4.2 | 0.8 |
| IRAS 133352612 N | 2.3 | 0.5 |
| IRAS 133352612 S | 0.80 | 0.5 |
| IRAS 143481447 SW | 5.2 | 1.8 |
| IRAS 143481447 NE | 3.6 | 1.8 |
| IRAS 160900139 | 5.7 | 1.1 |
| IRAS 213292346 (15) | 1.7 | 0.5 |
| IRAS 232340946 | 1.9 | 0.5 |
| IRAS 000910738 | 7.8 | 0.7 |
| IRAS 004562904 | 4.4 | 0.8 |
| IRAS 010042237 | 1.3 | 0.6 |
| IRAS 011660844 SE | 1.9 | 0.5 |
| IRAS 012980744 | 4.5 | 0.7 |
| IRAS 015692939 | 1.9 | 0.5 |
| IRAS 024110353 | 2 | 0.4 |
| IRAS 101901322 | 6.4 | 1.1 |
| IRAS 115061331 | 2.8 | 0.8 |
| IRAS 135090442 | 2.5 | 0.5 |
| IRAS 222062715 (15) | 1.8 | 0.5 |
| IRAS 121120305 NE (2′′) | 9.8 | 2.4 |
| IRAS 121120305 SW (2′′) | 1.0 | 2.4 |
| IRAS 204141651 (15) | 5.9 | 1.2 |
| IRAS 224911808 (2′′) | 4.9 | 1.4 |
Note. — Col.(1): Object name. Col.(2): Spatially integrated continuum flux at 240 GHz (in mJy). A 1′′ diameter circular aperture is basically employed. A 15 or 2′′ diameter circular aperture is used for a small fraction of sources, which are indicated in column 1. Col.(3): Estimated free-free emission flux from HII-regions in starbursts at 240 GHz (in mJy). Upper limits mean possible AGN contribution to the observed far-infrared luminosity (5.6).
![[Uncaptioned image]](/html/1902.04124/assets/x1.png)
![[Uncaptioned image]](/html/1902.04124/assets/x2.png)
![[Uncaptioned image]](/html/1902.04124/assets/x3.png)
![[Uncaptioned image]](/html/1902.04124/assets/x4.png)
![[Uncaptioned image]](/html/1902.04124/assets/x5.png)
![[Uncaptioned image]](/html/1902.04124/assets/x6.png)
![[Uncaptioned image]](/html/1902.04124/assets/x7.png)
![[Uncaptioned image]](/html/1902.04124/assets/x8.png)
![[Uncaptioned image]](/html/1902.04124/assets/x9.png)
![[Uncaptioned image]](/html/1902.04124/assets/x10.png)
![[Uncaptioned image]](/html/1902.04124/assets/x11.png)
![[Uncaptioned image]](/html/1902.04124/assets/x12.png)
![[Uncaptioned image]](/html/1902.04124/assets/x13.png)
![[Uncaptioned image]](/html/1902.04124/assets/x14.png)
![[Uncaptioned image]](/html/1902.04124/assets/x15.png)
![[Uncaptioned image]](/html/1902.04124/assets/x16.png)
![[Uncaptioned image]](/html/1902.04124/assets/x17.png)
![[Uncaptioned image]](/html/1902.04124/assets/x18.png)
![[Uncaptioned image]](/html/1902.04124/assets/x19.png)
![[Uncaptioned image]](/html/1902.04124/assets/x20.png)
![[Uncaptioned image]](/html/1902.04124/assets/x21.png)
![[Uncaptioned image]](/html/1902.04124/assets/x22.png)
![[Uncaptioned image]](/html/1902.04124/assets/x23.png)
![[Uncaptioned image]](/html/1902.04124/assets/x24.png)
![[Uncaptioned image]](/html/1902.04124/assets/x25.png)
![[Uncaptioned image]](/html/1902.04124/assets/x26.png)
![[Uncaptioned image]](/html/1902.04124/assets/x27.png)
![[Uncaptioned image]](/html/1902.04124/assets/x28.png)
![[Uncaptioned image]](/html/1902.04124/assets/x29.png)
![[Uncaptioned image]](/html/1902.04124/assets/x30.png)
![[Uncaptioned image]](/html/1902.04124/assets/x31.png)
![[Uncaptioned image]](/html/1902.04124/assets/x32.png)
![[Uncaptioned image]](/html/1902.04124/assets/x33.png)
![[Uncaptioned image]](/html/1902.04124/assets/x34.png)
![[Uncaptioned image]](/html/1902.04124/assets/x35.png)
![[Uncaptioned image]](/html/1902.04124/assets/x36.png)
![[Uncaptioned image]](/html/1902.04124/assets/x37.png)
![[Uncaptioned image]](/html/1902.04124/assets/x38.png)
![[Uncaptioned image]](/html/1902.04124/assets/x39.png)
![[Uncaptioned image]](/html/1902.04124/assets/x40.png)
![[Uncaptioned image]](/html/1902.04124/assets/x41.png)
![[Uncaptioned image]](/html/1902.04124/assets/x42.png)
![[Uncaptioned image]](/html/1902.04124/assets/x43.png)
![[Uncaptioned image]](/html/1902.04124/assets/x44.png)
![[Uncaptioned image]](/html/1902.04124/assets/x45.png)
![[Uncaptioned image]](/html/1902.04124/assets/x46.png)
![[Uncaptioned image]](/html/1902.04124/assets/x47.png)
![[Uncaptioned image]](/html/1902.04124/assets/x48.png)
![[Uncaptioned image]](/html/1902.04124/assets/x49.png)
![[Uncaptioned image]](/html/1902.04124/assets/x50.png)
![[Uncaptioned image]](/html/1902.04124/assets/x51.png)
![[Uncaptioned image]](/html/1902.04124/assets/x52.png)
![[Uncaptioned image]](/html/1902.04124/assets/x53.png)
![[Uncaptioned image]](/html/1902.04124/assets/x54.png)
![[Uncaptioned image]](/html/1902.04124/assets/x55.png)
![[Uncaptioned image]](/html/1902.04124/assets/x56.png)
![[Uncaptioned image]](/html/1902.04124/assets/x57.png)
![[Uncaptioned image]](/html/1902.04124/assets/x58.png)
![[Uncaptioned image]](/html/1902.04124/assets/x59.png)
![[Uncaptioned image]](/html/1902.04124/assets/x60.png)
![[Uncaptioned image]](/html/1902.04124/assets/x61.png)
![[Uncaptioned image]](/html/1902.04124/assets/x62.png)
![[Uncaptioned image]](/html/1902.04124/assets/x63.png)
![[Uncaptioned image]](/html/1902.04124/assets/x64.png)
![[Uncaptioned image]](/html/1902.04124/assets/x65.png)
![[Uncaptioned image]](/html/1902.04124/assets/x66.png)
![[Uncaptioned image]](/html/1902.04124/assets/x67.png)
![[Uncaptioned image]](/html/1902.04124/assets/x68.png)
![[Uncaptioned image]](/html/1902.04124/assets/x69.png)
![[Uncaptioned image]](/html/1902.04124/assets/x70.png)
![[Uncaptioned image]](/html/1902.04124/assets/x71.png)
![[Uncaptioned image]](/html/1902.04124/assets/x72.png)
![[Uncaptioned image]](/html/1902.04124/assets/x73.png)
![[Uncaptioned image]](/html/1902.04124/assets/x74.png)
![[Uncaptioned image]](/html/1902.04124/assets/x75.png)
![[Uncaptioned image]](/html/1902.04124/assets/x76.png)


![[Uncaptioned image]](/html/1902.04124/assets/x83.png)
![[Uncaptioned image]](/html/1902.04124/assets/x84.png)
![[Uncaptioned image]](/html/1902.04124/assets/x85.png)
![[Uncaptioned image]](/html/1902.04124/assets/x86.png)
![[Uncaptioned image]](/html/1902.04124/assets/x87.png)
![[Uncaptioned image]](/html/1902.04124/assets/x88.png)
![[Uncaptioned image]](/html/1902.04124/assets/x89.png)
![[Uncaptioned image]](/html/1902.04124/assets/x90.png)
![[Uncaptioned image]](/html/1902.04124/assets/x91.png)
![[Uncaptioned image]](/html/1902.04124/assets/x92.png)
![[Uncaptioned image]](/html/1902.04124/assets/x93.png)
![[Uncaptioned image]](/html/1902.04124/assets/x94.png)
![[Uncaptioned image]](/html/1902.04124/assets/x95.png)
![[Uncaptioned image]](/html/1902.04124/assets/x96.png)
![[Uncaptioned image]](/html/1902.04124/assets/x97.png)
![[Uncaptioned image]](/html/1902.04124/assets/x98.png)
![[Uncaptioned image]](/html/1902.04124/assets/x99.png)
![[Uncaptioned image]](/html/1902.04124/assets/x100.png)
![[Uncaptioned image]](/html/1902.04124/assets/x101.png)
![[Uncaptioned image]](/html/1902.04124/assets/x102.png)
![[Uncaptioned image]](/html/1902.04124/assets/x103.png)
![[Uncaptioned image]](/html/1902.04124/assets/x104.png)
![[Uncaptioned image]](/html/1902.04124/assets/x105.png)
![[Uncaptioned image]](/html/1902.04124/assets/x106.png)
![[Uncaptioned image]](/html/1902.04124/assets/x107.png)
![[Uncaptioned image]](/html/1902.04124/assets/x108.png)
![[Uncaptioned image]](/html/1902.04124/assets/x109.png)
![[Uncaptioned image]](/html/1902.04124/assets/x110.png)
![[Uncaptioned image]](/html/1902.04124/assets/x111.png)
![[Uncaptioned image]](/html/1902.04124/assets/x112.png)
![[Uncaptioned image]](/html/1902.04124/assets/x113.png)
![[Uncaptioned image]](/html/1902.04124/assets/x114.png)
![[Uncaptioned image]](/html/1902.04124/assets/x115.png)
![[Uncaptioned image]](/html/1902.04124/assets/x116.png)
![[Uncaptioned image]](/html/1902.04124/assets/x117.png)
![[Uncaptioned image]](/html/1902.04124/assets/x118.png)
![[Uncaptioned image]](/html/1902.04124/assets/x119.png)
![[Uncaptioned image]](/html/1902.04124/assets/x120.png)
![[Uncaptioned image]](/html/1902.04124/assets/x121.png)
![[Uncaptioned image]](/html/1902.04124/assets/x122.png)
![[Uncaptioned image]](/html/1902.04124/assets/x123.png)
![[Uncaptioned image]](/html/1902.04124/assets/x124.png)
![[Uncaptioned image]](/html/1902.04124/assets/x125.png)
![[Uncaptioned image]](/html/1902.04124/assets/x126.png)
![[Uncaptioned image]](/html/1902.04124/assets/x127.png)
![[Uncaptioned image]](/html/1902.04124/assets/x128.png)
![[Uncaptioned image]](/html/1902.04124/assets/x129.png)
![[Uncaptioned image]](/html/1902.04124/assets/x130.png)
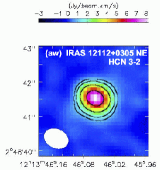
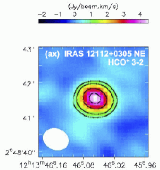
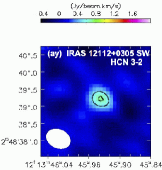
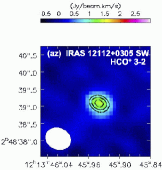
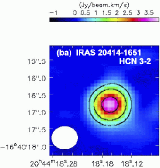
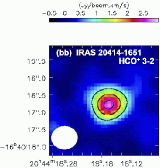
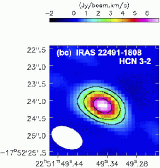
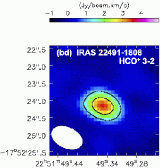
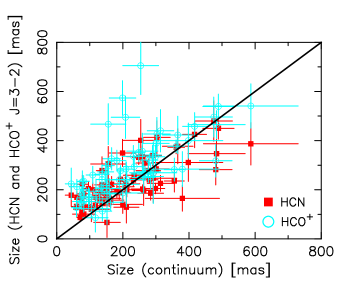

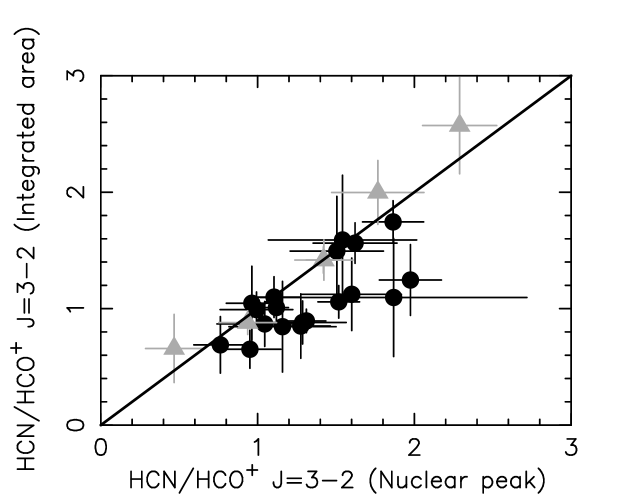
![[Uncaptioned image]](/html/1902.04124/assets/x142.png)
![[Uncaptioned image]](/html/1902.04124/assets/x143.png)
![[Uncaptioned image]](/html/1902.04124/assets/x144.png)
![[Uncaptioned image]](/html/1902.04124/assets/x145.png)
![[Uncaptioned image]](/html/1902.04124/assets/x146.png)
![[Uncaptioned image]](/html/1902.04124/assets/x147.png)
![[Uncaptioned image]](/html/1902.04124/assets/x148.png)
![[Uncaptioned image]](/html/1902.04124/assets/x149.png)
![[Uncaptioned image]](/html/1902.04124/assets/x150.png)
![[Uncaptioned image]](/html/1902.04124/assets/x151.png)
![[Uncaptioned image]](/html/1902.04124/assets/x152.png)
![[Uncaptioned image]](/html/1902.04124/assets/x153.png)
![[Uncaptioned image]](/html/1902.04124/assets/x154.png)
![[Uncaptioned image]](/html/1902.04124/assets/x155.png)
![[Uncaptioned image]](/html/1902.04124/assets/x156.png)
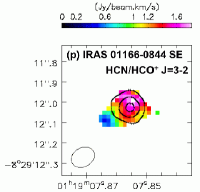
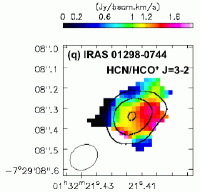
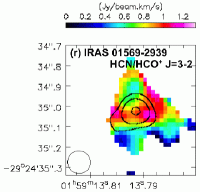
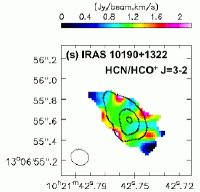
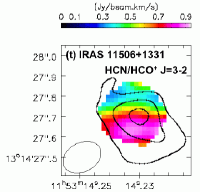
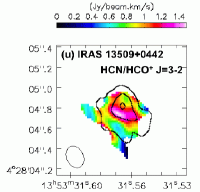
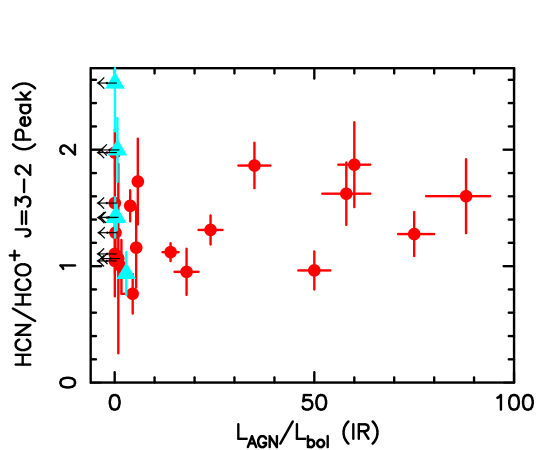


![[Uncaptioned image]](/html/1902.04124/assets/x175.png)
![[Uncaptioned image]](/html/1902.04124/assets/x176.png)
![[Uncaptioned image]](/html/1902.04124/assets/x177.png)
![[Uncaptioned image]](/html/1902.04124/assets/x178.png)
![[Uncaptioned image]](/html/1902.04124/assets/x179.png)
![[Uncaptioned image]](/html/1902.04124/assets/x180.png)
![[Uncaptioned image]](/html/1902.04124/assets/x181.png)
![[Uncaptioned image]](/html/1902.04124/assets/x182.png)
![[Uncaptioned image]](/html/1902.04124/assets/x183.png)
![[Uncaptioned image]](/html/1902.04124/assets/x184.png)
![[Uncaptioned image]](/html/1902.04124/assets/x185.png)
![[Uncaptioned image]](/html/1902.04124/assets/x186.png)
![[Uncaptioned image]](/html/1902.04124/assets/x187.png)
![[Uncaptioned image]](/html/1902.04124/assets/x188.png)
![[Uncaptioned image]](/html/1902.04124/assets/x189.png)
![[Uncaptioned image]](/html/1902.04124/assets/x190.png)
![[Uncaptioned image]](/html/1902.04124/assets/x191.png)
![[Uncaptioned image]](/html/1902.04124/assets/x192.png)
![[Uncaptioned image]](/html/1902.04124/assets/x193.png)
![[Uncaptioned image]](/html/1902.04124/assets/x194.png)
![[Uncaptioned image]](/html/1902.04124/assets/x195.png)
![[Uncaptioned image]](/html/1902.04124/assets/x196.png)
![[Uncaptioned image]](/html/1902.04124/assets/x197.png)
![[Uncaptioned image]](/html/1902.04124/assets/x198.png)
![[Uncaptioned image]](/html/1902.04124/assets/x199.png)
![[Uncaptioned image]](/html/1902.04124/assets/x200.png)
![[Uncaptioned image]](/html/1902.04124/assets/x201.png)
![[Uncaptioned image]](/html/1902.04124/assets/x202.png)
![[Uncaptioned image]](/html/1902.04124/assets/x203.png)
![[Uncaptioned image]](/html/1902.04124/assets/x204.png)
![[Uncaptioned image]](/html/1902.04124/assets/x205.png)
![[Uncaptioned image]](/html/1902.04124/assets/x206.png)
![[Uncaptioned image]](/html/1902.04124/assets/x207.png)
![[Uncaptioned image]](/html/1902.04124/assets/x208.png)
![[Uncaptioned image]](/html/1902.04124/assets/x209.png)
![[Uncaptioned image]](/html/1902.04124/assets/x210.png)
![[Uncaptioned image]](/html/1902.04124/assets/x211.png)
![[Uncaptioned image]](/html/1902.04124/assets/x212.png)
![[Uncaptioned image]](/html/1902.04124/assets/x213.png)
![[Uncaptioned image]](/html/1902.04124/assets/x214.png)
![[Uncaptioned image]](/html/1902.04124/assets/x215.png)
![[Uncaptioned image]](/html/1902.04124/assets/x216.png)
![[Uncaptioned image]](/html/1902.04124/assets/x217.png)
![[Uncaptioned image]](/html/1902.04124/assets/x218.png)
![[Uncaptioned image]](/html/1902.04124/assets/x219.png)
![[Uncaptioned image]](/html/1902.04124/assets/x220.png)
![[Uncaptioned image]](/html/1902.04124/assets/x221.png)
![[Uncaptioned image]](/html/1902.04124/assets/x222.png)
![[Uncaptioned image]](/html/1902.04124/assets/x223.png)
![[Uncaptioned image]](/html/1902.04124/assets/x224.png)
![[Uncaptioned image]](/html/1902.04124/assets/x225.png)
![[Uncaptioned image]](/html/1902.04124/assets/x226.png)
![[Uncaptioned image]](/html/1902.04124/assets/x227.png)
![[Uncaptioned image]](/html/1902.04124/assets/x228.png)
![[Uncaptioned image]](/html/1902.04124/assets/x229.png)
![[Uncaptioned image]](/html/1902.04124/assets/x230.png)
![[Uncaptioned image]](/html/1902.04124/assets/x231.png)
![[Uncaptioned image]](/html/1902.04124/assets/x232.png)
![[Uncaptioned image]](/html/1902.04124/assets/x233.png)
![[Uncaptioned image]](/html/1902.04124/assets/x234.png)
![[Uncaptioned image]](/html/1902.04124/assets/x235.png)
![[Uncaptioned image]](/html/1902.04124/assets/x236.png)
![[Uncaptioned image]](/html/1902.04124/assets/x237.png)
![[Uncaptioned image]](/html/1902.04124/assets/x238.png)
![[Uncaptioned image]](/html/1902.04124/assets/x239.png)
![[Uncaptioned image]](/html/1902.04124/assets/x240.png)
![[Uncaptioned image]](/html/1902.04124/assets/x241.png)
![[Uncaptioned image]](/html/1902.04124/assets/x242.png)
![[Uncaptioned image]](/html/1902.04124/assets/x243.png)
![[Uncaptioned image]](/html/1902.04124/assets/x244.png)
![[Uncaptioned image]](/html/1902.04124/assets/x245.png)
![[Uncaptioned image]](/html/1902.04124/assets/x246.png)
![[Uncaptioned image]](/html/1902.04124/assets/x247.png)
![[Uncaptioned image]](/html/1902.04124/assets/x248.png)
![[Uncaptioned image]](/html/1902.04124/assets/x249.png)
![[Uncaptioned image]](/html/1902.04124/assets/x250.png)
![[Uncaptioned image]](/html/1902.04124/assets/x251.png)
![[Uncaptioned image]](/html/1902.04124/assets/x252.png)
![[Uncaptioned image]](/html/1902.04124/assets/x253.png)
![[Uncaptioned image]](/html/1902.04124/assets/x254.png)
![[Uncaptioned image]](/html/1902.04124/assets/x255.png)
![[Uncaptioned image]](/html/1902.04124/assets/x256.png)
![[Uncaptioned image]](/html/1902.04124/assets/x257.png)
![[Uncaptioned image]](/html/1902.04124/assets/x258.png)
![[Uncaptioned image]](/html/1902.04124/assets/x259.png)
![[Uncaptioned image]](/html/1902.04124/assets/x260.png)
![[Uncaptioned image]](/html/1902.04124/assets/x261.png)
![[Uncaptioned image]](/html/1902.04124/assets/x262.png)
![[Uncaptioned image]](/html/1902.04124/assets/x263.png)
![[Uncaptioned image]](/html/1902.04124/assets/x264.png)
![[Uncaptioned image]](/html/1902.04124/assets/x265.png)
![[Uncaptioned image]](/html/1902.04124/assets/x266.png)
![[Uncaptioned image]](/html/1902.04124/assets/x267.png)
![[Uncaptioned image]](/html/1902.04124/assets/x268.png)
![[Uncaptioned image]](/html/1902.04124/assets/x269.png)
![[Uncaptioned image]](/html/1902.04124/assets/x270.png)
![[Uncaptioned image]](/html/1902.04124/assets/x271.png)
![[Uncaptioned image]](/html/1902.04124/assets/x272.png)
![[Uncaptioned image]](/html/1902.04124/assets/x273.png)
![[Uncaptioned image]](/html/1902.04124/assets/x274.png)
![[Uncaptioned image]](/html/1902.04124/assets/x275.png)
![[Uncaptioned image]](/html/1902.04124/assets/x276.png)
![[Uncaptioned image]](/html/1902.04124/assets/x277.png)
![[Uncaptioned image]](/html/1902.04124/assets/x278.png)
![[Uncaptioned image]](/html/1902.04124/assets/x279.png)
![[Uncaptioned image]](/html/1902.04124/assets/x280.png)


![[Uncaptioned image]](/html/1902.04124/assets/x289.png)
![[Uncaptioned image]](/html/1902.04124/assets/x290.png)
![[Uncaptioned image]](/html/1902.04124/assets/x291.png)
![[Uncaptioned image]](/html/1902.04124/assets/x292.png)
![[Uncaptioned image]](/html/1902.04124/assets/x293.png)
![[Uncaptioned image]](/html/1902.04124/assets/x294.png)
![[Uncaptioned image]](/html/1902.04124/assets/x295.png)
![[Uncaptioned image]](/html/1902.04124/assets/x296.png)
![[Uncaptioned image]](/html/1902.04124/assets/x297.png)
![[Uncaptioned image]](/html/1902.04124/assets/x298.png)
![[Uncaptioned image]](/html/1902.04124/assets/x299.png)
![[Uncaptioned image]](/html/1902.04124/assets/x300.png)
![[Uncaptioned image]](/html/1902.04124/assets/x301.png)
![[Uncaptioned image]](/html/1902.04124/assets/x302.png)
![[Uncaptioned image]](/html/1902.04124/assets/x303.png)
![[Uncaptioned image]](/html/1902.04124/assets/x304.png)
![[Uncaptioned image]](/html/1902.04124/assets/x305.png)
![[Uncaptioned image]](/html/1902.04124/assets/x306.png)
![[Uncaptioned image]](/html/1902.04124/assets/x307.png)
![[Uncaptioned image]](/html/1902.04124/assets/x308.png)
![[Uncaptioned image]](/html/1902.04124/assets/x309.png)
![[Uncaptioned image]](/html/1902.04124/assets/x310.png)
![[Uncaptioned image]](/html/1902.04124/assets/x311.png)
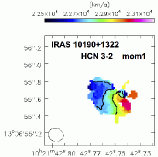
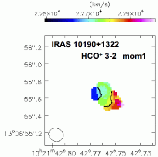
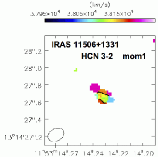
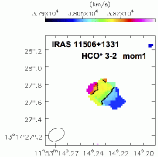
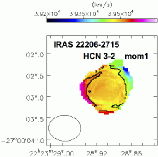
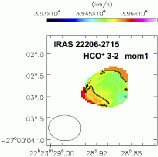
![[Uncaptioned image]](/html/1902.04124/assets/x318.png)
![[Uncaptioned image]](/html/1902.04124/assets/x319.png)
![[Uncaptioned image]](/html/1902.04124/assets/x320.png)
![[Uncaptioned image]](/html/1902.04124/assets/x321.png)
![[Uncaptioned image]](/html/1902.04124/assets/x322.png)
![[Uncaptioned image]](/html/1902.04124/assets/x323.png)
![[Uncaptioned image]](/html/1902.04124/assets/x324.png)
![[Uncaptioned image]](/html/1902.04124/assets/x325.png)
![[Uncaptioned image]](/html/1902.04124/assets/x326.png)
![[Uncaptioned image]](/html/1902.04124/assets/x327.png)
![[Uncaptioned image]](/html/1902.04124/assets/x328.png)
![[Uncaptioned image]](/html/1902.04124/assets/x329.png)
![[Uncaptioned image]](/html/1902.04124/assets/x330.png)
![[Uncaptioned image]](/html/1902.04124/assets/x331.png)
![[Uncaptioned image]](/html/1902.04124/assets/x332.png)
![[Uncaptioned image]](/html/1902.04124/assets/x333.png)
![[Uncaptioned image]](/html/1902.04124/assets/x334.png)
![[Uncaptioned image]](/html/1902.04124/assets/x335.png)
![[Uncaptioned image]](/html/1902.04124/assets/x336.png)
![[Uncaptioned image]](/html/1902.04124/assets/x337.png)
![[Uncaptioned image]](/html/1902.04124/assets/x338.png)
![[Uncaptioned image]](/html/1902.04124/assets/x339.png)
![[Uncaptioned image]](/html/1902.04124/assets/x340.png)