A Wide-field Photometric Survey of Globular Clusters in the Peculiar Early-type Galaxy M85
Abstract
We survey globular clusters (GCs) in M85 using -band images of a field obtained with the MegaCam at the 3.6 m Canada-France-Hawaii Telescope. We identify 1318 GC candidates with 20.0 mag 23.5 mag in the entire survey region. Their radial number density profile is well fit by a Sérsic profile with = 2.58 and effective radius = 414 (= 22 kpc), showing that the candidates at are mostly genuine GCs in M85. We estimate the total number of GCs, (total) = , and the specific frequency, . The overall color distribution of the GCs in M85 is bimodal, but the GCs in the central region at do not show a bimodal distribution clearly. The radial number density profile and surface number density map of the blue GCs (BGCs) show more extended structures than those of the red GCs (RGCs). The spatial distributions of both BGCs and RGCs are elongated, similar to that of the galaxy stellar light. The number fraction of the RGCs in the central region is much smaller compared to those in other early-type galaxies of similar luminosity. The mean color of the RGCs in M85 is about 0.1 mag bluer than typical values for other Virgo early-type galaxies of similar luminosity, indicating that a significant fraction of the RGCs in M85 may be younger than typical GCs. These results indicate that M85 might have undergone a major wet merger recently.
1 Introduction
According to the hierarchical galaxy formation scenario, massive early-type galaxies are formed by undergoing numerous mergers. Globular clusters (GCs) are one of the excellent tools available to trace the assembly history of individual galaxies.
In the past decade, there have been several observational studies with statistically meaningful samples about the physical properties of GCs associated with their host galaxies (Peng et al., 2008; Forte et al., 2009; Georgiev et al., 2010; Villegas et al., 2010; Chies-Santos et al., 2011; Liu et al., 2011; Cho et al., 2012; Harris et al., 2013, 2015; Park & Lee, 2013; Pota et al., 2013; Wang et al., 2013; Pastorello et al., 2015; Zaritsky et al., 2015; Forbes et al., 2016; Forbes, 2017; van Dokkum et al., 2017; Amorisco et al., 2018; Forbes & Remus, 2018; Lim et al., 2018). One of the most prominent features of the GCs in massive early-type galaxies is their bimodal color distribution (see the references in Brodie & Strader (2006)). The GC color bimodality indicates that there are two distinguishable populations residing in the same galaxy. The color of the old GCs can be a proxy for their metallicity, so the blue GCs (BGCs) and red GCs (RGCs) are thought to be metal-poor and metal-rich populations, respectively . These two GC subpopulations show significant differences in their radial extents and two-dimensional structures. The radial distributions of the BGCs in several massive early-type galaxies are found to be more extended to the outer region of galaxies than those of the RGCs (Kissler-Patig et al., 1997; Lee et al., 1998; Strader et al., 2011; Forbes et al., 2012). Furthermore, the RGC systems in massive early-type galaxies are more elongated along their host galaxy stellar light than the BGC systems, although both GC systems are well aligned with the major axis of their host galaxies (Park & Lee, 2013; Wang et al., 2013). All of these studies show that the RGCs are much more correlated with the stellar light in their host galaxies compared with the BGCs. These results suggest that massive early-type galaxies may have dual halos, a metal-poor halo and a metal-rich halo (Park & Lee, 2013).
There have been several formation scenarios proposed to explain the presence of these two subpopulations of GCs in massive early-type galaxies. Ashman & Zepf (1992) and Zepf & Ashman (1993) suggested that elliptical galaxies are formed by gas-rich major mergers between disk galaxies. In this model, metal-poor GCs originated from the progenitor spirals and metal-rich GCs were formed during the merging epoch. Forbes et al. (1997) suggested a multiphase collapse scenario where metal-poor GCs were formed during the early stage of galaxy formation at high redshift and metal-rich GCs were formed during the second collapse phase after a few gigayears. Côté et al. (1998) suggested an accretion scenario where metal-rich GCs were formed in a massive seed galaxy and metal-poor GCs were accreted from nearby low-mass galaxies. Lee et al. (2010a) proposed a mixed model that includes the key ingredients of the previous models described above. In this model, metal-poor GCs were mainly formed in low-mass dwarf galaxies and metal-rich GCs were formed in massive galaxies in-situ or in dissipative merging galaxies after metal-poor GCs. Massive galaxies grow via dissipationless mergers with surrounding dwarf galaxies. Consequently, metal-poor GCs in the outer part of massive galaxies mainly originated from dwarf galaxies via accretion.
All of the above explanations about GC formation assume that both BGCs and RGCs were formed at an early epoch. However, every galaxy has a different merging history, and some galaxies might have a dissipative merger much after both BGCs and RGCs were formed. If so, some galaxies may host an intermediate-age GC population that was formed during the gas-rich merging events that occurred at a later stage. In this study, we investigate the GC system in M85, one of the nearest massive early-type galaxies, which is known to host intermediate-age GCs.
M85 (NGC 4382, VCC 798) is the fifth-brightest early-type galaxy in the Virgo Cluster, classified as S01(3)pec in Binggeli et al. (1985), SA0+pec in de Vaucouleurs et al. (1991), and E2 in Kormendy et al. (2009). It is located in the northernmost region of the Virgo Cluster, far from the main body of the Virgo Cluster, where bright early-type galaxies are located.
It shows several merger-induced features such as distorted isophotes (Burstein, 1979), shells, ripples (Schweizer & Seitzer, 1988), boxy isophotes (Ferrarese et al., 2006), and a kinematically decoupled core (McDermid et al., 2004).
In addition, the GCs in M85 do not show a bimodal color distribution clearly, unlike the GCs in other bright galaxies in Virgo. Based on the data for the GCs in 100 early-type galaxies from the ACS Virgo Cluster Survey (ACSVCS; Côté et al. 2004), Peng et al. (2006a) suggested that M85 is the best candidate that may have a trimodal GC color distribution. This trimodal color distribution might originate from the presence of an intermediate-age GC population. In addition, Trancho et al. (2014) investigated the GCs in the northwestern region of M85 based on optical photometry from the ACSVCS and -band photometry taken with the Near InfraRed Imager and spectrograph (NIRI) attached at the Gemini North telescope. They suggested that about 85% of the observed GCs were formed about 1.8 Gyr ago. Recently, Ko et al. (2018) presented a Gemini/GMOS spectroscopic study of the GCs in the central region of M85, and they showed that there is a 4 Gyr old GC population in addition to the old one.
Besides, Peng et al. (2008) presented the specific frequency of the GCs in the ACSVCS galaxies. They derived the specific frequency of the M85 GCs as = 1.29 0.21 using the radial number density profile of the GCs based on the ACSVCS and WFPC2 imaging data and the GC luminosity function (GCLF) from Jordán et al. (2007). However, all of these previous studies of the GCs covered only a small extent of M85 (less than ) because of the small field of view of the instruments used in their studies.
In this study, we present the first wide-field photometric survey of the GCs in M85 covering a field, using the MegaCam attached at the 3.6 m Canada-France-Hawaii Telescope (CFHT). This paper is organized as follows. We briefly describe our observations and data reduction in Section 2. In Section 3, we identify the GC candidates in the survey region and investigate their color distribution. Then, we present spatial distributions of the GC subpopulations. The main results are discussed in Section 4 and summarized in the Section 5. We adopted a distance to M85 of 17.9 Mpc based on surface brightness fluctuation measurements (Mei et al., 2007). One arcminute corresponds to 5.21 kpc at the distance to M85.
2 Observations and Data Reduction
2.1 Observation
We carried out a wide-field photometric survey of GCs in M85 using MegaCam (Boulade et al., 2003) mounted on the CFHT (program ID: 14AK06; PI: Myung Gyoon Lee) during 2014 May and July. The CFHT/MegaCam is composed of 9 4 CCDs with a pixel scale of 0187 and covers a field.
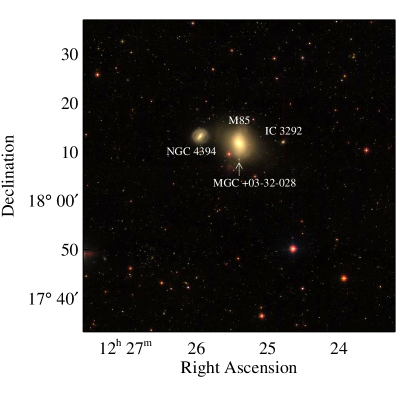
Figure 1 shows the observation field. M85 is surrounded by the barred spiral galaxy NGC 4394 and two dwarf galaxies IC 3292 and MGC +03-32-028. The radial velocities of M85, NGC 4394, IC 3292, and MGC +03-32-028 are 772, 1001, 696, and 1228 km s-1, respectively, from the Sloan Digital Sky Survey (SDSS) DR7 catalog (Abazajian et al., 2009). These four galaxies compose a small group. There are seen no other possible members of this group as seen in Figure 1. Thus, the M85 group is located in a very low density region.
We used filters because they provide two color combinations that have been extensively used for selecting GC candidates . Exposure times were 5 720 s for , 5 463 s for , and 7 575 s for . Table 1 shows the observation log. Mean values of the seeing were 079 for , 106 for , and 060 for . We used a small dithering pattern for individual exposures for each filter. The small gaps between the individual CCDs were filled by this dithering pattern, while the horizontal large gaps between the first and second rows and between the third and last rows of the CCDs were filled only partially. The basic data reduction, including the standard bias and flat-field corrections, was performed with the ‘Elixir’ pipeline (Magnier & Cuillandre, 2004).
| Filter | (exp) | (exp) | Air Mass | Seeing | Date (UT) |
|---|---|---|---|---|---|
| (s) | (arcsec) | ||||
| 5 | 720 | 1.018 | 0.79 | 2014 May 28 | |
| 5 | 463 | 1.039 | 1.06 | 2014 May 26 | |
| 5 | 575 | 1.004 | 0.60 | 2014 May 29 | |
| 2 | 575 | 1.538 | 0.56 | 2014 Jul 24 |
2.2 Photometry and Standard Calibration
We performed astrometry for -band images with SCAMP (Bertin, 2006) using the point-source catalog from SDSS DR7 (Abazajian et al., 2009). The images for each filter were stacked with SWARP (Bertin et al., 2002) after the galaxy light of M85 and the nearby spiral galaxy NGC 4394 were subtracted with the IRAF/ELLIPSE task. We removed the sky background from each image and set the sky level as zero.
We used SExtractor (Bertin & Arnouts, 1996) on the band stacked images for source detection and photometry. We detected sources in the -band image with a threshold of 3 and performed aperture photometry with aperture diameters of 8 pixels on the images with the dual-image mode. The standard calibration of the instrumental magnitudes was done with SDSS DR12 point-spread function (PSF) photometry (Alam et al., 2015) after the SDSS magnitudes were transformed to the CFHT/MegaCam magnitude system111http://www.cadc-ccda.hia-iha.nrc-cnrc.gc.ca/en/megapipe/docs/filt.html. We divided the survey region into 20 subregions for the -band image and 36 subregions for the -band images and applied the calibration differently depending on the location of each source. Standard calibration errors are, on average, 0.04, 0.02, and 0.02 mag for -, -, and -band photometry, respectively. Hereafter, all photometry results of this study are based on the AB magnitudes in the CFHT/MegaCam filter system.

Figure 2 shows the comparison of -band magnitudes derived in this study with those in the GC catalog of the ACSVCS (Jordán et al., 2009). The F475W magnitudes are the same as the dereddened SDSS -band AB magnitudes. For comparison, we converted the magnitudes from both this study and Jordán et al. (2009) to the SDSS -band AB magnitudes without foreground reddening correction. There are 89 common sources between this study and Jordán et al. (2009), and the -band magnitudes in both studies agree well. The median value of the difference between the two is mag, and its rms and mean error are 0.088 mag and 0.009 mag, respectively.
3 Results
3.1 GC Candidate Selection
We selected GC candidates using three criteria: magnitude concentration parameter, color-color diagram, and magnitude ranges. Each is described in the following.
First, we selected GC candidates among the point-like and slightly extended sources detected in the survey region. Most GCs are expected to be point-like or slightly extended in MegaCam images at the distance of the Virgo Cluster. The sources in the images are expected to be marginally resolved if their sizes are at least 0.1 FWHM(PSF) (Harris, 2009). The seeing value of the -band images in this study is 06, corresponding to 52 pc at the distance of M85. Therefore, we can marginally resolve the sources with sizes of 5 pc (with effective radii 2.5 pc). Durrell et al. (2014) confirmed that the magnitude concentration index , defined as the -band magnitude differences between 4-pixel and 8-pixel aperture photometry, is effective at distinguishing these resolved sources in the CFHT/MegaCam images. They presented a large-scale distribution of GCs in the Virgo Cluster based on photometry from the Next Generation Virgo Cluster Survey (NGVS; Ferrarese et al. 2012). We adopted the same concentration index criterion as in Durrell et al. (2014) because the -band seeing in this study is the same as theirs. We selected nonresolved sources with and marginally resolved sources with .
Figure 3(a) shows the -band magnitude versus concentration index diagram. The point-source sequence is clearly shown at , while extended sources have much larger concentration indices. The histogram of the values for the bright sources with 20.5 mag 21.0 mag shows a strong narrow component with a peak at and a much broader and weaker component with a peak at (see Figure 3(b)). The narrow component is mainly due to point sources, while the broad component is due to extended sources. However, it is noted that the right side of the narrow component shows a long tail. This is due to slightly extended sources, which include slightly resolved GCs in M85. We used the concentration index criterion, , for selecting point-like and slightly extended sources. Durrell et al. (2014) adopted the same selection criterion for Virgo GC selection.
In Figure 3(a) we plot known GCs in M85 that were spectroscopically confirmed based on Gemini/GMOS (Ko et al., 2018) and MMT/Hectospec observations (Ko, Y. et al. 2019, in preparation). Their -band magnitude ranges from = 18 to 22 mag. Among 74 spectroscopic samples, 92% of them have values of –0.02 to 0.15, satisfying the GC selection criteria adopted in this study. However, seven of them have C values of , exceeding the GC selection criterion. Therefore, these extended GCs will be missed in our GC selection.
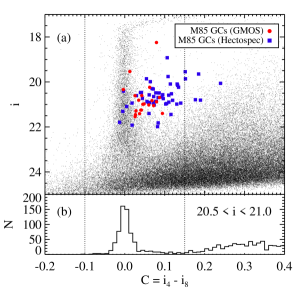
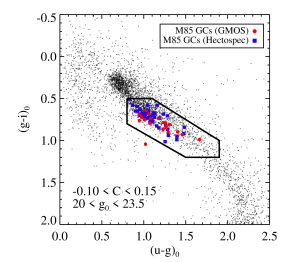
Figure 4 shows the color-color diagram for the sources with and 20.0 mag 23.5 mag. We used the foreground galactic extinction values for M85 derived by Schlafly & Finkbeiner (2011): , , and . Lim et al. (2017) presented a guideline for the GC selection based on photometry using spectroscopically confirmed GCs in M87. We adopted their color criteria, shown by a polygon in Figure 4, as follows:
We also plot the spectroscopically confirmed GCs in M85 (Ko et al. 2018; Ko, Y. et al. 2019, in preparation) in Figure 4. All except one are located inside the polygon, satisfying the GC selection criteria. Note that there are few RGCs in the spectroscopically confirmed GCs of M85 compared to the red limit of the guideline based on M87 GCs. In addition to the color criteria, we set the magnitude criterion as 20.0 mag 23.5 mag. The point-like sources with mag are mainly contaminated by foreground stars. We set the faint limit mag, where the color uncertainty is around 0.1 mag.
Applying all the criteria mentioned above, we selected 1318 GC candidates in the entire survey field. A catalog of these GC candidates is presented in Table 2.
| ID | (J2000) | (J2000) | ||||
|---|---|---|---|---|---|---|
| (deg) | (deg) | (mag) | (mag) | (mag) | (mag) | |
| GC0001 | 185.831070 | 18.427156 | 23.392 0.032 | 1.03 0.09 | 0.89 0.05 | –0.046 |
| GC0002 | 185.832062 | 18.395197 | 22.541 0.017 | 1.11 0.05 | 0.61 0.03 | –0.039 |
| GC0003 | 185.834488 | 18.306896 | 22.624 0.014 | 0.96 0.03 | 0.73 0.02 | 0.087 |
| GC0004 | 185.835114 | 18.226645 | 21.112 0.004 | 0.96 0.01 | 0.69 0.01 | –0.018 |
| GC0005 | 185.835190 | 18.544601 | 22.120 0.009 | 0.97 0.02 | 0.83 0.01 | 0.050 |
Note. — Table 2 is published in its entirety in the electronic edition. The five sample GCs are shown here as guidance for the table’s form and content.

3.2 Radial Number Density Profiles of the GC Candidates
In Figure 5, we derived the radial number density profile of the GC candidates in the survey region. The radial surface density profile decreases as the galactocentric distance increases at , and it becomes flat at . Thus, most of the GC candidates at are indeed members of M85.
To supplement the radial density profile for the central region of M85, we used the ACSVCS photometry of GCs in M85 (Jordán et al., 2009). From this photometry, we obtained the radial number density profile of the GCs with 20 mag 23.5 mag at , as displayed in Figure 5. The radial number density profile of the ACSVCS GCs at shows good agreement with that in this study. The radial profile of the CFHT GCs flattens at where the photometric completeness drops to 65% (see Figure LABEL:fig:completeness). After completeness correction, the number density becomes consistent with that derived from the ACSVCS data. We combined the ACSVCS data for the inner region at and the CFHT data for the outer region at to derive the radial number density profile of the entire region of M85.
Then, we fitted the radial number density profile of the GCs with a Sérsic function to measure the size of the GC system and the background level. The Sérsic profile including the background level is defined as follows (Sérsic, 1963; Graham & Driver, 2005):
| (1) |
where is the number density of the GCs at the effective radius , is the Sérsic index, is the term related with (), and bg is the background level.
The uncertainties of the parameters are estimated using the bootstrap procedure. We constructed an artificial data set by randomly choosing 1318 GC candidates from the actual data allowing replacement, and we repeated it 1000 times to create 1000 artificial data sets. We fitted the radial number density profile based on the artificial data sets with the Sérsic function, and we estimated 16th and 84th percentiles for the fitted parameters. The differences between these values and the parameters derived using the actual data are defined as the uncertainties of the parameters. We derived the Sérsic index to be , the effective radius of the GC system to be arcmin, and the background level to be bg = arcmin-2. The Sérsic fit parameters are summarized in Table 3. The GC candidates at , corresponding to , are considered to be mostly genuine GCs, . We used these sources for the following analysis.
| Sample | bg | ||||
|---|---|---|---|---|---|
| (arcmin-2) | (arcmin) | (kpc) | (arcmin-2) | ||
| All GCs | 1.96 | 2.58 | 4.14 | 21.6 | 0.22 |
| BGCs | 0.85 | 2.28 | 5.75 | 30.0 | 0.14 |
| RGCs | 1.98 | 1.80 | 2.02 | 10.5 | 0.09 |
3.3 Luminosity Function and Total Number of GCs
Figure 6(a) and (b) show the GCLFs for the galaxy region and the background region. We corrected the GCLFs using the completeness test results derived in Section 2.3 and derived the background-subtracted GCLF considering the ratio of their areas (see Figure 6(c)). We fitted the background-subtracted GCLF with a Gaussian function, using only the magnitude range of mag where the completeness is higher than 50%. The turnover magnitude and Gaussian width were derived to be mag and , respectively.

Jordán et al. (2007) presented the GCLFs of Virgo early-type galaxies using the ACSVCS data. They found that the GCLF of M85 follows a Gaussian distribution with a peak of mag and a width of . The turnover magnitude and Gaussian width derived in this study are much brighter and narrower, respectively, than those from Jordán et al. (2007). This difference is due to the faint excess at mag in the GCLF of the ACSVCS, which is not detected in this study. M85 is known to host a number of diffuse star clusters that have low surface brightness of mag arcsec-2 (Peng et al., 2006b). Jordán et al. (2007) pointed out that the faint end of the ACSVCS GCLF might be contaminated by faint diffuse star clusters. However, we only considered typical GCs brighter than mag when constructing the GCLF in this study.
We estimated the total number of GCs in M85 based on their radial number density profile and the GCLF derived in this study. The radial number density profile of the GCs with 20 mag 23.5 mag was fitted to the Sérsic function including the background level (see Section 3.2 and Figure 5). We integrated the background-level-subtracted Sérsic function from up to , estimating the number of GCs with 20 mag 23.5 mag to be 617. We calculated the number fractions of the bright GCs with mag and the faint GCs with mag using the Gaussian fit result of the GCLF, which are 0.05% and 49%, respectively. Adding up the number of GCs in the entire magnitude range, the total number of GCs was estimated to be (total) . Adopting the total -band luminosity of M85, mag (Peng et al., 2008), we derived the specific frequency of the M85 GC system to be . The uncertainties of the total number and specific frequency of M85 GCs were estimated using the bootstrap procedure, as described above.
The specific frequency of the M85 GCs presented by Peng et al. (2008) is consistent with the one derived in this study within uncertainties. However, it is hard to directly compare these two values because we did not include low surface brightness star clusters in this study, and the ACSVCS did not cover the entire radial range of M85.
3.4 Color Distribution of the GC Candidates
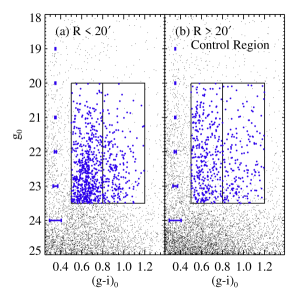
Figure 7(a) and (b) show color-magnitude diagrams (CMDs) for the sources with in the galaxy region at and in the control region at . We marked the magnitude and color boundaries for GC selection by large boxes and plotted the GC candidates by blue symbols. The M85 GC candidates show a distinct sequence on the CMD, which is not seen in the control region. In particular, a strong vertical sequence appears at . The GC candidates in the control region are mostly foreground stars. The GC candidates with are mainly contaminated by the Sgr main-sequence, subgiant, and RGB stars, and the GC candidates with are mainly contaminated by Milky Way disk stars (Durrell et al., 2014).
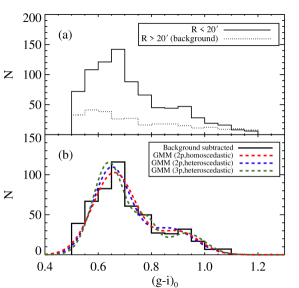
Figure 8(a) shows the color distribution of the GC candidates. The GC candidates in the control region () have a more uniform color distribution with a bluer peak than those in M85. We subtracted the foreground and background contamination from the color distribution of GCs at , considering the ratio of their areas. The background-subtracted color histogram of the GCs at ranges from = 0.5 to 1.1, and shows two peaks, a strong peak at and a much weaker peak at .
To decompose this background-subtracted color distribution of the GCs, we performed the Gaussian Mixture Modeling (GMM; Muratov & Gnedin 2010), assuming bimodal color distributions with the same variances (homoscedastic case) and different variances (heteroscedastic case). It is expected that there are about 277 contaminants among 810 GC candidates at , according to the background level of bg = 0.22 arcmin-2 from the radial number density profile fitting result (see Section 3.2). We randomly picked 277 GC candidates in the background region. Then, we subtracted 277 GC candidates in the galaxy region that have colors similar to those of the picked candidates in the background region. We constructed 100 different data sets after subtracting the contaminants. We ran GMM tests for these 100 data sets and measured the mean colors and Gaussian widths of the two components by adopting the mean values of the 100 GMM results. We estimated the uncertainties of the mean colors and Gaussian widths corresponding to 68% (1) confidence intervals. The GMM results are summarized in Table 4.
| Sample | Mode | ||||||
|---|---|---|---|---|---|---|---|
| 533 | Unimodal | 0.71 | 0.13 | 1 | |||
| Bimodal | 0.66 | 0.08 | 0.78 | 3.10 | 4.27e-16 | ||
| (homoscedastic) | 0.90 | 0.08 | 0.22 | ||||
| Bimodal | 0.65 | 0.07 | 0.72 | 2.73 | 9.55e-16 | ||
| (heteroscedastic) | 0.87 | 0.09 | 0.28 | ||||
| Trimodal | 0.64 | 0.06 | 0.66 | 2.69 | 1.94e-14 | ||
| (heteroscedastic) | 0.78 | 0.04 | 0.15 | ||||
| 0.93 | 0.07 | 0.18 | |||||
| 143 | Unimodal | 0.76 | 0.13 | 1 | |||
| Bimodal | 0.68 | 0.09 | 0.64 | 2.37 | 2.18e-02 | ||
| (homoscedastic) | 0.89 | 0.09 | 0.36 | ||||
| Bimodal | 0.68 | 0.08 | 0.59 | 2.28 | 1.01e-01 | ||
| (heteroscedastic) | 0.87 | 0.09 | 0.41 | ||||
| Trimodal | 0.67 | 0.08 | 0.58 | 2.34 | 3.21e-01 | ||
| (heteroscedastic) | 0.85 | 0.07 | 0.35 | ||||
| 1.00 | 0.04 | 0.07 | |||||
| 125 | Unimodal | 0.72 | 0.12 | 1 | |||
| Bimodal | 0.66 | 0.07 | 0.73 | 3.13 | 1.25e-05 | ||
| (homoscedastic) | 0.89 | 0.07 | 0.27 | ||||
| Bimodal | 0.66 | 0.07 | 0.68 | 2.95 | 8.20e-05 | ||
| (heteroscedastic) | 0.88 | 0.07 | 0.32 | ||||
| Trimodal | 0.63 | 0.06 | 0.58 | 2.79 | 1.62e-04 | ||
| (heteroscedastic) | 0.79 | 0.05 | 0.27 | ||||
| 0.94 | 0.04 | 0.15 | |||||
| 78 | Unimodal | 0.69 | 0.12 | 1 | |||
| Bimodal | 0.64 | 0.07 | 0.78 | 3.43 | 6.21e-04 | ||
| (homoscedastic) | 0.87 | 0.07 | 0.22 | ||||
| Bimodal | 0.65 | 0.08 | 0.83 | 3.93 | 2.37e-03 | ||
| (heteroscedastic) | 0.90 | 0.04 | 0.17 | ||||
| Trimodal | 0.60 | 0.05 | 0.48 | 2.57 | 4.25e-03 | ||
| (heteroscedastic) | 0.75 | 0.06 | 0.40 | ||||
| 0.92 | 0.03 | 0.12 |
Note. — a The background-subtracted number of GCs.
In addition, we tried to decompose the color distribution of the GCs into three components with different variances to check the presence of intermediate-color GCs in M85. The value indicates the probability for the unimodal distribution, and the value is the peak separation relative to the Gaussian widths. If the value is smaller than 0.0001 and the value is greater than 2, it means that the input distribution is not unimodal and has a clear peak separation.
According to the derived and values for our three GMM results, we conclude that the color distribution of the M85 GCs is not unimodal. The fitting results of two bimodal cases are consistent within uncertainties. Therefore, we adopted the GMM results with the homoscedastic assumption for the bimodal case in the following analysis. The mean colors of the two subpopulations are = 0.66 and 0.90, and the Gaussian widths are 0.08. For the trimodal case, the mean colors of the three subpopulations are = 0.64, 0.78, and 0.93. According to GMM results, the intermediate-color GCs constitute 15% of the entire GCs, but the uncertainties are too large to confirm the presence of such a subpopulation.
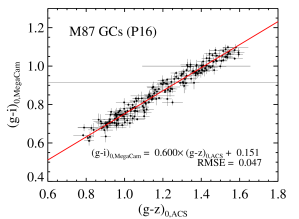
We compared the mean colors of GC subpopulations in M85 with those in other Virgo early-type galaxies. Peng et al. (2006a) presented the relation between the mean colors of GC subpopulations and the absolute -band magnitude of their host galaxy based on ACSVCS data. According to this relation, the mean colors of the BGCs and RGCs in the galaxies with the luminosity of M85 (; Binggeli et al. 1985) are derived to be 0.942 0.109 and 1.386 0.027.
To transform this color in the ACS magnitude system to color in the MegaCam magnitude system, we used the photometric data of the GCs in M87 presented by Powalka et al. (2016). They selected a robust sample of GCs in the core region of the Virgo Cluster based on photometric data from NGVS and its near-infrared counterpart NGVS-IR (Muñoz et al., 2014). Their photometry was tied to the CFHT/MegaCam AB magnitude system. There are 215 GCs common to the GC catalogs of Powalka et al. (2016) and the ACSVCS (Jordán et al., 2009). Figure 9 displays the color relation between and for those GCs in M87, and they show a tight correlation between the two colors. We derived a transformation relation between and ,
The rms scatter in this relation is 0.047 mag. According to this relation, the mean colors, converted from colors, of BGCs and RGCs in the other Virgo galaxies that are as luminous as M85 were derived to be = 0.716 and 0.983 0.039, respectively. The mean color of the RGCs in M85 () is bluer than those for the other Virgo early-type galaxies with a 2 or larger difference, while the mean color of the BGCs in M85 () is consistent within uncertainties. We discuss this result in Section 4.3.
3.5 Radial Variation of GC Colors
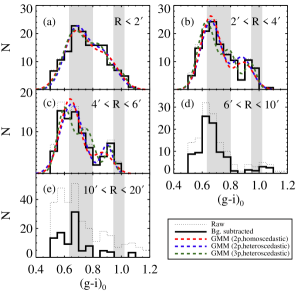
Figure 10 shows the color distributions of the GC candidates in different radial bins, , , , , and . We removed the background contamination from each color histogram. The background-subtracted color distribution of the GC candidates at does not show two clear peaks, while those of the GC candidates at and show two clear peaks. The GC candidates with are mostly blue with . We performed the GMM tests for the GC candidates at , and with the same procedure as described in Section 3.4. The GMM results for the color distribution of the GC candidates in these radial bins are summarized in Table 4.
We examined the possibility of a multimodal color distribution of GC candidates within in each radial bin. The GC candidates at do not clearly show a color multimodality ( for the bimodal homoscedastic case, 0.10 for the bimodal heteroscedastic case, 0.32 for the trimodal case). On the other hand, the GC candidates at and show clearly a multimodal color distribution ( and ). It is difficult to tell whether the color distribution of the GC candidates at is bimodal or trimodal. However, the GC candidates at have a bimodal color distribution because the uncertainty of the number fraction of intermediate-color GCs for the trimodal case is too large to confirm their presence. From these results, we conclude that the intermediate-color GCs exist within (=21 kpc).
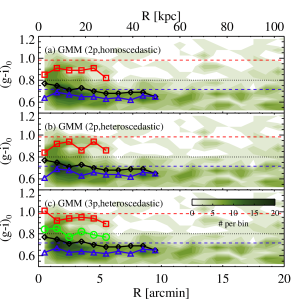
We investigated the radial gradients of the mean colors of the BGC and RGC candidates in M85 (see Figure 11). Most GC candidates have colors bluer than 1.0. We found two distinct sequences at = 0.65 and 0.95, corresponding to the BGC and RGC populations. The BGC candidates are distributed over a wide area, but the RGC candidates are mostly located in the inner region at .
We decomposed the color distribution of the GC candidates in each radial bin with a 1 interval into two or three components using GMM tests as described in Section 3.4. The radial color variations of the GC candidates are shown in Figure 11. The mean color of all GC candidates at the center of M85 is and becomes 0.12 mag bluer in the outer region at . From all GMM results, we did not find any significant color gradients for both BGC and RGC candidates.
3.6 Spatial Distribution of the GC Candidates
First, we investigated radial distributions of all GC, BGC, and RGC candidates and compared them with the stellar light of M85. To investigate any difference in the properties of the GCs depending on their colors, we divided the GC candidates into blue and red, with a color criterion , which is the same as the one adopted in the NGVS (Durrell et al., 2014).
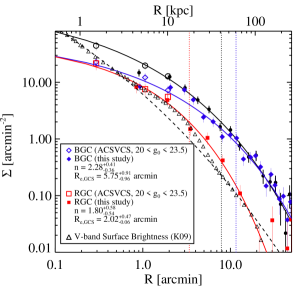
We fitted the radial number density profiles of the BGC and RGC candidates in M85 with the same procedure as described in Section 3.2. We subtracted the derived background level from the profiles and display the resulting profiles in Figure 12. The Sérsic indices for the BGC and RGC systems were derived as and , respectively. The slope of the radial number density profile of the RGCs in the outer region of M85 is much steeper than that of the BGCs. The effective radii for the BGC and RGC systems were measured as arcmin (30 kpc) and arcmin (11 kpc), respectively. Thus, the RGCs are more concentrated around the central region of M85 than the BGCs, which is commonly seen in the GC systems of early-type galaxies (Kissler-Patig et al., 1997; Lee et al., 1998; Strader et al., 2011; Forbes et al., 2012). The Sérsic fit parameters for each GC system are summarized in Table 3.
In addition, we compared the -band surface brightness profile of M85 derived in Kormendy et al. (2009) with the radial number density profiles of the GCs. Kormendy et al. (2009) presented the values of the Sérsic index and the effective radius for M85 derived from surface photometry: , arcsec from the major-axis fit, and arcsec from 2D profile integration. Noting the unusual features (e.g., an excess at ) seen in the surface brightness profile of M85 (see their Figure 14), Kormendy et al. (2009) concluded that “the galaxy is an elliptical – a recent (damp?) merger remnant that has not fully settled into equilibrium.” The -band surface brightness profile of the inner region () of M85 is steeper than the radial number density profile of the GCs, while the surface brightness profile of the outer region to is more correlated with the radial number density profile of the RGCs rather than that of the BGCs. This supports that the RGCs were formed with the stars in the main body of M85, but the BGCs were brought by dissipationless mergers.
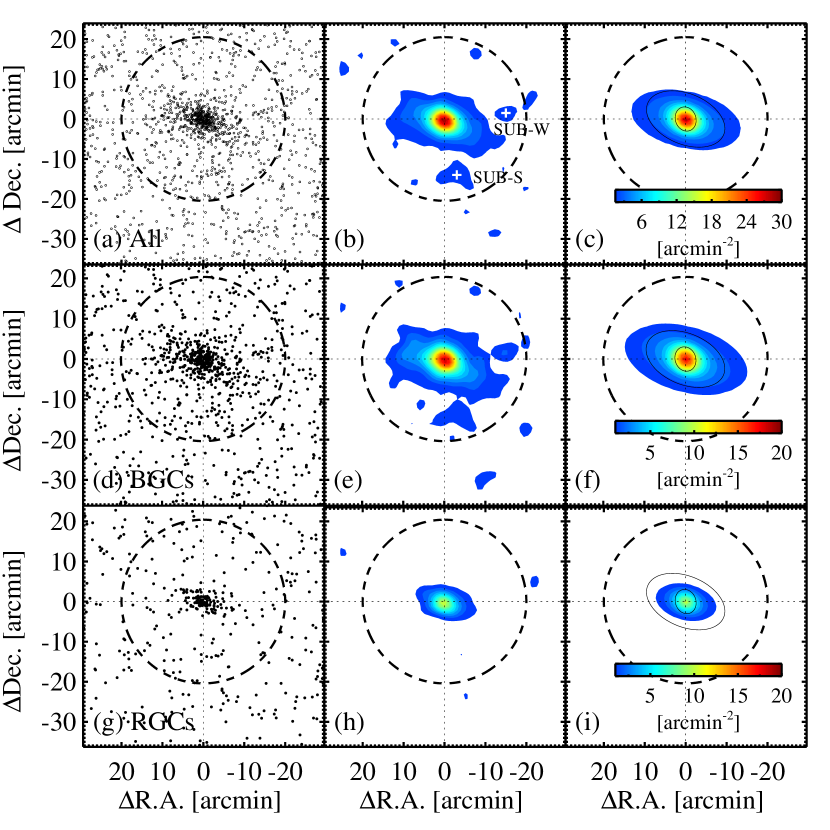
Next, we investigated two-dimensional spatial distributions of all GC, BGC, and RGC candidates as shown in Figure 13(a), (d), and (g). The GC candidates are concentrated around the center of M85. Figure 13(b), (e), and (h) show the smoothed surface number density maps of the all GC, BGC, and RGC candidates. The spatial distribution of the GC candidates is elongated roughly along the E and W directions. The BGC system in M85 is extended out to , while the RGC system is confined to a much smaller region at . We fitted the smoothed surface density maps using the IRAF/ELLIPSE task. Fixing the center position, we derived ellipticities and position angles of the isodensity contours. The fitted models are shown in Figure 13(c), (f), and (i). The spatial distribution of the GC system in the outer region, , is comparable to that of the galaxy light of M85 (Kormendy et al., 2009).
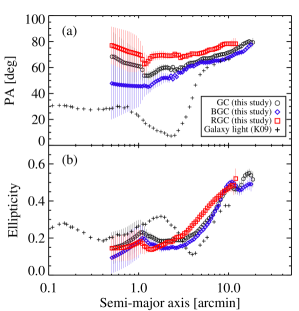
Figure 14 shows the radial changes of the position angles and ellipticities of the isodensity contours of the GC systems of M85. Note that few GCs are identified in the central region at in the CFHT/MegaCam images (see Figure 5), so we fitted the data for . We also plot the position angles and ellipticities of the galaxy light. The position angles of the galaxy light isophotes dramatically increase from 5∘ to 65∘ in the semi-major axis range of 2–10, while those of the GC isodensity contours vary much more slowly from 60∘ to 80∘. The ellipticities of the GC isodensity contours vary from 0.2 to 0.55 in the semi-major axis range of 1–20. In the same region, the ellipticities of the galaxy light isophotes show some fluctuation between 0.1 and 0.4. The position angles and ellipticities of the GC isodensity contours and the galaxy light isophotes change in a similar way at . The isodensity contours of the BGCs and RGCs show similar features to those of all GCs. This indicates that there are no significant differences in the shape between the two GC subsystems except for their radial extent.

3.7 Substructures of the GC System
In Figure 13(b) and (e), we found two substructures at the southern and western regions from M85, called SUB-S and SUB-W, shown at (R.A.,decl.) = (–3, –14) and (–15, 15) and corresponding to (, ) = (186297882, 17958153) and (186087265, 18216486). We checked the images to detect any diffuse light at the position of SUB-S and SUB-W, and we found little. In addition, these substructures are not related to any other galaxies in the survey region. The GC candidates in these two substructures are mostly blue, as clearly shown in Figure 13(e). Figure 15 displays the radial number density profiles of the GC candidates from the center position of each substructure. They show a significant central concentration, so that the GC candidates at the position of the substructures are mostly the members of each substructure. The surface number densities of the M85 GCs at the SUB-S and SUB-W positions ( [74.5 kpc] and [78.7 kpc]) are 0.32 and 0.30 arcmin-2, respectively, based on the Sérsic law fit result (see Figure 5). We estimated the radial extent of both SUB-S and SUB-W to be (13 kpc), where the surface number density of the GC candidates in each substructure reaches that of the M85 GCs within 1. The number density excess at the outer part of each substructure (at for SUB-S and for SUB-W) is caused by the GCs that belong to M85. The numbers of the GCs found in SUB-S and SUB-W are 16 and 13, respectively.
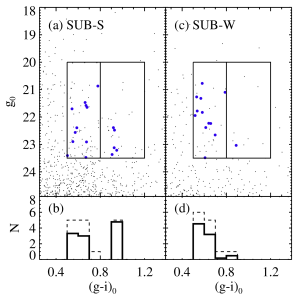
Figure 16(a) and (c) show the CMDs of the GC candidates and the sources with at a distance from the center of each of SUB-S and SUB-W. The SUB-S and SUB-W are 143 and 151 away from M85, respectively. We chose control regions at these radial ranges and subtracted the contribution of the M85 GCs in the control regions from the GC candidates in SUB-S and SUB-W. Figure 16(b) and (d) show the background-subtracted color distribution of the GCs in SUB-S and SUB-W. The total numbers of the GCs in the SUB-S and SUB-W are 11 and 9, respectively, after background subtraction.
Assuming that the substructures and M85 are located at the same distance, and that the width of their GC luminosity function is about 1, we derived the total numbers of GCs in SUB-S and SUB-W, (GC) 209 and 171, respectively. If we use the relation between the total number of GCs and their host galaxy dynamical mass in Harris et al. (2013), we obtain the progenitor masses for the substructures of , indicating that they are candidates of dwarf galaxies.
4 Discussion
4.1 Elongated Spatial Distribution of the GC System
According to the GC formation scenario suggested by Côté et al. (1998) and Lee et al. (2010a), the BGCs in massive early-type galaxies, especially in the outer region, mainly come from dwarf galaxies, and the RGCs formed along with the bulk of stars during dissipative mergers at the early epoch. In this scenario, the BGCs show more extended spatial distributions than the RGCs (Kissler-Patig et al., 1997; Lee et al., 1998; Strader et al., 2011; Forbes et al., 2012), and the spatial distribution of the RGCs shows a stronger correlation with that of the stellar light than that of the BGCs (Park & Lee, 2013; Wang et al., 2013).
In the case of M85, the radial distribution of the BGCs is more extended than that of the RGCs (see Figure 12), but the BGCs in the outer region show a significant correlation with the stellar light, comparable to the RGCs (see Figure 14). Both the spatial distributions of the stellar light and the GC systems are elongated in the outermost region of M85. Based on these results, we infer that the BGCs in M85 originated from dissipationless mergers, but after accretion the BGCs, RGCs, and stars in M85 underwent the same evolutionary process, resulting in the similar two-dimensional spatial distributions.
Ko et al. (2018) found that the M85 GC system at strongly rotates with a rotation axis angle of 161∘. This value is similar to the position angle of the photometric minor axis at (170∘). This agreement implies that the GC system at may also have a strong rotation. This will be investigated with kinematic data of GCs at (Ko, Y. et al. 2019, in preparation). We suspect that an off-center major merging event might have occurred recently after the BGCs were accreted from low-mass galaxies.
4.2 Low RGC Fraction in the Central Region of M85
The number fraction of the RGCs is expected to be related to the host galaxy mass according to current GC formation models (Ashman & Zepf, 1992; Zepf & Ashman, 1993; Forbes et al., 1997; Côté et al., 1998; Lee et al., 2010a). The BGCs were formed in progenitor spirals or low-mass dwarf galaxies at an early epoch and were accreted into massive galaxies via dissipationless mergers afterward, while the RGCs were formed in massive progenitors. Consequently, the majority of the BGCs in massive early-type galaxies inhabit the outskirts of the massive early-type galaxies, while the RGCs are mostly located in the central region. Massive early-type galaxies have undergone a number of wet mergers, resulting in the excess of the RGCs in the central region compared to the BGCs. Therefore, the number fraction of the RGCs in the central region is expected to increase as a function of their host galaxy mass.
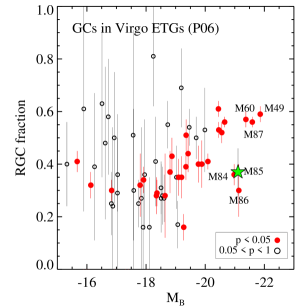
Peng et al. (2006a) investigated the color distribution of the GCs in 100 Virgo early-type galaxies using ACSVCS data, and they presented a relation between the RGC fraction and host galaxy luminosity, as shown in Figure 17. In the figure, we marked the galaxies that show a clear bimodality in GC color () by red symbols. The number fraction of the RGCs in the ACS field of these galaxies increases, in general, as a function of host galaxy luminosity. However, there are three outliers at the high-luminosity end (): M84, M85, and M86. These three galaxies have much lower RGC fractions, compared with the other Virgo early-type galaxies of similar luminosity (like M60). Peng et al. (2006a) estimated the number fraction of M85 RGCs in the ACS field to be 37%, although the color distribution of M85 GCs does not show a clear bimodality. This value is similar to the number fraction of the RGCs at derived in this study, which is 36-41% based on the bimodal GMM tests (see Table 4). This indicates that there are fewer RGCs or more BGCs in the central region of M85, compared to other Virgo early-type galaxies of similar luminosity. This implies that the primary progenitors of M85, as well as M84 and M86, have been less massive or have been involved with fewer wet mergers than other massive galaxies of similar luminosity.
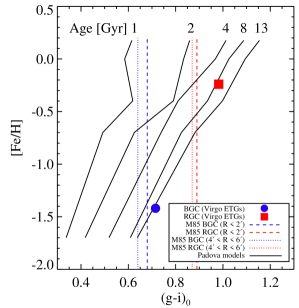
Likewise, we investigated the ages and metallicities of the “blue” RGCs in M85 based on the color and [Fe/H] relation. In Figure 18 we plot, with the solid lines, the relation between [Fe/H] and color given by the Padova simple stellar population models for ages of 1, 2, 4, 8, and 13 Gyr (Marigo et al., 2008; Girardi et al., 2010). Peng et al. (2006a) presented the relation between the mean [Fe/H] values of the GC subpopulations and host galaxy luminosity based on the ACSVCS sample that covered the central regions of galaxies. According to this relation, the mean metallicities of the BGCs and RGCs in the other early-type galaxies that are as luminous as M85 are expected to be [Fe/H] = –1.42 and –0.24, respectively. The colors of the BGCs and RGCs expected from the -band luminosity of M85 are = 0.716 and 0.983, as mentioned in Section 3.4. These are marked by a circle and a square in the figure.
The mean colors of the BGCs and RGCs are = 0.68 and 0.89, respectively, for the central region at , and = 0.64 and 0.87, respectively, for the outer region at , as marked by dashed and dotted lines in the figure. Therefore, the RGCs in the central region of M85 are 0.1 mag bluer than those for the GCs in the central region of other Virgo early-type galaxies, while the BGCs in the same region show a much smaller difference. A comparison with simple stellar population models indicates that the RGC population in M85 might include intermediate-age GCs with ages of 2-4 Gyr and higher metallicities than old GCs, or an old population with [Fe/H], which is much lower than the metallicities of the RGCs in the other Virgo early-type galaxies with similar luminosity. The presence of 4 Gyr old GC populations in the central region of M85 found in the spectroscopic study (Ko et al., 2018) supports the first possibility.
5 Summary
We presented the results from a wide-field photometric survey of GCs in M85 using CFHT/MegaCam. We identified 1318 GC candidates with 20.0 mag 23.5 mag in the survey region using concentration index, color, and magnitude criteria. About 60% of these are located inside from the galaxy center, and they are mostly GCs in M85. The main photometric properties of the GCs are summarized as follows:
-
•
The spatial distribution of the GCs shows a strong concentration in the M85 center. The radial number density profile of these GCs is well fit by a Sérsic profile with . The effective radius of the GC system is derived to be 4.14 arcmin, corresponding to 22 kpc.
-
•
The color distribution of the GCs is not unimodal. According to the GMM test for bimodality, the peaks of the color distribution are found at = 0.66 and 0.90. If we apply the same test for trimodality, we obtain = 0.64, 0.78, and 0.93. However, the number fraction of the intermediate color component in this case is estimated to be very low with a value of %. Therefore, we conclude that the color distribution of the M85 GCs is bimodal. The intermediate-color GC candidates might exist only in the central region at based on the GMM results.
-
•
The BGC system is more extended than the RGC system. The effective radii of the BGC and RGC systems are 5.75 and 2.02 arcmin, respectively.
-
•
The spatial distribution of the M85 GC system shows significant elongation, which is similar to that of galaxy stellar light in the outer region (). Interestingly, both BGC and RGC systems show a spatial correlation with galaxy stellar light. We suspect that an off-center major merger that occurred recently resulted in this elongated spatial distribution of the GC system and stars, as well as their rotation around the minor axis of M85 (Ko et al., 2018).
-
•
We found two substructures of the GCs around M85, SUB-S and SUB-W, of which radial extents are about 13 kpc. We estimated the total number of GCs in SUB-S and SUB-W to be 209 and 171, respectively. These numbers indicate that their progenitors have a dynamical mass of .
-
•
The number fraction of the RGCs ( 36-41%) in the central region of M85 is much smaller than that in the other Virgo early-type galaxies that have luminosities similar to that of M85 ( 60%). This implies that the progenitor of M85 is less massive than that of massive early-type galaxies with similar luminosity.
-
•
The mean color of the RGCs in M85 is found to be 0.1 mag bluer than those for other Virgo early-type galaxies with similar luminosity, while the mean color of the BGCs shows a small difference. This indicates that the RGCs might be a 2–4 Gyr old population, which is confirmed spectroscopically (Ko et al., 2018).
The properties of the M85 GC system indicate that the formation process of M85 is different from typical massive early-type galaxies. Further simulation studies on the formation of M85 are needed to explain the unique GC system of M85.
References
- Abazajian et al. (2009) Abazajian, K. N., Adelman-McCarthy, J. K., Agüeros, M. A., et al. 2009, ApJS, 182, 543-558
- Alam et al. (2015) Alam, S., Albareti, F. D., Allende Prieto, C., et al. 2015, ApJS, 219, 12
- Amorisco et al. (2018) Amorisco, N. C., Monachesi, A., Agnello, A., & White, S. D. M. 2018, MNRAS, 475, 4235
- Ashman & Zepf (1992) Ashman, K. M., & Zepf, S. E. 1992, ApJ, 384, 50
- Bassino & Caso (2017) Bassino, L. P., & Caso, J. P. 2017, MNRAS, 466, 4259
- Bertin & Arnouts (1996) Bertin, E., & Arnouts, S. 1996, A&AS, 117, 393
- Bertin et al. (2002) Bertin, E., Mellier, Y., Radovich, M., et al. 2002, adass XI, 281, 228
- Bertin (2006) Bertin, E. 2006, adass XV, 351, 112
- Binggeli et al. (1985) Binggeli, B., Sandage, A., & Tammann, G. A. 1985, AJ, 90, 1681
- Blom et al. (2012) Blom, C., Spitler, L. R., & Forbes, D. A. 2012, MNRAS, 420, 37
- Boulade et al. (2003) Boulade, O., Charlot, X., Abbon, P., et al. 2003, Proc. SPIE, 4841, 72
- Brodie et al. (2005) Brodie, J. P., Strader, J., Denicoló, G., et al. 2005, AJ, 129, 2643
- Brodie & Strader (2006) Brodie, J. P., & Strader, J. 2006, ARA&A, 44, 193
- Brodie et al. (2012) Brodie, J. P., Usher, C., Conroy, C., et al. 2012, ApJ, 759, L33
- Burstein (1979) Burstein, D. 1979, ApJS, 41, 435
- Cantiello et al. (2018) Cantiello, M., D’Abrusco, R., Spavone, M., et al. 2018, A&A, 611, A93
- Caso et al. (2013) Caso, J. P., Richtler, T., Bassino, L. P., et al. 2013, A&A, 555, A56
- Caso et al. (2015) Caso, J. P., Bassino, L. P., & Gómez, M. 2015, MNRAS, 453, 4421
- Chies-Santos et al. (2011) Chies-Santos, A. L., Larsen, S. S., Kuntschner, H., et al. 2011, A&A, 525, A20
- Chies-Santos et al. (2012) Chies-Santos, A. L., Larsen, S. S., Kissler-Patig, M., et al. 2012, MNRAS, 427, 2349
- Cho et al. (2012) Cho, J., Sharples, R. M., Blakeslee, J. P., et al. 2012, MNRAS, 422, 3591
- Côté et al. (1998) Côté, P., Marzke, R. O., & West, M. J. 1998, ApJ, 501, 554
- Côté et al. (2004) Côté, P., Blakeslee, J. P., Ferrarese, L., et al. 2004, ApJS, 153, 223
- de Vaucouleurs et al. (1991) de Vaucouleurs, G., de Vaucouleurs, A., Corwin, H. G., Jr., et al. 1991, Third Reference Catalogue of Bright Galaxies, Vol. I: Explanations and References, Vol. II: Data for galaxies Between 0h and 12h, Vol. III: Data for galaxies Between 12h and 24h. (New York, USA: Springer)
- Dotter et al. (2010) Dotter, A., Sarajedini, A., Anderson, J., et al. 2010, ApJ, 708, 698
- Dotter et al. (2011) Dotter, A., Sarajedini, A., & Anderson, J. 2011, ApJ, 738, 74
- Durrell et al. (2014) Durrell, P. R., Côté, P., Peng, E. W., et al. 2014, ApJ, 794, 103
- Ferrarese et al. (2006) Ferrarese, L., Côté, P., Jordán, A., et al. 2006, ApJS, 164, 334
- Ferrarese et al. (2012) Ferrarese, L., Côté, P., Cuillandre, J.-C., et al. 2012, ApJS, 200, 4
- Forbes et al. (1997) Forbes, D. A., Brodie, J. P., & Grillmair, C. J. 1997, AJ, 113, 1652
- Forbes et al. (2012) Forbes, D. A., Ponman, T., & O’Sullivan, E. 2012, MNRAS, 425, 66
- Forbes et al. (2016) Forbes, D. A., Alabi, A., Romanowsky, A. J., et al. 2016, MNRAS, 458, L44
- Forbes (2017) Forbes, D. A. 2017, MNRAS, 472, L104
- Forbes & Remus (2018) Forbes, D. A., & Remus, R.-S. 2018, MNRAS, 479, 4760
- Forte et al. (2009) Forte, J. C., Vega, E. I., & Faifer, F. 2009, MNRAS, 397, 1003
- Georgiev et al. (2010) Georgiev, I. Y., Puzia, T. H., Goudfrooij, P., & Hilker, M. 2010, MNRAS, 406, 1967
- Girardi et al. (2010) Girardi, L., Williams, B. F., Gilbert, K. M., et al. 2010, ApJ, 724, 1030
- Graham & Driver (2005) Graham, A. W., & Driver, S. P. 2005, PASA, 22, 118
- Harris (2009) Harris, W. E. 2009, ApJ, 699, 254
- Harris et al. (2013) Harris, W. E., Harris, G. L. H., & Alessi, M. 2013, ApJ, 772, 82
- Harris et al. (2015) Harris, W. E., Harris, G. L., & Hudson, M. J. 2015, ApJ, 806, 36
- Harris et al. (2017) Harris, W. E., Blakeslee, J. P., & Harris, G. L. H. 2017, ApJ, 836, 67
- Hempel et al. (2007) Hempel, M., Kissler-Patig, M., Puzia, T. H., & Hilker, M. 2007, A&A, 463, 493
- Jordán et al. (2007) Jordán, A., McLaughlin, D. E., Côté, P., et al. 2007, ApJS, 171, 101
- Jordán et al. (2009) Jordán, A., Peng, E. W., Blakeslee, J. P., et al. 2009, ApJS, 180, 54
- Kissler-Patig et al. (1997) Kissler-Patig, M., Richtler, T., Storm, J., & della Valle, M. 1997, A&A, 327, 503
- Ko et al. (2018) Ko, Y., Lee, M. G., Park, H. S., et al. 2018, ApJ, 859, 108
- Kormendy et al. (2009) Kormendy, J., Fisher, D. B., Cornell, M. E., & Bender, R. 2009, ApJS, 182, 216
- Kundu & Whitmore (2001) Kundu, A., & Whitmore, B. C. 2001, AJ, 121, 2950
- Larsen et al. (2001) Larsen, S. S., Brodie, J. P., Huchra, J. P., Forbes, D. A., & Grillmair, C. J. 2001, AJ, 121, 2974
- Larsen et al. (2003) Larsen, S. S., Brodie, J. P., Beasley, M. A., et al. 2003, ApJ, 585, 767
- Lee et al. (1998) Lee, M. G., Kim, E., & Geisler, D. 1998, AJ, 115, 947
- Lee et al. (2010a) Lee, M. G., Park, H. S., Hwang, H. S., et al. 2010, ApJ, 709, 1083
- Lim et al. (2017) Lim, S., Peng, E. W., Duc, P.-A., et al. 2017, ApJ, 835, 123
- Lim et al. (2018) Lim, S., Peng, E. W., Côté, P., et al. 2018, ApJ, 862, 82
- Liu et al. (2011) Liu, C., Peng, E. W., Jordán, A., et al. 2011, ApJ, 728, 116
- Magnier & Cuillandre (2004) Magnier, E. A., & Cuillandre, J.-C. 2004, PASP, 116, 449
- Marigo et al. (2008) Marigo, P., Girardi, L., Bressan, A., et al. 2008, A&A, 482, 883
- Marín-Franch et al. (2009) Marín-Franch, A., Aparicio, A., Piotto, G., et al. 2009, ApJ, 694, 1498
- McDermid et al. (2004) McDermid, R., Emsellem, E., Cappellari, M., et al. 2004, Astronomische Nachrichten, 325, 100
- Mei et al. (2007) Mei, S., Blakeslee, J. P., Côté, P., et al. 2007, ApJ, 655, 144
- Muñoz et al. (2014) Muñoz, R. P., Puzia, T. H., Lançon, A., et al. 2014, ApJS, 210, 4
- Muratov & Gnedin (2010) Muratov, A. L., & Gnedin, O. Y. 2010, ApJ, 718, 1266
- Ordenes-Briceño et al. (2018) Ordenes-Briceño, Y., Puzia, T. H., Eigenthaler, P., et al. 2018, ApJ, 860, 4
- Park et al. (2012) Park, H. S., Lee, M. G., Hwang, H. S., et al. 2012, ApJ, 759, 116
- Park & Lee (2013) Park, H. S., & Lee, M. G. 2013, ApJ, 773, 27
- Pastorello et al. (2015) Pastorello, N., Forbes, D. A., Usher, C., et al. 2015, MNRAS, 451, 2625
- Peng et al. (2006a) Peng, E. W., Jordán, A., Côté, P., et al. 2006, ApJ, 639, 95
- Peng et al. (2006b) Peng, E. W., Côté, P., Jordán, A., et al. 2006, ApJ, 639, 838
- Peng et al. (2008) Peng, E. W., Jordán, A., Côté, P., et al. 2008, ApJ, 681, 197
- Pota et al. (2013) Pota, V., Forbes, D. A., Romanowsky, A. J., et al. 2013, MNRAS, 428, 389
- Powalka et al. (2016) Powalka, M., Lançon, A., Puzia, T. H., et al. 2016, ApJS, 227, 12
- Puzia et al. (2002) Puzia, T. H., Zepf, S. E., Kissler-Patig, M., et al. 2002, A&A, 391, 453
- Richtler et al. (2012) Richtler, T., Bassino, L. P., Dirsch, B., & Kumar, B. 2012, A&A, 543, A131
- Schlafly & Finkbeiner (2011) Schlafly, E. F., & Finkbeiner, D. P. 2011, ApJ, 737, 103
- Schweizer & Seitzer (1988) Schweizer, F., & Seitzer, P. 1988, ApJ, 328, 88
- Sérsic (1963) Sérsic, J. L. 1963, Boletin de la Asociacion Argentina de Astronomia La Plata Argentina, 6, 41
- Sesto et al. (2016) Sesto, L. A., Faifer, F. R., & Forte, J. C. 2016, MNRAS, 461, 4260
- Sesto et al. (2018) Sesto, L. A., Faifer, F. R., Smith Castelli, A. V., Forte, J. C., & Escudero, C. G. 2018, MNRAS, 479, 478
- Strader et al. (2003) Strader, J., Brodie, J. P., Schweizer, F., Larsen, S. S., & Seitzer, P. 2003, AJ, 125, 626
- Strader et al. (2004) Strader, J., Brodie, J. P., & Forbes, D. A. 2004, AJ, 127, 295
- Strader et al. (2011) Strader, J., Romanowsky, A. J., Brodie, J. P., et al. 2011, ApJS, 197, 33
- Trancho et al. (2014) Trancho, G., Miller, B. W., Schweizer, F., Burdett, D. P., & Palamara, D. 2014, ApJ, 790, 122
- VandenBerg et al. (2013) VandenBerg, D. A., Brogaard, K., Leaman, R., & Casagrande, L. 2013, ApJ, 775, 134
- van Dokkum et al. (2017) van Dokkum, P., Abraham, R., Romanowsky, A. J., et al. 2017, ApJ, 844, L11
- Villegas et al. (2010) Villegas, D., Jordán, A., Peng, E. W., et al. 2010, ApJ, 717, 603
- Wang et al. (2013) Wang, Q., Peng, E. W., Blakeslee, J. P., et al. 2013, ApJ, 769, 145
- Zaritsky et al. (2015) Zaritsky, D., Aravena, M., Athanassoula, E., et al. 2015, ApJ, 799, 159
- Zepf & Ashman (1993) Zepf, S. E., & Ashman, K. M. 1993, MNRAS, 264, 611