[table]capposition=top
NOvA muon energy scale systematic
Abstract
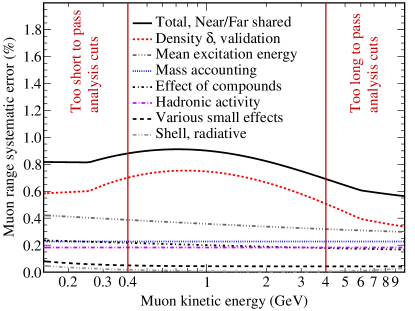
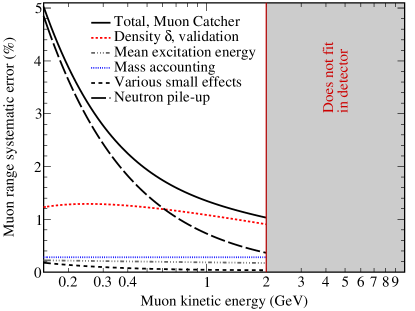
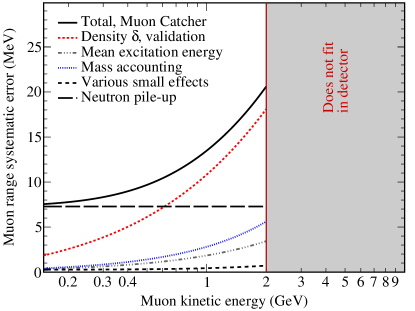
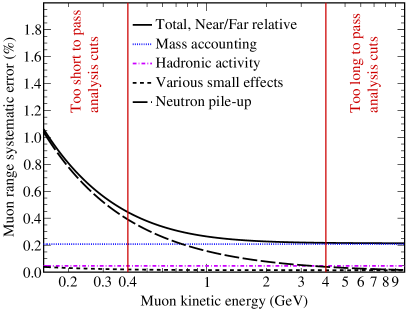
The systematic uncertainty on the correspondence between muon range and energy is developed for the NOvA neutrino experiment. NOvA consists of two detectors, the Near Detector at Fermilab and the Far Detector in northern Minnesota. Total errors are developed for the Near Detector, with its Muon Catcher treated separately, the Far Detector, and all combinations of correlated and uncorrelated errors between these three detectors. The absolute errors for the Near Detector (1.0%), the Far Detector (0.9%), and the fully correlated error shared by them (0.9%) are strongly dominated by Geant4’s treatment of the Bethe density effect. At the Near Detector, the next biggest uncertainty is from stray hits caused by neutron capture pile-up. Other contributions are marginally significant, with the biggest, in descending order, being due to external measurements of the mean excitation energies of elements, detector mass accounting, and modification of energy loss by chemical binding. For the Muon Catcher, the absolute error is expressed as an offset instead of a percentage: 21 MeV. The density effect (at higher energies) and neutron capture pile-up (at lower energies) are the strongly dominant errors. The relative error between the Near and Far Detectors is 0.4% and is strongly dominated by neutron capture pile-up at the Near Detector, with a subdominant contribution from detector mass accounting.
1 Introduction
In NOvA analyses previous to this evaluation, the muon range uncertainties were leading systematics for the determination of the neutrino mixing parameters and . Often in physics analysis, large values of systematic errors are chosen to be sure of covering true parameter values. However, when an error has a significant impact on an analysis, it is appropriate to perform a careful study to reduce it. Throughout this note, an effort is made to enumerate and characterize the underlying uncertainties sufficiently that no additional “uncertainty on the uncertainty” is needed to account for additional undiscovered effects. In this spirit, when the information available is partially contradictory, an honest evaluation of the true uncertainty is made rather than picking the largest available error. With this evaluation, the relative (Far/Near) muon energy scale has been reduced to a negligible error while the absolute scale in each detector is now subdominant to other leading uncertainties.
Two quantities of interest are the absolute errors on the muon energy for the Near Detector (ND) and Far Detector (FD) for analyses that use only one detector or the other. The NOvA disappearance analysis, which uses both detectors, directly uses the component of the error which is shared between the ND and FD, as well as the components that are uncorrelated. The ND has two sections, one of which is nearly identical to the FD. The second is the Muon Catcher, which has steel planes interspersed between planes of scintillator. All combinations of errors between the main ND, the Muon Catcher, and the FD are potentially useful.
Sections 2 and 3 work through the systematic error from knowledge of the detector mass and composition, respectively. Sections 4 and 5 explain what systematic errors are incurred from uncertainties in external measurements of stopping power. Section 6 deals with the uncertainty from the way the density effect is parameterized. Section 7 covers our handling of the Coulomb correction. Section 8 goes over hadronic response effects that can distort the track length, while Section 9 explores the effects of neutron pile-up in the Near Detector. Section 10 discusses some other possible concerns which turn out to be negligible in NOvA.
Note on significant figures
All errors that result from a combination of other numbers are always quoted to two digits — even though they may be resting on rough estimates — so that the reader can use them in computations of several steps without losing precision. For the purposes of carrying computations through this note, all digits are retained internally at every step. Nevertheless, the second digit of systematic errors should not generally be taken very seriously.
2 Mass accounting
The most basic uncertainty is on the amount of material a muon must traverse to get from one cell to the next in each detector. As the reconstruction code ultimately measures track length in terms of cell hits, an uncertainty in the material budget translates proportionally into an uncertainty on the reconstructed energy. The relevant detector components are scintillator, plastic, glue, and, for the ND Muon Catcher only, steel. The uncertainties on each are developed in this section and summarized in Table 4.
2.1 Scintillator
The composition and production of NOvA scintillator are described in Ref. [1].
| Error | Near/far cancellation? | |
| ASTM density | 0.17% | Mostly |
| Temperature | 0.1% | Somewhat |
| FD scint. volume | 0.3% | Partial |
| ND module volume | 0.16% | Mostly |
| ND air bubbles | 0.04% | Partial |
| ND “fiducial” blends | 0.09% | No |
| FD scintillator | 0.36% | — |
| ND scintillator | 0.27% | — |
| ND/FD scintillator | 0.27% | — |
2.1.1 Far Detector
In the Monte Carlo model, the scintillator represents the mass of not just the scintillator in the cells, but also the fibers that are looped through each scintillator cell, the plastic rings that hold the fibers in place at one end, and the unintentional air bubbles present in many cells. For the physical horizontal modules, there is also scintillator in the manifolds that guide the fibers from the cells to the APDs. This scintillator is not modeled and must be subtracted from the records made during detector construction.
Volume
Scintillator fill was metered by volume. Accounting for waste, the volume metered is 2 674 041 gallons. The horizontal fiber manifolds contain gallons each. The detectors are leak-free at a level of over the lifetime of the experiment [2].
The scintillator density was measured by the company that did the blending at F. Using tables that give the density of mineral oil as a function of temperature, this is corrected for the actual mean temperature of each detector. There were 25 separate scintillator batches, each with a density measurement. For each FD module, the batch or batches used to fill it were tracked, and using this the average density was determined to be 0.8529 g/cm3. Taking into account that the Monte Carlo scintillator includes the denser fibers, the modeled density is the slightly higher 0.8530 g/cm3. The ND filling was not tracked as closely, but only a few batches of scintillator were used. The effective density of ND scintillator is 0.8576 g/cm3.
The FD horizontal modules could not be filled completely because, as extruded plastic, they are not perfectly straight and in many instances air remained trapped at the top. From the filling data, the horizontal modules are estimated to be 98.75(30)% full of scintillator. Because of limitations of the NOvA software, the modules in the Monte Carlo are represented as being completely full of scintillator at the density given above. Corrections are then applied at the analysis level to account for the reduced mass.
The RMS of the metered volume for FD vertical modules, which can be reliably filled completely, is 0.78%. The majority of this variation is assumed to be real differences between modules and/or “statistical” error that tends to cancel out when adding together many modules. The fourteen flow meters used were calibrated by Great Plains Industries. Using the quoted errors and the spread of these errors, the error is estimated to be 0.3%. This is assumed to be the dominant source of error for scintillator volume in the horizontal modules.
For the fully-filled vertical modules, besides the flow meter data, volumetric and linear measurements of the plastic extrusions are available. The data therefore overconstrains the problem. These three sources of information agree at the level. The volumetric measurements are chosen because they have the smallest stated uncertainties, as well as because they give a result between the other two. The error estimated from the spread of several measurements is , which we increase to 0.3% given the slight tension between methods.
Density
The error from the manufacturer on the densities of each scintillator batch is not well defined, but from the distribution of the measurements, it is taken to be 0.17%. There is an additional error on the density, and so on the relevant mass in the detector, from temperature variations. Each ∘F decreases the density by 0.04%, whereas the density of PVC changes much less: 0.008% [3]. Given a few degrees uncertainty in the detector temperature, this incurs a systematic of 0.1%.
2.1.2 Near Detector
The shorter ND horizontal modules are probably completely filled, because shorter sections of extrusion are likely to be straight enough to avoid trapping air. The possibility that there is some air in them is accounted for by taking them to have a uniform probability of 0–20% as much as the FD per unit length. This is arbitrary, but as it has a negligible effect on the total error (see Table 1), it does not merit further study. The ND shares the FD’s systematic errors on the density, but has a different error on the volume which comes from the extrusion volume instead of the metering since only the FD scintillator was metered.
Three of the 25 blends of scintillator were used in the ND. While it is known how much of each blend is in the ND, it isn’t clear where in the detector each of the three are. Since event selection effects in the ND can be quite strong, these blends could have effective importance weights which are significantly different from their raw fractions. Assuming the worst case that only an unknown one of the three is in the effective fiducial volume gives an error of 0.18% (the RMS of the appropriate three-point distribution) on the effective scintillator mass. Half of this is taken as a reasonable figure for any realistic selection, since selected events include muons that traverse nearly all parts of the detector.
The uncertainties on scintillator mass are summarized in Table 1, which also gives the total errors on scintillator mass in each detector and the error on the ratio of scintillator masses.
2.2 PVC
| Error | Near/Far cancellation? | |
|---|---|---|
| Scales | 0.46% | Mostly |
| ND lots | 0.22% | No |
| ND apparent offset | 0.16% | No |
| FD | 0.46% | — |
| ND | 0.54% | — |
| ND/FD | 0.31% | — |
2.2.1 Far Detector
The PVC extrusions were weighed by the extruder, Extrutech, using a Dillon EDxtreme Digital Dynamometer. The masses are stored in the NOvA hardware database. An EDx-1T, which has a “standard resolution” (i.e. readout granularity) of 2 pounds was used initially, and then later an EDx-5T with a “standard resolution” of 5 pounds. Both of these models have an “full scale accuracy” of 0.1% and have NIST-traceable calibrations [4].
This must be translated into errors for the weights of NOvA extrusions. Since full scale is either 2200 pounds or 11 000 pounds, the “accuracies” are 0.43% and 2.1% at 515 pounds, where accuracy means that these scales are calibrated so that they are guaranteed to fall within the stated range. Assuming a uniform distribution within the range, the RMS values are 0.25% and 1.2%. As 8200 of 23 400 extrusions were weighed with the less accurate scale, the overall uncertainty is 0.46%, assuming the calibrations were uncorrelated. (If instead full correlation is assumed, 0.59%, but we see no reason to assume this.)
At one point along the extrusion process, Argonne independently weighed some extrusions and obtained an average 1 pound different than Extrutech (0.2%). This confirms that the above error is reasonable.
Because the readout steps are not too small compared to the variation in extrusion weights, it is possible that additional error could be incurred from rounding, even if the measurements were unbiased, especially if the distribution of masses weren’t Gaussian. However, it is quite Gaussian. A toy Monte Carlo confirmed that this effect is totally negligible.
Another conceivably relevant effect is the ambiguity between weight and mass. The scale is presumably calibrated against standard gravity, 9.806 65 m/s2. The gravity at Extrutech in Manitowoc, WI is 0.02% less than standard [5, 6], so the difference is negligible.
2.2.2 Near Detector
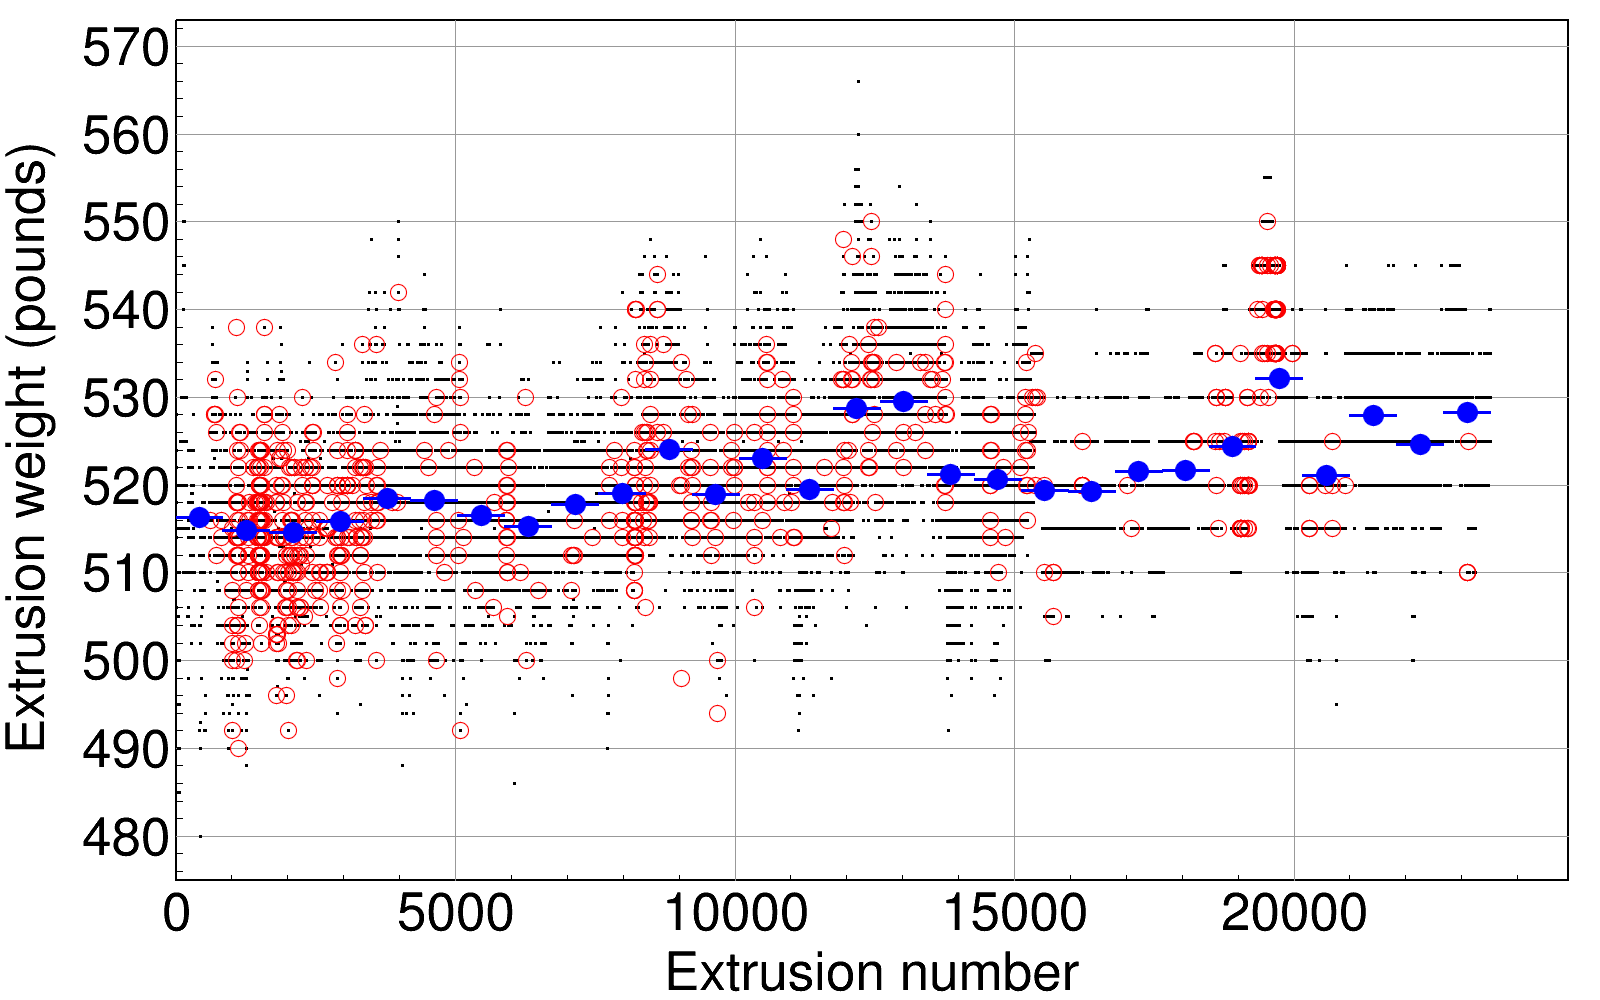
While NOvA’s hardware database stores exactly which extrusions were used in the FD, the much shorter ND extrusions were obtained by using scraps of FD-length extrusions. The database identifies which extrusions were marked as being usable for the ND, but not how many ND modules were made from each. If the ND extrusions were drawn uniformly from the eligible full-length extrusions, they would have a mass per unit length 0.21% lower than the mean FD extrusion (extrusion mass tended to increase over time, see Fig. 1), but it is not clear that this is the correct description.
Each full-length extrusion could have contributed between zero and three ND-length extrusions to the final detector. Suppose that this number tended to increase from around zero to around three over the course of production. This would raise the estimate of the PVC mass by 0.5%. Taking a uniform distribution between this trend and the reverse gives an RMS error of 0.30%.
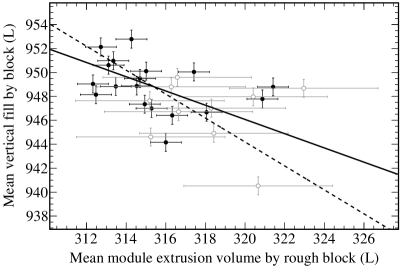
It is not clear why the extrusions increased in mass over the course of production, but if it is because the walls tended to be thicker, then there would be less internal volume for scintillator, partially cancelling the increase in stopping power from the additional plastic. Scintillator was not metered for the ND fill, but the FD filling data can provide some information. As shown in Fig. 2, there is probably an anti-correlation between extrusion mass and scintillator fill volume for FD vertical modules. There are strong correlations between the data points, so it is not completely clear if this is a real effect, but it is clear that there is no positive correlation, at least. Letting there be a 50% probability of no correlation and 50% probability that each additional liter of PVC means one fewer liter of scintillator, the effective error from not knowing exactly what set of extrusions were used is reduced to 0.22%. The effective offset in the case of uniformly drawing from all eligible extrusions is reduced to 0.16%. These are added in quadrature when finding the total error.
Uncertainties on PVC mass are summarized in Table 2. In the tables, all of this error is attributed to PVC, even though it has something to do with the scintillator as well.
| Material | (MeV/cm2/g) |
|---|---|
| Scintillator | 2.083 |
| Glue | 1.943 |
| Air | 1.809 |
| PVC | 1.767 |
| Steel | 1.452 |
| Component | Mass | Principle cause | |
|---|---|---|---|
| FD scintillator | 0.36% | Volume | |
| ND scintillator | 0.27% | Density, volume | |
| FD PVC | 0.46% | Weighing | |
| ND PVC | 0.54% | Weighing | |
| Glue (both) | 5% | Outgassing | |
| Steel | 0.33% | Volume | |
| FD | 0.28% | 0.28% | PVC |
| Main ND | 0.26% | 0.25% | PVC |
| Muon catcher | 0.29% | 0.28% | Steel |
| Main ND/FD | 0.21% | 0.21% | FD scintillator |
| From scintillator | 0.17% | ||
| From PVC | 0.11% | ||
| Muon catcher/FD | 0.38% | 0.37% | Steel |
| From steel | 0.29% | ||
| Muon catcher/main ND | 0.37% | 0.35% | Steel |
| From steel | 0.29% |
2.3 Glue
The glue mass that holds two extrusions together into a module is estimated from measurements of the glue cross section in completed modules. This is about 4% of the total glue and is assigned a 25% error. This is negligible.
The other 96% of the glue is that which holds each plane to the next. Measurements taken during construction give a mass of 9.05 kg per plane. There is some uncertainty due to the mass lost from outgassing, estimated at 5%.
2.4 Muon Catcher
The ND Muon Catcher is made of alternating layers of steel planes and two active (scintillator) planes. The mass of the steel in the fiducial region of the Muon Catcher was carefully measured [7]. The error on the mass itself ranges from 0.23% to 0.32%, depending on the number of planes considered. Since muons are only selected if they enter from the main detector, only consecutive combinations of plane starting with the upstream end are relevant. “Mass” here means the product of density and thickness in the region away from the edges of the steel planes. The error is predominantly due to the thickness; the density is measured with significantly higher precision.
Non-uniformity in the steel introduces additional uncertainty since muon tracks do not sample the steel uniformly. The steel has thickness variations on order of 1–2 mm, but there does not seem to be any systematic trend (e.g. the top being thicker than the bottom), so the effects of this should mostly cancel. If the variations were purely random and uncorrelated from point to point, no additional uncertainty for the muon range would be needed even given non-uniform sampling. To account for the possibility that there is some significant correlation, a simple Monte Carlo simulation has been performed. Steel planes are constructed with a random distribution of thicknesses across their surfaces drawn from the observed distributions. Many such sets of steel plates are constructed, with the length scale of the thickness variations chosen randomly, on a log scale, between 1 cm and 1 m. Muons with a realistic distribution of initial positions and angles are propagated through them and the thicknesses of steel encountered by each is recorded provided that the muon stays contained within the Muon Catcher. The distribution of deviations between the mean thickness of steel encountered by these muons and the nominal mean steel thickness gives the non-uniformity error. The effect is found to be very small, with the RMS of these deviations ranging from 0.01% to 0.03%, depending on the number of planes that a muon intersects.
The steel planes are painted to prevent rust. The very small mass of the paint has not been measured, but using the typical thicknesses of coats of paint, a 0.07% uncertainty is assigned to the steel plane mass to account for it.
The summed error for the steel planes (mass, uniformity and paint) ranges from 0.24% to 0.33%, depending on the number of planes that a muon intersects, with a mean of 0.28%. Since the mean and maximum errors are similar, the maximum is adopted as the error for the whole Muon Catcher from these effects.
The error on the mass of the active planes in the Muon Catcher is the same as that for the main ND. The steel planes are 87.6% the mass of the Muon Catcher, and 83.9% of the stopping power at minimum ionization. The error in the steel mass is uncorrelated to the 0.21% error in the active plane mass. The combined error for the steel planes and active planes is 0.28%.
2.5 Summary
Table 4 summarizes the mass accounting errors. As the quantity of interest is the mean integrated through a large number of detector planes, the total errors on that stem from mass accounting are weighted by the nominal of each material. These values are shown in Table 3. Of note is that the of steel is much lower than of hydrocarbons, because of the lack of hydrogen, so when computing the weighted averages, the impact on the error from the mass of steel is somewhat reduced.
3 Elemental composition
How much can of each component of the detector change via reasonable shifts in elemental composition? The hydrogen fraction has the biggest impact since hydrogen has a factor of two greater stopping power than the other components.
3.1 Active planes
3.1.1 Scintillator
Renkert 70T mineral oil is by far the largest component of the scintillator. Its hydrogen-to-carbon ratio is nominally 2.056. All of the molecular components have a similar ratio. Rather large adjustments to the fractions of each component within reasonable bounds can move this by about 0.01, which shifts the of the scintillator by 0.06%.
Other scintillator components have well defined chemical formulas and cannot be adjusted except to change their relative proportions. None of these has any significant effect. Since the oil and the pseudocumeme are both pure hydrocarbons, adjusting their relative fractions makes very little difference. The third biggest component, PPO, has oxygen and nitrogen, but it is only of the scintillator and the amount is well known in any case.
3.1.2 Plastic
The PVC-based plastic has only one component with an uncertain elemental make-up, which is paraffin wax. This is similar to mineral oil, except with a longer average chain length. As it is less than 1% of the plastic mass, the error incurred by uncertainty on the chain lengths is negligible.
The second biggest component of the plastic after PVC itself is titanium dioxide. This does not have hydrogen, whereas all of the other components do, so it must be examined carefully. It is nominally 19 parts out of a 129 part blend [8]. It is reasonable to assume that this is accurate to at least half a part. Letting it be 18.5 or 19.5 changes the of the plastic by 0.03%.
Similarly, one can consider adjusting the PVC content of the plastic between 95 and 105 parts, giving a shift of only 0.03% in the for even shifts of such an unlikely size. In all, 0.04% is a conservative estimate of the error from the elemental composition of the plastic.
3.1.3 Glue
The exact composition of the glue is a trade secret; ranges are given for the major components. No realistic variations in the composition change the glue by more than . Given the small mass of glue, this is quite negligible.
3.1.4 Total
Putting scintillator, plastic and glue together, a rather conservative error for the due to elemental composition for the FD and the main ND is 0.04%.
3.2 Steel, Muon Catcher
Since the steel is a commodity, ASTM A36 steel, its composition is very well known. Further, without any hydrogen to worry about, changes in which metals are present have very little effect. At most the uncertainty from elemental composition on could be 0.01%. Since the steel contributes a large majority to the Muon Catcher stopping power, the overall Muon Catcher error from elemental composition is also, at most, 0.01%.
4 Elements’ mean excitation energy
The 2016 Review of Particle Physics by the Particle Data Group (PDG) section 33.2.3 says that “the ‘Bethe equation’ ” (33.5) “describes the mean rate of energy loss in the region [0.5 MeV–100 GeV for muons] for intermediate-Z materials with an accuracy of a few percent” [9].
This sentence requires some unpacking. We interpret “intermediate-Z” to mean that for hydrogen and heavy elements, the energy range in which the bare Bethe equation is a good approximation are different. Our Monte Carlo does not use the bare Bethe equation in any case, but also includes further low and high energy corrections, so the presence of hydrogen in NOvA is not a problem. “Accuracy of a few percent” means, first, that the Bethe equation does not apply exactly at low energies where shell effects are important, nor at high energies where radiative effects are important. Neither of these effects exceed a few percent within the given energy range. Geant4 does model shell and radiative effects [10], so the lack of them in this formula does not represent an inaccuracy in NOvA’s Monte Carlo. Each of them are, in any case, a small contribution in NOvA’s energy range. Second, it means that the equation has been tested to an accuracy of a few percent.
As far as the testing of the theory is concerned, a study, which specifically deals with the individual collisions that the Bethe formula is based on, says [11, p. 189], “I suggest that the calculations presented […] agree with measurements to about 1%. Thus the results of the theory described here should be taken seriously. If differences between measurements and calculations appear, explanations should be found.” In other words, the equation itself represents a theory which has passed experimental tests and should be taken as correct within its range of validity. Any inaccuracies arise from the values of the terms of the formula.
According to PDG 2016, Sec. 33.2.4: “ ‘The determination of the mean excitation energy [] is the principle non-trivial task in the evaluation of the Bethe stopping-power formula’ ”. The term for mean excitation energy for individual elements is covered in this section, followed by Section 5 which discusses complications for compounds, and Section 6 which deals with the density effect term.
The parameter enters into the Bethe formula as . For values of , the PDG cites ICRU report 37 [12]. For instance, carbon’s value is given as eV. But the uncertainty is not . A footnote on page 19 explains that it is:
…arrived at by subjective judgments, and with a meaning that is not easily defined. One possible interpretation would be the following. If, in the future, the measurement accuracy were to be sufficiently improved so that -values could be determined with an order of magnitude better than at present, we expect that for perhaps 90% of the cases …the future -values would lie within the limits of uncertainty given in this report. The reader …could convert them to “standard deviations” by multiplying that by a factor of about one half.
This is a bit inconsistent since 90% is only 1.64, not 2. The difference, presumably, was seen as immaterial given the sort of estimations needed to summarize several 1950’s-style experiments with poorly constrained systematic errors. To be conservative, we divide by 1.64 rather than 2. For instance, the error used for carbon is eV.
4.1 Active planes
Let us consider the effect of value uncertainties on muon range at 1 GeV, roughly the average muon energy from NuMI interactions. As shown in Fig. 3ff, the resulting uncertainty on muon range is nearly constant over the range of NOvA energies. The nominal for carbon (graphite, the only form of carbon with experimental data) at 1 GeV is 1.844 MeV cm2/g. If is reduced by its error, the increases to 1.853 MeV cm2/g. Therefore the error from is 0.46%.
Similarly for hydrogen (liquid) it is 0.33% and for chlorine (liquid) it is 0.60%. For chlorine the tables quotes only 174 eV with no error since there is no experimental data. We use 12 eV as an estimate for the error on chlorine, which is double the largest nearby error in the table. Titanium and oxygen both have data on the value of and have errors from it at 1 GeV equal to 0.12% and 0.10%, respectively. For tin — a very minor component of the detector at 0.12% of the mass, but mentioned because it is so much heavier than anything else — the error is 0.17%.
Neglecting other elements for this purpose, the nominal of the main detector at 1 GeV is 2.072 MeV cm2/g. If all values are taken to be fully correlated and are shifted down by , it is instead 2.081 MeV cm2/g, which is a difference of 0.43%.
But it is too conservative to consider the errors fully correlated. The major components are hydrogen, carbon and chlorine. First of all, chlorine’s error is an arbitrary large value inspired by periodic trends, so it is largely uncorrelated with hydrogen or carbon (although possibly somewhat correlated with the nearby titanium, but titanium is only 3.2% of NOvA’s mass, so this is negligible).
The adopted value of hydrogen’s is a combination of measurements that were normalized to copper, those normalized to water, and an absolute measurement [12]. The absolute measurement is the most precise. The largest source of error on the absolute measurement, which used muon and proton range, is from the uncertainty of the pressure of liquid hydrogen in the Argonne 30-in bubble chamber [13].
The adopted value of carbon’s is a combination of measurements normalized to copper, water, and aluminum as well as an absolute measurement. The absolute measurement is the most precise, followed by those normalized to water and aluminum.
The absolute measurements in each case used a direct measurement of particle range, with different energies used for the two elements. There’s no overlap in authors between measurements used for carbon and hydrogen. And the major systematic error on the best hydrogen measurement cannot affect the carbon measurement. In summary, it is fair to consider the errors to be mostly uncorrelated. The error if the elements were fully uncorrelated, would be 0.29%. We have somewhat arbitrarily chosen to take a point 1/4 of the way between uncorrelated and fully correlated, arriving 0.33% for the at 1 GeV.
The quantity desired is the error on the conversion between track length and initial muon energy. For this, the error from zero to 1 GeV, weighted by the reciprocal of the nominal , is integrated. The result is slightly higher because the error rises at low energy: 0.36%. This integrated error is shown as a function of energy in Fig. 3ff. Despite the energy dependence, since the overall muon range error is dominated by the density effect parameterization (see Section 6), the range error is ultimately taken as a single number evaluated at 1 GeV.
4.2 Steel, Muon Catcher
The error on iron’s is quite small: eV. Manganese is the next largest component at 1.03%. Its error is also small, eV. Because the best measurements in each case come from the same paper [12], we assume they are fully correlated. The error on in the steel from values is then 0.24%.
The measurements of for iron and manganese are mostly unrelated to those on carbon and hydrogen. There is one paper in common, Ref. [14], but it is the oldest and least precise. The most precise measurements of iron come directly from particle ranges without reference to other materials. The steel and active planes are therefore combined assuming the errors are mostly uncorrelated, and arrive at 0.22% for the Muon Catcher.
5 Compounds
What about the fact that the detector is made of hydrocarbons and not a mixture of graphite and liquid hydrogen? PDG 2016 Sec. 33.2.10 says that it leads to an underestimate of (overestimate of ) if the compounds are treated as mixtures. They reference Refs. [15, 16] by Seltzer and Berger, from which it would seem that the mistake can go either way.
NOvA’s Geant4 model does not specify how elements are bound together into compounds. The manual [10], Sec. 12.2.2: “Charged Hadron Incident: Low energy extensions: Energy losses of hadrons in compounds”, says that if the user doesn’t specify compounds, Geant4 treats substances as a mixture. Even if compounds are specified, they have to be on a short list that doesn’t include any of NOvA’s major components. So the only choice is to apply a correction and/or systematic error after the fact.
Seltzer and Berger give a prescription for estimating and a rough error thereon for unmeasured materials. Hydrocarbons have been particularly well-studied [17], so this prescription is believed to be robust for NOvA.
5.1 Active planes
Applying Seltzer and Berger’s rule to mineral oil, which is itself unmeasured, gives a shift of 0.04% up in relative to a mixture of the same elements, with an error of 0.15%.
Direct measurements have been made with both PVC and titanium dioxide. The experimental error for PVC is 0.58% and is consistent with Seltzer and Berger’s rule. The rule indicates shifting down %. The rule is therefore favored over the data. Likewise, for titanium dioxide, the experimental error is 1% and is consistent with the rule, which tells us to shift down %.
In sum, applying this rule suggests a downwards shift of %. We take this as a systematic error of 0.2%.
5.2 Steel, Muon Catcher
Molecular considerations probably do not apply to alloys [18, p. 204]. In any case, since steel is nearly all iron, it cannot make very much difference. This leaves a 0.04% error for the Muon Catcher from the compounds in active planes.
6 Density effect, Geant4 validation
6.1 Density effect
The treatment of the density effect turns out to be the biggest source of uncertainty for all absolute and shared errors. The PDG [9] covers the density effect, i.e. the Bethe-Bloch term , in Sec. 33.2.5. While the density effect can be calculated directly, the most popular approach, which is implemented by Geant4, uses the parameterization introduced by Sternheimer in 1952 [19] which approximates the effect by breaking it into three piecewise functions of energy. In 1971 Sternheimer gave a recipe for finding the values that go into this parameterization for arbitrary substances [20]. This recipe restricts the values of two of the parameters to be integers, and a third to be always zero, for ease of computation without a computer. This double-approximation is what is implemented by Geant4, unless a NIST material is used. In this case, Geant4 uses the values from Sternheimer 1984 [21]. The well-known Groom tables [18] use this latter set of parameters.
Geant4’s implementation of the density effect is discussed in the Physics Reference Manual in Sec. 12.1.2 on hadron-incident, and also in section 8.1.2, for electron and positron-incident [10].
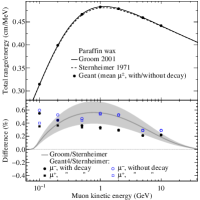
For paraffin wax, which is a tolerable approximation of the NOvA detectors, the 1984 paper promises a deviation on the value of of not more than 0.052. The 1971 paper gives the “average absolute maximum deviation” for solids and liquids as 0.178. Roughly speaking, then, the 1984 values for paraffin wax should be about one third as much in error as the 1971 values.
To see how different the parameterizations are, we coded up both versions for the case of paraffin wax. The difference is energy dependent with a maximum of 0.56% near 800 MeV. See Fig. 8, which shows the results as the curves in the top panel and their difference as the curve in the bottom panel.
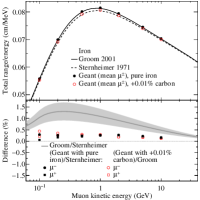
For steel, we repeated the procedure, using iron as a tabulated stand-in. The results are also shown in Fig. 8. The differences are larger in iron, peaking at 1.3% at 250 MeV. While we do not use muons with a total energy of 250 MeV (NOvA’s selection fails nearly all muons below 400 MeV), what’s relevant is the energy of the muon when it enters the Muon Catcher, which can easily be 250 MeV.
If NOvA materials were among those with tabulated density effect parameters, it would be reasonable to take an error equal to 1/3 of the difference to account for the remaining deviation between the better approximation and the exact treatment. However, no substance in NOvA is tabulated.
6.2 Validation
It is worth checking whether Geant4’s implementation of the Bethe-Bloch formula results in the correct range, with the best estimate of that correct range given by Groom 2001 [18]. There is some expected deviation from the use of the Sternheimer 1971 [20] parameterization of the density effect, as estimated in Section 6. It is also expected that the Geant4 range will be very slightly too long because it doesn’t know our elements are in compounds (see Section 5), but this is only 0.04% for the active planes and less in the Muon Catcher. Groom does not mention muon decay in flight, so it is unclear whether it counts as a source of energy loss or not; this matters at the O(0.1%) level. Finally, Groom neglects the difference of “a few parts per thousand” in the range between and , but Geant4 does not. For (), we can expect the Geant4 range to be slightly longer (shorter) than the Groom range.
We ran many and through a detector model made of solid paraffin wax another made of solid iron, and a third made of 99.99% iron with 0.01% carbon. The motivation of the last was to test Geant4’s switch from a tabulated to untabulated material. Our implementation of paraffin wax is , motivated by Groom’s definition . This has one fewer hydrogen than Groom’s, assuming the intent was for it to be strictly saturated. The definition of paraffin wax in Sternheimer 1984 includes the , and all the parameter values match Groom’s. This implies . The difference between 51 and 52 makes a difference of 0.02% in the ratio of ranges for the two density effect parameterizations, with the singly-unsaturated hydrocarbon being slightly more different. It makes much less difference whether is interpreted as 23 or some other nearby number. The reference density of 0.93 g/cc was used. Iron was simulated in the same way, and at 7.874 g/cc to match the Groom tables.
Care was taken to avoid ambiguities in the definition of track length. Geant4 gives access to the physical path length, via G4Step::GetStepLength(). This length includes the deviations from multiple Coulomb scattering. For comparison with Groom, we believe it is correct to compare with this length. Groom says that “multiple scattering is neglected,” which we take to mean that ranges are the full physical length, not the (slightly shorter) depth that a particle penetrates into a block of material. This isn’t completely clear, and it’s also doubtful whether the various old experiments that provide all the data for parameters such as the mean excitation energy made this distinction. For that matter, as discussed in Ref. [22], there’s been confusion over the years as to what theory should be used for multiple scattering.
Following the cautions in many sources [9, 18, 11] about how many events must be simulated to obtain a reliable mean , 105 events were simulated in each case. An example distribution is shown in Fig. 9.
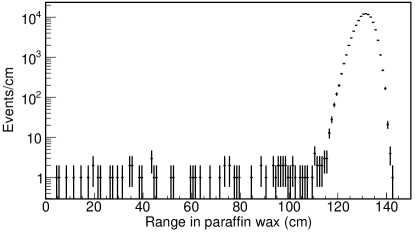
Fig. 8 shows the results of the validation study. Because of the ambiguities noted above, the bottom panels show the difference between the expected range, using the Sternheimer 1971 approximation, and Geant4 for both and and both with and without muon decay. Geant4 gives consistently longer ranges than expected, with only a slight energy dependence. Since the ranges are 0.2–0.6% longer than expected from the Sternheimer 1971 approximation, they are quite close to the Groom ranges. But this must be an accident since (a) Geant4 does not know that this is paraffin wax so cannot look up the parameters for paraffin (b) the shape shown in the bottom panel does not track the difference between Sternheimer and Groom.
For iron with a tiny amount of carbon added to prevent Geant4 from using the Sternheimer 1984 parameters for this tabulated substance (also used by Groom), the range also tracks Sternheimer 1971 as expected, but is also a little high, with the mean of and being 0.1–0.3% above what’s expected. The difference between allowing or disallowing muon decay as energy loss is not plotted in Fig. 8 because it makes so little difference for iron, given its high density. For pure iron, the expected shift to tabulated parameters is seen. Now the range tracks Groom instead, while also being 0.1–0.3% high.
6.3 Uncertainty taken
The situation for the FD and main ND is as follows:
-
•
Geant4 uses an old approximation that causes the range to be 0.6% too short around 1 GeV for a reference hydrocarbon that is similar to the primary detector materials.
-
•
The error on the new approximation can be estimated to be 0.2% at 1 GeV, but since neither NOvA scintillator nor plastic is a tabulated material, it isn’t possible to use it.
-
•
Some unknown feature of Geant4 causes the range to be more-or-less uniformly 0.4% longer than expected (i.e. the Groom range when using the 1984 parameters or the same modified by the difference in density effect parameterizations when using the 1971 parameters). This could be a bug, or it could be that Geant4 takes into account real effects that Groom neglects.
So in the range 400 MeV to 4 GeV which is relevant for most NOvA analyses, Geant4 (apparently) accidentally agrees quite closely with Groom, but if Groom and Geant4 are assumed to use equally good code, then we have to estimate a 0.4% error from two attempts to model the same process coming up with different answers.
There is also the 0.2% error on the true size of the density effect from the better approximation. That error is almost certainty anti-correlated between energies within the relevant range for NOvA, since the three-part piecewise Sternheimer approximation is meant to keep the result close to the exact form and therefore probably crosses it at least twice. Without undertaking the exercise of calculating the exact form, it’s not clear what there is to be done about this. Another complication is that the exact form is still subject to experimental error, namely it is a function of the mean excitation energy [19].
The situation for the Muon Catcher steel is similar except there is no accidental agreement. We have decided to assign a density effect+validation error equal to the quadrature sum of:
-
•
The greater of:
-
–
The difference between the two sets of density effect parameters (given that Geant4 uses the worse ones), and
-
–
The energy-dependent difference between Geant4 and the Groom calculation, averaged over and , and over including muon decay and omitting it.
The former is greater at all energies used by the disappearance analysis.
-
–
-
•
Twice the error on the 1984 approximation, taken as 0.3 times the difference between the two sets of density effect parameters (0.6 times after doubling). It is doubled to make some attempt to account for the complications discussed above.
The result is then scaled up by 1.1 for the main detector, to attempt to cover the chemical differences between paraffin wax and the detector materials, and by 1.01 for the steel, since iron and steel are very similar.
The main detector does not have the same density as the reference paraffin wax, but at a mean of 0.98 g/cc, it is quite close. The density effect is somewhat stronger for the PVC and somewhat weaker for the scintillator. Numerically, the cancellation is nearly perfect, so the magnitude of the effect in paraffin wax is the same as the mean magnitude in the detector. Likewise, no scaling of the effect is needed for the steel since the reference density is within half a percent of our steel planes.
This results in a maximum error, from the density effect and Geant4 validation, of 0.8% for the main detector and 1.2% for the Muon Catcher. The density effect/validation error from the active detector and the steel are taken to be uncorrelated.
6.4 Inhomogeneities
The above discussion assumes homogeneous mixtures with constant density. It is not clear how to treat the density effect if the material is microscopically inhomogeneous [12]. This is true for NOvA plastic, which contains 15% powdered titanium dioxide (anatase crystalline form) by weight [23] with density 3.78 g/cc [24] mixed with the PVC itself which has a density 1.1 g/cc.
Using the same method as Ref. [12], the severity of this effect is determined by evaluating the density effect for the case of a uniform material and one split entirely into two density regions. The in the latter case is lower. Modeling the PVC as paraffin wax again, the difference at 1 GeV, which is approximately where the effect is largest, is 0.33%. Since the real effect must be between zero and this, presumably depending on how the maximum impact parameter for excitations compares to the size of the titanium dioxide grains, the midpoint is taken as the best estimate and the error as a uniform distribution with RMS . The error is on the PVC only, making a shift in of overall.
7 Coulomb corrections
The energy of the outgoing muon in a neutrino-nucleus interaction is modified by the Coulomb field of the nucleus. For , the muon is attracted to the nucleus, so energy is lost, and vice versa for . There exists an implementation of this effect in Genie, but it is disabled by default, and is left disabled for NOvA. This is just as well, because the version currently used by NOvA, 2.12.10b, has a bug in which it subtracts energy from the lepton regardless of charge.
A simple form of the correction, as implemented by Genie, is [25, 26]:
where is the fine structure constant. The mean effect in NOvA for interactions, which create , is 4.8 MeV, and for interactions, which create , is 3.0 MeV. See Table 5. The asymmetry is caused by the charge of the residual nucleus, which differs by 2 units, including the fact that can interact on hydrogen to produce a neutron, for which there is no correction.
| shift (MeV) | Fraction | shift (MeV) | Fraction | |
|---|---|---|---|---|
| H | 1.6 | 0.003% | 0 | 20% |
| C | 3.9 | 74% | 2.8 | 61% |
| O | 4.7 | 3% | 3.6 | 3% |
| Cl | 7.5 | 19% | 6.7 | 14% |
| Ti | 8.8 | 4% | 8.0 | 3% |
| Sn | 14.8 | 0.2% | 14.2 | 0.1% |
Bodek [27] gives a form with somewhat different coefficients, yielding results 7% smaller. It seems reasonable, then, to take the correction to be accurate to 10%. At 1 GeV, this is 0.05% for and 0.03% for . It’s notable that Bodek also recommends a second correction for Genie to the outgoing lepton energy. Neither this correction nor any uncertainty on it has been used thus far by NOvA. Ultimately, it may be the correct approach to fold both corrections into a single unified treatment that ensures MeV-level energy conservation.
It has been decided to treat these concerns separately from the muon range error in future NOvA analyses.
8 Hadronic modeling and response
Inaccuracies in hadronic modeling could cause the data and MC to have different amounts of overlap between the muon and hadronic system which could cause the reconstructed track length to differ in an unmodeled way. This could further be somewhat different between the ND and FD because of the different acceptances. Unlike the previously discussed sources of error, this error is dependent on details of the neutrino interactions in the NuMI beam. The standard neutrino-mode NOvA beam is assumed throughout.
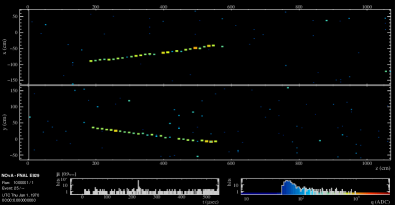
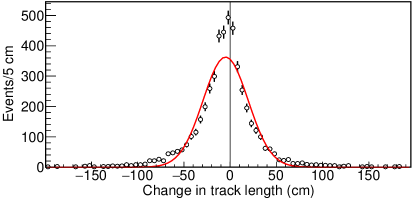
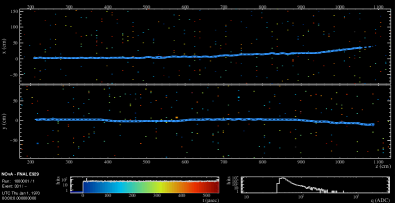
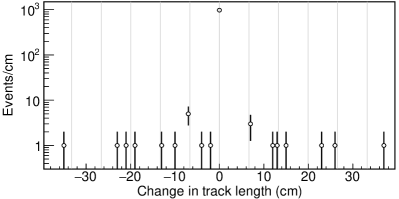
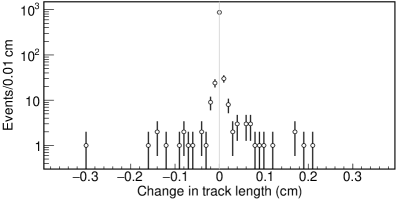
To put a bound on the size of this effect, a study was performed to check how much reconstructed track length changes for neutrino events if all primary particles other than the muon are removed from the event after Genie [28] and before Geant4. The muons are resimulated in this study, and so some change is expected from real differences in the muon track, but this change is zero on average. A sample of ND events with well-contained muons was used. The reconstructed track length differences are shown in Fig. 12.
An example of the procedure is shown in Fig. 10. The original event is
at 1.5 GeV. Note how in the muon-only event the muon does not follow exactly the same trajectory. In this case, the original reconstructed muon track is 363.7 cm long and the bare muon track is 360.9 cm long. The bare track looks one plane longer in the event display, but the last hit in each view is from the Michel electron and is not in time with the track, whereas only the last hit is a Michel in the full event. The reconstructed start and end points in are the same for each version of the event, but the bare muon travels slightly less distance in and than the muon in the full event, i.e. in this case, the difference in length is a function of different multiple scattering.
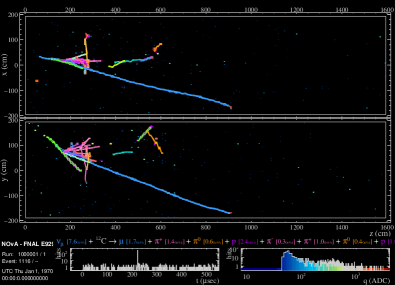
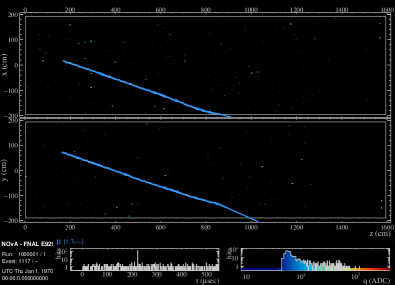
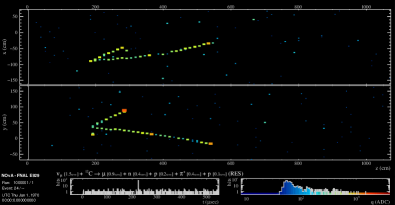
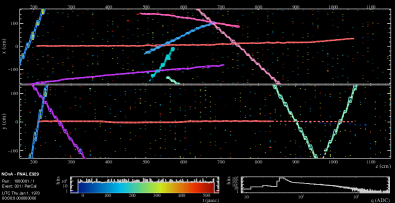
A more complex example is shown in Fig. 11.
at 7.6 GeV. One of the is backwards-going and the reconstruction has incorrectly connected the muon track to its hits.
The average track is cm — or % — shorter by itself than it is with the whole event. About 70% of this shift is due to small changes in track length, visible as the shift in the peak from zero. Evidently on average there is some soft backwards-going shower activity that gets incorrectly attached to the track, typically one plane’s worth. Or alternatively, the presence of several charged particles in the first cell cause that cell to be over threshold whereas with just the muon — traversing part of a cell — it would not be. The other 30% of the shift is due to substantial changes that form the asymmetric tail on the low end in Fig. 12, presumably mostly originating from backwards-going particles that get attached to the muon track.
In the following discussion, the fraction of this 1.94% that needs to be taken as a systematic error is evaluated.
8.1 Overall cross sections
| Interaction | (cm) ND | % ND | % FD |
|---|---|---|---|
| Coherent | |||
| Quasielastic | |||
| MEC | |||
| Resonant | |||
| Deep inelastic | |||
| All |
This difference is much larger than would be caused by any mismodeling of neutrino interactions. There is hadronic activity; the only question is the details. To get a better handle, the sample is broken into coherent, quasielastic, resonant, MEC, and deep inelastic events. It is also repeated for the FD. See Table 6. All of the results are consistent between ND and FD except for resonant events, which are reconstructed with less of the hadronic activity attached to the muon track in the FD. Since the other interaction types are consistent, this is believed to be a flux difference rather than a detector effect.
The smallest difference between track length with and without hadronic activity is seen for quasielastic events, which stands to reason. Some idea of a reasonable upper bound on the systematic uncertainty can be obtained by considering the change when each interaction type is turned off entirely. Without MEC, the shift is 0.07%. Without resonant events, there is a 0.29% shift at the FD and 0.7% at the ND. Or without quasielastic, 0.25%. A conservative estimate for the relative uncertainty in the cross sections between interaction types is perhaps 30% [29], making a reasonable systematic error from cross sections 0.23% (ND) and 0.11% (FD). The shape of the cross sections matters as well as the overall normalization, but given such a large normalization error, this is neglected.
Even these small errors could be eliminated if the muon energy estimator — the reconstruction code that translates observed muon track length to muon energy — were retuned at each step of the evaluation of cross section errors in the overall oscillation analysis. For simplicity, this is not done. The error on muon energy from cross sections arises from using the only nominal Monte Carlo to tune the energy estimator.
8.2 Topology
Unmodeled or mismodeled event topology must also be considered. To constrain mismodeling in which Genie predicts the wrong distribution of backwards-going charged particles that leave significant tracks, a low-statistics scanning study was performed. Looking at 50 contained Near Detector data and MC events, it was noted how many times there seemed to be a track of at least two planes coming backwards out of the neutrino vertex. The assumption is that the total number of these is proportional to the number that are sufficiently in line with the muon that the reconstruction attaches them together.
In each case, there were nine such events. This constrains the data/MC ratio for such events to . As given above, events where a track like this gets attached to the muon track contribute about 30% of the mean shift. So this gives an uncertainty of 0.5 of 30% of 1.94%, or 0.26%.
In each case discussed so far, for purposes of reconstructing neutrino energy, any hit which is transfered from the shower to the track still contributes to the total energy. The only difference is whether it contributes towards an estimate of muon energy by track length or hadronic energy by calorimetry. Roughly, the average hit contributes 13 MeV if it is part of a muon track and 17 MeV as part of a shower, so the shift only changes the total event energy by 24% of the amount the track energy shifts. This brings the effective systematic from cross-section uncertainties and topology, taken as uncorrelated, to 0.08%.
This study was done with NOvA’s Kalman tracker, which knows nothing of the neutrino interactions and will follow a track through the neutrino interaction vertex. A newer tracker called BreakPointFitter is aware of the vertex and will not connect particles going backward with those going forward, provided the vertex is correctly identified.
8.3 Remnant nucleus
An unmodeled effect that does not simply represent a shift from track to shower energy is that Genie does not model boil-off nucleons or de-excitation photons from the remnant nucleus222Except if the struck nucleus is oxygen it does emit photons, because Super-Kamiokande needed that [28]. So there is a population of unmodeled – MeV isotropically emitted particles that can add a hit or two near the vertex and shift the muon energy.
Let us suppose that the remnant nucleus on average emits one proton of 5 MeV, somewhat above carbon’s Coulomb barrier, and one photon of 5 MeV, typical of de-excitation. The proton’s average range is 0.3 mm [30] and so only matters in so far as it might boost the cell hit over threshold. After Birk’s suppression, the effective energy is about 0.5 MeV. Given that 62% of the neutrino interactions are in scintillator, and that a muon that crosses the whole cell deposits 12 MeV, it may push the hit over threshold 3% of the time. This effectively lengthens the average track by 0.2 cm.
The photon, in contrast, has a cm interaction length and will deposit MeV on average the first time it interacts. The probability of it going backwards and reasonably in line with the track in 2D is about 25%, and the probability of interacting in that plane is about 25%, so it may extend the track about 6% of the time. Putting this together with the estimate of the effect from protons, a reasonable estimate for the lack of de-excitation in Genie is that tracks in data are cm longer than in MC.
Putting these together, and noting that if a harder particle scatters backwards, which happens about 20% of the time (see above), these nuclear effects don’t matter, this represents an unmodeled increase in track length of about 0.5 cm, or 0.17%. Added to the errors above, this gives 0.19% for the absolute error in either Near or Far Detector due to how tracking interacts with hadronic modeling.
8.4 Near/Far
The beam spectrum is different between the Near and Far Detectors, the acceptance of the Near Detector is much more limited, and the hit threshold at the Far Detector is higher. However, the cross section uncertainties mostly cancel and the other effects are mostly covered by the MC, so one must be left with a small fraction of the absolute error, which is already small. To be concrete, the residual error is assumed to be a quarter of the absolute, making it 0.05%.
9 Near Detector neutron pile-up
Over the course of a 10 s beam spill, many thermalized neutrino-induced neutrons build up in the ND, some produced in the detector, and some in the surrounding rock. As the neutron capture time in the detector is about 50 s, the number of neutron captures, most on 35Cl producing 8.6 MeV of gamma rays, increases roughly linearly over the spill. Typically these capture events produce one hit that cannot be readily connected to its parent neutrino event, since it is well separated in time, and neutrons can travel long distances before being captured. This effect is negligible at the FD, which has much less than one neutrino interaction per beam spill on average.
These stray neutron hits can randomly appear near the beginning or end of muon tracks, causing the reconstructed track length to be increased. It has been found that, even though neutron thermalization and capture is modeled by our MC, this effect is much more prominent in data than in MC. The causes of this are still under investigation, and may have to do with neutron modeling, details of hit timing, or both.
The effect is most clear in the Muon Catcher. For full-intensity beam spills, tracks ending in the Muon Catcher near the end of the spill are reconstructed with MeV more energy on average than those at the beginning. On the other hand, the effect in the main ND is too small to clearly measure, with an upper limit of perhaps 10 MeV.
This difference is understood as the combination of two geometric effects. First, pairs of planes in the Muon Catcher are separated by 10 cm of steel, so a randomly placed hit added to a track typically adds a much greater amount of material that the muon is incorrectly inferred to have traveled through. Second, for a fixed angular acceptance, the tracker has more cells that it will accept as part of a track in the Muon Catcher since the active planes are offset by steel planes. These together give about a factor of 10. This is reduced by perhaps a factor of two by the fact that many of the neutron-produced gammas in the muon catcher are absorbed by the steel.
A 7 MeV systematic error is taken for the Muon Catcher to cover the mean of the effect for full intensity spills. This is a bit less than half of the difference in observed track energies to account because it is assumed that part of the effect occurs at the upstream end of the track in the main ND. For the main ND, an error of 2 MeV is used. These errors are most applicable to full intensity beam in neutrino mode. In anti-neutrino mode, the number of interactions per spill is lower by about a factor of three, reducing the effect roughly in proportion.
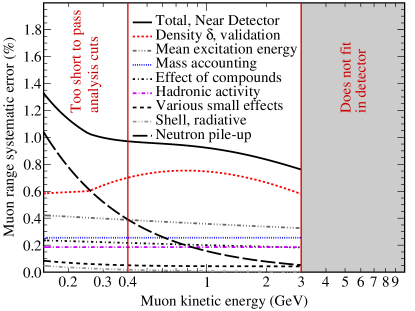
Because the length of selected muon tracks in the Muon Catcher can be very short, it is awkward to represent the error as a single percentage. As shown in Fig. 6, the effect of neutron pileup (along with other much smaller energy-independent effects) can be as much as 5.0%. To keep the implementation of the error simple, instead a flat error of 21 MeV is used. This is the maximum absolute error and overestimates the error in the Muon Catcher for the shortest tracks by a factor of three. In future analyses, the pile-up error may be considered separately to avoid this overestimate.
10 Negligible effects
Uncertainties from noise modeling, muon decay, and multiple scattering are each found to have an effect of order 0.005%, while block and plane alignment has an effect of about 0.01%.
10.1 Noise modeling
Differences in detector noise between data and MC could result in additional hits being added to tracks in an unmodeled way. Since the Near Detector is much quieter than the Far Detector, this would be mostly a FD effect.
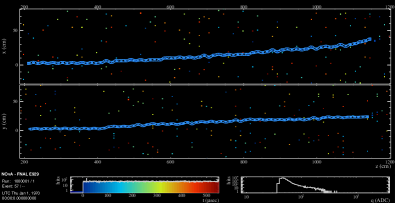
In the course of NOvA analysis, several different approaches to handling noise have been used. As the effect will be found to be very small, let us make an estimate bounding the magnitude of a potential problem with noise modeling that is agnostic to the approach. One thousand 2 GeV muons were simulated in the FD and overlaid with cosmic data. The reconstructed track length of simulated muons was compared with and without the cosmic overlay. Nearly half of the tracks changed length, but most changes were less than 0.3 cm, caused by additional hits along the track slightly changing the trajectory, with 97.6% changing by less than this amount. The remaining 3.4% changed by up to 40 cm (see Fig. 15).
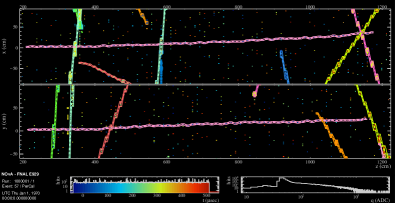
An example of a track which got 35 cm shorter is shown in Fig. 13. Without overlay, two 2D tracks are formed in the view, but with the overlay, the second one is not made and then the subsequently created 3D track is shorter because the view track is shorter. Fig. 14 shows a track that got 26 cm longer. In this case, the last two hits in the view, which are part of the true track, did not get included in the slice in the MC-only file, apparently because the second to last is about 0.5 s out of time with the rest. With cosmics overlaid these two hits did get sliced in, and also included in the track. Two cosmics pass near the end of the MC muon, but this appears to be incidental; they are well out of time. Probably a noise hit linked the trailing track hits together with the rest of the track.
The average track became cm shorter. Alternatively, ignoring tracks that changed by less than 0.5 cm, the average change was to become cm shorter. The error is statistical, and sufficiently small to show that the impact of this effect is tiny. Even for a rather short track of 100 MeV, it represents an uncertainty of 0.04% in the extreme case where noise or cosmics are not modeled at all. The real uncertainty is at least an order of magnitude smaller. As in the discussion in Section 9 about neutron pile-up, the effect of adding additional hits is bigger in the Muon Catcher, but even there it is negligible.
10.2 Muon decay
If the muon decays soon after stopping, the 1–4 hits from the Michel electron have some chance of being reconstructed as part of the track, resulting in an overly high track energy estimate. This is fine as long as the data and MC agree. There are both physical and detector effects that could cause differences. First, for , there is a 1% uncertainty on the fraction of the time that the muon decays rather than undergoing nuclear capture. Second, NOvA electronics are inefficient for recording hits in the few microseconds after a large energy deposition in a module, and this is known to be modeled poorly.
As a back-of-the-envelope estimate, suppose that a Michel electron has a 20% chance of being swept up into a track if it is in time with the rest of the track, which is reasonable given the isotropic decay direction. Suppose further that “in time” means that the muon decays in the first 0.25 s, which happens 10% of the time. (The details of NOvA’s reconstruction algorithm means that no single number defines “in time”, but this approximation suffices.) A Michel goes one or two planes and may add 15 MeV to the track energy. The impact is biggest on low energy muons, so let us consider a 150 MeV muon, for which this is a 10% shift. Since it happens 2% of the time, the mean difference if muon decay were totally unmodeled would be 0.2%.
Consider capture. There’s about a 1% absolute uncertainty on the fraction that capture. The systematic error on the reconstructed muon energy from this effect is then about 0.002%. For that do decay, their lifetime and Michel spectrum are a function of which isotope they are in orbit around, but this must have a similarly tiny impact.
Consider the electronics effects. For them to matter, the Michel hits must be in a module that was hit previously. But this is unlikely if it is swept up in the track, since to be in the same module suggests a large angle between the muon and the Michel and to be included in the track suggests a small angle. Suppose this happens 10% of the time, and that the efficiency in this case is very badly mismodeled, by 50%. The contribution to the systematic error is still something less than 0.01%.
10.3 Multiple scattering
The reconstructed muon range is shorter than the real distance the muon travels because the scale of multiple scattering is shorter than the NOvA cell size. This only matters up to discrepancies between the data and MC.
Multiple Coulomb scattering is summarized by the PDG [9] Sec. 33.3: “it is sufficient for many applications to use a Gaussian approximation for the central 98% of the projected angular distribution, with an rms width given by:”
Nominally, NOvA soup (that is, a uniform material made from stirring the scintillator, PVC, glue, fiber and air together in the detectors’ proportions) has a radiation length, , of 34.89 g/cm2. Much as in Section 3, modifications of the elemental composition can be tested to see how much can reasonably be changed. The effect of varying the hydrogen fraction of the oil within reasonable bounds changes by only 0.01%. Varying the amount of dissolved nitrogen and oxygen in the scintillator between zero and double the best estimate makes no difference. Changing the titanium dioxide content of the plastic between 18.5 and 19.5 parts changes it by 0.04%. Finally, varying the PVC content of the plastic between 95 and 105 parts changes it by 0.03%. Reasonable changes to the glue change the soup’s by only 0.01%.
In sum, the uncertainty on from elemental composition is, conservatively, about 0.05%. At first order, varies like the square root of the radiation length. The bracketed term increases this slightly. For scattering through relevant length scales, the uncertainty in is 0.03%.
The ratio between the straight-line distance between a particle track’s start and end and the physical distance traversed is at most for a single scatter through an angle halfway through the track. At small this is approximately . For a small fractional change , the change in the ratio is therefore . Given , the error in the track length from multiple scattering is something less than 0.007%.
10.4 Alignment
The 32-plane blocks in the Far Detector are aligned relative to each other in with an RMS somewhat less than 1 cm. The block-to-block relative alignment in is expected to better than this for structural reasons. In the MC, random alignments in each direction are used, with a uniform distribution of width 0.8 cm in and 0.16 cm in .
Plane-to-plane alignment within blocks is not well understood, although the method of assembly — modules pushed up against a stop on top of the block lifter — suggests it is at the millimeter level for the edges with the stop, in each of and , and probably degrades away from that edge.
If a muon is traveling in a straight line and crosses a block boundary for which the alignment is mismodeled, it will appear to bend, increasing its track length. Let us estimate an average mismodeling of 0.6 cm in , which is a rough sum in quadrature of the actual alignments and those used in the MC. The segment of the track at the boundary gets longer, where is the distance between planes in one view, 13.3 cm, and is the MC misalignment. This comes to 0.09%. In , assuming 0.3 cm typical misalignment, this is instead 0.03%. Assuming planes within blocks have typical alignment differences of 0.2 cm, each intrablock plane boundary causes the muon track to be 0.01% too long. The average over a block, and therefore the detector as a whole, is a 0.014% overestimate of track length.
The Near Detector MC model, including the Muon Catcher, incorporates survey information, and so has a much smaller version of this, already negligibly small, error. For the ratio, the errors at the Near and Far are uncorrelated, so it is the same as the Far Detector error by itself, which is also negligible.
| (GeV) | Mass | Compounds | Pile-up | Hadronic | Total | Dominant | Next | |||
| Absolute | ||||||||||
| FD | 0.7 | 0.28% | 0.37% | 0.21% | 0.8% | — | 0.19% | 0.93% | param. | |
| ND | 0.4 | 0.25% | 0.39% | 0.22% | 0.7% | 0.4% | 0.19% | 0.97% | param. | Pile-up |
| C, % | 0.15 | 0.28% | 0.22% | 0.04% | 1.2% | 4.9% | — | 5.0% | Pile-up | param. |
| C, MeV | 2.0 | 6 MeV | 3.4 MeV | 0.6 MeV | 18 MeV | 7 MeV | — | 21 MeV | param. | Pile-up |
| Fully correlated | ||||||||||
| ND/FD | 0.7 | 0.23% | 0.39% | 0.20% | 0.7% | — | 0.18% | 0.91% | param. | |
| C/FD | 0.7 | 0.05%/0.28% | 0.06%/0.37% | 0.03%/0.21% | 0.1%/0.8% | — | — | 0.15%/0.91% | ||
| C/ND | 0.4 | 0.04%/0.25% | 0.06%/0.39% | 0.03%/0.22% | 0.1%/0.7% | 7 MeV/0.4% | — | 8 MeV/0.4% | param. | Pile-up |
| Uncorrelated | ||||||||||
| ND/FD | 0.4 | 0.15%/0.14% | — | — | — | 0.4%/— | 0.03%/0.03% | 0.42%/0.15% | Pile-up | FD scint. |
| Ratio: 0.45% | volume | |||||||||
| C/FD | 2.0 | 6 MeV/— | 3.4 MeV/— | — | 18 MeV/— | 7 MeV/— | —/0.19% | 20 MeV/0.19% | param. | Steel vol. |
| Ratio: 21 MeV | ||||||||||
| C/ND | 0.4 | 0.28%/— | 0.11%/— | — | 1.2%/— | — | —/0.19% | 1.3%/0.19% | param. | Steel vol. |
| Ratio: 1.3% | ||||||||||
11 Conclusions
Table 7 summarizes the errors above and gives the totals for Near, Far, the Muon Catcher, and the Near/Far ratios. The main results are the fully correlated component of the Near and Far uncertainties, 0.9%, and the uncorrelated component of the Near/Far ratio, 0.4%.
In the table, errors for pairs including the Muon Catcher are given in two parts, one for the Muon Catcher and one for the other detector (i.e. the main ND or the FD). This is because for dissimilar detectors it does not make sense to assign a single number for a correlated error; an error can be fully correlated but have an effect of a different magnitude for the two detector components. In each pair, the first error is for the Muon Catcher and the second for the main ND or the FD.
The total errors which are fully uncorrelated between detectors are:
The table shows, for each pair of detectors, the total error uncorrelated within that pair, and the error on the ratio for that pair.
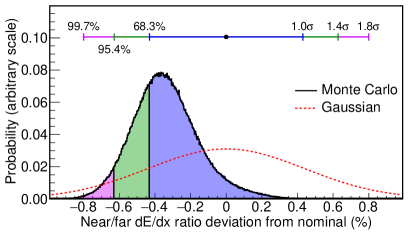
11.1 Gaussianity
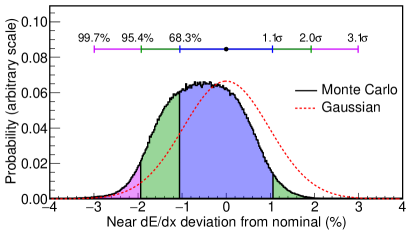
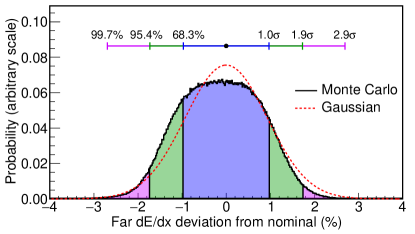
The errors are built out of several Gaussian and non-Gaussian parts by adding each part’s RMS in quadrature. In NOvA’s analysis, errors are assumed to be Gaussian, so we have checked the Gaussianity of this error (see Fig. 16). In cases where the underlying error doesn’t have a well-defined PDF, a rather non-Gaussian one was chosen. Notably, the density effect error is modeled as a uniform distribution.
The asymmetries come primarily from the FD scintillator and ND PVC masses. In the former case, a possibility is included that the metering is a better measurement than the modules’ volumetric measurements. In the latter case, it is from the offset in PVC mass due to non-uniform selection of extrusions. There is also an asymmetry from the boil-off correction (see Section 8.3).
Out to , a Gaussian is a reasonable approximation of each of the total errors. However, there is a significant long tail, such that 99.73% of the probability is not covered until 3.5“”. This comes primarily from the PDF chosen to represent the ICRU’s evaluation of experimental results, mostly from the 1950’s and 1960’s, for the mean excitation energy . A 95% probability is assigned for each to have a good error with an RMS of 0.9 of the nominal 1 error, and a 5% probability of being seriously flawed, represented as a second Gaussian with 4.5 times the nominal error. This (non-uniquely) satisfies the ICRU’s statement of what their errors mean.
The error on the ND/FD ratio is designed to cover several offsets — mainly neutron pile-up — and as such is quite conservative when pushed past .
11.2 Relevancy to other particles
| Source | Charged hadrons | Electrons |
|---|---|---|
| Affect true : | ||
| Mass accounting | Yes | Yes |
| Mean ex. energy | Yes | Yes |
| Density effect | Yes, more so for | Yes |
| Elemental composition | Yes | Yes |
| Compounds | Yes | Yes |
| Other types of effects: | ||
| Hadronic modeling | Yes (in reverse) | Yes |
| Coulomb correction | Yes | Yes |
| ND neutron pile-up | Slightly | Slightly |
| Noise modeling | Slightly | Slightly |
| Muon decay | and K+ only | No |
| Multiple scattering | No | No |
| Alignment | No | No |
Many of the uncertainties explored in this note in the context of muons are also relevant to other particles, as summarized in Table 8. The uncertainties fall into two classes, those that affect the true and those that cause uncertainty in the muon range in some other way. All the major effects are in the first category.
Hadron and electron energy are measured calorimetrically, with the calorimetric response calibrated using the minimum ionizing portion of stopping muons. Each of the class of errors which affects true incurs a fully correlated error on hadrons and electron energy with muon energy through this calibration procedure.
The of the other particles themselves does not matter at first order, because we don’t care how many cells their energy is distributed over. However, there are second order effects from Birk’s suppression and hit thresholds which additionally affect non-muons. In evaluating this, it is notable that the density effect parameterization error affects different particles in very different amounts. Nearly all protons are produced with energies well below where the difference in parameterizations is largest, about 7 GeV for protons. For electromagnetic showers, many ionizing electrons and positrons have energy near the maximum of the density effect uncertainty, but a detailed study would be needed to determine how important this energy range is overall.
All of the errors in the class that does not affect true are small. The details of hadronic modeling obviously affect the hadronic energy reconstruction in the opposite way as it affects muon energy reconstruction. Recall that the error assigned to the muon range is for the difference in overall CC event energy between data and MC. Underneath this is the fact that the reconstructed muon, on average, steals about one hit from the hadronic shower, so that in both data and MC, too much energy is assigned to the muon and too little to the hadronic system at the 2% level.
The Coulomb correction is relevant to any charged particle produced in a neutrino interaction. Of course, for hadrons, the details of (strong) final state interactions are much more uncertain, so the uncertainties surrounding the Coulomb correction may be negligible in comparison.
While a very low energy hit from neutron capture can extend a muon track by a whole plane or more, it only adds its very small energy to a particle with calorimetrically reconstructed energy. This makes pile-up less important for non-muons. This same reasoning applies to noise modeling, which is already a negligible effect for muons, and even less important for other particles.
Among the other errors that are negligible for muons, muon decay uncertainties affect and K+, since they decay to muons, but not to or K-, since they are captured by nuclei, nor to protons. Finally, uncertainties on multiple scattering and detector alignment are irrelevant for particles with calorimetrically measured energies.
References
- [1] S. Mufson et al. Liquid scintillator production for the NOvA experiment. Nucl. Instrum. Meth., A799:1–9, 2015.
- [2] D. S. Ayres et al. The NOvA technical design report. 2007.
- [3] The Engineering Toolbox. Coefficients of linear thermal expansion. http://www.engineeringtoolbox.com/linear-expansion-coefficients-d_95.html, Jun 2017.
- [4] Dillon Force Measurement Equipment. EDxtreme digital dynamometer. https://checkline.com/dynamometers/edxtreme, Jun 2017.
- [5] S. Dutch. Gravity anomalies. https://www.uwgb.edu/dutchs/STRUCTGE/GravAnom.HTM, Jan 2013. Available at wayback.archive.org.
- [6] Wikipedia contributors. Gravity of earth, revision 788274609, Jun 2017.
- [7] R. J. Tesarek, G. Gillespie, M. O’Boyle, B. Oshinowo, M. Roman, C. Wilson, and R. Wyatt. NOvA near detector muon catcher steel measurements. NOvA-doc-16937-v1, Feb 2017.
- [8] R. L. Talaga, J. J. Grudzinski, S. Phan-Budd, A. Pla-Dalmau, J. E. Fagan, C. Grozis, and K. M. Kephart. PVC extrusion development and production for the NOvA neutrino experiment. Nucl. Instrum. Methods A, 861:77 – 89, 2017.
- [9] C. Patrignani et al (Particle Data Group). Review of particle physics. Chin. Phys., C40(10):100001, 2016.
- [10] Geant4 Collaboration. Geant4 physics reference manual. Version 10.3, Dec 2016.
- [11] H. Bichsel. A method to improve tracking and particle identification in TPCs and silicon detectors. Nucl. Instrum. Meth., A562:154–197, 2006.
- [12] Stopping powers for electrons and positrons. 1984. ICRU Report No. 37.
- [13] P. H. Garbincius and L. G. Hyman. Range-energy relation in hydrogen. Phys. Rev. A, 2:1834–1838, Nov 1970.
- [14] C. J. Bakker and E. Segrè. Stopping power and energy loss for ion pair production for 340-Mev protons. Phys. Rev., 81:489–492, Feb 1951.
- [15] S. M. Seltzer and M. J. Berger. Evaluation of the collision stopping power of elements and compounds for electrons and positrons. The International Journal of Applied Radiation and Isotopes, 33(11):1189 – 1218, 1982.
- [16] S. M. Seltzer and M. J. Berger. Improved procedure for calculating the collision stopping power of elements and compounds for electrons and positrons. The International Journal of Applied Radiation and Isotopes, 35(7):665 – 676, 1984.
- [17] T. J. Thompson. Effect of chemical structure on stopping powers for high-energy protons. University of Berkeley Radiation Laboratory Report 1910, 1952.
- [18] D. E. Groom, N. V. Mokhov, and S. I. Striganov. Muon stopping power and range tables 10 MeV–100 TeV. Atomic Data and Nuclear Data Tables, 78(2):183 – 356, 2001.
- [19] R. M. Sternheimer. The density effect for ionization loss in materials. Phys. Rev., 88:851–859, 1952.
- [20] R. M. Sternheimer and R. F. Peierls. General expression for the density effect for the ionization loss of charged particles. Phys. Rev., B3:3681–3692, 1971.
- [21] R. M. Sternheimer, M. J. Berger, and S. M. Seltzer. Density effect for the ionization loss of charged particles in various substances. Atom. Data Nucl. Data Tabl., 30:261, 1984.
- [22] B. Gottschalk, A.M. Koehler, R.J. Schneider, J.M. Sisterson, and M.S. Wagner. Multiple Coulomb scattering of 160 MeV protons. Nucl. Instrum. Methods Phys. Res., Sect. B, 74(4):467 – 490, 1993.
- [23] R. L. Talaga, J. J. Grudzinski, S. Phan-Budd, A. Pla-Dalmau, J. E. Fagan, C. Grozis, and K. M. Kephart. PVC extrusion development and production for the NOvA neutrino experiment. Nucl. Instrum. Meth., A861:77–89, 2017.
- [24] Wikipedia contributors. Titanium dioxide, revision 847145526, Jun 2018.
- [25] R. Gran. Coulomb and binding energy effects in neutrino analyses. MINOS-doc-3172-v2, Sep 2011.
- [26] A. Aste, C. von Arx, and D. Trautmann. Coulomb distortion of relativistic electrons in the nuclear electrostatic field. Euro. Phys. J. A, 26(2):167–178, Nov 2005.
- [27] A. Bodek. Removal and binding energies in lepton nucleus scattering. arXiv:1801.07975, Jan 2018.
- [28] C. Andreopoulos et al. The GENIE Neutrino Monte Carlo Generator. Nucl. Instrum. Meth., A614:87–104, 2010.
- [29] C. L. McGivern et al. Cross sections for and induced pion production on hydrocarbon in the few-GeV region using MINERvA. Phys. Rev., D94(5):052005, 2016.
- [30] M. J. Berger et al. Stopping-power & range tables for electrons, protons, and helium ions (ESTAR, PSTAR, ASTAR). http://physics.nist.gov/Star, Aug 2005.