15-Jun-2018 \Accepted28-Jan-2019
galaxies: active, galaxies: infrared
Does AGN Fraction Depend on Redshift or Luminosity? An Extinction-Free Test by 18-band Mid-infrared SED Fitting in the AKARI NEP Wide Field
Abstract
Revealing what fraction of galaxies harbor AGN is central in understanding black hole accretion history of the Universe. However, optical and soft X-ray surveys miss the most highly obscured AGNs. Infrared (IR), instead, is more robust against absorption. Previous IR photometric surveys, however, only had 4 or 5 filters in mid-IR. Our AKARI North Ecliptic Pole (NEP) wide field sample has 18 filters in mid-IR (9 from AKARI, 4 from WISE, and 5 from Spitzer), for the first time, allowing a sophisticated mid-IR SED fitting diagnosis for a statistical number of sources (89178 over 5.4 deg2). By using a SED fitting technique, we investigate the evolution of AGN fraction as a function of redshift and IR (8-1000 m) luminosity in an extinction-free way. We found that the AGN fraction (FAGN) shows no sign of strong redshift evolution. Instead, FAGN increases with increasing IR luminosity in all redshifts bins ().
1 Introduction
Active Galactic Nuclei (AGNs) are powered by central accreting supermassive black holes, and cast impact on the environment via AGN feedback processes (Kauffmann & Haehnelt, 2000; Di Matteo et al., 2005; Fabian, 2012). It is essential to understand AGNs in order to probe cosmological evolution of supermassive black holes and the universe. In addition, AGN fraction is important when studying luminosity functions. Researchers have been investigating various surveys to study AGNs for decades. Although AGNs can be bright in a wide range of wavelengths, most surveys are severely biased towards unobscured (Type 1) AGNs. A large population of obscured (Type 2) AGNs are missed in optical and soft X-ray surveys due to obscuration caused by dust and gas. In this case, radio, hard X-ray, and mid-infrared (IR) selections are promising for detecting Type 2 AGNs. However, only 10% of AGNs are radio-loud, and current hard X-ray satellites (i.e. Swift BAT, NuSTAR, etc.) have limited sensitivity. It is difficult for radio and hard X-ray surveys to reach a large sample size to overcome cosmic variance. As warm dust emission dominates the mid-IR band (2-24 m), and mid-IR satellites provide sensitive full-sky surveys, mid-IR selection is an effective, nearly free of extinction way to identify AGNs. In past few years there has been numerous studies using mid-IR colors to find AGNs in the local universe and at high-redshift (Lacy et al., 2004, 2007; Stern et al., 2012).
As star-forming galaxies (SFGs) are bright in mid-IR bands as well, it has been of great challenge to distinguish SFGs and AGNs. In mid-IR, a SFG has polycyclic aromatic hydrocarbon (PAH) broad emission line features at 3.3, 6.2, 7.7, 8.6, 11.2, and 12.7 m (Puget et al., 1985; Allamandola et al., 1989), while an AGN presents a red power-law () spectrum with typical (Alonso-Herrero et al., 2006). Laurent et al. (2000) showed that the mid-IR Spectral Energy Distributions (SEDs) of SFGs and AGNs are distinct enough for separation, and some following work also confirmed that mid-IR photometry provides robust SFG-AGN diagnostics (Stern et al., 2005; Jarrett et al., 2011; Magdis et al., 2013). Survey data obtained by Spitzer infrared telescope and Wide field Infrared Survey Explorer (WISE) lead to an explosion of research to search and study AGNs (Lacy et al., 2004; Alonso-Herrero et al., 2006; Lacy et al., 2007, 2013, 2015; Eckart et al., 2010; Stern et al., 2005; Donley et al., 2012; Mateos et al., 2012; Stern et al., 2012; Assef et al., 2013). However, both WISE and Spitzer have limited available filters and gaps (between 12-22 m in WISE and 8-24 m in Spitzer) in the mid-IR wavelength range, which make SFG-AGN diagnostics difficult for sources at certain redshift ranges. PAH features of high redshift sources may fall into the wavelength gaps and make AGN selection difficult. For instance, the 8 to 24 m gap is important for the diagnosis of AGN and SFG at . The infrared satellite AKARI (Murakami et al., 2007) has 9-band mid-IR filters and does not suffer from the lack of continuous mid-IR data. The AKARI North Ecliptic Pole (NEP) survey covers a field of 5.4 deg2 and will remain the only survey with continuous mid-IR data until the James Webb Space Telescope (JWST) performs a similar one.
Huang et al. (2017) (hereafter H17) used the AKARI NEP deep survey (Matsuhara et al., 2006) covering a field of 0.57 deg2 catalogue (containing 5800 sources) to select AGNs using the SED fitting technique. By combining AKARI, WISE and Spitzer data with 18 bands in total and fitting 25 empirical models to the data, the authors recovered more X-ray detected AGNs than previous work by 20%. Previous research using WISE or Spitzer data performed SED fitting with limited models (Assef et al., 2008, 2010, 2013; Chung et al., 2014). Thanks to the continuous coverage of mid-IR band by AKARI, more detailed models can be used to help AGN selection at high redshift. In this work, we use the AKARI NEP wide field (covering 5.4 deg2) catalogue for AGN selection. We will provide detailed information of the catalogue and data analysis in section 2, and present results in section 3. We will discuss the results compared with other work in section 4, and summarize the paper in section 5.
2 Data Analysis
2.1 Data
We used the catalogue from the NEP wide field survey (Kim et al., 2012) of AKARI in this work. The survey was carried out on a circular area of 5.4 deg2 and is part of the large area survey programs of AKARI, which provides crucial FIR bands to measure SED accurately (Kim et al., 2015). The AKARI infrared camera (IRC; Onaka et al. (2007)) offers coverage from near to mid-infrared (2-24 m) wavelength bands. There are 9 filters (N2, N3, N4, S7, S9W, S11, L15, L18W, and L24) corresponding to 2.4, 3.2, 4.1, 7, 9, 11, 15, 18 and 24 m effective wavelength. The instrument detection limits are 11, 9, 10, 30, 34, 57, 87, 93, and 256 Jy in the above 9 bands, respectively. The detection limits of the NEP survey are 20.9, 21.1, 21.1, 19.5, 19.4, 19.0, 18.6, 18.7 and 17.8 in AB magnitude (Kim et al., 2012). In this catalogue data of 4 mid-IR bands from WISE (3.4, 4.6, 12 and 22 m) and 5 mid-IR bands from Spitzer (3.6, 4.5, 5.8, 8.0 and 24 m) are included, forming a sample with 18 mid-IR bands in total.
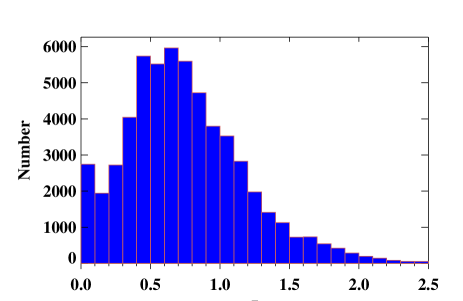
The AKARI NEP survey detected a large number of IR sources, yet H17 only used sources in the deep field, which is a small part of it due to limited optical/UV coverage by the Galaxy Evolution Explorer (GALEX) and the Canada France Hawaii Telescope (CFHT). An optical survey covering the AKARI NEP wide field using Subaru’s Hyper Suprime-Cam (HSC; Miyazaki et al. (2012)) has been carried out recently. The HSC coverage (Goto et al., 2017) increases the number of sources with optical data to 89178 in the catalogue, which is the largest sample to date. Photometric redshifts can be measured accurately from the data of the five HSC optical bands (, , , and ; Oi et al., submitted to this volume). Fig. 1 shows the redshift distribution of the sample. In this work we only focus on galaxies, and after excluding stars in the catalogue, there are 57106 galaxies remaining in the sample.
2.2 SED Fitting
We performed SED fitting using the Le PHARE 111http://www.cfht.hawaii.edu/arnouts/LEPHARE/lephare.html (Arnouts et al., 1999; Ilbert et al., 2006) code. The Lagache et al. (2003) template was used to measure infrared luminosities in the catalogue. As galaxy types were not given by the Lagache template, we used the Polletta et al. (2007) templates, which contains 3 elliptical (type number 1-3), 7 spiral (type number 4-10), 6 starburst (type number 11-16), 7 AGN (type number 17-22 and 25), and 2 AGN- Starburst composite (type number 23-24) models and is part of the Spitzer Wide-area Infrared Extragalatic (SWIRE) templates222http://www.iasf-milano.inaf.it/polletta/templates/swire_templates.html, to determine the spectral type of galaxies. Each type number represents a type of galaxy in the templates, and numbers 17-25 are of AGN SEDs (see also Table 1 in H17 for details). As photometric redshifts have been measured in the sample (Oi et al., submitted to this volume), we fixed redshifts with the ZFIX=YES setting when performing SED fitting using the Le PHARE code. The Calzetti extinction law (Calzetti et al., 2000) has been used in the fitting. As a result, Le PHARE found best-fitting models for 16464 sources in the sample via SED fitting. In the following we focus on the 16464 sources and hereafter refer it as “the SED sample”.
3 Results
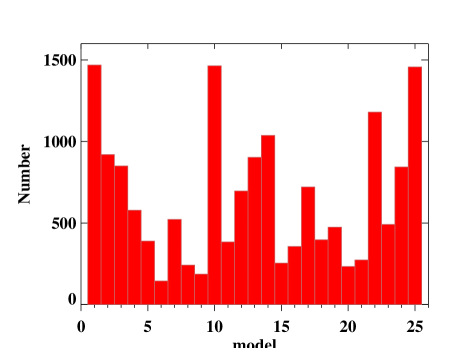
We plot the distribution of best-fitting models in Fig. 2. There are 6070 AGNs selected among the total 16464 galaxies, giving an overall AGN fraction of %, which is mildly higher than the number of % reported in H17 using the NEP deep field catalogue. Our sample size is 3.5 times larger than that used in H17. Surprisingly, a large number (3239 in total) of elliptical galaxies (type number 1-3) are detected as this class of galaxies are usually faint in the mid-IR. Type numbers 17-19 and 24-25 belong to Type 2 AGNs, and it seems mid-IR observations are good at selecting obscured AGNs as expected.
3.1 AGN Fraction as a Function of Redshift
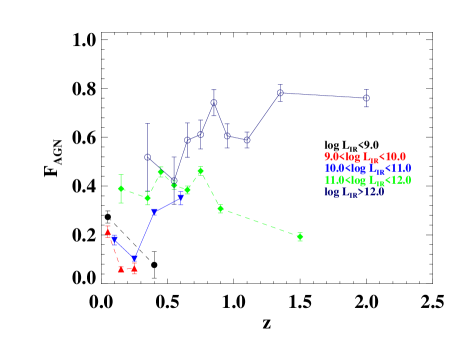
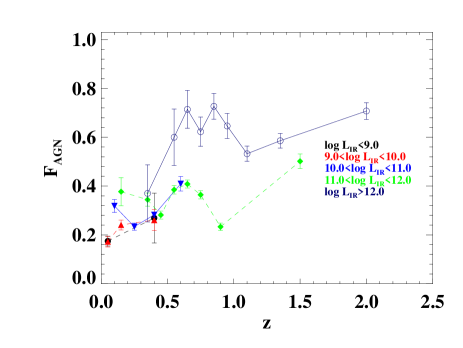
We separate the SED sample into a few luminosity bins and plot the evolution of AGN fraction as a function of photometric redshift (see Fig. 3). It is clearly seen that all luminosity bins show a relatively constant or decreasing trend at except the log bin. In the regime of , the log and log bins show an increasing trend, while the log bin displays a decreasing trend. Different luminosity bins show different behaviors, and from our results it seems that there may be no strong redshift dependence in AGN fraction evolution.
3.2 AGN Fraction as a Function of Luminosity
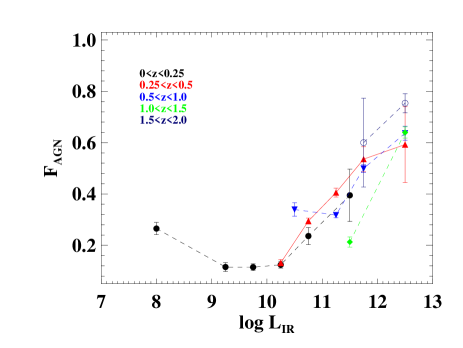
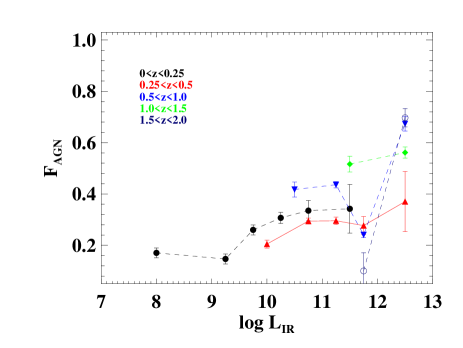
In order to check if AGN fraction has luminosity dependence, we divide the SED sample into a few groups of different redshift range, and plot the evolution of AGN fraction as a function of luminosity in Fig. 4. We find that all redshift bins show an increasing trend at log . Furthermore, all bins seem to reach similar values of AGN fraction, which again reveals that there is no significant redshift dependence. Instead, the result implies that there is more luminosity dependence than redshift dependence in AGN fraction. Note that most luminosity bins reach a fraction of 0.6 at high luminosities.
4 Discussion
4.1 AGN Fraction
We show that there is possible luminosity dependence in the evolution of AGN fraction, which is consistent with the result reported in previous literature. Goto (2005) investigated 4828 Infrared Astronomical Satellite (IRAS) galaxies and selected AGNs using the optical emission-line ratios, and found that the AGN fraction increases as a function of . Similar trends have been reported by Yuan et al. (2010), Kartaltepe et al. (2010), Goto et al. (2011), and Weigel et al. (2018) using various local samples. These results imply that luminous infrared galaxies (LIRGs; log ) and ultraluminous infrared galaxies (ULIRGs; log ) are more likely to be powered by AGNs. AGN fractions reported in previous literature also reach 0.6, which is consistent with the result of the present work. Note that previous research only used samples in the local () universe, and our work extends the study to trace behaviors of galaxies at higher redshifts and compares results between different branches of redshifts. We show that the luminosity dependence of AGN fraction may be global.
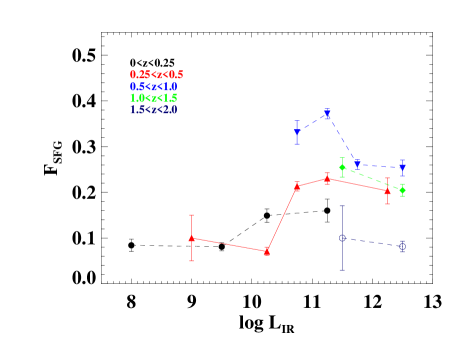
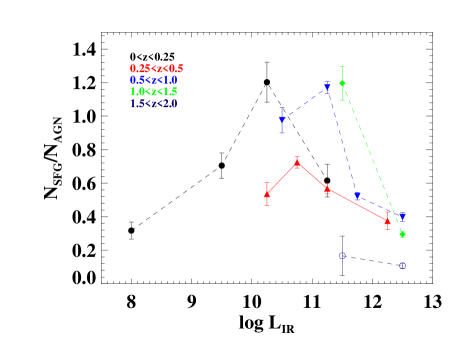
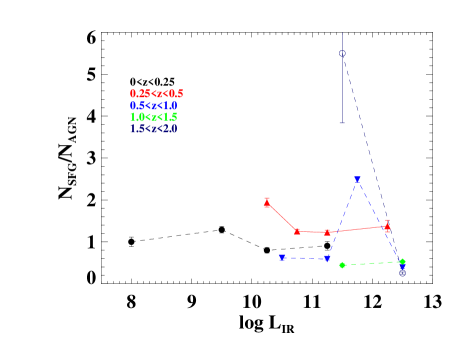
The reason that the AGN fraction is high among LIRGs can be explained by one of the merger scenarios for LIRGs (Sanders et al., 1988; Dasyra et al., 2006). When two galaxies merge, they lose orbital energy and angular momentum to tidal features and/or shocks, which trigger star formation (Kennicutt et al., 1987; Liu & Kennicutt, 1995; Barnes, 2004). These activities heat surrounding dust and produce strong far-infrared (FIR) radiation. It then reaches an ultralumious IR stage which is powered by starburst or AGNs. The merger finally evolves into an optically bright QSO when star formation activities decline. In this scenario AGNs dominate luminous IR sources during final merger stages. We plot the fraction of SFGs as a function of luminosity in the top panel of Fig. 5. It can be seen that fractions of SFGs of all redshift bins show mild decreasing trends at high . The lower panel of Fig. 5 shows the value of NSFG/NAGN, which is the number of SFGs over the number of AGNs, and the clear decreasing trends at high luminosities further supports the prediction of the theory.
4.2 Other SED Fitting Templates
H17 performed SED fitting of the NEP deep field sample using the templates provided by Brown et al. (2014) as well, and found that the results are consistent with those given by the Polletta’s template set. The Brown’s template set contains 100 models in total, and provides a set of 37 SFG, 11 AGN and 22 AGN-Starburst composite models which allow more detailed classifications. The LePHARE code determined types for 16417 sources in the catalogue, which is comparable to the number obtained using the Polletta’s template set and all of them are included in the SED sample. There are 5427 SFGs, 2083 AGNs and 3890 AGN-Starburst composites classified by the Brown’s template set. Note that 3097 galaxies are classified as elliptical galaxies, which is comparable with the large number of elliptical galaxies classified by the Polletta’s template set. Around 77 % of Polletta elliptical galaxies are also classified as elliptical galaxies by the Brown’s template set. Only 33 % of SFGs, AGNs and AGN-Starburst composites have the same classification in both Pollettas’s and Brown’s template sets. However, the overall AGN fraction (including AGNs and composites) is %, which is remarkably similar to the number obtained using the Polletta’s template set. It is not surprising that the Brown’s template set is capable of more detailed classification because there are a lot more models than those of the Polletta’s template set. Note that the Brown’s template set does not determine types for more galaxies than the Polletta’s template set, indicating that both template sets perform similarly on the AKARI survey data. Given that not all sources in the SED sample are detected by every of the 18 mid-IR band, increasing models of SED fitting does not necessarily lead to more information. In this sense, results obtained using different templates should not differ significantly and the Polletta’s template set remains reliable in our sample. Future development is expected when JWST data are available.
Fig. 6 shows results obtained using the Brown’s template set. It can be seen that the AGN fraction still shows no significant redshift dependence. The luminosity dependence is not as strong as that showed in the Polletta results, but most bins do show significant increase at high luminosities.
5 Conclusions
We used the unique AKARI NEP wide field survey sample with 18 mid-IR bands of data to perform SED fitting and select AGNs. Our results indicate that AGN fraction seems to show stronger luminosity dependence than redshift dependence. This is consistent with results reported in previous literature and the theoretical model of ULIRGs. We also examined the fractions of SFGs and found mild decreasing trends at high luminosities, which is in agreement with theoretical predictions. The major improvement from previous research is that our sample contains both local and high-redshift galaxies, the other work only used local samples. Although further improvement is expected with the coming launch of JWST, AKARI NEP survey will remain the best sample to study luminosity function, AGN fractions, etc., in decades.
Acknowledgements
We acknowledge the support by the Ministry of Science and Technology (MoST) of Taiwan through grant105-2112-M-007-003-MY3. CYC thanks the support by the MoST Leaders in Future Trends (LiFT) program.
References
- Allamandola et al. (1989) Allamandola, L. J., Tielens, A. G. G. M., & Barker, J. R. 1989, ApJS, 71, 733
- Alonso-Herrero et al. (2006) Alonso-Herrero, A., Pérez-González, P. G., Alexander, D. M., et al. 2006, ApJ, 640, 167
- Arnouts et al. (1999) Arnouts, S., Cristiani, S., Moscardini, L., et al. 1999, MNRAS, 310, 540
- Assef et al. (2008) Assef, R. J., Kochanek, C. S., Brodwin, M., et al. 2008, ApJ, 676, 286
- Assef et al. (2010) —. 2010, ApJ, 713, 970
- Assef et al. (2013) Assef, R. J., Stern, D., Kochanek, C. S., et al. 2013, ApJ, 772, 26
- Barnes (2004) Barnes, J. E. 2004, MNRAS, 350, 798
- Brown et al. (2014) Brown, M. J. I., Moustakas, J., Smith, J.-D. T., et al. 2014, ApJS, 212, 18
- Calzetti et al. (2000) Calzetti, D., Armus, L., Bohlin, R. C., et al. 2000, ApJ, 533, 682
- Chung et al. (2014) Chung, S. M., Kochanek, C. S., Assef, R., et al. 2014, ApJ, 790, 54
- Dasyra et al. (2006) Dasyra, K. M., Tacconi, L. J., Davies, R. I., et al. 2006, ApJ, 651, 835
- Di Matteo et al. (2005) Di Matteo, T., Springel, V., & Hernquist, L. 2005, Nature, 433, 604
- Donley et al. (2012) Donley, J. L., Koekemoer, A. M., Brusa, M., et al. 2012, ApJ, 748, 142
- Eckart et al. (2010) Eckart, M. E., McGreer, I. D., Stern, D., Harrison, F. A., & Helfand, D. J. 2010, ApJ, 708, 584
- Fabian (2012) Fabian, A. C. 2012, ARA&A, 50, 455
- Goto (2005) Goto, T. 2005, MNRAS, 360, 322
- Goto et al. (2011) Goto, T., Arnouts, S., Malkan, M., et al. 2011, MNRAS, 414, 1903
- Goto et al. (2017) Goto, T., Toba, Y., Utsumi, Y., et al. 2017, Publication of Korean Astronomical Society, 32, 225
- Huang et al. (2017) Huang, T.-C., Goto, T., Hashimoto, T., Oi, N., & Matsuhara, H. 2017, MNRAS, 471, 4239
- Ilbert et al. (2006) Ilbert, O., Arnouts, S., McCracken, H. J., et al. 2006, A&A, 457, 841
- Jarrett et al. (2011) Jarrett, T. H., Cohen, M., Masci, F., et al. 2011, ApJ, 735, 112
- Kartaltepe et al. (2010) Kartaltepe, J. S., Sanders, D. B., Le Floc’h, E., et al. 2010, ApJ, 709, 572
- Kauffmann & Haehnelt (2000) Kauffmann, G., & Haehnelt, M. 2000, MNRAS, 311, 576
- Kennicutt et al. (1987) Kennicutt, Jr., R. C., Keel, W. C., van der Hulst, J. M., Hummel, E., & Roettiger, K. A. 1987, AJ, 93, 1011
- Kim et al. (2012) Kim, S. J., Lee, H. M., Matsuhara, H., et al. 2012, A&A, 548, A29
- Kim et al. (2015) Kim, S. J., Lee, H. M., Jeong, W.-S., et al. 2015, MNRAS, 454, 1573
- Lacy et al. (2007) Lacy, M., Petric, A. O., Sajina, A., et al. 2007, AJ, 133, 186
- Lacy et al. (2015) Lacy, M., Ridgway, S. E., Sajina, A., et al. 2015, ApJ, 802, 102
- Lacy et al. (2004) Lacy, M., Storrie-Lombardi, L. J., Sajina, A., et al. 2004, ApJS, 154, 166
- Lacy et al. (2013) Lacy, M., Ridgway, S. E., Gates, E. L., et al. 2013, ApJS, 208, 24
- Lagache et al. (2003) Lagache, G., Dole, H., & Puget, J.-L. 2003, MNRAS, 338, 555
- Laurent et al. (2000) Laurent, O., Mirabel, I. F., Charmandaris, V., et al. 2000, A&A, 359, 887
- Liu & Kennicutt (1995) Liu, C. T., & Kennicutt, Jr., R. C. 1995, ApJ, 450, 547
- Magdis et al. (2013) Magdis, G. E., Rigopoulou, D., Helou, G., et al. 2013, A&A, 558, A136
- Mateos et al. (2012) Mateos, S., Alonso-Herrero, A., Carrera, F. J., et al. 2012, MNRAS, 426, 3271
- Matsuhara et al. (2006) Matsuhara, H., Wada, T., Matsuura, S., et al. 2006, PASJ, 58, 673
- Miyazaki et al. (2012) Miyazaki, S., Komiyama, Y., Nakaya, H., et al. 2012, in Proc. SPIE, Vol. 8446, Ground-based and Airborne Instrumentation for Astronomy IV, 84460Z
- Murakami et al. (2007) Murakami, H., Baba, H., Barthel, P., et al. 2007, PASJ, 59, S369
- Onaka et al. (2007) Onaka, T., Matsuhara, H., Wada, T., et al. 2007, PASJ, 59, S401
- Polletta et al. (2007) Polletta, M., Tajer, M., Maraschi, L., et al. 2007, ApJ, 663, 81
- Puget et al. (1985) Puget, J. L., Leger, A., & Boulanger, F. 1985, A&A, 142, L19
- Sanders et al. (1988) Sanders, D. B., Soifer, B. T., Elias, J. H., Neugebauer, G., & Matthews, K. 1988, ApJ, 328, L35
- Stern et al. (2005) Stern, D., Eisenhardt, P., Gorjian, V., et al. 2005, ApJ, 631, 163
- Stern et al. (2012) Stern, D., Assef, R. J., Benford, D. J., et al. 2012, ApJ, 753, 30
- Weigel et al. (2018) Weigel, A. K., Schawinski, K., Treister, E., Trakhtenbrot, B., & Sanders, D. B. 2018, MNRAS, 476, 2308
- Yuan et al. (2010) Yuan, T.-T., Kewley, L. J., & Sanders, D. B. 2010, ApJ, 709, 884