In situ control of diamagnetism by electric current in Ca3(Ru1-xTix)2O7
Abstract
Non-equilibrium steady state (NESS) conditions induced by DC current can alter the physical properties of strongly correlated electron systems (SCES). In this regard, it was recently shown that DC current can trigger novel electronic states, such as current-induced diamagnetism, which cannot be realized in equilibrium conditions. However, reversible control of diamagnetism has not been achieved yet. Here, we demonstrate reversible in situ control between a Mott insulating state and a diamagnetic semimetal-like state by DC current in the Ti-substituted bilayer ruthenate Ca3(Ru1-xTix)2O7 (). By performing simultaneous magnetic and resistive measurements, we map out the temperature vs current-density phase diagram in the NESS of this material. The present results open up the possibility of creating novel electronic states in a variety of SCES under DC current.
After the discovery of high superconductivity Bednorz and Müller (1986), an intensive amount of research has been performed on strongly correlated electron systems (SCES) in the vicinity of the Mott insulating state. A multitude of quantum phenomena have been found in these materials including metal–insulator transitions, ferromagnetism, and unconventional superconductivity Tokura (2014); Keimer et al. (2015); Nakatsuji and Maeno (2000). In these studies, Mott insulating states have been controlled using various equilibrium parameters such as external pressure, chemical composition, epitaxial strain, electric field, and magnetic field Alireza et al. (2010); Imada et al. (1998); Yang et al. (2011); Nakamura et al. (2013); Kuwahara et al. (1995). More recently, various nonequilibrium stimuli have been actively investigated Ju et al. (2014); Chong et al. (2017); Guiot et al. (2013); Aoki et al. (2014); Cao et al. (2018). Such nonequilibrium stimuli can drive SCES into exotic states that are not accessible by other means. A striking example is the insurgence of giant diamagnetism in the Mott insulator Ca2RuO4 upon the application of a DC current of a few mA Sow et al. (2017). However, in Ca2RuO4 it is not possible to perform in situ control of magnetism because of its high electrical resistivity. Thus it is essential to search for a new class of materials which allows us to switch in situ electronic and magnetic states as well as to investigate detailed evolution of the material properties under current. Such materials provide unique opportunity to study SCES under nonequilibrium steady state (NESS) conditions and to construct the nonequilibrium phase diagram towards clarifying the origin of the NESS-induced phenomena.
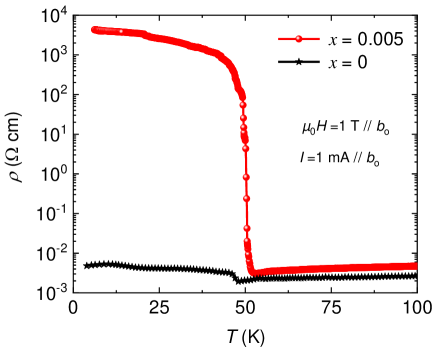
An interesting candidate to achieve this goal is the bi-layered ruthenate Ca3(Ru1-xTix)2O7, for which a Mott metal-insulator transition can be sensitively controlled by tiny Ti substitution Cao et al. (1997); Kikugawa et al. (2010); Ke et al. (2011); Tsuda et al. (2013). Pure Ca3Ru2O7, in fact, has a metallic and antiferromagnetic ground state which changes to an insulating state upon only 0.5% substitution of Ru4+ with nonmagnetic Ti4+ Kikugawa et al. (2010). This leads to an increase of the resistivity up to 8 orders of magnitude below TMIT = 50 K Kikugawa et al. (2010); Tsuda et al. (2013); Ke et al. (2011); Zhu et al. (2016). Hard X-ray photo-emission spectroscopy revealed that Ti substitution induces the opening of a Mott-like gap below TMIT. However, unlike conventional Mott insulators, the resistivity below TMIT presents a weak temperature dependence Tsuda et al. (2013), suggesting a competition between disorder effects and Mott physics in the framework of Mott-Anderson transition Shinaoka and Imada (2010). These considerations along with relatively low resistivity at low temperature make Ca3(Ru1-xTix)2O7 an ideal system to explore the possibility of inducing NESS effects in situ.
In this letter, we report the discovery of current-induced diamagnetism in Ca3(Ru1-xTix)2O7 () by performing simultaneous measurements of electrical resistivity and magnetization under DC electric current. Our results demonstrate in situ control of diamagnetism and open up new possibilities for controlling SCES under NESS conditions.
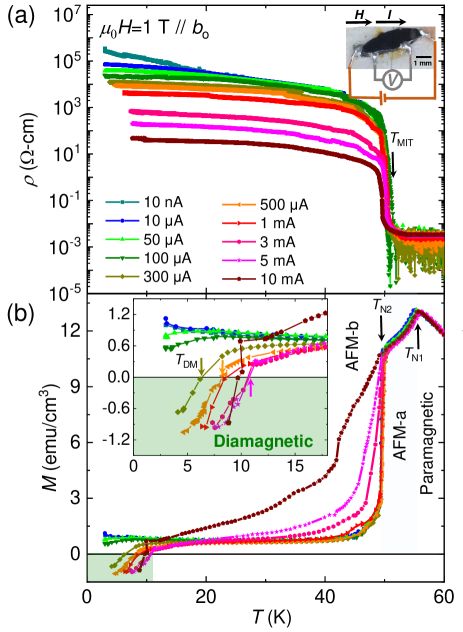
Single crystals of Ca3(Ru1-xTix)2O7 (x =0.5%) were grown by a floating-zone method using an infrared image furnace (Canon Machinery, model SC-K15HD) in Kyoto University. We added extra RuO2 both as self-flux and as compensation for RuO2 evaporation Mao et al. (2000); Perry and Maeno (2004); Zhou et al. (2005); Kikugawa et al. (2015). In this study, the starting materials CaCO3 (99.999%), RuO2 (99.9%), and TiO2 (99.99%) were mixed in the molar ratio of 3 : () : . The feed rod (typical dimensions of 8 cm in length and 5 mm in diameter) was prepared by hydrostatic compression followed by sintering at 1000∘C in air for 2 hours. Single crystals were grown at a typical speed of 7 mm/h in a gas mixture of 90% Ar and 10% O2 at a total pressure of 10 atm. Electron probe microanalysis (EPMA) with a commercial apparatus (JEOL, JXA 8500F) at NIMS revealed a homogeneous distribution of Ti in the grown crystals, with concentrations in good agreement with the nominal ones. The inset of Fig. 1(a) shows a photo of a typical crystal (Sample #1) with four electrical contacts. Most of the data in this Letter was taken on this sample otherwise explicitly mensioned. A Laue pattern of this crystal is presented in the Supplementary Material SM .
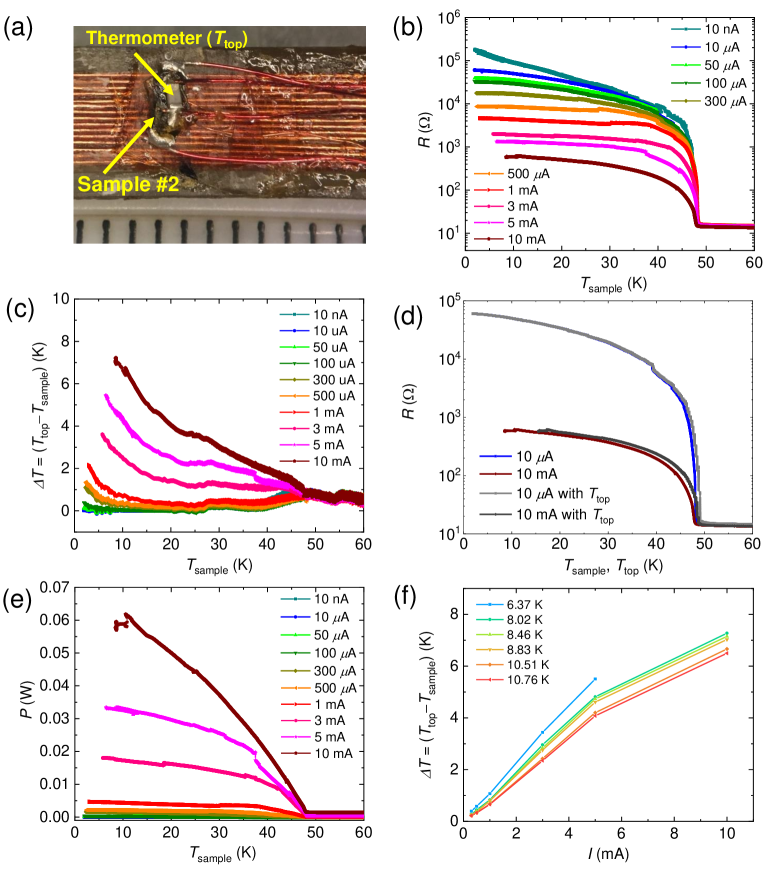
We designed a sample holder compatible with a commercial SQUID magnetometer (Quantum Design, MPMS XL) for simultaneous measurements of transport and magnetic properties under DC current. The details of the design can be found in the Supplemental Material of Ref. Sow et al. (2017). We placed a bare-chip thermometer (Lake Shore, Cernox, CX-1050-BC-HT) close to the sample to monitor its temperature (Lake Shore, 335). The transport measurements were carried out with a current source (Keithley, 6221) and a nano-volt meter (Keithley, 2182) in a four-probe configuration. We used silver-epoxy (Epoxy Technology, EPO-TEK H20E) cured at 100∘C to provide electrical contacts with thin copper wires.
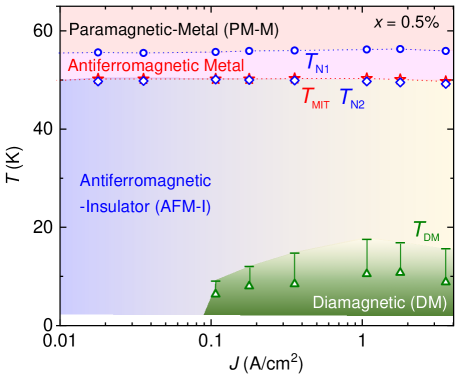
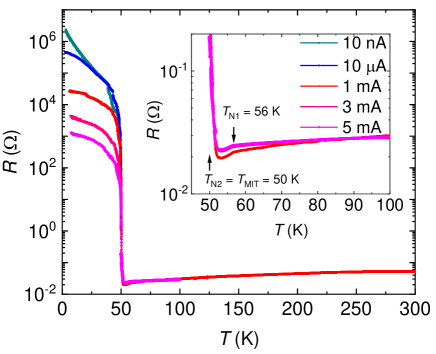
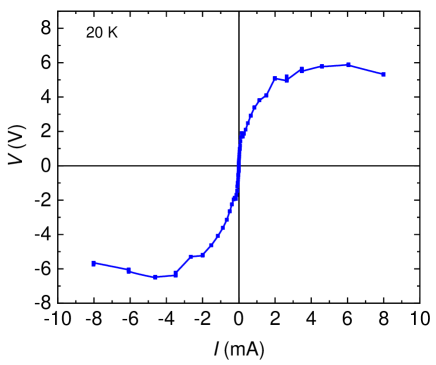
Figure 1 presents results of simultaneous measurements of resistivity and magnetisation under various DC currents. We used an external field T applied along the orthorhombic crystallographic axis and parallel to the current direction. As shown in Fig. 1(a), the resistivity above is metallic with a value of the order of in agreement with the previous report Tsuda et al. (2013). Below TMIT , the resistivity shows a sharp step-like increase, reaching a value of at and A. This value is 8 orders of magnitude higher than that in the high-temperature metallic phase. With increasing DC current, the resistivity in the metallic phase shows negligible variation (see also Fig. S2a). However, a large change occurs in the insulating phase, where the resistivity is gradually reduced with increasing current, becoming almost 4 orders of magnitude smaller at and 10 mA. Correspondingly, the current-voltage characteristic in this insulating state is highly non-linear, as shown in Fig. S4. We note that the resistivity curves show a shift of up to 2 K around TMIT, which is probably extrinsic considering possible Joule heating and slight variations in the sample cooling (further details in Fig. S3). The magnetization curves in Fig. 1(b) lie on top of each other in the high temperature region and show a peak at the Neel temperature TN1 =56 K, corresponding to the onset of the antiferromagnetic AFM- phase. The magnetization exhibits a sharp decrease at TN2 =50 K corresponding to the onset of the AFM- phase Peng et al. (2013). We note that the AFM- order and the metal-to-insulator transition occur at the same temperature (TN2 = TMIT = 50 K) and are accompanied by a structural transition with reduction in the c axis Yoshida et al. (2005). The increase in the magnetization with DC current below TN2 is attributable to a decrease in the stiffness Cullity and Graham (2011) of the magnetic structure.
The most interesting change is observed upon further cooling: becomes negative below the crossover temperature TDM for applied current above A indicating the appearance of a novel diamagnetic state. As the current is increased, the crossover temperature increases as shown in the inset of Fig. 1(b).
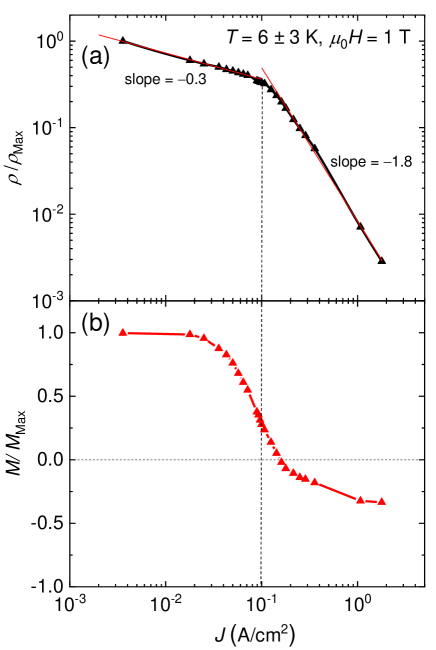
We use the measured transition temperatures to construct the – phase diagram for the various magnetic phases as a function of current density in Fig. 2. The diamagnetic phase appears in the region above and below 10 K, where we used the geometric conversion relation (mA) as deduced from the sample cross section. Importantly, the emerging diamagnetic state in Ca3(Ru1-xTix)2O7 coexists with the AFM order. This is evidenced by the presence of the sharp transition at TN2 in Fig. 1(b) for all the explored values of DC current. It is interesting to compare the current-induced diamagnetism of Ca3(Ru1-xTix)2O7 with what is observed in Ca2RuO4. In the case of Ca2RuO4, the AFM order is completely suppressed with current when the diamagnetism emerges Sow et al. (2017); Bertinshaw et al. (2018). Thus, the coexistence of diamagnetism with AFM order is a characteristic feature of Ca3(Ru1-xTix)2O7. As another important difference from Ca2RuO4, the lower resistivity of Ca3(Ru1-xTix)2O7 allows us to access the full – phase diagram and perform detailed investigations of current-induced phenomena. By measuring the magnetization as a function of current density at 6 K (Fig. S6), we find out that the emergence of diamagnetism is a crossover rather than a phase transition. The resistivity also shows a continuous decrease as a function of current, but its slope changes at about 0.1 , a possible signature of a structural and/or electronic change which is beyond the scope of the present work. The temperature dependence of the resistivity is rather continuous at TDM, indicating again the absence of a phase transition in the diamagnetic state.
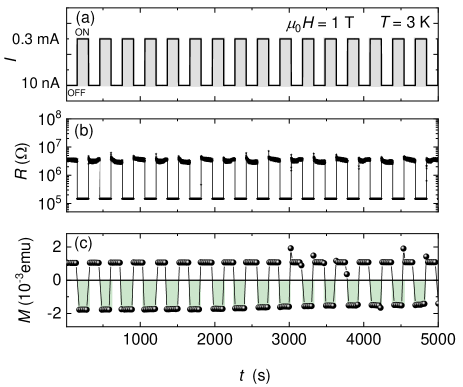
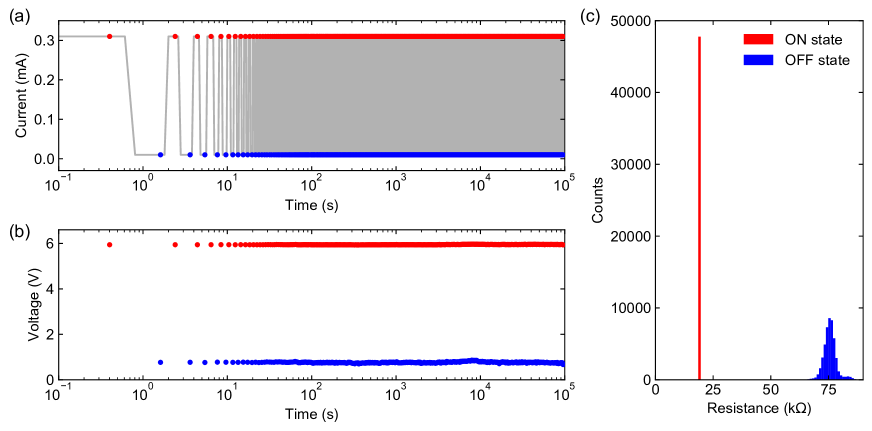
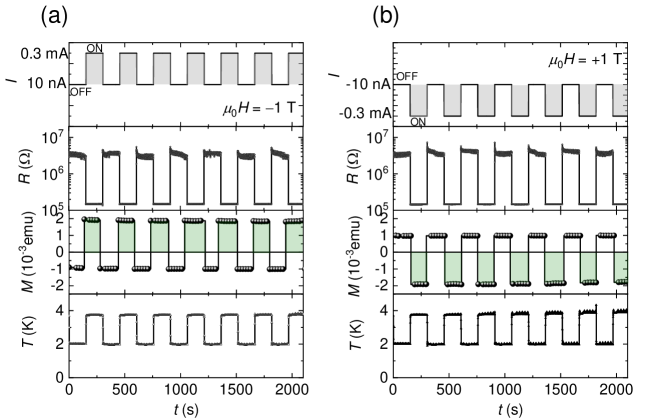
We now demonstrate that reversible control of resistance and magnetization can be achieved by changing the applied DC current. As shown in Fig. 3(a), we alternate the DC current between an OFF state (10 nA) and an ON state (300 A) while simultaneously measuring the resistance (Fig. 3(b)) and the magnetization (Fig. 3(c)) with a constant applied magnetic field T. The magnetization changes between positive and negative as the current is cycled between the OFF and ON states. This is, to the best of our knowledge, the first demonstration of reversible in situ control of diamagnetism by DC current. The resistance concomitantly changes from a high- to a low-resistance state. We demonstrated that such alternation between the states is reproducible over more than repetition cycles below 10 K (Fig. S8 (a-c)). This suggests that the occurrence of diamagnetism has mainly electronic origins, and possible slower and irreversible processes, such as chemical reaction or oxygen diffusion, play a negligible role. By repeating similar experiments with a reversed magnetic field of T (Fig. S9(a)) or with reversed current of mA (Fig. S9(b)), we confirmed that the diamagnetism occurs only in the current ON state irrespective of the current direction. This fact clarifies that the magnetic field created by the applied current via Ampere’s law is not the origin of the observed negative magnetization phenomenon. We also note that the direction of current has no effect on the value of the resistance (Fig. S9), as also shown in the symmetric characteristics (Fig. S4). Concerning the time scale of the switching, we found that the resistive change occurs faster than 0.1 s and magnetic change faster than 20 s, which is limited by the slow repetition rate of our SQUID measurements. Further experiments with much shorter data acquisition rate are needed to reveal the dynamics of this change on faster time scales.
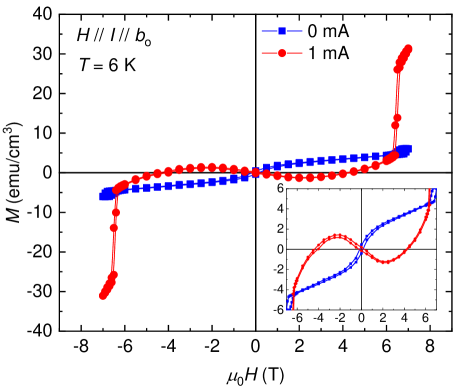
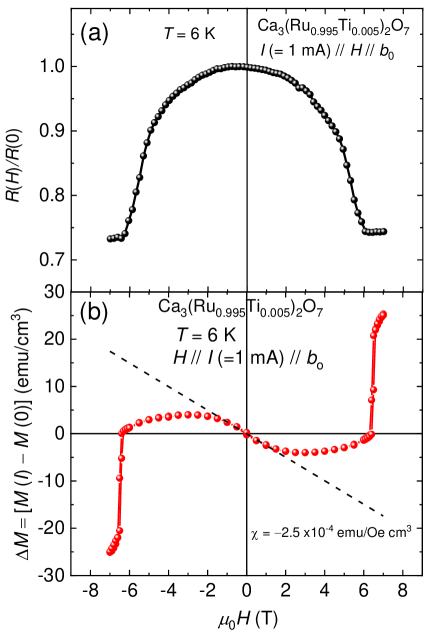
We now compare the field dependence of the magnetization with and without current. For this measurement both and are applied parallel to the axis. As shown in Fig. 4, for the magnetization exhibits a positive slope at all fields. The presence of a weak hysteresis and a change in the slope at 1 T are consistent with the presence of canted moments in the AFM- phase Peng et al. (2013). For , has a negative slope up to 2 T, indicating negative magnetic susceptibility, characteristic of a diamagnetic state. We comment that this is essentially different from negative magnetization arising from other origins, such as current-induced flipping of magnetization reported in the ferrimagnet YVO3 Ren et al. (1998) or magneto-electric effects in multiferroics Eerenstein et al. (2006). With further increase of the magnetic field, the magnetization slope changes to positive for T, after which also becomes positive. At 6.5 T the magnetization suddenly jumps by a factor of 7, indicating the occurrence of a metamagnetic transition, where the AFM- ordered phase changes into a field-induced ferromagnetic state Ohmichi et al. (2004); Peng et al. (2016). As an effect of this transition, the resistance exhibits a flattening around 6.5 T (Fig. S7(a)). The existence of the metamagnetic transition provides an additional piece of evidence that the AFM- order persists under current. We note that the metamagnetic transition without current was not observed in our sample up to 7 T. Thus the electric current promotes the metamagnetic transition, consistent with the reduction in the magnetic stiffness discussed above.
Because of the coexistence of diamagnetism and AFM-, the magnetization signal contains both contributions. We attempt to isolate the diamagnetic contribution, which appears only under current, by evaluating as a function of (Fig. S7(b)). The actual diamagnetic contribution would be greater because the AFM contribution depends somewhat on due to weakening of the magnetic stiffness even at 6 K. We find emu/ up to 1 T, a value comparable to that in Ca2RuO4 under current and larger than those in the strong diamagnets bismuth or graphite Sow et al. (2017).
In the rest of this Letter, we discuss the possible origin of the current-induced diamagnetism in Ca3(Ru1-xTix)2O7. In its sister compound Ca2RuO4, similar current-induced diamagnetism has been observed and attributed to the Landau diamagnetism of light-mass quasiparticles generated by the partial Mott gap closing Sow et al. (2017). Ca2RuO4 is a Mott insulator where is fully occupied due to the flattening of the RuO6 octahedra, and the and are half filled and exhibit the opening of a Mott-gap. Under DC current, it is experimentally known that the Mott gap is reduced, possibly originating from the reduction of the effective electron correlation Okazaki et al. (2013). When is reduced, it is proposed that the Mott gap first closes where the electronic state has a strong 2D character due to / hybridization. This strongly -dependent gap closing results in highly dispersive (light mass) quasiparticles, which leads to strong diamagnetism.
The ground state of pure Ca3Ru2O7 has a metallic character with a possible small gap in some parts of the Fermi surface Kikugawa et al. (2010); Yoshida et al. (2004). ARPES results indicate that the Fermi surface originates from quasi-1D and bands Baumberger et al. (2006). By Ti substitution, Ca3(Ru1-xTix)2O7 becomes Mott insulating with gap opening in the whole Fermi surface Tsuda et al. (2013). Upon application of a DC current we expect the effective correlation to be weakened and hence the Mott gap to be reduced similarly to Ca2RuO4 Okazaki et al. (2013). This picture is corroborated by the observed reduction of the resistivity shown in Fig. 1(a). In this picture, the strong diamagnetism in Ca3(Ru1-xTix)2O7 is ascribable to thermally excited quasiparticles with very light effective mass emerging when the Mott gap is about to close.
Important novel aspects are found in the diamagnetic state of Ca3(Ru1-xTix)2O7. Firstly, the current-induced diamagnetism occurs in a insulating state with much lower resistivity compared to Ca2RuO4. Secondly, diamagnetism in Ca3(Ru1-xTix)2O7 coexists with the AFM ordering. This important difference may originate from the difference in the nearest-neighbor spin alignment: it is ferromagnetic within a Ru-O bilayer in Ca3(Ru1-xTix)2O7 whereas it is G-type AFM in Ca2RuO4 Yoshida et al. (2005). These differences should be taken into account when constructing a realistic model to describe the diamagnetism in Ca3(Ru1-xTix)2O7. In particular, possible interaction between the itinerant diamagnetism and localized AFM is an interesting issue to be explored. It is intriguing that current-induced diamagnetism is discovered in systems with different transport and magnetic characteristics, implying that it may arise in other SCES under the NESS condition.
To summarize, we demonstrated that the insulating state of Ca3(Ru1-xTix)2O7 system can be electronically controlled by flowing electric current. Most importantly, the antiferromagnetic insulating state can be reversibly changed in situ to a diamagnetic state with a lower resistivity. The basic origin of the diamagnetism in Ca3(Ru1-xTix)2O7 is believed to be caused by the light-mass carriers generated in the NESS. The present work reveals that DC current is a new control tool to control the physical properties of a variety of SCES, with the possibility of inducing novel states which are not accessible by conventional control parameters.
This work was supported by JSPS Grant-in-Aids KAKENHI Nos. JP26247060, JP15H05852, JP15K21717, and JP17H06136, as well as JSPS Core-to-Core program). N. K. and S. U. acknowledge the support from JST-Mirai Program (No. JPMJMI18A3) in Japan. We acknowledge fruitful discussions with Takashi Oka, Sota Kitamura, Kazuhiko Kuroki, Teppei Yoshida and Masatoshi Imada.
References
- Bednorz and Müller (1986) J. G. Bednorz and K. A. Müller, Z. Phys. B 64, 189 (1986).
- Tokura (2014) Y. Tokura, Colossal magnetoresistive oxides (CRC Press, 2014).
- Keimer et al. (2015) B. Keimer, S. A. Kivelson, M. R. Norman, S. Uchida, and J. Zaanen, Nature 518, 179 (2015).
- Nakatsuji and Maeno (2000) S. Nakatsuji and Y. Maeno, Phys. Rev. Lett. 84, 2666 (2000).
- Alireza et al. (2010) P. L. Alireza, F. Nakamura, S. K. Goh, Y. Maeno, S. Nakatsuji, Y. T. C. Ko, M. Sutherland, S. Julian, and G. G. Lonzarich, J. Phys.: Condens. Matter 22, 052202 (2010).
- Imada et al. (1998) M. Imada, A. Fujimori, and Y. Tokura, Rev. Mod. Phys. 70, 1039 (1998).
- Yang et al. (2011) Z. Yang, C. Ko, and S. Ramanathan, Ann. Rev. Mater. Res. 41, 337 (2011).
- Nakamura et al. (2013) F. Nakamura, M. Sakaki, Y. Yamanaka, S. Tamaru, T. Suzuki, and Y. Maeno, Sci. Rep. 3, 2536 (2013).
- Kuwahara et al. (1995) H. Kuwahara, Y. Tomioka, A. Asamitsu, Y. Moritomo, and Y. Tokura, Science 270, 961 (1995).
- Ju et al. (2014) L. Ju, J. Velasco Jr, E. Huang, S. Kahn, C. Nosiglia, H.-Z. Tsai, W. Yang, T. Taniguchi, K. Watanabe, Y. Zhang, et al., Nature Nanotech. 9, 348 (2014).
- Chong et al. (2017) K. O. Chong, J.-R. Kim, J. Kim, S. Yoon, S. Kang, and K. An, arXiv preprint arXiv:1712.04757 (2017).
- Guiot et al. (2013) V. Guiot, L. Cario, E. Janod, B. Corraze, V. T. Phuoc, M. Rozenberg, P. Stoliar, T. Cren, and D. Roditchev, Nature Comm. 4, 1722 (2013).
- Aoki et al. (2014) H. Aoki, N. Tsuji, M. Eckstein, M. Kollar, T. Oka, and P. Werner, Rev. Mod. Phys. 86, 779 (2014).
- Cao et al. (2018) G. Cao, J. Terzic, H. Zhao, H. Zheng, L. De Long, and P. S. Riseborough, Phys. Rev. Lett. 120, 017201 (2018).
- Sow et al. (2017) C. Sow, S. Yonezawa, S. Kitamura, T. Oka, K. Kuroki, F. Nakamura, and Y. Maeno, Science 358, 1084 (2017).
- Cao et al. (1997) G. Cao, S. McCall, J. Crow, and R. Guertin, Phys. Rev. Lett. 78, 1751 (1997).
- Kikugawa et al. (2010) N. Kikugawa, A. W. Rost, C. W. Hicks, A. J. Schofield, and A. P. Mackenzie, J. Phys. Soc. Jpn. 79, 024704 (2010).
- Ke et al. (2011) X. Ke, J. Peng, D. Singh, T. Hong, W. Tian, C. D. Cruz, and Z. Mao, Phys. Rev. B 84, 201102 (2011).
- Tsuda et al. (2013) S. Tsuda, N. Kikugawa, K. Sugii, S. Uji, S. Ueda, M. Nishio, and Y. Maeno, Phys. Rev. B 87, 241107 (2013).
- Zhu et al. (2016) M. Zhu, J. Peng, T. Zou, K. Prokes, S. Mahanti, T. Hong, Z. Mao, G. Liu, and X. Ke, Phys. Rev. Lett. 116, 216401 (2016).
- Shinaoka and Imada (2010) H. Shinaoka and M. Imada, J. Phys. Soc. Jpn. 79, 113703 (2010).
- Mao et al. (2000) Z. Mao, Y. Maeno, and H. Fukazawa, Mater. Res. Bull. 35, 1813 (2000).
- Perry and Maeno (2004) R. Perry and Y. Maeno, J. Cryst. Growth 271, 134 (2004).
- Zhou et al. (2005) M. Zhou, J. Hooper, D. Fobes, Z. Mao, V. Golub, and C. Oconnor, Mater. Res. Bull. 40, 942 (2005).
- Kikugawa et al. (2015) N. Kikugawa, R. Baumbach, J. S. Brooks, T. Terashima, S. Uji, and Y. Maeno, Cryst. Growth Des. 15, 5573 (2015).
- (26) See Supplemental Material.
- Peng et al. (2013) J. Peng, X. Ke, G. Wang, J. Ortmann, D. Fobes, T. Hong, W. Tian, X. Wu, and Z. Mao, Phys. Rev. B 87, 085125 (2013).
- Yoshida et al. (2005) Y. Yoshida, S.-I. Ikeda, H. Matsuhata, N. Shirakawa, C. Lee, and S. Katano, Phys. Rev. B 72, 054412 (2005).
- Cullity and Graham (2011) B. D. Cullity and C. D. Graham, Introduction to magnetic materials (John Wiley & Sons, 2011).
- Bertinshaw et al. (2018) J. Bertinshaw, N. Gurung, P. Jorba, H. Liu, M. Krautloher, A. Jain, G. Ryu, O. Fabelo, G. Khaliullin, C. Pfleiderer, et al., arXiv preprint arXiv:1806.06455 (2018).
- Ren et al. (1998) Y. Ren, T. T. M. Palstra, D. I. Khomskii, E. Pellegrin, A. A. Nugroho, A. A. Menovsky, and G. A. Sawatzky, Nature 396, 441 (1998).
- Eerenstein et al. (2006) W. Eerenstein, N. Mathur, and J. F. Scott, Nature 442, 759 (2006).
- Ohmichi et al. (2004) E. Ohmichi, Y. Yoshida, S. Ikeda, N. Shirakawa, and T. Osada, Phys. Rev. B 70, 104414 (2004).
- Peng et al. (2016) J. Peng, J. Liu, J. Hu, Z. Mao, F. Zhang, and X. Wu, Sci. Rep. 6, 19462 (2016).
- Okazaki et al. (2013) R. Okazaki, Y. Nishina, Y. Yasui, F. Nakamura, T. Suzuki, and I. Terasaki, J. Phys. Soc. Jpn. 82, 103702 (2013).
- Yoshida et al. (2004) Y. Yoshida, I. Nagai, S.-I. Ikeda, N. Shirakawa, M. Kosaka, and N. Môri, Phys. Rev. B 69, 220411 (2004).
- Baumberger et al. (2006) F. Baumberger, N. Ingle, N. Kikugawa, M. Hossain, W. Meevasana, R. Perry, K. Shen, D. Lu, A. Damascelli, A. Rost, A. P. Mackenzie, Z. Hussain, and Z. X. Shen, Phys. Rev. Lett. 96, 107601 (2006).
Supplementary Materials for
In situ control of diamagnetism by electric current in Ca3(Ru1-xTix)2O7
Chanchal Sow1∗, Ryo Numasaki1, Giordano Mattoni1, Shingo Yonezawa1, Naoki Kikugawa2,
Shinya Uji2,3, & Yoshiteru Maeno1†
1Department of Physics, Graduate School of Science,
Kyoto University, Kyoto 606-8502, Japan
2Quantum transport properties group,
National Institute for Materials Science,
Tsukuba 305-0047, Japan
3Graduate School of Pure and Applied Sciences,
University of Tsukuba, Tsukuba, Ibaraki 305-8577, Japan
∗e-mail: chanchal@scphys.kyoto-u.ac.jp, †e-mail: maeno@scphys.kyoto-u.ac.jp
Supplementary Figures