Studying galaxy evolution through cosmic time via the Jy radio population: early results from MERGE
Abstract:
The -MERLIN Galaxy Evolution Survey (MERGE) is an ambitious, multi-tiered extragalactic radio continuum survey being carried out with -MERLIN and the VLA at 1.4 GHz and 6 GHz. Exploiting the unique combination of high sensitivity and high angular resolution provided by radio interferometry, these observations will provide a powerful, obscuration-independent tool for tracing intense star-formation and AGN activity in galaxies out to . In our first data release (DR1) we present MERGE Tier 1, a 15-arcmin pointing centred on the GOODS-N field, imaged at 1.4 GHz with the VLA and -MERLIN at resolution down to an rms sensitivity of Jy beam-1. This unique radio survey – unrivaled at 1.4 GHz in its combination of depth, areal coverage and angular resolution in the pre-SKA era – allows us to localise and separate extended star-forming regions, nuclear starbursts and compact AGN core/jet systems in galaxies over the past two-thirds of cosmic history, a crucial step in tracing the apparently simultaneous growths of the stellar populations and central black holes in massive galaxies.
In these proceedings we highlight some early science results from MERGE DR1, including some examples of the sub-arcsecond morphologies and cold dust properties of 1.4 GHz-selected galaxies. MERGE Tier 1 will eventually reach sub-Jy beam-1 sensitivity at resolution over a 30-arcmin field, providing crucial benchmarks for deep extragalactic surveys which will be undertaken with SKA in the next decade.
1 Introduction
One of the key goals of modern cosmology is to understand the formation of the whole galaxy population through cosmic time. Historically, optical and near-infrared surveys have served as the key workhorses for measuring the integrated star-formation history of the Universe, however over the past two decades it has been demonstrated that a pan-chromatic (i.e. X-ray – radio) approach is key to achieving a consensus view on galaxy evolution (e.g. Driver et al., 2009). Since early work in the far-IR/sub-mm with SCUBA, it has been established that a significant fraction of the star-formation through cosmic history (up to at –; Swinbank et al., 2014) occurred in heavily dust-obscured galaxies, which are typically faint (or undetected) in even the deepest optical/IR studies (e.g. Casey et al., 2014, and references therein). Deep interferometric radio continuum observations provide an indispensible, dust-unbiased tracer of star formation (e.g. Smolcic et al., 2017), complementing studies in the optical/IR, and allowing us to track the build-up of stellar populations through cosmic time. Moreover, radio continuum observations also provide a direct probe of active galactic nuclei (AGN), which are believed to play a crucial role in the evolution of their host galaxies via feedback effects (e.g. Harrison et al., 2015).
However, the very fact that radio continuum emission is produced by both star-formation and AGN activity makes the interpretation of radio observations of distant galaxies non-trivial. To differentiate between these two processes we require either (a) the angular resolution and surface brightness sensitivity to decompose (extended) star-formation from (point-like) nuclear activity and jet structures (e.g. Baldi et al., 2018; Jarvis et al., submitted), or (b) multi-frequency observations which provide the spectral index information necessary to reliably isolate “radio excess” sources, i.e. galaxies whose radio luminosities exceed those which can be attributed to star-formation (e.g. Magnelli et al., 2014; Thomson et al., 2014). To spatially-resolve massive galaxies at and create maps of star-formation and AGN activity requires sensitive (Jy beam-1) imaging with kpc (i.e. sub-arcsecond) resolution. While the VLA is currently capable of achieving this combination of observing goals with deep integrations between and -band (Smolcic et al., 2017; Murphy et al., 2017, respectively), at these observations probe rest-frame frequencies of – GHz – a portion of the radio spectrum in which spectral curvature becomes important due to the increasing contribution of thermal free-free emission (e.g. Murphy et al., 2011). This complicates efforts to measure the rest-frame radio luminosities () of galaxies at high-redshift. Moreover, at GHz, the instantaneous field of view (FoV) of the VLA is small (, at 1.4 GHz), while at 1.4 GHz the FoV is large, but the VLA lacks the resolving power to morphologically study the bulk of the high-redshift galaxy population (, corresponding to kpc at ).
To address these issues, we have been conducting the -MERLIN Galaxy Evolution Survey (MERGE; Muxlow et al.. 2019, in prep), an ambitious legacy survey which combines observations of the GOODS-N extragalactic field at 1.4 GHz and 6 GHz from both -MERLIN and the Karl G. Jansky Very Large Array (VLA). The long baselines ( km) and large collecting area of -MERLIN( of the total collecting area of SKA-1) provide an excellent complement to the high surface brightness sensitivity of the VLA, allowing the production of radio maps which exceed the capabilities of either telescope individually.
2 -MERLIN & VLA data reduction and imaging
We here summarize the data processing and imaging strategies for our -MERLIN and VLA data. Further details will be provided in the forthcoming MERGE survey description paper (Muxlow et al., 2019, in prep), while details of the construction of the radio source catalogue will be provided in Thomson et al., 2019 (in prep).
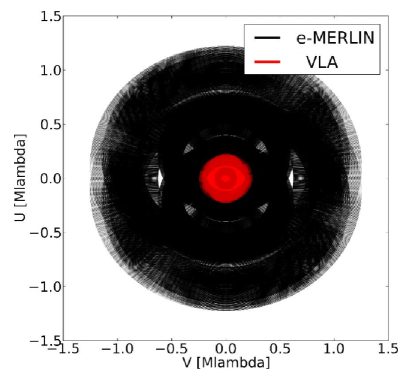
Our MERGE DR1 image comprises hours of -MERLIN L-band data (the first of the total time awarded to the project) plus hours from the VLA in A-array (previously published by Owen, 2018). Together, these two datasets offer baselines from km– km, providing near-complete coverage and sensitivity to emission on scales from the angular resolution of -MERLIN () up to the largest angular scale of the VLA (; Fig. 1).
We processed our -MERLIN data manually using aips version 31dec14, including one a priori round of automated flagging of bad data using the serpent tool (Peck & Fenech, 2013), followed by extensive manual flagging using the aips tasks ibled and spflg. The data were calibrated using standard techniques (e.g. Wrigley, 2016), with one round of phase-only self-calibration performed on the target field prior to imaging. We processed our VLA data by performing one round of automated flagging using the aoflagger package (Offringa et al., 2012) then used the scripted casa pipeline (version 4.3.1) to perform further automated flagging as well as flux density, phase and bandpass calibration. On completion of the casa pipeline tasks, one round of phase-only self calibration was performed using a model of the inner -arcmin of the field, before the data were reweighted for optimal sensitivity using the casa task statwt.
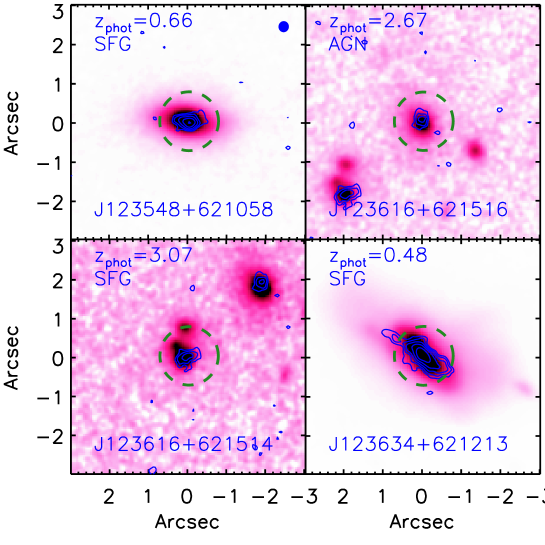
The final calibrated datasets from both arrays were written to casa Measurement Set format, along with re-processed legacy datasets from the pre-upgrade VLA and MERLIN arrays (Muxlow et al., 2005). A naturally-weighted map was produced from this combined dataset using the wsclean (version 2.6; Offringa et al., 2014) package, which utilises the -stacking approach to mitigate the effects of the non-coplanar array geometry. Our DR1 image covers the inner 15-arcmin of the GOODS-N field with a pixel scale of (i.e. a k k pixel image), is cleaned using an auto-masking procedure, and reaches an rms sensitivity of Jy beam-1 near the pointing centre. We show a selection of thumbnails from this radio map in Fig. 2.
3 Star-forming galaxies and AGN at high-redshift
The radio continuum spectra of normal star-forming galaxies and AGN are typically comprised of power-law components (tracing synchrotron and thermal free-free emission) and lack the spectral features required to measure accurate redshifts. To allow meaningful astrophysics to be derived from our radio source catalogue, we therefore cross-match our MERGE source list with the multiwavelength (optical–mid-IR) photometric catalogue of GOODS-N compiled by the 3D-HST team (Skelton et al., 2014), which includes photometric redshifts calculated using the eazy code (Brammer et al., 2008). We find 3D-HST optical counterparts to 612/820 MERGE sources within our DR1 image, with the majority of the non-matched radio sources lying outside the footprint of the Hubble WFC3 mosaic image used to define the 3D-HST survey area.
We supplement this multiwavelength coverage with far-IR flux density mesaurements from the Herschel PACS ( & m) and SPIRE (–m) imaging of GOODS-N (Elbaz et al., 2011). The angular resolution of Herschel SPIRE is –, significantly under-sampling the density of galaxies in the MERGE catalogue. To measure reliable far-infrared flux densities for individual galaxies we therefore need to deblend the SPIRE maps for the effects of this confusion. Following the techniques of Swinbank et al. (2014) and Thomson et al. (2017), we exploit the extensive multi-wavelength imaging of GOODS-N to construct a catalogue of infrared and radio-bright galaxies which can be used as positional priors to deblend the SPIRE maps (removing any sources which lie within as duplicates), and insert these priors as delta functions with arbitrary flux densities into blank model maps matching the astrometry and pixel scale of the original SPIRE images. Next, we use a Monte Carlo algorithm to converge on the optimum SPIRE flux densities for these sources by randomising the flux densities of the delta functions, convolving this model with the appropriate SPIRE PSF and searching for the set of fluxes which minimises the residual image (i.e. data–model).
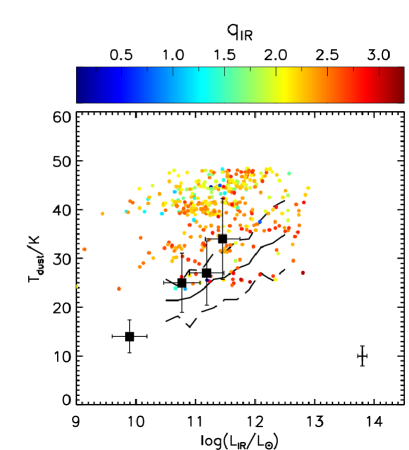
We measure far-infrared (–m) luminosities, , and dust temperatures, , for 378 galaxies (of the 612 with photometric redshifts) in the MERGE sample by fitting model spectral energy distributions from a library which includes high-redshift dust-obscured starburst and AGN templates (see Thomson et al., 2017 for details) to the deblended far-IR photometry. The dust temperatures of these radio-selected galaxies span a range - k (Fig. 3), a little higher than those of IR-selected galaxies at the same (e.g. Symeonidis et al., 2013). From these far-IR luminosities we also measure , following Ivison et al. (2010), where is the rest-frame 1.4 GHz flux density (-corrected assuming with ) and is the rest-frame –m flux. This logarithmic flux ratio provides a clear discriminator between galaxies whose radio luminosities are consistent with star-formation () and those whose radio luminosities can only be explained via the presence of a powerful AGN (; Del Moro et al., 2013).
4 Conclusions
We have presented example thumbnails and some early science results from our -MERLIN+ VLA 1.4 GHz imaging survey of the GOODS-N field, constituting Data Release 1 of Tier 1 of the -MERLIN Galaxy Evolution Survey. By combining – km baselines from -MERLIN with km baselines from the VLA in A-configuration and performing a single imaging run on the gridded data, we achieve a “best of both worlds” imaging scenario, offering sensitivity on scales from the PSF up to the largest angular scale of the VLA, . In combination with published optical–mid-IR data and new deblended Herschel SPIRE photometry, this ambitious legacy programme promises to provide new insights into the population of radio-selected star-forming galaxies and AGN from –.
5 Acknowledgements
APT acknowledges support from STFC (ST/P000649/1). -MERLIN is a National Facility operated by the University of Manchester at Jodrell Bank Observatory on behalf of STFC. The National Radio Astronomy Observatory is a facility of the National Science Foundation operated under cooperative agreement by Associated Universities, Inc.
References
- [1] Amblard et al., 2010, A&A, 518, 9
- [2] Baldi et al., 2018, MNRAS, 476, 3478
- [3] Brammer et al., 2008, ApJ, 686, 1503
- [4] Casey et al., 2009, MNRAS, 399, 121
- [5] Casey et al., 2014, PhR, 541, 45
- [6] Del Moro et al., 2013, A&A, 549, 59
- [7] Driver et al., 2009, A&G, 50, 12
- [8] Elbaz et al., 2011, A&A, 533, 119
- [9] Grogin et al., 2011, ApJS, 197, 35
- [10] Harrison et al., 2015, ApJ, 800, 45
- [11] Ivison et al., 2010, A&A, 518, 31L
- [12] Koekemoer et al., 2011, ApJS, 197, 36
- [13] Magnelli et al., 2014, A&A, 561, 86
- [14] Murphy et al., 2011, ApJ, 737, 67
- [15] Murphy et al., 2017, ApJ, 839, 35
- [16] Muxlow et al., 2005, MNRAS, 358, 1159
- [17] Offringa et al., 2012, A&A, 539, 95
- [18] Offringa et al., 2014, MNRAS, 444, 606
- [19] Owen, F., 2018, ApJS, 235, 34
- [20] Peck & Fenech, 2013, A&C, 2, 54
- [21] Skelton et al., 2014, ApJS, 214, 24
- [22] Smolcic et al., 2017, A&A, 602, 2
- [23] Swinbank et al., 2014, MNRAS, 438, 1267
- [24] Symeonidis et al., 2013, MNRAS, 433, 1015
- [25] Thomson et al., 2014, MNRAS, 442, 577
- [26] Thomson et al., 2017, ApJ, 838, 119
- [27] Wrigley, N., 2016, PhD Thesis, Univ. Manchester