Titanium hidden in dust
Abstract
Cassiopeia A, one of the most intriguing galactic supernova remnants, has been a target of many observational efforts including most recent observations by ALMA, Hubble, Herschel, Spitzer, NuSTAR, Integral, and other observatories. We use recent gamma-ray lines observations of the radioactive products of Cas A supernova explosive nucleosynthesis as well as spectral energy densities derived for Cas A at infrared wavelengths to speculate about the possibility of radioactive being locked into large dust grains. This suggestion is also supported by the possible observation of a pre-supernova outburst about 80 years before the actual Cas A supernova explosion in 1671 AD by Italian astronomer G.D. Cassini. The plausibility of such a scenario is discussed also with reference to recent supernovae, and to the contribution of core-collapse supernovae to the overall dust production in the Galaxy.
keywords:
ISM: dust, extinction; supernova remnants; supernovae: individual: Cas A; supernovae: individual: SN1987A1 Introduction
We consider the connection between the line emission of radioactive isotopes in supernova (SN) ejecta, and the dust produced before and after the SN explosion. To the best candidates to probe SN explosion models belong radioactive isotopes like , , and (Clayton et al., 1992; Iyudin et al., 1999; Diehl et al., 2011). Among these isotopes, radioactive has the longest lifetime of about 86 years (e.g., Ahmad et al., 2006). It is produced mainly during the so-called -rich freeze-out in core-collapse SNe (CCSNe) with a yield that depends very sensitively on the conditions in the central zones of the SN, like the mass-cut, the kinetic energy, and the asymmetry of the explosion. Some amount of is also produced during O-shell burning and Si-shell burning.
Observationally, the important signatures of the decay chain, , are present over a broad range of energies, ranging from X-rays at 67.9 keV and 78.4 keV (from de-excitation of ) up to -rays at 1157 keV (from de-excitation of ). On average, , , and photons are produced per decay in each of these lines, respectively (Chen et al., 2011). Lines with energies of 67.9, 78.4, and 1157 keV for Cas A and 67.9 and 78.4 keV for SN 1987A were observed by many telescopes (Iyudin et al., 1994, 1999; Vink et al., 2001; Renaud et al., 2006; Grebenev et al., 2012; Grefenstette et al., 2014; Boggs et al., 2015; Siegert et al., 2015; Tsygankov et al., 2016; Grefenstette et al., 2017).
Historically, the very first detection of was made by the Compton scattering telescope COMPTEL on-board the Compton Gamma-Ray Observatory (CGRO) from the young galactic supernova remnant Cas A (Iyudin et al., 1994, 1999) via gamma-ray line emission at 1.157 MeV. The first live confirmation of (i.e. via the observed de-excitation of ) in the young galactic supernova remnant (SNR) Cas A was obtained by the low-background spectrometer PDS on-board of Beppo-SAX (Vink et al., 2001) via the detection of low-energy decay lines at 68 and 78 keV. Later detections of the same low-energy gamma-ray lines at 68 and 78 keV from decay were made by ISGRI/IBIS (Renaud et al., 2006) on-board of INTEGRAL, and by NuSTAR (Grefenstette et al., 2014, 2017). Early all-sky surveys of the decay line emission were performed by the COMPTEL Team, first by Dupraz et al. (1997) and later by Iyudin et al. (1999). Additionally, detection of the 1.15 MeV gamma-ray line from the Cas A SNR was attempted twice so far by SPI (INTEGRAL), first by Martin et al. (2009), and later by Siegert et al. (2015). The result of an all-sky survey in the decay lines at 68 and 78 keV was published recently by Tsygankov et al. (2016) based on ISGRI/IBIS accumulated data.
The conclusion that can be drawn from the measurements reiterated above is that the decay line flux detected from the Cas A SNR at 1.157 MeV is larger than that at the 68 and 78 keV lines, even if one takes into account the branching ratios of the relevant decays, and the time of the actual measurements. The reason for this discrepancy might be related either to the inability to account for the different detection efficiencies of the telescopes or to the (astro)-physical properties of the SNR and of its environment (circumstellar, CSM, and interstellar, ISM, medium). The dust content of the CSM and ISM, and the resulting source obscuration could be especially important in order to better understand why Cas A was not optically observed as a supernova.
It is widely accepted that the large quantities of dust observed in high-redshift quasars and galaxies (Priddey et al., 2008; Wang et al., 2008) have to be produced rapidly during the galactic evolution. Massive stars become significant dust producers in their late evolutionary stages, reached after a rather brief time on the main sequence, (Cernuschi et al., 1967) and, thus have long been considered the most likely source of the dust.
Type-II SNe, such as Cas A, may also work as dust factories (Woosley & Weaver, 1995). At present, it is believed that dust is formed in CCSNe in amounts that are sufficient to explain the dust observed in the distant universe. For example, McKinnon et al. (2016) presented a model where roughly two thirds of the dust in Milky-way-type galaxies is produced by type-II SNe.
This notion, though, until recently was supported only by rather scant and controversial observations of infrared (IR) satellites like IRAS, ISO, and Spitzer, which detected mostly a warm dust component of much smaller mass than predicted by theory. Herschel, operational since 2009 (Pilbratt et al., 2010), observed SN 1987A and Cas A, and it allowed for a much better coverage of the far-infrared emission of observed SNRs up to 500 . These observations and additional ALMA coverage of SNRs at 450 and 870 (Zanardo et al., 2014) strongly support the presence of cold dust in SNRs. Namely, up to 0.8 of dust is suspected nowadays in SN 1987A (Indebetouw et al., 2014; Matsuura et al., 2015; Wesson et al., 2015; Dwek & Arendt, 2015; Bevan & Barlow, 2016; Matsuura et al., 2019). Similar, or even larger, amounts of dust are suggested for the Cas A SNR by Rho et al. (2008); Dunne et al. (2009); Barlow et al. (2010); Bevan et al. (2017).
Potential signatures of the formation of dust in the ejecta of CCSNe are (a) a faster decline of the optical brightness caused by an increasing extinction due to newly formed dust, (b) an infrared excess due to the absorption of optical photons and their subsequent reemission at longer wavelengths, and (c) the absorption of the red-shifted radiation emitted at the far side of the ejecta by dust along the line of sight (LoS), thus leading to a relative blue-shift of the emission lines.
Early definitive detections of dust formation in CCSNe were made for SN 1987A as one of the first cases (Lucy et al., 1989; Bouchet & Danziger, 1993; Meikle et al., 1993; Wooden et al., 1993; Elmhamdi et al., 2003). Assuming a smooth dust distribution, a dust mass of about of dust was found. However in the two well studied cases, SN 1987A and SN 1999em, this assumption was challenged. A clumpy rather than homogeneous distribution would correspond to significantly higher dust masses.
Following early evidence for optically thick clumps by Lucy et al. (1989, 1991), observations ranging from -rays and X-rays to IR wavelengths by Wooden et al. (1993) found significant clumping in the ejecta of SN 1987A.
More recently, Smith et al. (2008) found evidence for dust formation in the type-Ib SN 2006jc as early as between 51 and 75 days after the explosion. They propose that the dust formation occured when the SN shock wave overtook the dense shell formed by the outburst of the progenitor just 2yr prior to the SN. Moreover, Gall et al. (2014) demonstrated the rapid (40 to 240 days after explosion) generation of dust in the dense CSM of the luminous supernova SN 2010jl. At later times (500 to 900 days) their infrared oberservations show that the dust source is no longer circumstellar matter but SN ejecta, thus providing a link between the early and late dust mass evolution in supernovae with dense CSM. The important conclusion drawn from the dust formation and evolution of SN 2010jl is that the dust formed contains quite a high percentage of large ( ) grains, which resist destruction during later evolution stages of the SNR.
Studies of grain inclusions found in meteorites delivered an evidence that at least some SNe produced grains with isotopic distributions significantly different from those of the Sun and the Earth (e.g., Clayton et al., 1997; Croat et al., 2003; Stadermann et al., 2005; Gyngard et al., 2018).
The observations of the early dust formation in SNe quoted above, together with quite a few new interpretations of the dust content of the Cas A and SN 1987A SNRs (De Looze et al., 2017; Bevan et al., 2017) inspired us to propose a new interpretation of the fluxes measured for Cas A at different energies and by different instruments. Below we consider consequences of dust presence in the CSM of SNR, and in the ISM along the LoS to SNR. The Cas A SNRis our primary object of interest, because it is well studied with respect to dust presence as well as to lines measurements.
2 Cas A dust and content
| No | date(s) | Intrument | comments | |||
|---|---|---|---|---|---|---|
| 1 | – | – | 1991–1997 | COMPTEL | VP0.1-617.1 | |
| 2 | – | May, June 2001 | BeppoSAX | 12-300 keV pl continuum | ||
| 3 | – | May, June 2001 | BeppoSAX | 30-100 keV pl continuum | ||
| 4 | – | 2003-2005 | IBIS (INT) | |||
| 5 | – | – | Aug 2012, Jun 2013 | NuSTAR 1.2 Ms | 67.8 line redshifted | |
| 6 | – | 2003-2014 | SPI (INT) | |||
| 7 | – | – | Aug 2012–Dec 2013 | NuSTAR | 2.4 Ms exposure |
| Dust | Density | Attenuation | Attenuation | Attenuation | Attenuation |
|---|---|---|---|---|---|
| composition | at 4.5 keV | at 67.78 keV | at 78.36 keV | at 1157 keV | |
| SiC | 236.8 | 0.2391 | 0.2078 | 0.05917 | |
| 163.6 | 0.2095 | 0.1879 | 0.05833 | ||
| 3.32 | 168.1 | 0.2131 | 0.1908 | 0.05899 | |
| Fe | 7.95 | 186.2 | 0.08800 | 0.6234 | 0.05565 |
| 5.25 | 150.8 | 0.6864 | 0.4979 | 0.05664 | |
| FeS | 4.87 | 284.4 | 0.6785 | 0.4929 | 0.05696 |
It is well known that the presence of dust grains around X-ray sources produces X-ray halos around bright sources due to small-angle X-ray scattering (Mauche & Gorenstein, 1986; Predehl & Schmitt, 1995; Valencic & Smith, 2015). Below we will demonstrate that the presence of dust in SNRs might affect the line measurements at hard X-ray and -rays using the Cas A SNR as an example.
The dust mass in the Cas A SNR was recently re-derived based on a spatially resolved Herschel analysis (De Looze et al., 2017) by far-infrared (Herschel) and submillimeter (ALMA) measurements of the emission spectra of the cold dust in this young galactic SNR. The new dust mass estimate based on the far-infrared and submillimeter SED of this SNR, together with the dust mass estimate based on the analysis of the shape of oxygen lines by Bevan et al. (2017), leads to a total dust mass estimate of . This dust mass is much larger than what was evaluated previously on the basis of measurements at shorter wavelengths (Rho et al., 2008; Barlow et al., 2010; Arendt et al., 2014).
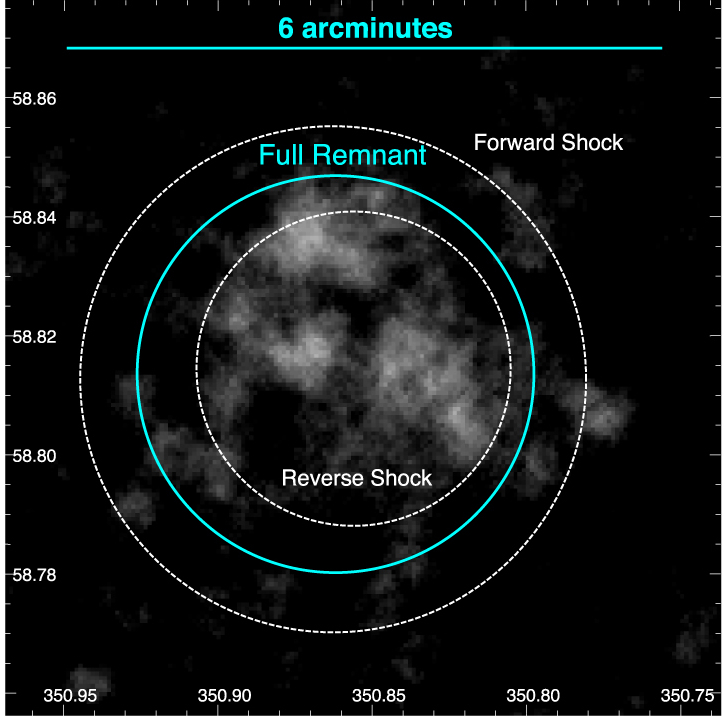
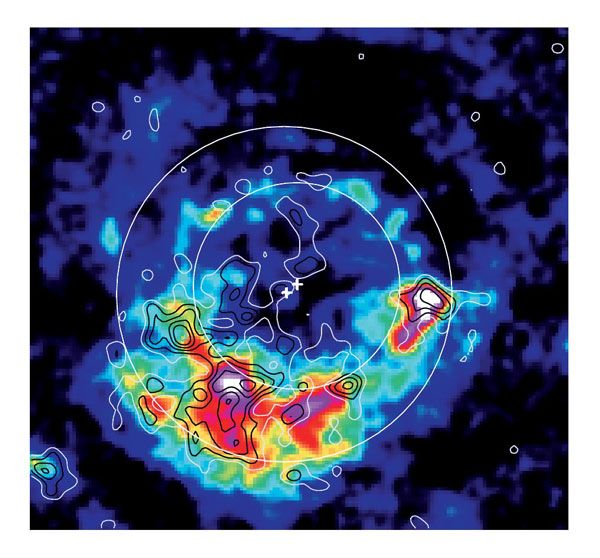
Apart from the total dust mass estimate, the spatial distribution of the dust is important to understand, too. We note that warm dust was detected mainly inside of the SNR reverse shock (RS). But it is quite plausible to expect the presence of a much higher mass of cold dust inside, or near, the cold dense shell (CDS) between the RS and the forward shock (FS), which is likely also very clumpy. This conclusion follows from observations at 850 by Dunne et al. (2009), (see also Fig. 3, and the discussion in Dunne et al. (2009) on polarised dust measured in Cas A. It is also supported by the results of Bevan et al. (2017) on the asymmetry of the [OIII] line observed from the region between RS and CDS in the Cas A SNR.
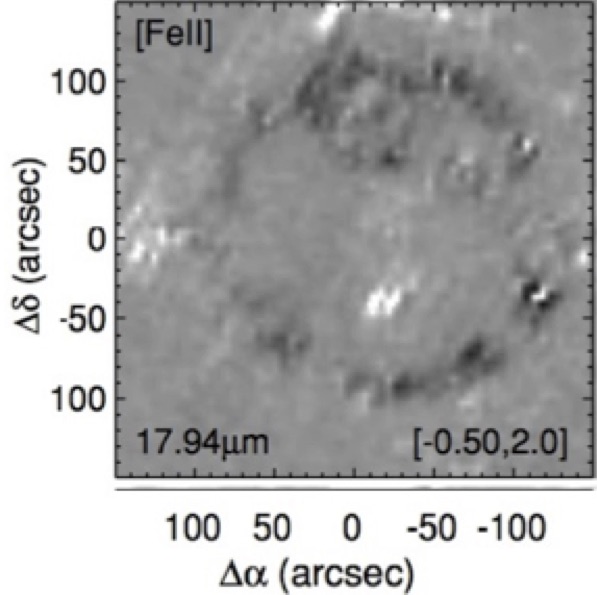
The observations by Lee et al. (2015) of excessive and varying extinction along different LoS to the Cas A SNR, measured by using [FeII] line emission at 1.26 and 1.64 , and their lines flux ratio, may give an indication of the opacity of this region as well. Using these results, as well as additional spectroscopic results for 63 [FeII] line-emitting knots, Lee et al. (2017) concluded that some LoS crossing the shell that is bright in [FeII] (Fig. 2 and Fig. 10 (left) of Lee et al. (2017)) might correspond to column densities of Fe ranging from in the gas phase up to in the dusty clumps that are filling the shell beyond the RS with reasonably small filling factors.
These results of the dust distribution and the related extinction measured by using [FeII] line emission Lee et al. (2015), together with extinction maps for the field in and around Cas A gives average values of mag and up to mag towards Cas A (Eriksen et al., 2009; Lee et al., 2015; De Looze et al., 2017). In a similar fashion, we consider the ratios of the measured flux from Cas A at different energies as a consequence of the presence of dust in Cas A.
Tab. 1 provides an overview of the published measurements of line emission from Cas A obtained by different instruments.
In addition to the measured fluxes, it is important to consider also the velocity distribution of Ti in Cas A. IBIS/ISGRI measurements resulted in an upper limit for the velocity (Renaud et al., 2006).
COMPTEL was an imaging instrument, but its angular resolution at 1.157 MeV was degrees only, i.e., much larger than the angular size of Cas A. Therefore, it was only possible to estimate the mean velocity of the bulk motion in the SNR as from the COMPTEL measurements of the 1.157 MeV line energy distribution (Iyudin et al., 1997). Recent NuSTAR results are of utmost importance for the intended comparison because NuSTAR is currently the only imaging experiment that is capable to derive the 3D spatial distribution of in the Cas A SNR (Grefenstette et al., 2014, 2017).
The main conclusions from NuSTAR measurements are that radioactive in Cas A is moving with a mean velocity of , and its spatial distribution inside the SNR is not consistent with that of (Grefenstette et al., 2014, 2017), even though there is some correspondence of and Fe K- emission at the Northwest and Southwest parts of the SNR (Grefenstette et al., 2017).
Eight out of 11 significantly detected clumps of measured by NuSTAR are projected inside the reverse shock (Grefenstette et al., 2017) The exceptions are three clumps, one of which moves with a LoS velocity of towards the observer. At the same time, in agreement with the velocity of measured by COMPTEL, clumps must be spread out up to radii of , which correspond to the position of the Cas A forward shock. Considering these differencies of the measured velocities, we speculate that NuSTAR has not detected any fast component of that moves close to the plane of the sky beyond the reverse shock for unknown reasons, and, therefore, it has measured only an, albeit large, part of the total flux of decaying that is present today in Cas A.
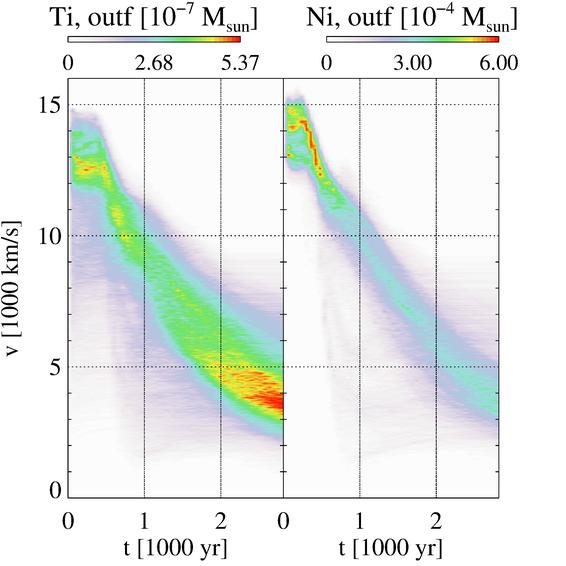
We also note that simulation results of an asymmetric explosion of a star point towards much higher velocities of at the age of the Cas A SNR, see Fig. 5 of Obergaulinger et al. (2014), and our Fig. 4. Looking at the velocity distributions of and Fe (Ni) at yrs after the SN explosion we note a substantial overlap of the distributions for both elements, with the amount of Fe (Ni) exceeding times that of at the same velocities.
Coming back to the flux values given in Tab. 1, it is tempting to explain the deficiency of the measured fluxes at energies keV and keV compared to the fluxes measured at 1.157 MeV as a consequence of an additional component of the flux at 1.157 MeV, which is generated by the interaction of low-energy cosmic rays (LECR) with abundant circumstellar species like Fe, Mn, and Cr in the environment of Cas A. Siegert et al. (2015) attempted to interpret these discrepant line fluxes of at different energies exactly in this way. However, considering that little or nothing is known about the LECR fluxes in the Cas A SNR as well as uncertainties in the generally small cross sections for the relevant reactions to produce either or excited Silberberg et al. (1998); Tsao et al. (1998), the validity of such an interpretation of the discrepant measurements of fluxes at 68 and 78 keV and at 1.157 MeV by different instruments as well as by the same instrument (SPI) may be doubted. Additionally, if one assumes that the production of the 1.157 MeV line emission is supported in Cas A by the enhanced flux of LECRs, then immediately a problem arises related to the absence of other lines emission from much more abundant elements like oxygen, carbon and nitrogen with very large, well measured cross-sections for excitation. Indeed, simulations of the excitation emission lines produced by LECRs in Cas A have shown that lines at 4.43, 6.13, 6.9, and 7.1 MeV are expected to be strongest (Summa et al. 2011) for the expected spectrum of LECR (Berezhko et al. 2003) that are interacting with the CSM near the Cas A SNR. However, because no gamma-ray line emission at 4.43, 6.13, 6.9, and 7.1 MeV is observed from the Cas A SNR, we consider this explanation of the excitation origin of the high 1.157 MeV line flux compared to that at 68 and 78 keV as very problematic.
In our opinion, a more appealing explanation for the observed differences of the measured line fluxes in the emission of is the dependence of the line flux measurements at different energies on the SNR environment and on the gas-to-dust ratio in the ejecta. Coming back to the recent measurements of the dust content of Cas A and of the ISM along LoS towards Cas A discussed above, it is fair to assume that a part of the emitted photons at energies of 68 and 78 keV are absorbed or scattered, likely by the dust particles, out of the sight lines. Indeed, looking at the values of the attenuation coefficients for photon interaction at energies of 68-78 keV and 1.157 MeV for a dust composition taken as (Tab. 2), one immediately apprehends that the attenuation of photons with energies of 68-78 keV is notably larger than that of photons with an energy of 1.157 MeV. An attenuation coefficient is generally derived from the depletion of a photon beam while passing through the ISM or a cloud with known abundances. For photons with energies of and keV, photoeffect and Compton scattering are the most important processes removing photons from the beam, while for 1.157 MeV energies only Compton scattering has to be considered.
Let us have a more quantitative look at the problem. For this we will use Tab. 2 which contains attenuation coefficients for different dust compositions at photon energies of keV, keV, and 1.157 MeV, and the line flux measurements of Tab. 1. To compare the measured fluxes of at different line energies we re-calculate the measured fluxes to the chosen time period after the SN explosion. Because the latest measurements of the line flux at 67.9 keV by NuSTAR (Grefenstette et al., 2017) were performed from August 2012 to December 2013 or at 2013.3, we take the period of 2013.3 as the mean time of actual measurement by NuSTAR and will re-calculate all other measured fluxes to this date taking the decay into account. Using this conversion of the measured fluxes we come to weighted means of the measured fluxes at 1.157 MeV and 67.9 keV as follows:
| (1) | |||||
| (2) |
These are significantly different values for the line fluxes, though with large error bars. If one takes into account branching of lines, the derived final ratio of line fluxes at 67.9 keV and 1.157 MeV is equal to:
| (3) |
Such a ratio can be achieved if the line at the smaller energy (68 keV) was attenuated by a dust clump composed of of thickness along the line of sight, placed somewhere between 2.5 pc and pc radial distance from the Cas A explosion centre, e.g. at larger radii than the reverse shock. For a dust clump composed of , the same absorption effect can be achieved with an attenuation length of about along the LoS towards the clumps. We note that quite some amount of Fe is present between the RS and the FS, according to measurements of [FeII] line emission by Smith et al. (2009), as shown in their Fig. 1, or by Lee et al. (2017).
Interestingly, about the same quantity of absorbing matter containing Fe along the LoS to Cas A was derived by Lee et al. (2015) from their analysis of the IR absorption along the LoS towards Cas A. From the relative positions of clumps detected by NuSTAR (Grefenstette et al., 2014, 2017), and the dust distribution and the polarization that was detected in Cas A SNR by Dunne et al. (2009), see Fig. 1 and 2, the interpretation of some part of the being placed somewhere at distances between the RS and the FS is quite in order. If this scenario holds, then it is reasonable to assume that some fraction of the 68 and 78 keV line emission of was absorbed or scattered off the LoS by matter located along the LoS towards the clumps ejected with velocities higher than km/s during the SN explosion.
Note that absorption might happen for the clumps observed by NuSTAR as well. However, this absorption could be smaller due to the dust filling factor of the absorbing shell, or due to the smaller dust density or/and favourable dust composition along appropriate lines of sight. Actually, we think that apart from clump 20 Grefenstette et al. (2017) could be detected in Cas A by NuSTAR beyond the RS, in the sky projection. However, this will demand a much longer exposure because the signal to noise (S/N) ratio of the 68 and 78 keV lines fluxes will likely be much smaller outside the RS due to the dilution of a smaller amount of high-velocity in the dense shell between the RS and the FS.
3 Discussion
The real amount of dust in the Cas A SNR, its spatial distribution, and the reddening towards Cas A remain unsettled problems at present, see Dunne et al. (2003); Krause et al. (2004); Dwek (2004); Dunne et al. (2009); Eriksen et al. (2009); Sibthorpe et al. (2010); Lee et al. (2015); Bevan et al. (2017); De Looze et al. (2017). The amount of dust inside and towards the Cas A SNR is debatable, but the usual argument that the amount of dust produced after the explosion cannot exceed the total mass of the SN ejecta can be false, because it ignores the possible contribution from the condensible material in the pre-supernova wind and the possible flaring history of the progenitor. This contribution may include the mass ejected by the supernova progenitor in the form of stellar wind and/or of the ejected matter by the star during the so-called supernova “impostor” phase. In the case of the Cas A SNR one has to take seriously the observation of the so-called “Guest-Star” near the position of Cas A Park et al. (2016) made by Korean astronomers in 1592 - 1593 AD. This “Guest-Star” may have been an LBV-type outburst of the Cas A progenitor, similar to that Car in 1843 Smith & Owocki (2006); Smith (2008), but likely on a smaller scale. In that case, the Cas A pre-supernova would have ejected considerable mass and over the following years produced notable amounts of dust until the final explosion around 1671 AD Thorstensen et al. (2001); Soria et al. (2013). The dust produced during this “impostor” phase would then act as a “veil” for the final explosion.
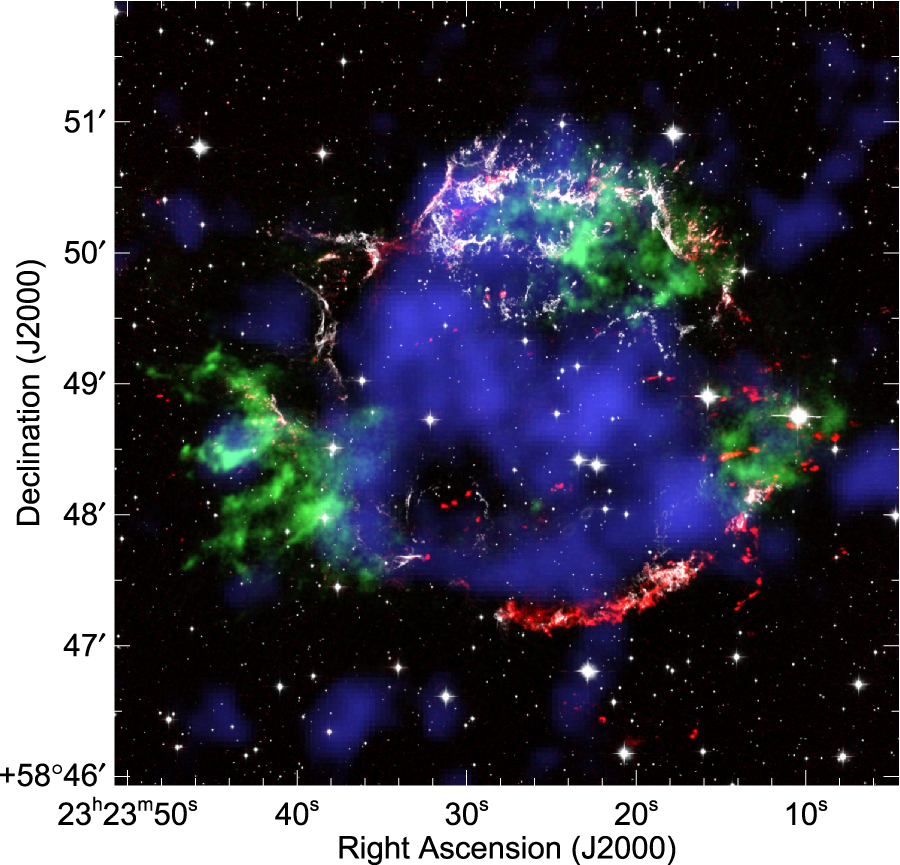
It is well observed that some of the superluminous supernovae are bright because their ejecta are interacting with the dense CSM (Chugai & Danziger, 1994; Smith et al., 2010; Smith, 2017). Moreover, some parts of the ejected nucleosynthesis products condense into dust grains quite early after the explosion (on time scales of 40 - 240 days). Another SNR, produced by SN 1987A, for which an emission of at 68 and 78 keV was detected Boggs et al. (2015), is suspected to have at days after the explosion of dust (Wesson et al., 2015; Bevan et al., 2017). For some events, like SN 2010jl, dust grains produced at these early stages of the ejecta expansion are quite large, up to 4.2 (Gall et al., 2014). The reason for such an early growth of dust in the ejecta may be related to the presence of a Cold Dense Shell (CDS), formed before the SN explosion, like in the case of SN 2010jl Jencson et al. (2016). Interestingly, [FeII] and a large part of the X-ray Fe emission in Cas A SNR are found between RS and FS (see Fig. 2 and Fig. 5), where a CDS might exist.
Noteworthy, Ti has the highest depletion probability among other elements in the Milky Way (Jenkins, 2009), and Fe is second to Ti in this respect. Hence, we speculate that some part of the is incorporated into dust grains which might also contain some Fe. However, such grains will consist not of pure Fe or Ti agglomerates, but will contain much larger masses of graphite, or of SiC; see, for example, Figure 9 in the paper by Stadermann et al. (2005) showing an image of a graphite slice, or Figure 2 and the discussion section in the paper by Croat et al. (2003). The phase condensation of first TiC, with later co-added Fe, and finally covered by graphite, inferred by Croat et al. (2003), implies that is located in the central bulk region of dust grains. This conclusion is supported by the radial number distribution of TiC that is decreasing with increasing distance from the graphite grain centre Croat et al. (2003). The addition of Fe on top of a pebble of TiC implies that the decay emission of , if it is present in this particular dust grain, will have to penetrate the absorbing matter of the dust grain, including apart from graphite, or SiC, also some amount of Fe, which is much more effective absorber than lighter elements like C and Si (see Tab. 2).
Considering Ti depletion into the dust fraction together with steadily updated values of the dust mass measured in the Cas A SNR, one has to pose a question: what influence might the CSM and ISM dust have for the measurements of line fluxes from Cas A at 68-78 keV and 1.157 MeV energies and on the observability of the Cas A SN?
Let us reiterate here that Cas A has a known problem with not being observed as a SN (despite the claim of being seen by the Astronomer Royal Sir John Flamsteed (Ashworth, 1980)). This problem can be solved or, at least, eased a lot, by the assumption of the progenitor being shadowed by the dust veil produced by the SNe impostor of 1592-1593, in agreement with the Korean record of a Guest Star (Park et al., 2016), and with the hypothesis put forward by Predehl & Schmitt (1995) and Hartmann et al. (1997).
Accepting the role of the “impostor” phase in Cas A for the non-detection of the SN as well as the physical mechanism that leads to an “impostor” phase during He-C and Ne shell burning, then it is possible to accept also that dust grains produced after the final explosion of the Cas A progenitor will show signatures of unusually heavy SiC with enrichment inside of graphites, i.e., similar to dust grains found inside of the Murchison meteorite, with accompanying enrichment, like in the case discussed by Croat et al. (2010).
According to Dwek & Arendt (2015); Wesson et al. (2015); Sluder et al. (2018), after 104 days of SNR evolution the dust might cool down below . Such low temperatures require measurements at long wavelengths (far-infrared, mm) to study the dust distribution. It is also noteworthy that dust grains tend to have quite large sizes at this stage of SNR evolution (Dwek & Arendt, 2015; Wesson et al., 2015; Sluder et al., 2018), sometimes up to , like that for the grain termed Bonanza (Gyngard et al., 2018).
Considering the broadly accepted extinction towards Cas A of to 8 magnitudes based on measurements and analyses by Eriksen et al. (2009), together with an additional visual extinction of magnitudes produced by the Cas A “impostor” ejecta in the years 1592-1593, and by taking the subsequent dilution of this impostor ejecta until the NuStar observation into account might solve the puzzle of an otherwise normal SN IIb type event not being contemporaneously observed by astronomers in Europe.
If a notable amount of radioactive is hidden in dust grains as we suggested above, then it is difficult to expect, at least for that part of a SNR where the dust is abundant, that the ionisation state of is similar to that of Fe as was proposed by Laming & Hwang (2007). It would be similarly difficult to expect the stripped Ti to quench the decay of as was suggested by Mochizuki et al. (1999). Unfortunately, distribution and composition of dust in a SNR, though very important for performing an analysis of the content in a SNR as well as for the role of the SNR in the cosmic ray injection and acceleration process, remain quite uncertain for Cas A and even more so for other SNRs.
4 Conclusions
Chevalier & Oishi (2003) suggested that Cas A underwent extensive mass loss, leading to a mass of only at the time of core collapse rather than the original zero-age main-sequence mass of . The relatively slowly moving stellar wind formed a dense environment. Woosley et al. (1993); Young et al. (2006); Claeys et al. (2011) attribute these conditions to a binary companion aiding the mass loss rather than the radiatively driven wind from a progenitor. This idea is also supported by the recent study of Ouchi & Maeda (2017) of the binary scenario for SN IIb. Such a scenario, if true, leads to the existence of SN progenitors inside dense circumstellar matter (CSM or CDS) produced by the extensive pre-supernova mass loss (), a scenario that might be well applied to Cas A.
The presence of large dust masses in and near SNRs might explain the paucity of SNR-related detections in the Milky Way discussed by The et al. (2006). Future observations of young galactic SNRs have to be carried out in both energy bands of the lines at 68 and 78 keV and at 1.157 MeV, as well as at IR and mm wavelengths. Only such contemporaneous, multi-wavelength measurements can provide key information on the dust content in and around SNRs.
We conclude by stating that the fluxes of decay lines measured at 68 and 78 keV and 1,157 MeV in time sequence measurements, together with contemporaneous X-Ray, optical, IR, and mm measurements are very important to shed light on the time sequence of dust formation during the evolution of a SN to a SNR, to constrain the relative distribution of dusty Fe and Ti in SNRs, and to verify the SN explosion mechanism and the SNR asymmetry origin.
5 Acknowledgements
MO acknowledges support from the European Research Council (grants CAMAP-259276 and EUROPIUM-667912), from the Deutsche Forschungsgemeinschaft through Sonderforschungsbereich SFB 1245 ”Nuclei: From fundamental interactions to structure and stars”, and from the Spanish Ministry of Economy and Competitivity and the Valencian Community under grants AYA2015-66899-C2-1-P and PROMETEOII/2014-069, respectively.
References
- Ahmad et al. (2006) Ahmad, I., Greene, J. P., Moore, E. F., et al. 2006, Phys. Rev. C, 74, 065803
- Arendt et al. (2014) Arendt, R. G., Dwek, E., Kober, G., Rho, J., & Hwang, U. 2014, ApJ, 786, 55
- Ashworth (1980) Ashworth, Jr., W. B. 1980, Journal for the History of Astronomy, 11, 1
- Barlow et al. (2010) Barlow, M. J., Krause, O., Swinyard, B. M., et al. 2010, A&A, 518, L138
- Bevan & Barlow (2016) Bevan, A. & Barlow, M. J. 2016, MNRAS, 456, 1269
- Bevan et al. (2017) Bevan, A., Barlow, M. J., & Milisavljevic, D. 2017, MNRAS, 465, 4044
- Boggs et al. (2015) Boggs, S. E., Harrison, F. A., Miyasaka, H., et al. 2015, Science, 348, 670
- Bouchet & Danziger (1993) Bouchet, P. & Danziger, I. J. 1993, A&A, 273, 451
- Cernuschi et al. (1967) Cernuschi, F., Marsicano, F., & Codina, S. 1967, Annales d’Astrophysique, 30, 1039
- Chen et al. (2011) Chen, J., Singh, B., & Cameron, J. A. 2011, Nuclear Data Sheets, 112, 2357
- Chevalier & Oishi (2003) Chevalier, R. A. & Oishi, J. 2003, ApJ, 593, L23
- Chugai & Danziger (1994) Chugai, N. N. & Danziger, I. J. 1994, MNRAS, 268, 173
- Claeys et al. (2011) Claeys, J. S. W., de Mink, S. E., Pols, O. R., Eldridge, J. J., & Baes, M. 2011, A&A, 528, A131
- Clayton et al. (1997) Clayton, D. D., Amari, S., & Zinner, E. 1997, Ap&SS, 251, 355
- Clayton et al. (1992) Clayton, D. D., Leising, M. D., The, L.-S., Johnson, W. N., & Kurfess, J. D. 1992, ApJ, 399, L141
- Croat et al. (2003) Croat, T. K., Bernatowicz, T., Amari, S., Messenger, S., & Stadermann, F. J. 2003, Geochim. Cosmochim. Acta, 67, 4705
- Croat et al. (2010) Croat, T. K., Stadermann, F. J., & Bernatowicz, T. J. 2010, AJ, 139, 2159
- De Looze et al. (2017) De Looze, I., Barlow, M. J., Swinyard, B. M., et al. 2017, MNRAS, 465, 3309
- Diehl et al. (2011) Diehl, R., Hartmann, D., Prantzos, N. 2011, Lecture Notes in Physics, Vol. 812. Berlin: Springer
- Dunne et al. (2003) Dunne, L., Eales, S., Ivison, R., Morgan, H., & Edmunds, M. 2003, Nature, 424, 285
- Dunne et al. (2009) Dunne, L., Maddox, S. J., Ivison, R. J., et al. 2009, MNRAS, 394, 1307
- Dupraz et al. (1997) Dupraz, C., Bloemen, H., Bennett, K., et al. 1997, A&A, 324, 683
- Dwek (2004) Dwek, E. 2004, ApJ, 607, 848
- Dwek & Arendt (2015) Dwek, E. & Arendt, R. G. 2015, ApJ, 810, 75
- Elmhamdi et al. (2003) Elmhamdi, A., Danziger, I. J., Chugai, N., et al. 2003, MNRAS, 338, 939
- Eriksen et al. (2009) Eriksen, K. A., Arnett, D., McCarthy, D. W., & Young, P. 2009, ApJ, 697, 29
- Fesen et al. (2006) Fesen, R. A., Hammell, M. C., Morse, J., et al. 2006, ApJ, 636, 859
- Gall et al. (2014) Gall, C., Hjorth, J., Watson, D., et al. 2014, Nature, 511, 326
- Grebenev et al. (2012) Grebenev, S. A., Lutovinov, A. A., Tsygankov, S. S., & Winkler, C. 2012, Nature, 490, 373
- Grefenstette et al. (2017) Grefenstette, B. W., Fryer, C. L., Harrison, F. A., et al. 2017, ApJ, 834, 19
- Grefenstette et al. (2014) Grefenstette, B. W., Harrison, F. A., Boggs, S. E., et al. 2014, Nature, 506, 339
- Gyngard et al. (2018) Gyngard, F., Jadhav, M., Nittler, L. R., Stroud, R. M., & Zinner, E. 2018, Geochim. Cosmochim. Acta, 221, 60
- Hartmann et al. (1997) Hartmann, D. H., Predehl, P., Greiner, J., et al. 1997, Nuclear Physics A, 621, 83
- Hwang et al. (2004) Hwang, U., Laming, J. M., Badenes, C., et al. 2004, ApJ, 615, L117
- Indebetouw et al. (2014) Indebetouw, R., Matsuura, M., Dwek, E., et al. 2014, ApJ, 782, L2
- Iyudin et al. (1994) Iyudin, A. F., Diehl, R., Bloemen, H., et al. 1994, A&A, 284, L1
- Iyudin et al. (1997) Iyudin, A. F., Diehl, R., Lichti, G. G., et al. 1997, in ESA Special Publication, Vol. 382, The Transparent Universe, ed. C. Winkler, T. J.-L. Courvoisier, & P. Durouchoux, 37
- Iyudin et al. (1999) Iyudin, A. F., Schönfelder, V., Bennett, K., et al. 1999, Astrophysical Letters and Communications, 38, 383
- Jencson et al. (2016) Jencson, J. E., Prieto, J. L., Kochanek, C. S., et al. 2016, MNRAS, 456, 2622
- Jenkins (2009) Jenkins, E. B. 2009, ApJ, 700, 1299
- Krause et al. (2004) Krause, O., Birkmann, S. M., Rieke, G. H., et al. 2004, Nature, 432, 596
- Laming & Hwang (2007) Laming, J. M. & Hwang, U. 2007, in Revista Mexicana de Astronomia y Astrofisica Conference Series, Vol. 30, Revista Mexicana de Astronomia y Astrofisica Conference Series, 72–79
- Lee et al. (2017) Lee, Y.-H., Koo, B.-C., Moon, D.-S., Burton, M. G., & Lee, J.-J. 2017, ApJ, 837, 118
- Lee et al. (2015) Lee, Y.-H., Koo, B.-C., Moon, D.-S., & Lee, J.-J. 2015, ApJ, 808, 98
- Lucy et al. (1989) Lucy, L. B., Danziger, I. J., Gouiffes, C., & Bouchet, P. 1989, in Lecture Notes in Physics, Berlin Springer Verlag, Vol. 350, IAU Colloq. 120: Structure and Dynamics of the Interstellar Medium, ed. G. Tenorio-Tagle, M. Moles, & J. Melnick, 164
- Lucy et al. (1991) Lucy, L. B., Danziger, I. J., Gouiffes, C., & Bouchet, P. 1991, in Supernovae, ed. S. E. Woosley, 82
- Martin et al. (2009) Martin, P., Knödlseder, J., Vink, J., Decourchelle, A., & Renaud, M. 2009, A&A, 502, 131
- Matsuura et al. (2015) Matsuura, M., Dwek, E., Barlow, M. J., et al. 2015, ApJ, 800, 50
- Matsuura et al. (2019) Matsuura, M., De Buizer, J. M., Arendt, R. G., et al. 2019, MNRAS, 482, 1715
- Mauche & Gorenstein (1986) Mauche, C. W. & Gorenstein, P. 1986, ApJ, 302, 371
- McKinnon et al. (2016) McKinnon, R., Torrey, P., & Vogelsberger, M. 2016, MNRAS, 457, 3775
- Meikle et al. (1993) Meikle, W. P. S., Spyromilio, J., Allen, D. A., Varani, G.-F., & Cumming, R. J. 1993, MNRAS, 261, 535
- Mochizuki et al. (1999) Mochizuki, Y., Takahashi, K., Janka, H.-T., Hillebrandt, W., & Diehl, R. 1999, A&A, 346, 831
- Obergaulinger et al. (2014) Obergaulinger, M., Iyudin, A. F., Müller, E., & Smoot, G. F. 2014, MNRAS, 437, 976
- Ouchi & Maeda (2017) Ouchi, R. & Maeda, K. 2017, ApJ, 840, 90
- Park et al. (2016) Park, C., Yoon, S.-C., & Koo, B.-C. 2016, Journal of Korean Astronomical Society, 49, 233
- Pilbratt et al. (2010) Pilbratt, G. L., Riedinger, J. R., Passvogel, T., et al. 2010, A&A, 518, L1
- Predehl & Schmitt (1995) Predehl, P. & Schmitt, J. H. M. M. 1995, A&A, 293, 889
- Priddey et al. (2008) Priddey, R. S., Ivison, R. J., & Isaak, K. G. 2008, MNRAS, 383, 289
- Renaud et al. (2006) Renaud, M., Vink, J., Decourchelle, A., et al. 2006, ApJ, 647, L41
- Rho et al. (2008) Rho, J., Kozasa, T., Reach, W. T., et al. 2008, ApJ, 673, 271
- Sibthorpe et al. (2010) Sibthorpe, B., Ade, P. A. R., Bock, J. J., et al. 2010, ApJ, 719, 1553
- Siegert et al. (2015) Siegert, T., Diehl, R., Krause, M. G. H., & Greiner, J. 2015, A&A, 579, A124
- Silberberg et al. (1998) Silberberg, R., Tsao, C. H., & Barghouty, A. F. 1998, ApJ, 501, 911
- Sluder et al. (2018) Sluder, A., Milosavljevic, M., & Montgomery, M. H. 2018, MNRAS, 480, 5580
- Smith et al. (2009) Smith, J. D. T., Rudnick, L., Delaney, T., et al. 2009, ApJ, 693, 713
- Smith (2008) Smith, N. 2008, Nature, 455, 201
- Smith (2017) Smith, N. 2017, Philosophical Transactions of the Royal Society A, Volume 375, Issue 2105, id.20160268
- Smith et al. (2010) Smith, N., Chornock, R., Silverman, J. M., Filippenko, A. V., & Foley, R. J. 2010, ApJ, 709, 856
- Smith et al. (2008) Smith, N., Foley, R. J., & Filippenko, A. V. 2008, ApJ, 680, 568
- Smith & Owocki (2006) Smith, N. & Owocki, S. P. 2006, ApJ, 645, L45
- Soria et al. (2013) Soria, R., Balestrieri, R., & Ohtsuka, Y. 2013, PASA, 30, e028
- Stadermann et al. (2005) Stadermann, F. J., Croat, T. K., Bernatowicz, T. J., et al. 2005, Geochim. Cosmochim. Acta, 69, 177
- The et al. (2006) The, L.-S., Clayton, D. D., Diehl, R., et al. 2006, A&A, 450, 1037
- Thorstensen et al. (2001) Thorstensen, J. R., Fesen, R. A., & van den Bergh, S. 2001, AJ, 122, 297
- Tsao et al. (1998) Tsao, C. H., Silberberg, R., & Barghouty, A. F. 1998, ApJ, 501, 920
- Tsygankov et al. (2016) Tsygankov, S. S., Krivonos, R. A., Lutovinov, A. A., et al. 2016, MNRAS, 458, 3411
- Valencic & Smith (2015) Valencic, L. A. & Smith, R. K. 2015, ApJ, 809, 66
- Vink et al. (2001) Vink, J., Laming, J. M., Kaastra, J. S., et al. 2001, ApJ, 560, L79
- Wang et al. (2008) Wang, R., Carilli, C. L., Wagg, J., et al. 2008, ApJ, 687, 848
- Wesson et al. (2015) Wesson, R., Barlow, M. J., Matsuura, M., & Ercolano, B. 2015, MNRAS, 446, 2089
- Wooden et al. (1993) Wooden, D. H., Rank, D. M., Bregman, J. D., et al. 1993, ApJS, 88, 477
- Woosley et al. (1993) Woosley, S. E., Langer, N., & Weaver, T. A. 1993, ApJ, 411, 823
- Woosley & Weaver (1995) Woosley, S. E. & Weaver, T. A. 1995, ApJS, 101, 181
- Wright et al. (1999) Wright, M., Dickel, J., Koralesky, B., & Rudnick, L. 1999, ApJ, 518, 284
- Young et al. (2006) Young, P. A., Fryer, C. L., Hungerford, A., et al. 2006, ApJ, 640, 891
- Zanardo et al. (2014) Zanardo, G., Staveley-Smith, L., Indebetouw, R., et al. 2014, ApJ, 796, 82