The Superoutburst Duration versus Orbital Period Relation for AM CVn stars
Abstract
We examine the relationship between superoutburst duration and orbital period in AM CVn ultra-compact binary systems. We show that the previously determined steep relation derived by Levitan et al (2015) was strongly influenced by the inclusion of upper limits for systems with a relatively long orbital period in their fit. Excluding the upper limit values and including values for three systems at long which were not considered previously, then is flat as predicted by Cannizzo & Nelemans (2015)
1 Introduction
AM CVn binaries are interacting binaries with orbital periods between about 5 and 65 min in which a Roche-lobe filling low-mass white dwarf (WD) secondary transfers matter to a more massive WD primary (Paczyński 1967, Faulkner et al 1972, Solheim 2010, Nelemans 2015). Since the mass losing star is degenerate and has an inverse mass-radius relation, mass-loss drives the binary to longer orbital periods. Thus AM CVn systems are thought to have evolved beyond the minimum orbital period that separates degenerate and non-degenerate secondaries (see Littlefair et al (2008)). AM CVn’s make up one subclass of the cataclysmic variables (CVs).
Due to the faintness of these systems, it has taken decades of work just to identify more than a handful of systems and to begin to characterize their long term light curves. The last few years have witnessed a break-through in terms of significantly adding systems with orbital period determinations and long term light curves so as to quantify outburst behavior. Dedicated transient surveys have facilitated this advance. Ramsay et al (2012) presented results of a 2.5 yr monitoring program of 16 AM CVn systems using the Liverpool Telescope, and showed the existence of an ‘instability strip’ in the orbital period distribution ranging from 25 to 45 min in which outbursts occur, consistent with earlier theoretical predictions (Smak 1983a, Tsugawa & Osaki 1997). Surveys such as the Palomar Transient Factory (PTF) (Levitan et al, 2013, 2015) have been very successful in discovering new AM CVn systems and characterizing their long term variability properties.
The accretion disk limit cycle (ADLC) model was developed to account for hydrogen rich dwarf nova (DN) outbursts (Meyer & Meyer-Hofmeister 1981, Smak 1984). It proposes that material accumulates in the accretion disk during quiescence and accretes on the WD during outburst when a certain critical surface density is attained. There exists a critical rate of accretion above which disks are predicted to be stable (the novalikes - NLs) and below which outbursts occur (DN). The Z Cam (ZC) systems with mass transfer rate, could show either behavior, given that is seen to vary on long time scales. Smak (1983b) and Warner (1987) investigated the relationship between , orbital period, disk radii and sub-class of dwarf novae and concluded the ADLC could account for NL and ZC systems. This was reinforced by Dubus et al (2018) who used a sample of 130 CVs with parallaxes in the Gaia DR2 sample to test the predictions of the ADLC model.
Short orbital period DNe show two kinds of outburst - short or normal outbursts in which the system quickly rises to maximum light and then returns to quiescence, and long or superoutbursts which are of longer duration and higher amplitude than short outbursts. In long outbursts there is a time interval of slow decay following maximum light and then a rapid return to quiescence (e.g. Cannizzo et al. 2002). Superoutbursts are defined by the presence of ‘superhumps’, modulations in the optical light at periods slightly greater (positive superhumps) or slightly less than (negative superhumps) the orbital period.
Like the hydrogen accreting CVs, the AM CVn systems also show normal and superoutbursts. The normal outbursts last only a few days and its only recently with high cadence surveys like PTF that systems such as PTF1J0719+4858 (an AM CVn binary with an orbital period of 26.8 min) have shown evidence for normal and superoutbursts (Levitan et al, 2011). Given the difficulty of identifying normal outbursts from AM CVn’s most of the outbursts observed from these binaries are likely to have been superoutbursts.
Cannizzo & Nelemans (2015) applied the ADLC model to the instability strip found by Levitan et al (2015) for the AM CVn systems, using ADLC scalings from Kotko et al (2012), and made inferences for three scalings of interest: (i) the mass transfer rate versus , (ii) the recurrence time for outbursts versus , and (iii) the superoutburst duration versus . If one assumes a power law , then based on the observed width of the strip (and assuming for the primary), one finds (i) , (ii) , and (iii) . These derive from simple considerations of the ADLC model. The steep inverse mass transfer rate is consistent with stellar evolution models, and the steep relation is consistent with that found by Levitan et al (2015). However, the relatively flat scaling is inconsistent with the much steeper relation found by Levitan et al (2015). In this work we investigate this discrepancy.
2 Accretion Disk Physics
In the accretion disk limit cycle model, gas accumulates in quiescence and accretes onto the central object in outburst (e.g., Cannizzo 1993, Lasota 2001 for reviews). The phases of quiescence and outburst are mediated by the action of heating and cooling fronts that traverse the disk and bring about phase transitions between low and high states, consisting of neutral and ionized gas, respectively. During quiescence, when the surface density at some radius within the disk exceeds a critical value , a transition to the high state is initiated; during outburst, when drops below a different critical value , a transition to the low state is initiated. Low-to-high transitions can begin at any radius, whereas high-to-low transitions begin at the outer disk edge. This situation comes about because in the outburst disk (roughly) and the critical surface densities both increase with radius. Since the disk mass accumulated in quiescence is bounded by and , one can define a maximum disk mass
| (1) |
and a minimum disk mass
| (2) |
which will bound the general, time dependent disk mass.
For normal, ‘short’ outbursts, only a few percent of the stored gas accretes onto the central object: the thermal time scale of a thin disk is short compared to the viscous time scale, and the cooling front that is launched from the outer edge of the disk almost as soon as the disk enters into outburst traverses the disk and reverts it back to quiescence. For disks that have been ‘filled’ to a higher level with respect to , the surface density in the outer disk can significantly exceed the critical surface density . In order for the cooling front to begin, however, the outer surface density must drop below . Disks in this state generate much longer outbursts, with slower ‘viscous’ plateaus, because the entire disk must remain in its high, completely ionized state until enough mass has been lost onto the WD for the condition to be satisfied.
Adjacent annuli in the accretion disk are causally connected to each other via the viscosity. In any physical problem where processes operating over a range of time scales are linked, the processes with the slowest time scales determine the rate of change. In an accretion disk, the time scales increase with radius, so conditions in the outer part of the hot, active disk mediate the action.
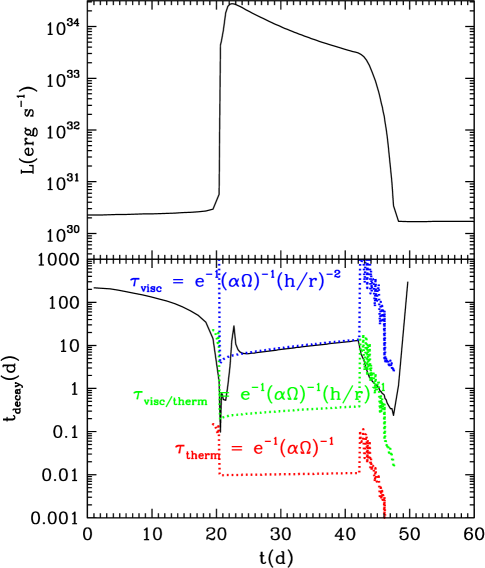
Two relevant accretion disk time scales are the viscous time , over which matter is redistributed radially, and the thermal time scale over which local heating and cooling take place. The slow decay rate within a superoutburst provides a direct measure of the viscous time scale in the outer disk in the hot state. The viscous time , and the thermal time , where is the Shakura & Sunyaev (1973) viscosity parameter in the outbursting disk, is the Keplerian angular velocity, and () is the disk aspect ratio. The subsequent faster decay is governed by , the geometric mean of and . This is shown in Figure 1.
The decays of DN outbursts at a given orbital period are fairly uniform and form the basis for the ‘Bailey’ relation, a roughly linear relation between rate of decay and orbital period (Bailey 1975, Warner 1995). The rise times show a greater variety, reflecting the fact that the outburst can be triggered anywhere in the disk (Smak 1984, Cannizzo 1998). Inside-out bursts tend to produce slow-rise times, whereas outside-in bursts produce fast rises (Cannizzo et al, 1986).
3 The Superoutburst Duration
In this paper we are interested in the duration of the superoutburst, which we take to be . Superoutbursts usually consist of (i) a rapid rise time, set by , then (ii) a period of slow decay, set by , and finally (iii) a period of faster decay, set by . Observationally, the superoutburst duration is usually contained roughly within the amount of time the transient spends within magnitudes of peak light. Some AM CVn systems have been quoted in the literature as having outbursts lasting months - e.g., V406 Hya and J0129 (Ramsay et al, 2012), but these include long outburst tails following the steep decay demarking the end of superoutburst when the system is significantly brighter than its nominal quiescence value. In other words, the relaxation back to the quiescent state can take much longer than what we define to be , which is just the duration of the superoutburst itself. There are probably other factors at work which cause the long periods of elevated flux post-superoutburst, such as enhanced secondary mass overflow from the superoutburst, and accretion-induced heating of the primary.
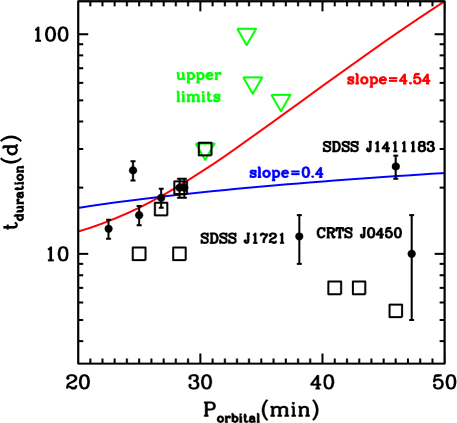
Figure 2 shows superoutburst durations taken from Levitan et al (2015) and the literature (Table 1). By including upper limit values as part of their fitting, they obtained a steep relation for . Including only measured values of yields a much flatter law. We have included the outburst duration from CRTS J0450 which Levitan et al (2015) did not include in their fit since only one outburst was seen.
| Source | Duration | Amplitude | Ref | |
| (mins) | (days) | (mag) | ||
| PTF1J1919+4815 | 22.5 | 13 | 3.0 | (1) |
| ASASSN-14cc | 22.5: | 13: | 3 | (2) |
| CR Boo | 24.5 | 24 | 3.3 | (3) |
| KL Dra | 25.0 | 15 | 4.2 | (3) |
| KL Dra | 25.0 | 10 | 3.3 | (4) |
| PTF1JJ0719+4858 | 26.8 | 16 | 3.5 | (5) |
| YZ LMi | 28.3 | 20 | 2.4 | (3) |
| YZ LMi | 28.3 | 10 | 2.6 | (4) |
| CP Eri | 28.4 | 20 | 4.2 | (4) |
| CP Eri | 28.4 | 15 | 4.0 | (3) |
| PTF1 J0943+1029 | 30.4 | 30: | 4 | (6) |
| V406 Hya | 33.8 | 50 | 5.2 | (4) |
| J0129 | 37: | 50 | 4.2 | (4) |
| SDSS J1721+2733 | 38.1 | 14: | 4: | (3) |
| ASASSN-14mv | 41: | 7: | 3.5: | (7) |
| ASASSN-14ei | 43: | 7: | 2.5: | (7) |
| SDSSJ1411+4812 | 46 | 25: | 6 | (7, 8) |
| CRTS J0450 | 47.3 | 10 | 5 | (3) |
4 Double Superoutbursts and Superoutburst with Dips
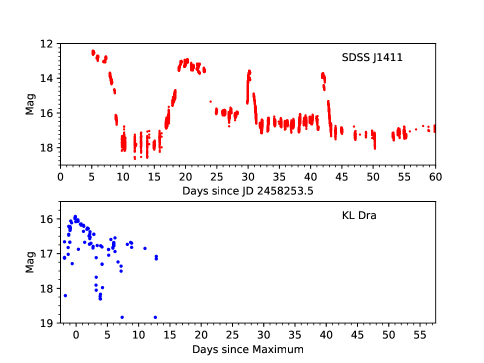
One additional complication is the issue of double superoutbursts and superoutbursts with dips. Figure 3 compares the 2018 outburst from SDSS J1411+4812 ( min) taken from AAVSO observations with that of a composite of superoutbursts from KL Dra ( min) (taken from Ramsay et al (2012)). For SDSS J1411+4812 the amplitude of the gap between the first and second portions of the superoutburst is 5 mag, whereas for KL Dra it is 1.5 mag. Therefore the former may be more aptly described by ‘double superoutburst’, whereas the latter may be a ‘dip’.
These phenomena may result from physical effects extrinsic to the ADLC mechanism, such as irradiation-induced enhanced mass overflow from the secondary. Therefore it is not clear whether the entire double superoutburst should be included in or just the first one. Given the scatter in Figure 2, however, this issue is minor.
5 Conclusions
We have investigated the relation between duration of superoutbursts and orbital period in the AM CVn systems and find a much flatter relation than inferred by Levitan et al (2015). Their steep dependence came about primarily because of their inclusion of upper limits of systems at high in their fit. By considering solely measured values of for the high systems and not using upper limits, we find a much flatter law, consistent with the flat relation predicted by Cannizzo & Nelemans (2015).
This work highlights the importance of surveys such as PTF and others in characterising the long term photometric behaviour of AM CVn binaries. In particular those with relatively long orbital periods should be monitored for any new outbursts and high cadence observations should be obtained to characterise their behaviour, looking for double superoutbursts, dips and rebrightening events.
6 acknowledgements
We thank the AAVSO and its members who contribute their data of cataclysmic variables and other stars – they provide an invaluable resource. Armagh Observatory and Planetarium is core funded through the Northern Ireland Executive.
References
- Bailey (1975) Bailey, J. 1975, Journal Brit. Astron. Assoc., 86, 30
- Cannizzo et al (1986) Cannizzo, J. K., Wheeler, J. C., & Polidan, R. S., 1986, ApJ, 301, 634
- Cannizzo (1993) Cannizzo, J. K. 1993, in Accretion Disks in Compact Stellar Systems, ed. J. C. Wheeler (Singapore: World Scientific), 6 (C93a)
- Cannizzo (1998) Cannizzo, J. K., 1998, ApJ, 494, 366
- Cannizzo et al. (2002) Cannizzo, J. K., Gehrels, N., & Mattei, J. A., 2002, ApJ, 579, 760
- Cannizzo & Nelemans (2015) Cannizzo, J. K., & Nelemans, G., 2015, ApJ, 803, 19
- Faulkner et al (1972) Faulkner, J., Flannery, B. P., & Warner, B., 1972, ApJL, 175, L79
- Dubus et al (2018) Dubus, G., Otulakowska-Hypka, M., & Lasota, J.-P., 2018, A&A, 617, A26
- Ichikawa & Osaki (1992) Ichikawa, S., & Osaki, Y., 1992, PASJ, 44, 15
- Kato et al (2015) Kato, T., Hambsch, F.-J., & Monard, B., 2015, PASJ, 67, L2
- Kotko et al (2012) Kotko, I., Lasota, J.-P., Dubus, G., & Hameury, J.-M., 2012, A&A, 544, A13
- Lasota (2001) Lasota, J.-P., 2001, New Astron. Rev., 45, 449
- Levitan et al (2011) Levitan, D., Fulton, B. J., Groot, P. J., et al., 2011, ApJL, 793, L68
- Levitan et al (2013) Levitan, D., Kupfer, T., Groot, P. J., et al., 2013, MNRAS, 430, 996
- Levitan et al (2014) Levitan, D., Kupfer, T., Groot, P. J., et al., 2014, ApJL, 785, L114
- Levitan et al (2015) Levitan, D., Groot, P. J., Prince, T. A., et al., 2015, MNRAS, 446, 391
- Littlefair et al (2008) Littlefair, S. P., et al., 2008, ApJ, 388, 1582
- Meyer & Meyer-Hofmeister (1981) Meyer, F. & Meyer-Hofmeister, E., 1981, A&A, 104, L10
- Nelemans (2015) Nelemans, G., 2015, in ASP Conf. Ser. 330, The Astrophysics of Cataclysmic Variables and Related Objects, ed. J.-M. Hameury, & J.-P. Lasota (San Francisco, CA; ASP), 27.
- Paczyński (1967) Paczyński, B., 1967, AcA, 17, 287
- Ramsay et al (2012) Ramsay, G., Barclay, T., Steeghs, D., et al., 2012, MNRAS, 419, 2836
- Rivera Sandoval & Maccarone (2019) Rivera Sandoval, L., & Maccarone, T., 2019, MNRAS, 483, L6
- Shakura & Sunyaev (1973) Shakura, N. I., & Sunyaev, R. A., 1973, A&A, 24, 337
- Smak (1983a) Smak, J., 1983a, Acta Astr., 33, 333
- Smak (1983b) Smak, J., 1983b, ApJ, 272, 234
- Smak (1984) Smak, J., 1984, Acta Astr., 34, 161
- Solheim (2010) Solheim, J.-E., 2010, PASP, 122, 1133
- Tsugawa & Osaki (1997) Tsugawa, M., & Osaki, Y., 1997, PASJ, 49, 75
- Warner (1987) Warner, B., 1987, MNRAS, 227, 23
- Warner (1995) Warner, B., 1995, Cataclysmic Variable Stars (Cambridge: Cambridge Univ. Press)