Dynamical Component Analysis (DyCA) and its Application on epileptic EEG
Abstract
Dynamical Component Analysis (DyCA) is a recently-proposed method to detect projection vectors to reduce the dimensionality of multi-variate deterministic datasets. It is based on the solution of a generalized eigenvalue problem and therefore straight forward to implement. DyCA is introduced and applied to EEG data of epileptic seizures. The obtained eigenvectors are used to project the signal and the corresponding trajectories in phase space are compared with PCA and ICA-projections. The eigenvalues of DyCA are utilized for seizure detection and the obtained results in terms of specificity, false discovery rate and miss rate are compared to other seizure detection algorithms.
Index Terms— dimensionality reduction, principal component analysis, independent component analysis, EEG, seizure detection
1 Introduction
Automatic detection of epileptic events in EEG data is a challenging problem. On the one hand the detection of all epileptic events, especially during live-monitoring sessions, is desireable. On the other hand not too many epilepsy alarms should be triggered. This represents a common classification problem aiming at high detection rate as well as a high specificity.
Current approaches to solve this problem use very sophisticated techniques, like the combination of wavelet transform with classical machine learning classification approaches [1, 2, 3] or instead with a deep convolutional neural network [4].
Dimensionality reduction of deterministic multi-variate time-series is another ambitious problem. Most of the currently available tools of dimensionality reduction, like PCA [5] or ICA [6] and modifications thereof, make a stochasticity assumption on the time-series on which they can be applied. Presumably due to the lack of better matching techniques they are often used for dimensionality reduction of deterministic time-series even if its assumptions are not fulfilled. Recently [7] the authors proposed a new method for dimensionality reduction of deterministic time-series: dynamical component analysis (DyCA). This method relys on a determinacy assumption on the time-series. The projection onto a lower-dimensional space is then found by solving a generalized eigenvalue problem.
The eigenvalues of the generalized eigenproblem of DyCA measure the quality of the assumption of linear determinism for the investigated data. For certain conditions the corresponding eigenvectors together with some linear transforms yield an optimal projection to represent the signal by a deterministic non-linear differential equation.
Since EEG data during an epileptic event is known to be of deterministic structure [8], while the EEG data during normal activity is of stochastic nature, we assume that the detection of epileptic events might be possible by investigating the generalized eigenvalues of DyCA. In this article we examine this approach and demonstrate the power of DyCA with respect to the obtained trajectories in phase space by projecting the original signal onto the DyCA eigenvectors. The DyCA eigenvalues are utilized to implement a novel seizure detection algorithm and its results in terms of specificity, false discovery rate and miss rate are compared to other studies [2, 3, 4].
The paper is structured as follows. In Section 2 we present the basic concepts underlying DyCA and demonstrate the formulation of the dimensionality reduction process. Section 3 deals with the assumption and confirmation of a deterministic model of EEG data of epileptic seizures. In Section 4 a DyCA-based method for detection of epileptic seizures is evaluated and compared. Finally the results are discussed (Section 5) and concluded (Section 6).
2 Dynamical Component Analysis (DyCA)
Dynamical Component Analysis (DyCA) is a recently-proposed [7] method for dimensionality reduction of deterministic time-series and can be derived as follows. Assume, given a high-dimensional deterministic time-series with dynamics governed by a low-dimensional system of ordinary differential equations, the signal can be decomposed into
| (1) |
using time-dependent amplitude and vectors with . The amplitudes are then assumed to be governed by a set of ordinary differential equations, divided into a set of linear differential equations,
| (2) |
and a set of non-linear differential equations with smooth functions :
| (3) |
Furthermore we assume that , i.e. there exist more linear than non-linear equations, and that every amplitude associated to a non-linear equation appears in the right-hand side of at least one of the linear equations without knowing the coefficients or the smooth functions .
Then projection vectors, , can be found containing the dynamics by minimizing the cost function
| (4) |
where denotes the average over time. The rational behind this is that at a minimum of all the information on how to project onto the non-linear parts is contained in and for the linear parts it is contained in .
The minima of for the vectors can be determined by a generalized eigenvalue problem
| (5) |
with correlation matrices , and . Furthermore there exists the connection . Thus by projecting onto
| (6) |
all relevant information is received.
On the other hand, the eigenvalues of the generalized eigenproblem (5) reveal something more, as then the cost function (4) takes the value
| (7) |
Thus the number of the generalized eigenvalues with a value of approximately are a measure of the number of linear equations contained in the data. In the subsequent sections this connection will be exploited to detect regions in time-series with highly deterministic parts, like epileptic seizures.
3 Epilepsy - deterministic EEG data
Unlike a first thought might suggest, during epileptic events the EEG data is much more regular than during normal phases. Indeed there are even models suggesting Shilnikov chaos to appear during epileptic seizures [8, 9]. In its easiest form a system showing Shilnikov chaos can be described by a set of three differential equations of the form
| (8) |
with a non-linear smooth function . Thus one can assume that the assumptions of DyCA are fulfilled and DyCA can be applied to epileptic EEG data.
Fig. 1 presents the three largest eigenvalues of DyCA applied to a moving window of an EEG dataset with an epilectic seizure. Each investigated window has a length of three seconds and 90 % overlap. An epileptic seizure occurs in-between window number 600 to approx. 700.
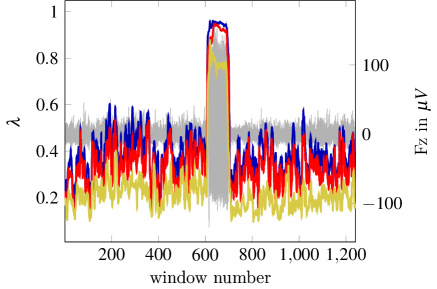
A clear jump of the first three eigenvalues is observed during seizure. This confirms the assumed low-dimensional deterministic behaviour in ictal phases of the signal. This observation in one dataset is investigated on a broader data basis in section 4 and a possible application of DyCA as seizure detection algorithm is discussed.
Considering the ODE (8) as a model of the epileptic seizure, two eigenvalues are expected to be close to the value of . Fig. 1 shows this behavior within the seizure: the blue and the red line representing the two largest eigenvalues are clearly closer to the value of 1 than the third eigenvalue. By choosing an appropriate threshold, DyCA allows for an identification of projection vectors leading to amplitudes which obey a linear set of ODEs.
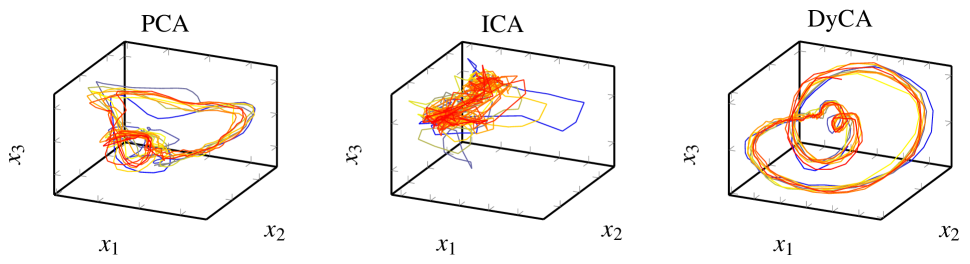
Fig. 2 shows on the right hand side the three-dimensional trajectory of the amplitudes corresponding to the eigenvectors and and vector . The structure of the trajectory is clearly observable and the typical homoclinic orbit of Shilnikov chaos is shown. DyCA represents a significant improvement compared to the 3D-trajectories in phase space spanned by the projection onto the first three PCA vectors or the best ICA vectors.
4 Detection of seizure events
We now investigate the utilization of the DyCA-eigenvalues for the detection of epileptic seizure events. For this a moving window frame runs over the data and the DyCA eigenvalues are calculated on the current window. The largest eigenvalues are compared against a threshold. If the eigenvalues are larger than the threshold, it is assumed that the current window contains an epileptic seizure.
To measure the quality of the classification method specificity (SPC), false discovery rate (FDR) and miss rate/false negative rate (FNR) were calculated. The specificity is the number of windows correctly classified as not containing a seizure relative to the number of windows not containing a seizure. The false discovery rate is the ratio of windows falsely classified as containing a seizure over all windows classified as containing a seizure. The miss rate is the number of windows falsely classified as not containing a seizure in relation to the number of all windows containing a seizure.
In our test setting DyCA detection was applied on six EEG data sets of patients with absences, which are a special kind of epileptic seizures. The mean length of the data sets is 411 seconds containing absences of length ranging from 4 to 25 seconds. The size of the moving window was taken as three seconds. As step size for the movement of the window 10 % of the window size were taken. This results in windows having 90 % overlap. A window was labeled as seizure if the whole window was contained in the pre-labeled seizure. That is windows contained only partly in the seizure are labeled as not being in the seizure. This results in a mean prevalence of . No further pre-processing techniques, like filtering, were applied to the data.
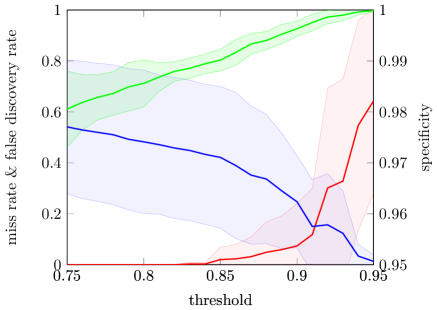
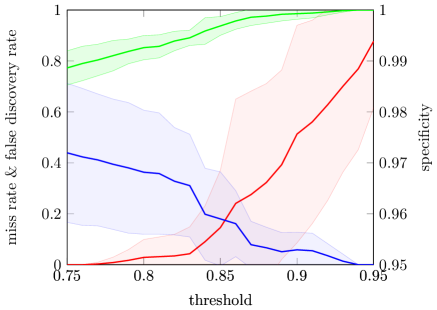
On each window the DyCA eigenvalues were compared to a threshold. In Fig. 3 the SPC, FDR, and FNR are shown for classification if only the largest eigenvalue is compared against the threshold. Analogously Fig. 4 shows SPC, FDR, and FNR for classification comparing the two largest eigenvalues against the threshold.
5 Discussion
Considering the small prevalence the results in Fig. 3 and Fig. 4 indicate that the two largest eigenvalues should be considered, since then the specificity reaches 99 %. This supports from a data-driven point of view the theoretical considerations in [8]. The choice of the threshold can be adapted to the application in mind. If the detection of all seizures as soon as possible is wanted and false alarms are acceptable the threshold should be lowered. If one is only interested in finding examples of appearing seizures a higher threshold should be chosen. The high standard deviation and relative high values of the false discovery rate is due to the labeling process of the windows. Since requiring that the whole window is contained in the seizure, windows containing only small parts outside the seizure are labeled as no seizure even though the deterministic part might be dominant.
The detection algorithm can be adjusted to obtain a specificity of nearly 99.7 % and still have a miss rate of 20 %.
6 Conclusion
In this paper we presented dynamical component analysis (DyCA) as an alternative to PCA and ICA reducing the dimensionality of multi-variate time series based on the assumption of an underlying dynamical system. Comparing the 3D-trajectories in phase space we obtained by DyCA more obvious structures than obtained by PCA and ICA (Fig. 2).
Applying DyCA to EEG data of epileptic seizures we implemented a novel seizure detection algorithm and obtained good results (specificity of nearly 99.7 %) in comparison with other studies using more complex tools for detection: In [4] using a deep convolutional neural network for detection, a specificity of only 90 % was reached. Further studies used wavelet transform or wavelet packet decomposition combined with ICA [3] or PCA [2] and different classifiers. They reach a specificity of 97 % with ICA and 99 % with PCA as intermediate step.
Generally, it might be advantageous for some applications to use DyCA instead of ICA or PCA as intermediate step for more refined classification methods. This is subject of work in progress and will be presented in upcoming papers.
References
- [1] A. Ahmadi, V. Shalchyan, and M. R. Daliri, “A new method for epileptic seizure classification in EEG using adapted wavelet packets,” 2017 Electric Electronics, Computer Science, Biomedical Engineerings’ Meeting (EBBT), pp. 1–4, 2017.
- [2] U. R. Acharya, S. V. Sree, A. P. C. Alvin, and J. S. Suri, “Use of principal component analysis for automatic classification of epileptic EEG activities in wavelet framework,” Expert Systems with Applications, vol. 39, no. 10, pp. 9072 – 9078, 2012.
- [3] U. R. Acharya, R. Yanti, G. Swapna, V. S. Sree, R. J. Martis, and J. S. Suri, “Automated diagnosis of epileptic electroencephalogram using independent component analysis and discrete wavelet transform for different electroencephalogram durations,” Proceedings of the Institution of Mechanical Engineers, Part H: Journal of Engineering in Medicine, vol. 227, no. 3, pp. 234–244, 2013.
- [4] U. R. Acharya, S. L. Oh, Y. Hagiwara, J. H. Tan, and H. Adeli, “Deep convolutional neural network for the automated detection and diagnosis of seizure using EEG signals,” Computers in Biology and Medicine, vol. 100, pp. 270 – 278, 2018.
- [5] K. Pearson, “On lines and planes of closest fit to a system of points in space,” The London, Edinburgh, and Dublin Philosophical Magazine and Journal of Science, vol. 6,2, pp. 559–572, 1901.
- [6] A. Hyvärinen and E. Oja, “Independent component analysis: algorithms and applications,” Neural Networks, vol. 13, no. 4-5, pp. 411–430, 2000.
- [7] B. Seifert, K. Korn, S. Hartmann, and C. Uhl, “Dynamical Component Analysis (DyCA): dimensionality reduction for high-dimensional deterministic time-series,” in Proceedings of the IEEE 28th International Workshop on Machine Learning for Signal Processing (MLSP2018), 2018, to appear.
- [8] L. van Veen and D.T.J. Liley, “Chaos via Shilnikov’s Saddle-Node Bifurcation in a Theory of the Electroencephalogram,” Phys. Rev. Lett., vol. 97, pp. 208101, 2006.
- [9] R. Friedrich and C. Uhl, “Spatio-temporal analysis of human electroencephalograms: Petit-mal epilepsy,” Physica D, vol. 98, no. 1, pp. 171–182, 1996.