Phonon scattering dominated electron transport in twisted bilayer graphene
Twisted bilayer graphene (tBLG) has recently emerged as a platform for hosting correlated phenomena, owing to the exceptionally flat band dispersion that results near interlayer twist angle . At low temperature a variety of phases are observed that appear to be driven by electron interactions including insulating states, superconductivity, and magnetism Cao et al. (2018a, b); Yankowitz et al. (2019); Sharpe et al. (2019). Electrical transport in the high temperature regime has received less attention but is also highly anomalous, exhibiting gigantic resistance enhancement and non-monotonic temperature dependence. Here we report on the evolution of the scattering mechanisms in tBLG over a wide range of temperature and for twist angle varying from 0.75∘ - 2∘. We find that the resistivity, , exhibits three distinct phenomenological regimes as a function of temperature, . At low the response is dominated by correlation and disorder physics; at high by thermal activation to higher moiré subbands; and at intermediate temperatures varies linearly with . The -linear response is much larger than in monolayer graphene Efetov and Kim (2010) for all measured twist angles, and increases by more than three orders of magnitude for near the flat-band condition. Our results point to the dominant role of electron-phonon scattering in twisted layer systems, with possible implications for the origin of the observed superconductivity.
The electronic properties of twisted bilayer graphene are highly sensitive to the twist angle. At large angles, momentum mismatch between the rotated Brillouin zone corners effectively decouples the two layers. In contrast, at small angles interlayer-tunneling strongly hybridizes the layers, leading to a significantly reconstructed bandstructure. At the so-called “magic angle” (), a narrow, low energy, band appears Bistritzer and MacDonald (2011); Suárez Morell et al. (2010) in which the Fermi velocity becomes vanishingly small, and correlations play an important role Kim et al. (2017). Near this angle transport studies have revealed insulating states at band fillings corresponding to an integer number of electrons per moiré unit cell Cao et al. (2018a), as well as superconducting states at a variety of partial band fillings Cao et al. (2018b); Yankowitz et al. (2019). However, despite intense theoretical effort there is little agreement upon the origin of the superconducting states, which have been proposed to arise from either an all-electronic mechanism mediated by magnetic fluctuations of the correlated insulating states Cao et al. (2018b) or from a conventional phonon-mediated mechanism Wu et al. (2018a); Lian et al. (2018).

For ordinary metals, the high-temperature resistivity is dominated by electron-phonon scattering and evolves linearly in temperature, with the slope, , directly related to the electron-phonon coupling strength. At low temperatures this dependence can transition to a different power as phonon scattering becomes inefficient and scattering from electron-electron interactions or disorder plays a larger role. For many metals that become superconducting at low temperature, the dimensionless coupling constant, , extracted from the -linear region is found to correlate well with the coupling constant, , that determines the phonon-mediated superconducting transition temperature Allen (2000). High-temperature transport can therefore provide a sensitive probe of electron-phonon coupling strength and help elucidate its role in the correlated states that appear at low temperature. However, in many materials can be complicated and therefore resistant to simple interpretation. In semiconductors both intraband scattering mechanisms and the thermal activation of carriers between bands contribute to the dependence of , requiring detailed theoretical analysis. In cuprate superconductors and other strongly correlated systems, increases without saturation at high , seemingly inconsistent with Fermi liquid theory Emery and Kivelson (1995). tBLG has large density of states in the flat band, small energy gaps to excited bands that can be easily bridged by thermal activation, and a low-temperature phase diagram in which strong electron-electron correlations likely play a role. Multiple contributions to resembling those in metals, semiconductors, and strongly correlated systems may thus be expected, reflecting both the electronic structure and relevant scattering mechanisms.
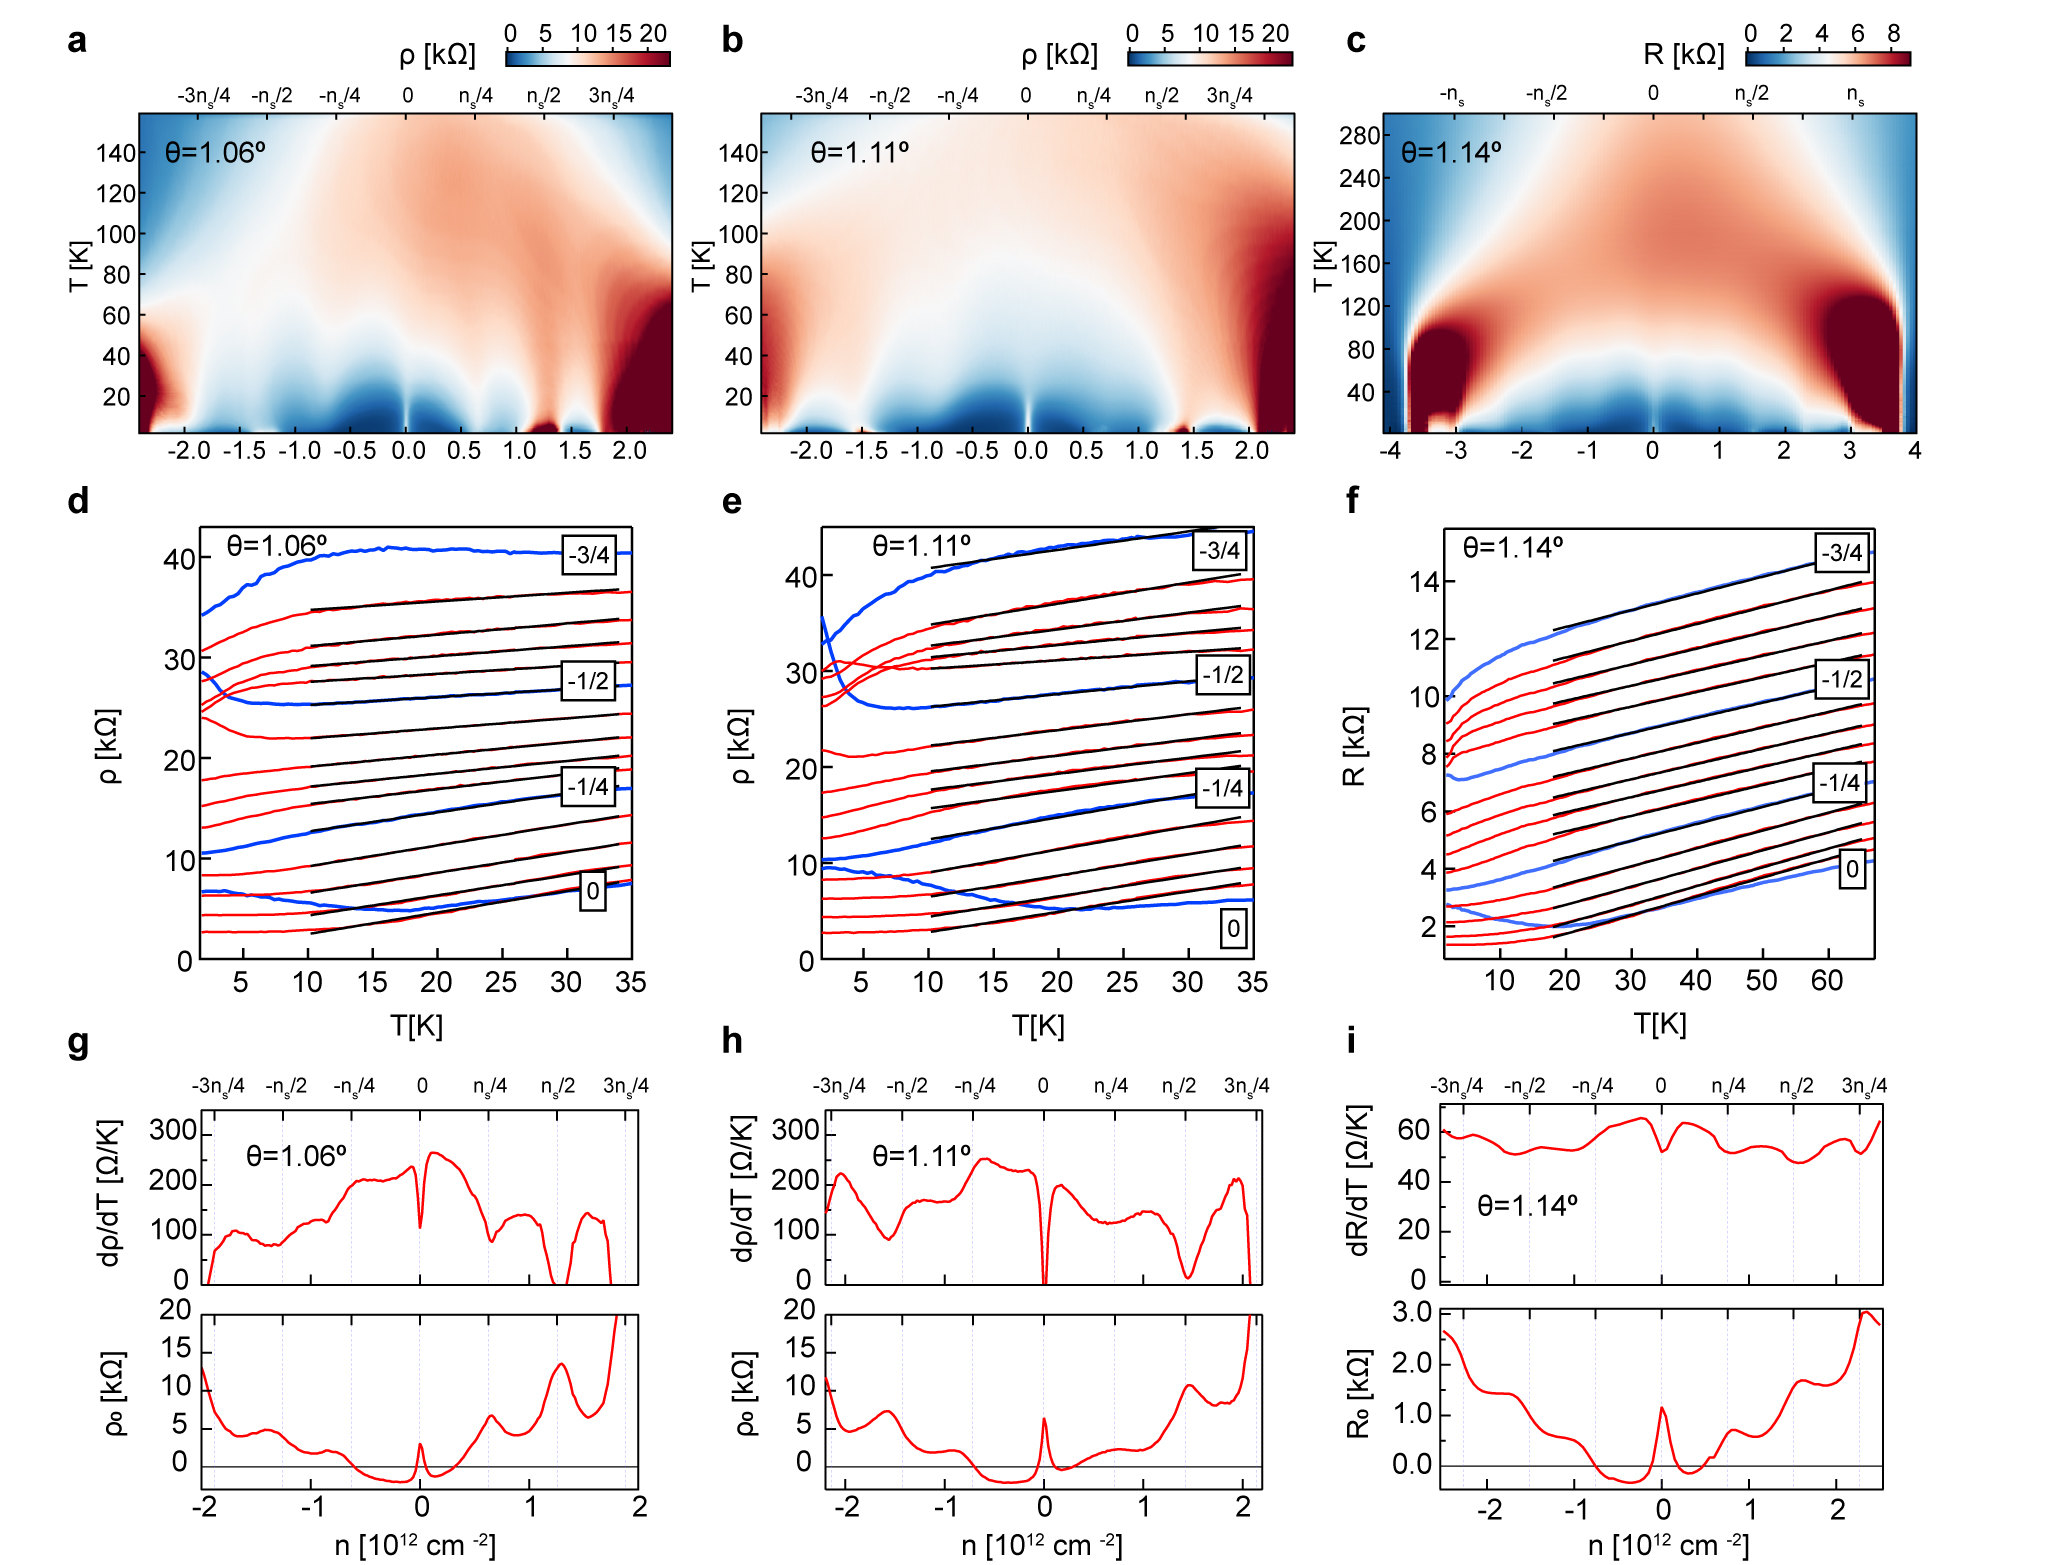
Figs. 1a-b show measured in a tBLG sample near the flat-band condition ( = 1.06∘) for carrier densities spanning the lowest energy band (we label as the density required to fill the lowest moiré subbands). Insulating response is observed at full band filling, characterized by high resistance peaks that diverge with decreasing temperature, consistent with previous measurements near this twist angle Kim et al. (2016a); Cao et al. (2016); Kim et al. (2017). We additionally observe correlated insulating phases or resistance peaks at several integer multiples of , as well as superconducting states at a variety of partial band fillings, as previously reported elsewhere Cao et al. (2018a, b); Yankowitz et al. (2019). As the temperature is raised, the at partial band filling exhibits a complex dependence. At most densities, increases with increasing temperature, consistent with metallic behaviour (an exception to this general trend is observed at the correlated insulating states where first decreases with but then eventually increases). At higher temperatures the resistance throughout the band saturates and then drops, exhibiting a negative with further temperature increase.
To disambiguate the role of electronic correlations in this temperature response we compare 7 tBLG devices with twist angles ranging from well below (0.75∘) to well above (2∘) the flat band condition. Fig. 1c shows near for 5 of these devices. As is evident in the plot, the behavior of the is qualitatively similar between samples of all twist angles. Specifically, we identify three distinct temperature regimes marked by different behavior of . In the high-temperature regime, grows sub-linearly with increasing , reaching a maximum at a temperature we define as before dropping again at the highest temperatures. Below this temperature, we find an intermediate regime where scales linearly with . Finally, at the lowest temperatures diverges from -linear dependence. Depending on density and twist angle, the low temperature regime can be marked by resistivity saturation (most clearly observed in the 2.02∘ device in Fig. 1c), insulating, or superconducting behavior. These three regimes are not universally demarcated; they depend on both twist angle and carrier density.
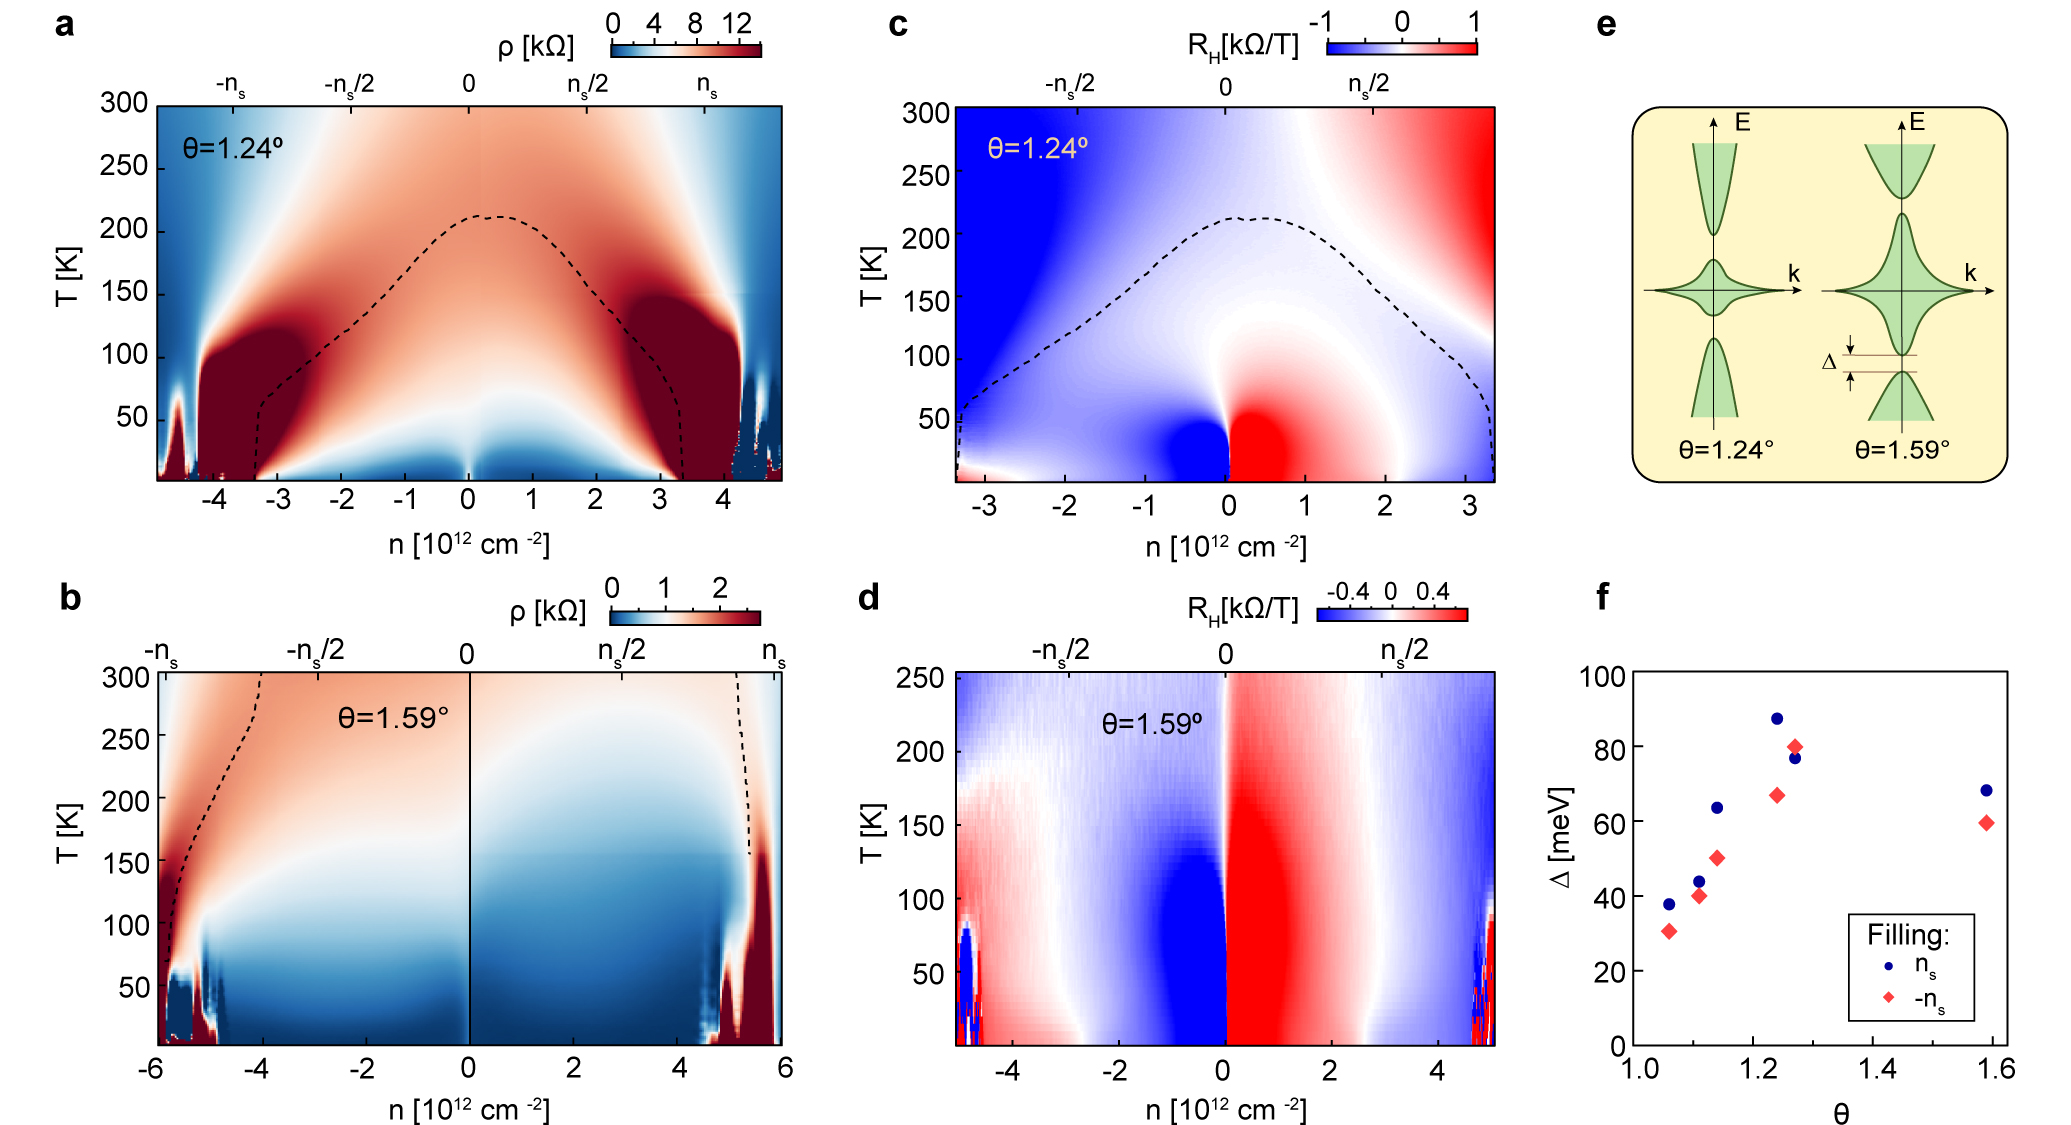
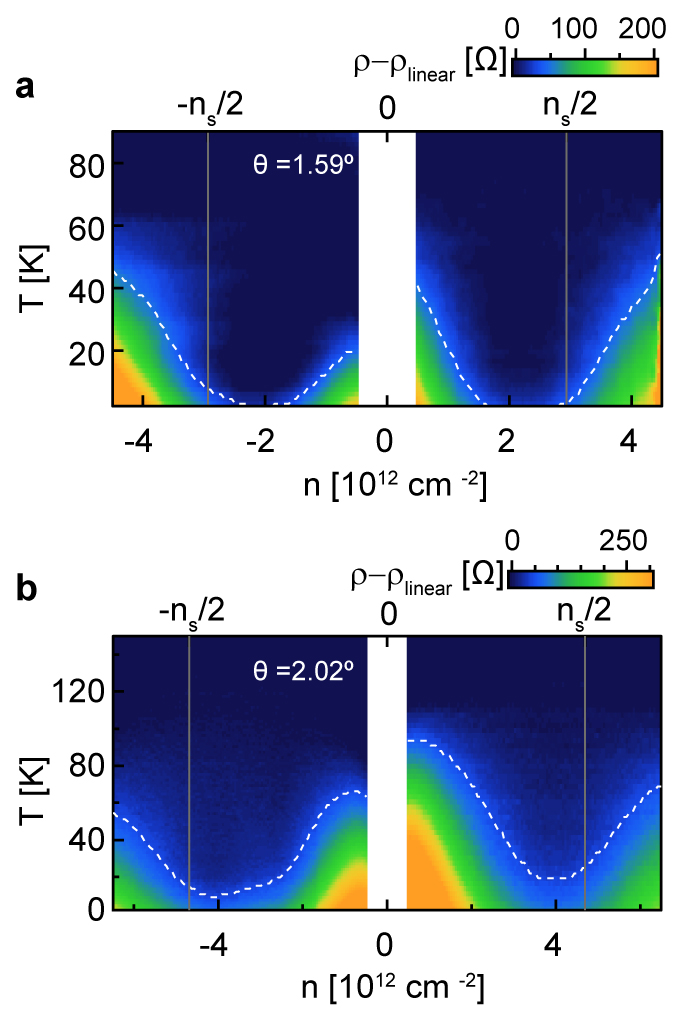
We first discuss the high-temperature regime. Fig. 2a shows for a 1.24∘ device in which no features associated with electronic correlations, such as partial band insulators or superconductors, are observed at low temperatures. Similar to the 1.06∘ device (Fig. 1a), we find that first grows with increasing temperature up to a temperature (dashed curve in Fig. 2a), where it peaks before dropping as is raised further. We find that is largest near the charge neutrality point (CNP), and shrinks rapidly near . Fig. 2b shows a map for a device with = 1.59∘, in which we observe a similar behavior but with larger at all carrier densities. The origin of the non-monotonicity of becomes evident in the response of the Hall coefficient, , plotted for the 1.24∘ device in Fig. 2c. At base temperature, the sign of switches at approximately , a featured associated with a Lifshitz transition at the van Hove singularity (vHs) in the tBLG band structure Kim et al. (2016a); Cao et al. (2016). However, we also find that evolves non-monotonically at fixed density as a function of , changing sign with increasing temperature for densities . Overlaying the density-dependent curve on the data, it can be seen that closely tracks the temperature beyond which the magnitude of the Hall coefficient grows rapidly (Fig. 2c).
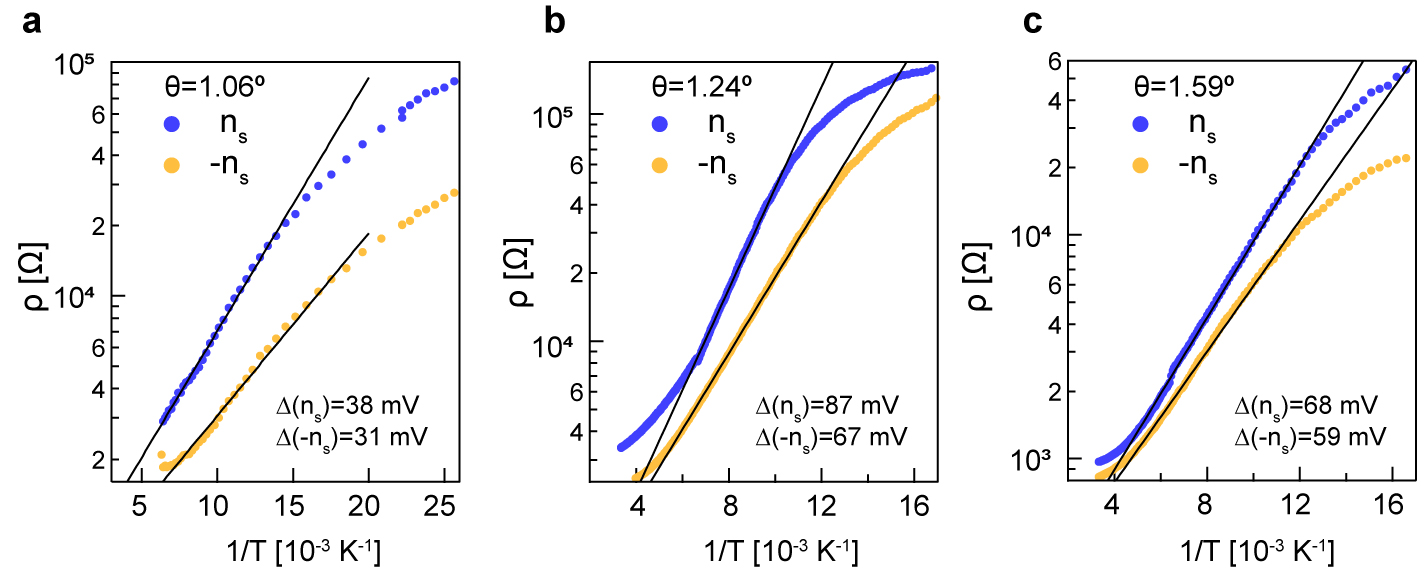
This observed behavior can be understood by considering the band structure of tBLG, which features low energy moiré subbands with small Fermi velocity. These bands are isolated from highly dispersive, higher energy subbands by sizable band gaps, which are predicted to arise in band structure calculations accounting for lattice relaxations Nam and Koshino (2017). We measure these gaps using thermal activation measurements (Fig. S7), finding that they are typically 30 - 90 meV, with the smallest gaps found in devices with twist angles near the magic angle (Fig. 2f). Fig. 2e shows a schematic of the tBLG band structure at two different twist angles. The correlation between and large changes in suggests that thermal activation of carriers to the dispersive bands plays a dominant role at high temperatures, with set by a combination of the bandwidth of the low-energy moiré subbands, the band gaps isolating the higher subbands, and the Fermi energy. Samples close to the magic angle have both smaller bandwidth and smaller band gaps, so that occurs at lower than in devices with larger twist angles.
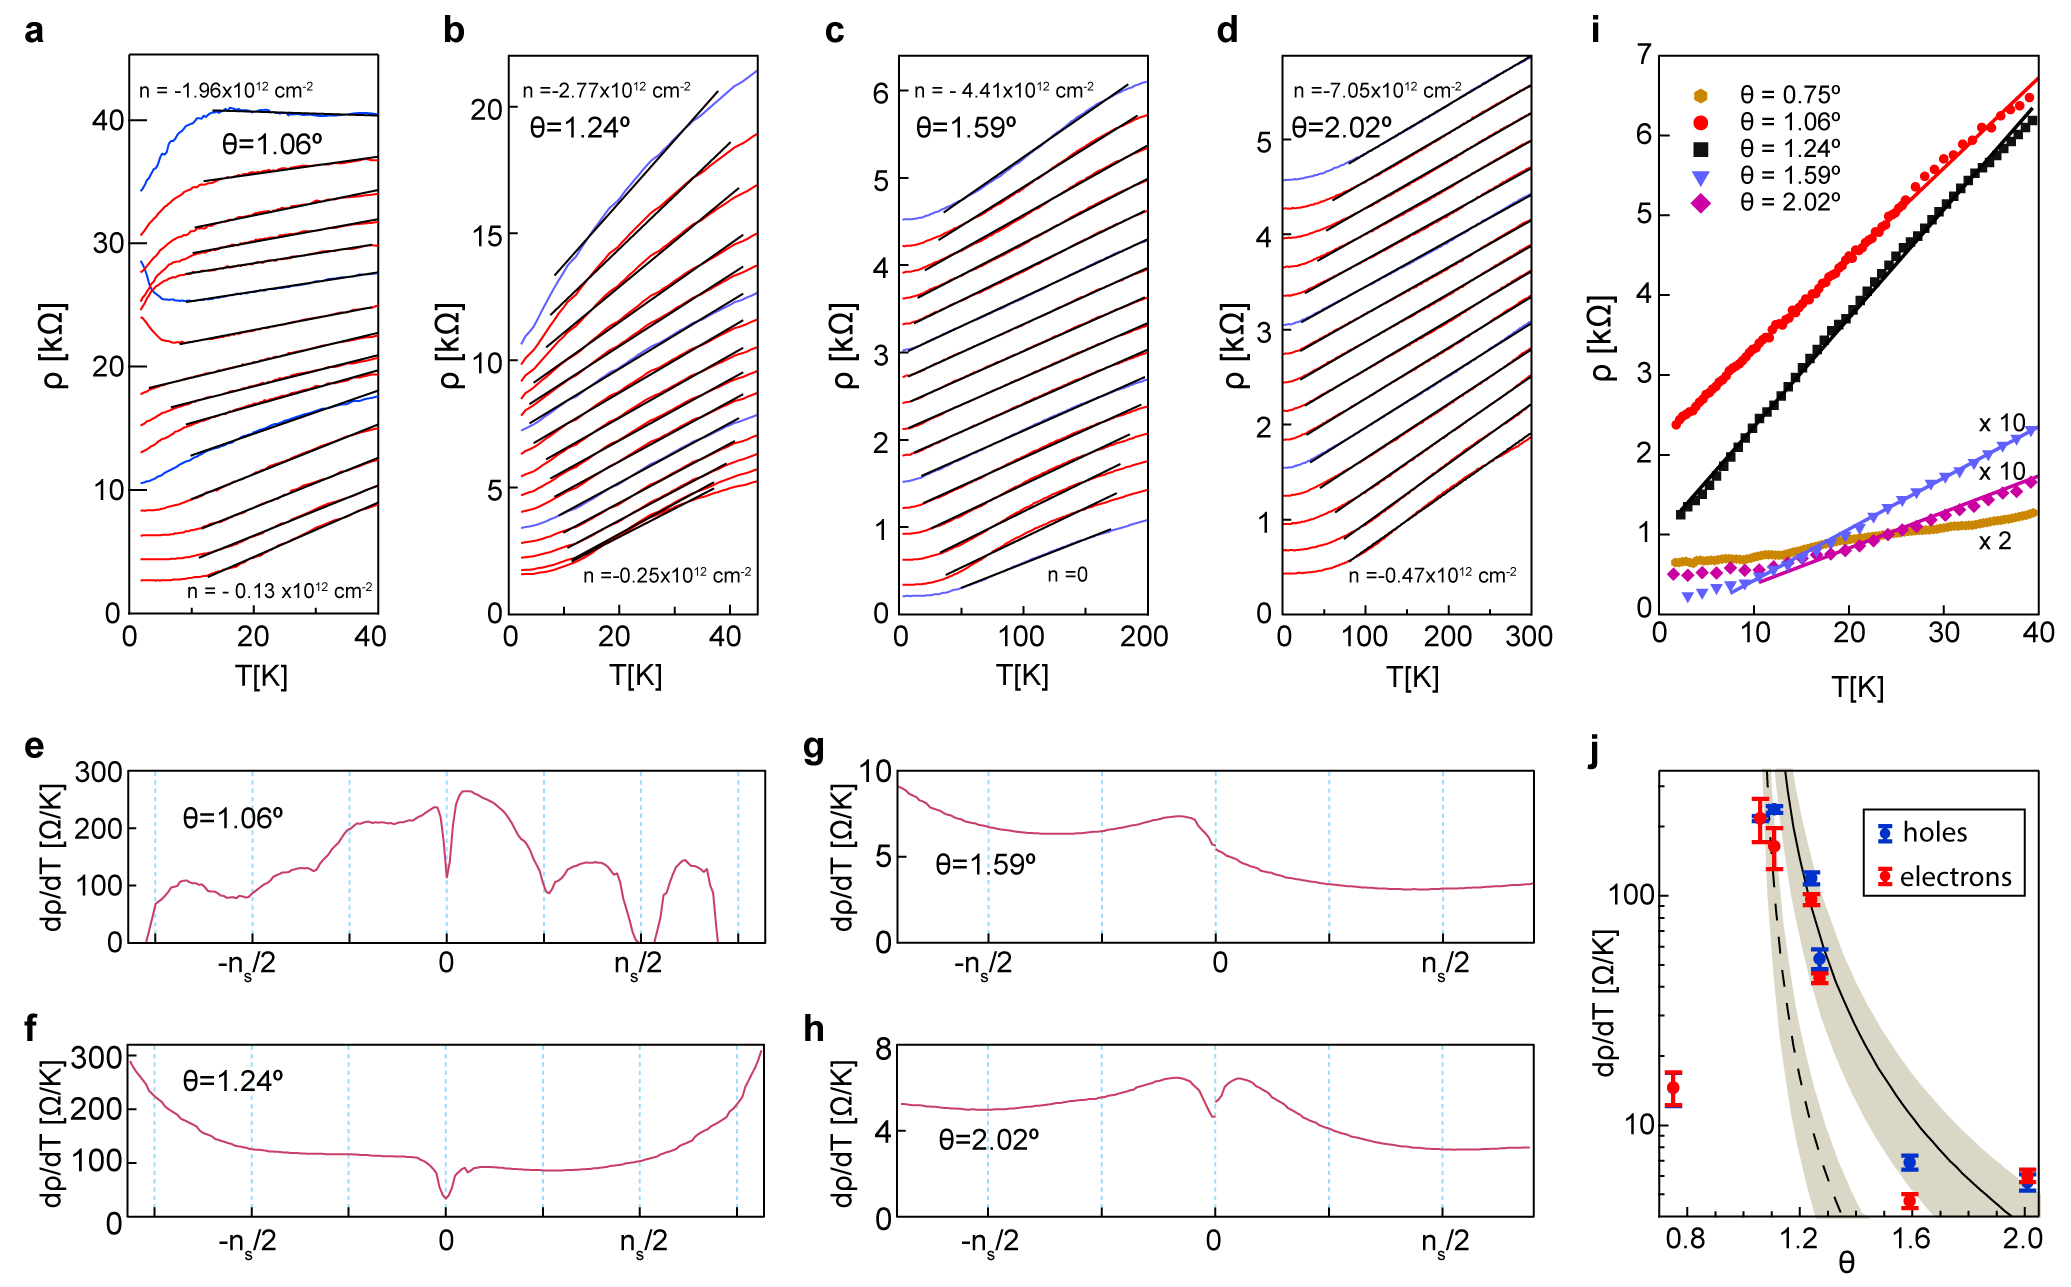
thus provides a cutoff; for , transport can be assumed to be restricted to the lowest electron- and hole-moiré subbands. Figs. 3a-d show in this regime across a wide range of carrier densities between the CNP and for four devices with 1.06∘, 1.24∘, 1.59∘, and 2.02∘, respectively. The black lines, which are linear fits to , are nearly parallel across all densities for all twist angles. A quantitative comparison of the linear slope versus density is shown in Figs. 3e-h. We note that we restrict our analysis of to densities since at higher densities, the insulating states at begin to significantly influence even at low temperatures. For devices at twist angles far from the flat band condition, is nearly constant with carrier density, although it is always slightly larger for holes than electrons. Flat band devices show somewhat more variation (Fig. 3e and Fig. S2), with step-like changes in around the quarter band fillings. Notably, signatures of commensuration with the lattice period, in the form of resistance peaks at integer multiples of —including those showing no features in the low temperature limit—are evident even at elevated temperatures 100 K, well above the onset of true insulating behavior (defined as ) at these fillings (Figs. 1a-b). Although we currently do not have a full understanding of these phenomena tied to the quarter band fillings, it appears they may share a common origin.
While the -linear behavior is qualitatively similar in all tBLG devices regardless of twist angle (Fig. 3i), the magnitude of varies strongly with . Fig. 3j shows as a function of twist angle for the 7 devices presented in this study, averaged over carrier densities cm-2. The magnitude of peaks for angles near the flat band condition (). To understand this effect, we begin by noting that a similar (albeit much weaker) high temperature -linear scaling of is also observed in monolayer graphene (MLG), where it is attributed to scattering of electrons by thermally populated acoustic phonons Chen et al. (2008); Dean et al. (2010); Hwang and Das Sarma (2008); Efetov and Kim (2010); Hwang and Das Sarma (2008); Efetov and Kim (2010). Notably, ranges between 5-300 /K in all tBLG samples we study — orders of magnitude larger than observed in MLG (/K). Theoretically, resistivity in the -linear regime due to quasielastic scattering of acoustic phonon modes with classical occupation probability is given by Wu et al. (2018b)
| (1) |
where is the deformation potential which describes the strength of electron-phonon coupling, and are the Fermi and phonon velocities, respectively, and kg/m2. counts the number of electron flavors, with in MLG and in TBLG, while the form-factor accounts for differing electron-phonon matrix elements and is unity for MLG and 0.5 for tBLG. According to Eq. 1, a simple origin for the large and twist-angle dependent observed in tBLG could be attributed to strong renormalization of near the magic angle, which appears squared in the denominator of .
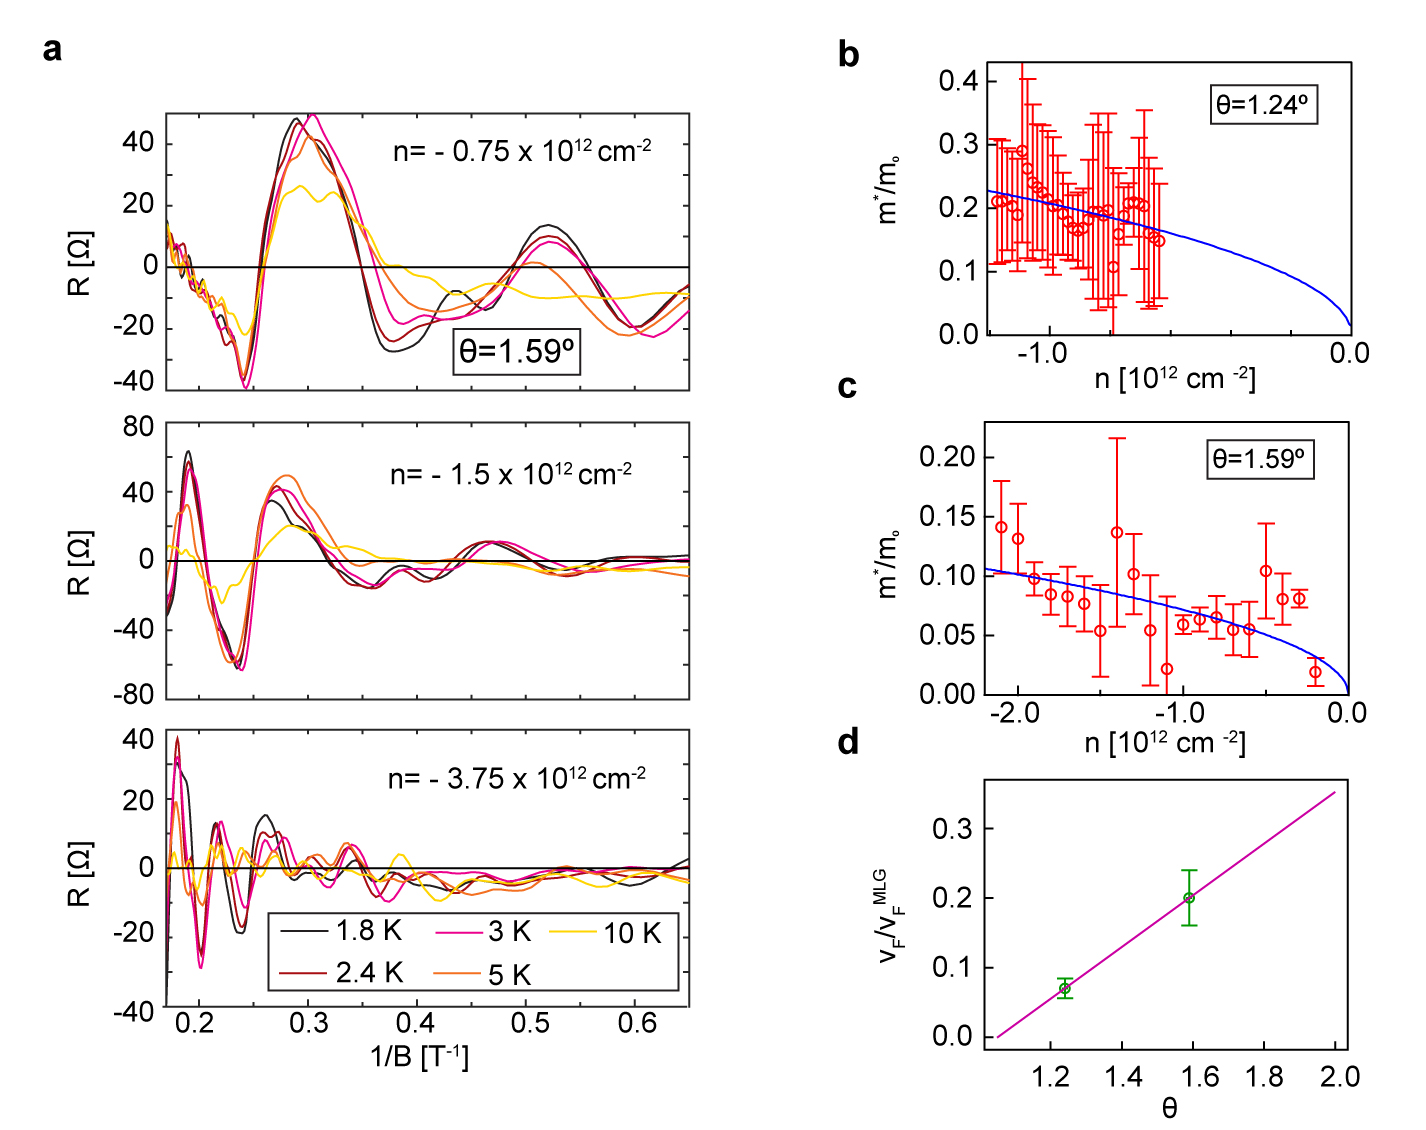
Eq. 1 contains three free parameters: , , and . To determine , we note that most theoretical models of tBLG predict that is approximately linear in near the flat band angle Bistritzer and MacDonald (2011). To fix the slope of this line, we experimentally determine for two devices with twist angles of 1.24∘ and 1.59∘ from temperature dependent measurements of low-magnetic field quantum oscillations (see Fig. S6). From these measurements, we find that m/sec. The dashed line in Fig. 3j shows a comparison of this theory taking eV and m/sec, consistent with MLG and graphite literature Komatsu (1964); Efetov and Kim (2010). The shaded region indicates the % bounds that follow from the experimental uncertainties in the monolayer , , and in our determination of .
While the theory is qualitatively consistent with the large increase in observed near the flat band condition, it quantitatively underestimates at all angles. However, quantitative agreement can be achieved if the tBLG deformation potential is somewhat larger, or the phonon velocity somewhat smaller, than in MLG. The solid line in Fig. 3j shows predicted with the model if is increased by a factor of 3 relative to MLG. Despite the simplicity of the acoustic phonon scattering model, it is successful in explaining the large enhancement of arising from the reduced Fermi velocity in tBLG, including at twist angles where electron correlations are not thought to play a significant role (1.24∘-2.02∘).
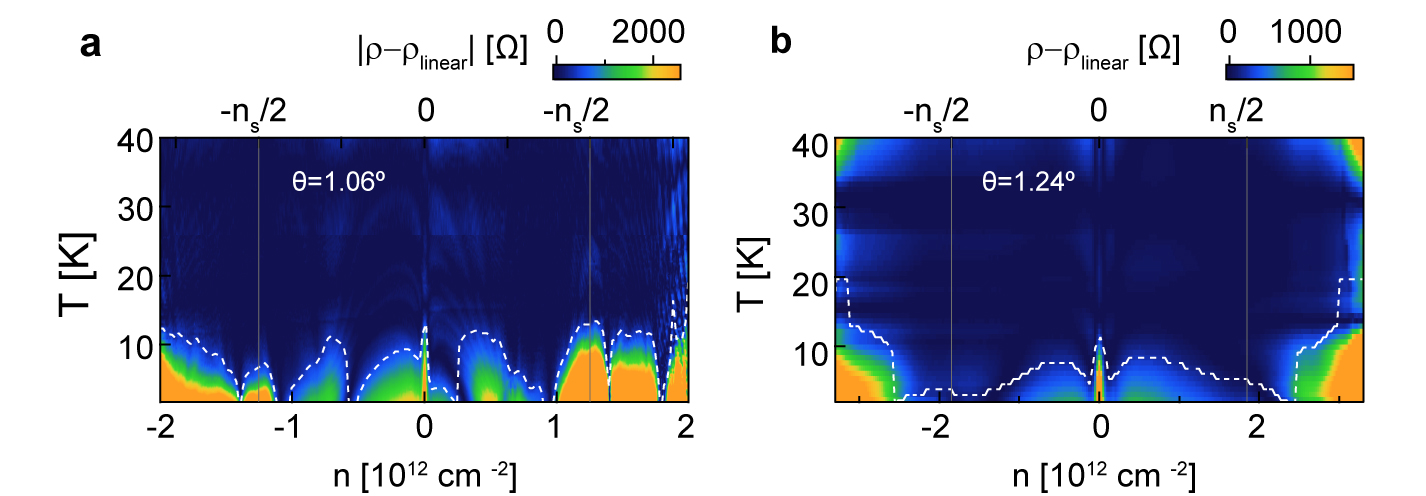
Finally, we address the behavior of in the low temperature limit. The fits to the intermediate temperature regime in Figs. 3a-d fail at low temperature, where saturates, decreases more quickly, or, in the case of correlated insulating states near the flat band condition, reverses sign. Due to the complications inherent to the low-temperature behavior of flat-band devices, we focus on the devices at 1.59∘ and 2.02∘ where no strong correlation-driven physics is observed at low temperature. Figs. 4a-b show the deviation from -linear behavior, , in devices with and 2.02∘, respectively, with the linear fit to the the intermediate temperature regime. We find that the lower limit of the -linear regime, (defined as the temperature where ) is minimal near in both of these devices. Simple modelling of electron-phonon scattering does not reproduce this observation. Theory predicts a crossover from -linear dependence to power law in the low temperature limit Hwang and Das Sarma (2008); Wu et al. (2018b), with the transition temperature, known as the Bloch-Grüneisen temperature, . In this picture, should be minimal near the CNP, contrasting with the experimental observation. We speculate that the behavior of may be related to the vHs in the band structure that occurs near half band filling. In flat band devices, is an erratic function of density, reflecting the complexity of the low-temperature phase diagram, but we note that it can persist to the base temperature of our measurement (1.6 K) for certain values of (Fig. S3).
In metals where the -linear resistivity arises entirely from electron-phonon scattering, experimentally measured provides a direct measurement of the dimensionless electron-phonon coupling through its relation to the transport scattering time via . Taking parameters for flat-band devices where Cao et al. (2018b), 200 /K, and electron density cm-2,
| (2) |
In many superconducting metals, agrees to within 20% with the electron-phonon coupling extracted from the superconducting transition temperature Allen (2000). Within a weak-coupling BCS theory is related to by
| (3) |
with a similar relation holding for the strong coupling limit McMillan (1968) of . In conventional metals, the energy scale is a fraction of the Debye temperature. However, in a flat-band system, the electronic states that can participate in superconductivity are limited by the bandwidth (), and it is natural to assume comparable to W 5 meV for tBLG near 1.1∘. Taking Eq. 3 with , phonon-driven superconductivity may be expected Wu et al. (2018c); Lian et al. (2018); Wu et al. (2018b) at temperatures of order the bandwidth, well above experimentally reported transition temperatures Cao et al. (2018b); Yankowitz et al. (2019).
Eq. 3 is unlikely to accurately predict the superconducting transition temperature in tBLG; it does not quantitatively account for the finite bandwidth, and ignores the Coulomb repulsion that suppresses superconductivity in metals. Other scattering mechanisms may also play a role in the high temperature transport Chung et al. (2018). For example, Umklapp scattering processes Wallbank et al. (2019) and collisions with higher energy optical phonons are all expected to increase resistivity at finite temperature in tBLG. Any of these would lower the estimate of the dimensionless acoustic phonon coupling , and thus of . However, our estimate highlights the plausibility of the observed superconductivity arising from electron-phonon interactions Lian et al. (2018); Wu et al. (2018a).
-linear resistivity has also been observed in a variety of strongly correlated materials in which band theory is thought to fail Bruin et al. (2013); Emery and Kivelson (1995), including many which become superconducting at low temperatures. In these materials, quantum critical fluctuations, rather than phonons, have been proposed as the dominant scattering mechanism leading to -linear behavior Zaanen (2004). Recently, similar ‘strange metal’ physics has been invoked to explain -linear resistivity observed in flat-band tBLG near densities at which correlated phases emerge at low temperature Cao et al. (2019). However, our observation of ubiquitous -linear behavior for all twist angles and all densities within the lowest moiré subband — independent of the presence of correlated phases at low temperature — points to a single, unified scattering mechanism unrelated to the electron correlation physics itself.
Methods
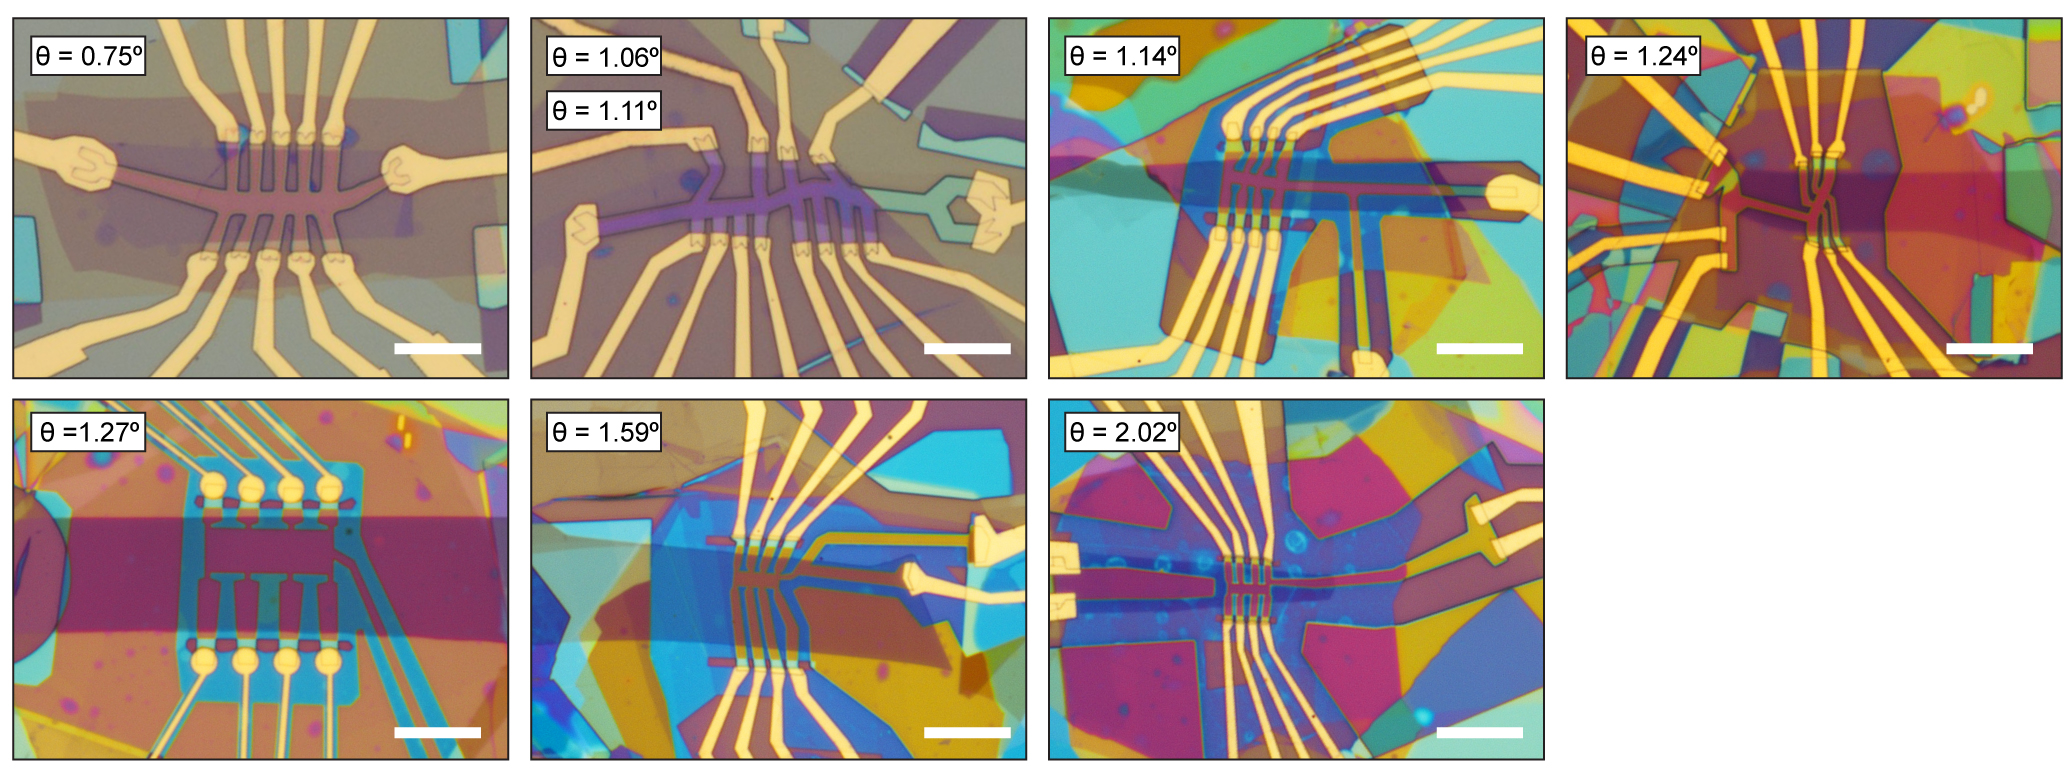
tBLG devices are fabricated using the “tear-and-stack” method Kim et al. (2016b). The devices consist of small-angle tBLG (0.75-2∘) encapsulated between flakes of hexagonal boron nitride (BN) with typical thickness of 25-50 nm. All devices have graphite top and bottom gates, except the devices with twist angles of 0.75∘, 1.06∘, and 1.11∘ which do not have a top gate. The use of graphite gates has previously been shown to result in very low charge inhomogeneity Zibrov et al. (2017). Samples are assembled using a standard dry transfer technique that utilizes a poly-propylene carbonate (PPC) film on top of a polydimethyl siloxane (PDMS) stamp Wang et al. (2013). Completed heterostructures are transferred onto a Si/SiO2 wafer. We avoid heating the sample above 180∘C during device processing to best preserve the intended twist angle between the two monolayer graphene flakes.
Transport measurements are conducted in a four-terminal geometry with typical ac current excitations of 1-10 nA using standard lock-in technique at 17.7 Hz. We gate the contact regions (which extend beyond the graphite bottom gate) to a high carrier density by applying a gate voltage to the Si (typically 5-50 V for SiO2 thickness of 285 nm) to reduce the contact resistance. For devices with large twist angles, a combination of the top and bottom gates is required achieve . In such cases, maps for electron- and hole-type doping are acquired separately (denoted by the black vertical line at in Fig. 2b), and consequentially the displacement field varies in addition to . However, we do not observe any significant modification of as a result.
The twist angle is determined from the values of charge carrier density at which the insulating states at are observed, following , where nm is the lattice constant of graphene. The values of are determined from the sequence of quantum oscillations in a magnetic field which project to (or for devices near the magic angle).
acknowledgments
The authors acknowledge discussions with L. Balents, T. Senthil, S. Das Sarma and F. Wu, and thank S. Das Sarma and F. Wu for sharing their unpublished theoretical results. Work at both Columbia and UCSB was funded by the Army Research Office under W911NF-17-1-0323. Sample device design and fabrication was partially supported by DoE Pro-QM EFRC (DE-SC0019443). AFY and CRD separately acknowledge the support of the David and Lucile Packard Foundation. K.W. and T.T. acknowledge support from the Elemental Strategy Initiative conducted by the MEXT, Japan and the CREST (JPMJCR15F3), JST. A portion of this work was carried out at the Kavli Institute of Theoretical Physics, Santa Barbara, supported by the National Science Foundation under Grant No. NSF PHY-1748958.
Author contributions
M.Y., S.C., H.P. and Y.Z. fabricated the devices. H.P., M.Y., and S.C. performed the measurements and analyzed the data. K.W. and T.T. grew the hBN crystals. C.R.D. and A.F.Y. advised on the experiments. The manuscript was written with input from all authors.
Competing interests
The authors declare no competing interests.
References
- Cao et al. (2018a) Y. Cao, V. Fatemi, A. Demir, S. Fang, S. L. Tomarken, J. Y. Luo, J. D. Sanchez-Yamagishi, K. Watanabe, T. Taniguchi, E. Kaxiras, R. C. Ashoori, and P. Jarillo-Herrero, Nature 556, 80 (2018a).
- Cao et al. (2018b) Y. Cao, V. Fatemi, S. Fang, K. Watanabe, T. Taniguchi, E. Kaxiras, and P. Jarillo-Herrero, Nature (2018b), 10.1038/nature26160.
- Yankowitz et al. (2019) M. Yankowitz, S. Chen, H. Polshyn, Y. Zhang, K. Watanabe, T. Taniguchi, D. Graf, A. F. Young, and C. R. Dean, Science , eaav1910 (2019).
- Sharpe et al. (2019) A. L. Sharpe, E. J. Fox, A. W. Barnard, J. Finney, K. Watanabe, T. Taniguchi, M. A. Kastner, and D. Goldhaber-Gordon, arXiv:1901.03520 [cond-mat] (2019), arXiv: 1901.03520.
- Efetov and Kim (2010) D. K. Efetov and P. Kim, Physical Review Letters 105, 256805 (2010).
- Bistritzer and MacDonald (2011) R. Bistritzer and A. H. MacDonald, Phys. Rev. B 84 (2011).
- Suárez Morell et al. (2010) E. Suárez Morell, J. D. Correa, P. Vargas, M. Pacheco, and Z. Barticevic, Physical Review B 82, 121407 (2010).
- Kim et al. (2017) K. Kim, A. DaSilva, S. Huang, B. Fallahazad, S. Larentis, T. Taniguchi, K. Watanabe, B. J. LeRoy, A. H. MacDonald, and E. Tutuc, Proceedings of the National Academy of Sciences 114, 3364 (2017).
- Wu et al. (2018a) F. Wu, A. H. MacDonald, and I. Martin, Phys. Rev. Lett. 121, 257001 (2018a).
- Lian et al. (2018) B. Lian, Z. Wang, and B. A. Bernevig, arXiv:1807.04382 [cond-mat] (2018), arXiv: 1807.04382.
- Allen (2000) P. B. Allen, in Handbook of Superconductivity, edited by C. P. P. Jr. (Academic Press, San Diego, 2000) pp. 478–489.
- Emery and Kivelson (1995) V. J. Emery and S. A. Kivelson, Physical Review Letters 74, 3253 (1995).
- Kim et al. (2016a) Y. Kim, P. Herlinger, P. Moon, M. Koshino, T. Taniguchi, K. Watanabe, and J. H. Smet, Nano Letters 16, 5053 (2016a).
- Cao et al. (2016) Y. Cao, J. Luo, V. Fatemi, S. Fang, J. Sanchez-Yamagishi, K. Watanabe, T. Taniguchi, E. Kaxiras, and P. Jarillo-Herrero, Physical Review Letters 117, 116804 (2016).
- Nam and Koshino (2017) N. N. T. Nam and M. Koshino, Physical Review B 96, 075311 (2017).
- Chen et al. (2008) J.-H. Chen, C. Jang, S. Xiao, M. Ishigami, and M. S. Fuhrer, Nature Nanotechnology 3, 206 (2008).
- Dean et al. (2010) C. R. Dean, A. F. Young, I. Meric, C. Lee, L. Wang, S. Sorgenfrei, K. Watanabe, T. Taniguchi, P. Kim, K. L. Shepard, and J. Hone, Nature Nanotechnology 5, 722 (2010).
- Hwang and Das Sarma (2008) E. H. Hwang and S. Das Sarma, Physical Review B 77, 115449 (2008).
- Wu et al. (2018b) F. Wu, E. Hwang, and S. D. Sarma, arXiv:1811.04920 [cond-mat] (2018b), arXiv: 1811.04920.
- Komatsu (1964) K. Komatsu, Journal of Physics and Chemistry of Solids 25, 707 (1964).
- McMillan (1968) W. L. McMillan, Physical Review 167, 331 (1968).
- Wu et al. (2018c) F. Wu, A. MacDonald, and I. Martin, Physical Review Letters 121, 257001 (2018c).
- Chung et al. (2018) T.-F. Chung, Y. Xu, and Y. P. Chen, Physical Review B 98, 035425 (2018).
- Wallbank et al. (2019) J. R. Wallbank, R. K. Kumar, M. Holwill, Z. Wang, G. H. Auton, J. Birkbeck, A. Mishchenko, L. A. Ponomarenko, K. Watanabe, T. Taniguchi, K. S. Novoselov, I. L. Aleiner, A. K. Geim, and V. I. Fal’ko, Nature Physics 15, 32 (2019).
- Bruin et al. (2013) J. a. N. Bruin, H. Sakai, R. S. Perry, and A. P. Mackenzie, Science 339, 804 (2013).
- Zaanen (2004) J. Zaanen, Nature 430, 512 (2004).
- Cao et al. (2019) Y. Cao, D. Chowdhury, D. Rodan-Legrain, O. Rubies-Bigordà, K. Watanabe, T. Taniguchi, T. Senthil, and P. Jarillo-Herrero, arXiv:1901.03710 [cond-mat] (2019), arXiv: 1901.03710.
- Kim et al. (2016b) K. Kim, M. Yankowitz, B. Fallahazad, S. Kang, H. C. P. Movva, S. Huang, S. Larentis, C. M. Corbet, T. Taniguchi, K. Watanabe, S. K. Banerjee, B. J. LeRoy, and E. Tutuc, Nano Letters 16, 1989 (2016b).
- Zibrov et al. (2017) A. A. Zibrov, C. Kometter, H. Zhou, E. M. Spanton, T. Taniguchi, K. Watanabe, M. P. Zaletel, and A. F. Young, Nature 549, 360 (2017).
- Wang et al. (2013) L. Wang, I. Meric, P. Y. Huang, Q. Gao, Y. Gao, H. Tran, T. Taniguchi, K. Watanabe, L. M. Campos, D. A. Muller, J. Guo, P. Kim, J. Hone, K. L. Shepard, and C. R. Dean, Science 342, 614 (2013).
Supplementary Information
S1 Properties of magic angle devices
We examine three tBLG devices near the magic angle, with twist angles of 1.06∘, 1.11∘ and 1.14∘. Optical images of these and other devices are shown in Fig. S1. The low temperature characterization of superconducting and correlated insulating states for these devices was previously reported in Ref. Yankowitz et al. (2019). The 1.06∘ and 1.11∘ devices are independent sections of a large multi-contact device (D5 in Ref. Yankowitz et al. (2019)) in which we observe superconductivity with 0.9 K. We note that we report the values of resistance instead of resistivity for the 1.14∘ device (D1 in Ref. Yankowitz et al. (2019)) because this devices was measured in psuedo-Van der Pauw geometry that precludes an exact conversion from to .
Fig. S2a-c show maps ( for the 1.14∘ device). All three devices exhibit similar behaviour. At low temperatures we observe insulating states at , as well as resistive or insulating states at partial band filling. At high temperatures, the devices are most resistive closer to the CNP. Figs. S2d-f show curves taken at selected partial band fillings between 0 and . Over the intermediate temperature range, we observe for all . The top panels of Figs. S2d-f show the corresponding , while the bottom panels show the residual resistivity, , defined as the intercept of linear fits at . Both and show sharp step-like jumps every time the carrier density crosses a multiple of filling of the band. In general, decreases and increases with almost every such step away from CNP in both directions. Presently, we do not have a complete understanding of the origin of this effect.
Fig. S3a shows the deviation of the resistivity from -linear behaviour in the 1.06∘ device at low temperatures. The deviation is shown as the difference between and an interpolation value of , obtained from fitting the -linear behaviour at higher temperatures. The low temperature shows a complicated dependence on , and changes qualitatively across each quarter-filling of the band. The -linear behavior persists to the lowest temperatures near the half-filling of the band (. We observe qualitatively similar behavior in all our devices, with a comparable plots for the 1.59∘ device and the 2.02∘ device shown in Fig. 4 of the main text.
S2 Properties of non-magic angle devices
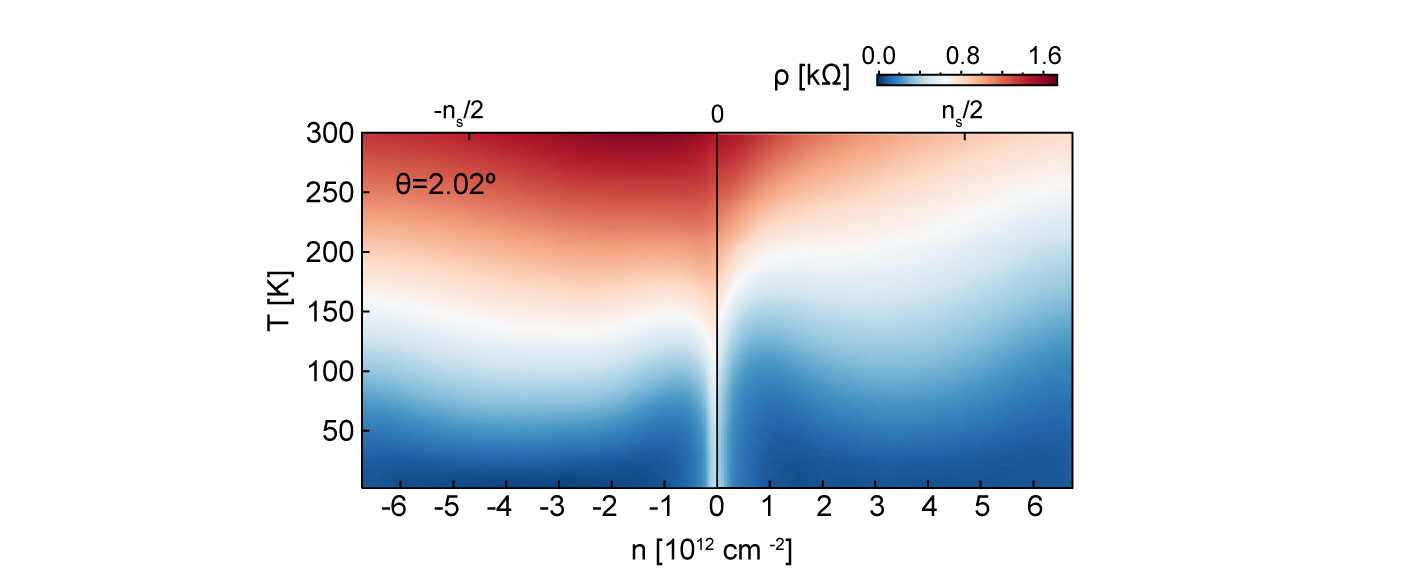
Figure S4 shows the map for the 2.02∘ device. Notably, over the accessible range of and we no longer observe the “high-temperature” regime at this angle (i.e. 300 K at all accessible ).
Fig. S5a shows a map for the 0.75∘ device. This device exhibits considerably different phenomenology than devices with larger twist angles (). At the lowest measured temperature, there is a strong peak in at the CNP, but only very weak peaks at . We observe a -linear dependence in for , with 5 /K (Figs. S5b-c). There is a more complicated dependence at lower , which is likely the result of dominant thermal activation processes arising from the small bandwidth and absence of band gaps isolating the lowest moiré subbands.
S3 Measurement of and
We measure the effective mass as a function of in the devices with twist angles of 1.24∘ and 1.59∘ by fitting the temperature dependence of the amplitude of Shubnikov–-de Haas quantum oscillations using the Lifshitz-Kosevich formula:
| (S1) |
where . In order to isolate the amplitude of quantum oscillations from the other contributions to resistance, we first remove a background from the curves by subtracting a polynomial fit to the data. The resulting curves at several are shown in Fig. S6a.
For each , we extract the amplitude of the most prominent peak at various and fit to Eq. S1. The resulting values of are shown in Fig. S6b-c. We extract by fitting to a Dirac dispersion expression . We find a Fermi velocity of m/s for the 1.24∘ device and m/s for the 1.59∘ device. While the random error of is moderate (%), we anticipate a considerable additional systematic error due to the background subtraction procedure used to isolate . We estimate the total error for measurement to be %. In order to estimate the Fermi velocity for devices with other twist angles we linearly extrapolate the measured values of , as shown in Fig. S6d. This yields the following dependence on twist angle:
| (S2) |
