Critical Opalescence across the Doping Driven Mott Transition in Optical Lattices of Ultracold Atoms
Abstract
Phase transitions and their associated crossovers are imprinted in the behavior of fluctuations. Motivated by recent experiments on ultracold atoms in optical lattices, we compute the thermodynamic density fluctuations of the two-dimensional fermionic Hubbard model with plaquette cellular dynamical mean-field theory. To understand the length scale of these fluctuations, we separate the local from the nonlocal contributions to . We determine the effects of particle statistics, interaction strength , temperature and density . At high temperature, our theoretical framework reproduces the experimental observations in the doping-driven crossover regime between metal and Mott insulator. At low temperature, there is an increase of thermodynamic density fluctuations, analog to critical opalescence, accompanied by a surprising reduction of the absolute value of their nonlocal contributions. This is a precursory sign of an underlying phase transition between a pseudogap phase and a metallic phase in doped Mott insulators, which should play an important role in the cuprate high-temperature superconductors. Predictions for ultracold atom experiments are made.
I Introduction
Theoretical models that can give, with minimal assumptions, insights on how complex behaviors and structures emerge in natural phenomena are particularly appealing. The Hubbard model for strongly interacting electrons on a lattice is such a model. It contains the competition between a kinetic energy term, that describes the delocalisation of particles on a lattice, and an on-site repulsive interaction term, that favors instead particle localisation. As a prominent example, this model has long helped to describe the Mott transition Mott (1974); Imada et al. (1998), where electron-electron repulsion turns a metal into an insulator. It has also helped to throw light on how complex phases of matter in quantum materials, such as cuprate high-temperature superconductors Anderson (1987); Lee et al. (2006); Tremblay et al. (2006), arise from strong interactions.
Nevertheless, correlated electron systems pose fundamental challenges to many-particle quantum theory since even a minimal model such as the Hubbard model is hard to solve or simulate Troyer and Wiese (2005). Ultracold atoms in optical lattices have emerged as a useful platform for implementing the Hubbard model and thereby for performing “quantum simulations” of interacting quantum systems Gross and Bloch (2017); Bloch et al. (2008); Jaksch and Zoller (2005); Lewenstein et al. (2007); Esslinger (2010). The synergy between advances such as single atom microscopy Bakr et al. (2009); Sherson et al. (2010); Cheuk et al. (2015); Haller et al. (2015); Parsons et al. (2015); Omran et al. (2015); Edge et al. (2015) in ultracold atom experiments and theoretical research is leading to a better understanding of the phase diagram of the Hubbard model. Important milestones include the observation of the Mott insulating phase Jordens et al. (2008); Schneider et al. (2008); Cheuk et al. (2016a); Greif et al. (2016), the measure of the equation of state Cocchi et al. (2016); Hofrichter et al. (2016), the detection of short-range spin and charge correlations Cheuk et al. (2016b); Parsons et al. (2016); Boll et al. (2016); Drewes et al. (2016, 2017) and their implication for transport properties Nichols et al. (2018); Brown et al. (2019), the measure of entanglement Islam et al. (2015); Cocchi et al. (2017); Walsh et al. (2019a, b), and the observation of long-range antiferromagnetism Mazurenko et al. (2017).
A central programme of the synergic effort in theory and experiments with ultracold atoms is the investigation of the Hubbard model in two dimensions. This is motivated by the link to the physics of cuprate high-temperature supercondutors. These materials are doped Mott insulator whose important properties should be captured by this model.
In cold atoms investigations, density fluctuations measured through single-atom microscopy have emerged as a powerful tool Müller et al. (2010); Sanner et al. (2010); Drewes et al. (2016) to detect and characterize phase transitions and crossovers, and hence to throw new light on the phase diagram of the Hubbard model. For example, experiments in Ref. Drewes et al., 2016 compared thermodynamic and local density fluctuations, unveiling a clear metal to Mott insulator crossover as a function of particle density (or doping): in the Mott insulating state thermodynamic and local fluctuations are both suppressed, whereas in the metallic state density fluctuations of all length scale, and not only local ones, contribute to the thermodynamic fluctuations.
What happens to this metal to Mott insulator crossover at much lower temperatures? While such temperatures are currently inaccessible experimentally, this may change soon. Similarly, what happens to crossovers as a function of doping? The answer to this question bears key implications for the physics of the cuprates. Upon doping the Mott insulator, a pseudogap phase emerges. The nature of this phase is under intense scrutiny in cuprates. Based on recent theoretical work Sordi et al. (2010, 2011, 2012a) with the cellular extension Maier et al. (2005); Kotliar et al. (2006); Tremblay et al. (2006) of dynamical mean-field theory Georges et al. (1996) (CDMFT), the key qualitative feature of the temperature-doping phase diagram of the two-dimensional Hubbard model is a finite-temperature and finite-doping first-order transition between a metal at low density and a pseudogap at high density Sordi et al. (2010, 2011), which ends in a second-order critical endpoint from which a sharp crossover, called Widom line, emerges up to high temperatures Sordi et al. (2012a). The defining feature of the critical endpoint is the divergence of the correlation length , while the Widom line is the locus of the maxima of in the supercritical region. Now, density fluctuations are sensitive to , and hence they are expected to be sensitive signatures of both the endpoint and of the associated Widom line.
These signatures are the focus of this paper. We calculate separately the local and nonlocal contributions to density fluctuations for the square lattice near-neighbor two-dimensional Hubbard model using CDMFT, spanning two decades in temperatures, ranging from temperatures accessible to experiment down to the lower temperatures needed to detect the first-order transition. In Section III we first analyze the density fluctuations at temperatures accessible to experiments, and then compare them with the available experimental data of Ref. Drewes et al., 2016. The excellent agreement between theory and experiment proves the accuracy of our approach and provides a strong framework to interpret current experiments. In Section IV, we then compute the density fluctuations at low temperatures, making predictions in Sec. V that may allow experiments to detect the Widom line, critical endpoint and first-order transition. The low-temperature predictions are robust but qualitative since a highly frustrated lattice should be used to avoid magnetic phase transitions. The fermion sign problem prevents us from computing on such lattices.
II Model and method
We consider the one-band two-dimensional Hubbard model on a square lattice. Its Hamiltonian reads
| (1) |
where is the hopping between first neighbors (and sets our energy units), is the repulsive on-site interaction, and is the chemical potential. The operators respectively create and destroy a fermion with spin at site , and is the number operator. We solve this model using plaquette cellular DMFT Maier et al. (2005); Kotliar et al. (2006); Tremblay et al. (2006). This method selects a cluster of lattice sites - here we consider a plaquette - and replaces the missing lattice environment with a self-consistent bath of noninteracting fermions. We solve the cluster in a bath problem with continuous-time quantum Monte Carlo in the hybridisation expansion (CT-HYB) Gull et al. (2011). Here we focus on the normal state only, where there is an equal number of fermions with spins up and down and the spin alignments have short range correlations but no long range order. We map out the phase diagram of Eq. 1 as a function of occupation and interaction strength for two decades in temperatures, from down to . 111Our CDMFT calculations required a large computation investment. At high temperature (e.g. ), one CDMFT iteration took about minutes on processors. At low temperature (e.g. ), the computational effort increases, and one CDMFT iteration took about 1 hour on processors. We normally reached convergence within CDMFT iterations, but close to phase boundaries and the Widom line hundreds of iterations were necessary. Once convergence is reached, averages were taken over at least the last CDMFT iterations (and up to hundreds close to phase boundaries). The resulting root mean square deviation on local quantities such as and that were needed to compute the density fluctuations were on the fifth digit.
III Density fluctuations: definitions and comparison with available experiments
To extract the density fluctuations, we follow a protocol similar to the experimental work of Drewes et al. Drewes et al. (2016). We first summarize this protocol by considering temperatures accessible to current experiments and by comparing our results to the experimental findings of Ref. Drewes et al. (2016). Then in Sec. IV that follows, we extend our analysis to lower temperatures to discuss enhanced density fluctuations in proximity to a critical point at finite and which may be detected in future experiments.
III.1 Thermodynamic fluctuations
First, consider thermodynamic density fluctuations. The simplest measure of these fluctuations is the variance of the number of fermions in the area : . The fluctuation-dissipation theorem
| (2) |
links the thermodynamic fluctuations to the charge compressibility , where is the particle density. From the isothermal occupation curve we extract by numerical derivative, and hence using Eq. 2 we obtain .
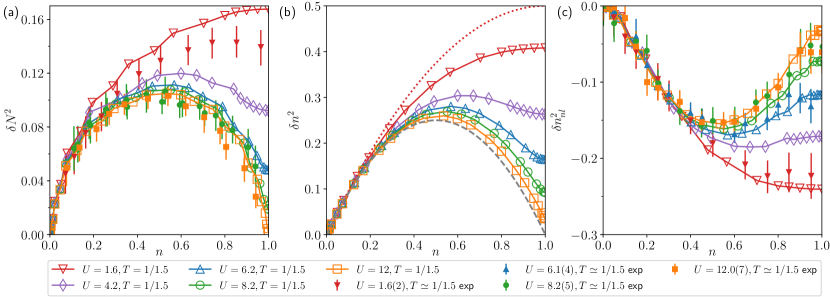
Figure 1(a) shows the thermodynamic fluctuations as a function of for different values of the interaction strength . Our data are taken at temperature , which is close to the lowest temperature that can be reached in current experiments.
We point out three interesting features. First, there is excellent agreement between our calculations (open symbols) and the experimental results of Ref. Drewes et al. (2016) (full symbols). Second, the variance is much smaller than expected from the density (i.e., ), implying sub-Poissonian statistics. This occurs even in the noninteracting case . Indeed, as noticed in previous work Müller et al. (2010); Sanner et al. (2010); Drewes et al. (2016); Cheuk et al. (2016b), this suppression of the thermodynamic density fluctuations at is a consequence of the Pauli exclusion principle. According to this principle, two fermions cannot occupy the same quantum state, which in real space means that fermions ‘avoid each other’, or ‘antibunch’, thereby suppressing the density fluctuations. This sharply differs from the ideal classical gas, for which , and hence, from the fluctuation-dissipation theorem Eq. 2, , i.e. Poissonian statistics. Third, the suppression of thermodynamic density fluctuations due to Pauli principle is further enhanced by interactions. Indeed, the interaction strength further reduces . As expected, the closer the occupation is to half filling , the larger the effect of . Above the critical interaction where the system becomes an insulator at half-filling, the thermodynamic density fluctuations are strongly suppressed until they vanish completely at zero temperature, reflecting the incompressible nature of the Mott insulating state ().
III.2 Local and nonlocal density fluctuations
Next, we consider the length scales of the density fluctuations. From the definition of the occupation in a translationally invariant system, one has Zhou and Ho (2011):
| (3) |
Therefore, using the fluctuation-dissipation theorem Eq. 2, the density fluctuations at all length scales are included in . Eq. 3 thus suggests to write the thermodynamic fluctuations as the sum of local fluctuations and nonlocal fluctuations Duchon et al. (2012); Drewes et al. (2016): . For our two-dimensional lattice, Eq. 3 reads:
| (4) |
so
| (5) |
where we have identified with . Now the local (onsite) density fluctuations can be calculated explicitly:
| (6) |
where is the density, is the spin-resolved density, and is the double occupancy. So, the nonlocal fluctuations
| (7) |
can be obtained as the difference between the thermodynamic and local fluctuations.
Figure 1(b) and Figure 1(c) show the local and nonlocal fluctuations and respectively as a function of for the same model parameters as Fig. 1(a). Again our calculations (open symbols) and the experimental data of Ref. Drewes et al. (2016) (full symbols) are in excellent agreement, as shown in Figure 1(c). The behavior of the local (onsite) fluctuations in Figure 1(b) can be understood by considering the and the limits. For , , so (red dotted line), which is a monotonically increasing function of . For , , so (gray dashed line), which is a non-monotonic function of . Therefore, the effect of is to strongly reduce the local density fluctuations, especially close to half filling.
By comparing the overall magnitude of in Figure 1(a) and in Figure 1(b), we find that the inequality is satisfied over the whole range of fillings : clearly, the local fluctuations do not account for all thermodynamic fluctuations, which also comprise nonlocal fluctuations that are negative and of comparable magnitude. Fig. 1(c) shows the filling dependence of calculated with Eq. 7. These negative contributions to lead to sub-Poissonian statistics. As described in previous work Cheuk et al. (2016b); Cheuk (2017), the behavior of is controlled by the competing effects of Fermi statistics, which dominates for low density and small values of , and superexchange, which conversely dominates for large values of and upon approaching half filling.
More specifically, for , nonlocal correlations arise from the Pauli principle that keeps apart fermions with the same spin, so fermions move in a way to ‘avoid each other’, or antibunch. This causes a suppression in charge density in the vicinity of any fermion, and this charge suppression can be thought of as a hole, and is usually called exchange or Pauli hole. At low density, the interaction strength can enhance this antibunching effect, giving rise to what is known as a correlation hole Mahan (2000). As a result, from low to moderate density, , grows in absolute value, i.e. becomes more negative, with increasing density since there are more fermions in the lattice and thus the average fermion spacing decreases with increasing and the antibunching effect becomes more pronounced. In that range of filling, does not vary much with increasing .
By contrast, from moderate density up to half filling, , has an appreciable effect. We see in Figure 1(c) that as increases, decreases in absolute value, i.e. become less negative. This is because upon approaching half filling , the interaction strength reduces the double occupancies, so the fermions become more localised around their sites, meaning that the charge becomes frozen. In that region near half-filling, and at large , another way to understand negative non-local correlations is to realize that they contribute to lower the energy through superexchange . Indeed, comes from virtual double occupation produced by a fermion leaving a hole behind and hopping on a site occupied by a fermion of opposite spin. Effectively, this creates correlations between empty sites (holons) and doubly occupied sites (doublons) on neighboring sites 222Virtual processes occur across a bond between neighboring sites of the lattice. It is intriguing that the virtual process description becomes consistent near , the classical bond-percolation threshold of the two-dimensional square lattice.. Holons and doublons are then close together, or ‘bunched’, i.e. they form quasi-bound states that lead to negative near-neighbor correlations as can be seen from the definition of nonlocal fluctuations: when there is a virtual double occupancy, then a neighboring site will be empty and the product will be zero so that the contribution of that process to will be negative. However, since is inversely proportional to , the larger the value of , the weaker this doublon-holon correlation since there is no more energy gain associated with virtual hops. Eventually then, non-local fluctuations decrease with increasing . In the Mott insulating state at large and , thermodynamic fluctuations essentially become local fluctuations. This description is complementary to the explanation in Refs. Cheuk et al. (2016b); Cheuk (2017) and Ref. Drewes et al. (2016). The doublon-holon correlations are also important in spin transport Nichols et al. (2018).
III.3 Temperature dependence of nonlocal density fluctuations
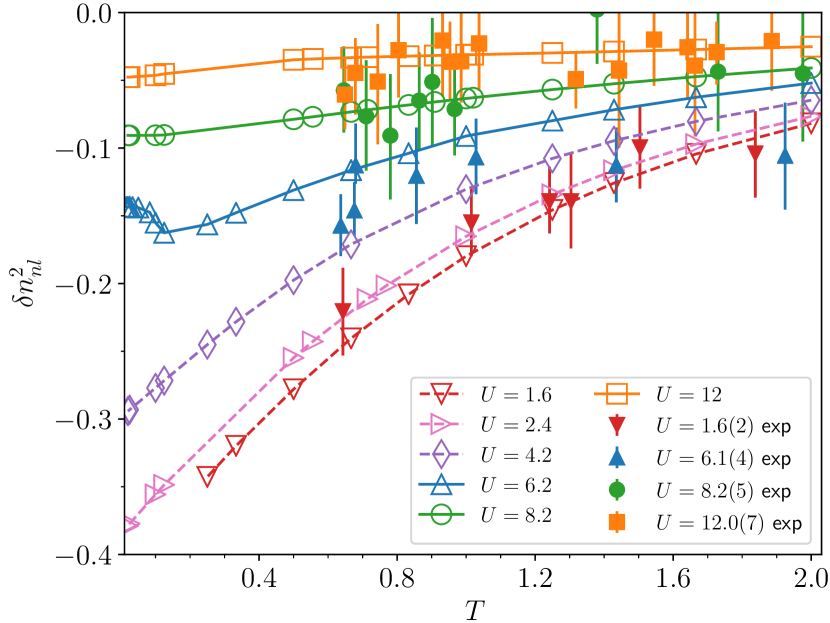
Up to now we considered one temperature only, , which is close to the lowest temperature reached by ultracold atom experiments in Ref. Drewes et al. (2016). Further insight can be gained from the temperature evolution of the nonlocal fluctuations . Figure 2 shows as a function of temperature for different values of , at half-filling . An important finding of Ref. Drewes et al. (2016) is that nonlocal fluctuations decrease in absolute value upon increasing (see experimental data in our Fig. 2). Physically, this is because with increasing the De Broglie thermal wavelength becomes smaller than the average distance between fermions, freezing nonlocal quantum fluctuations, hence recovering classical Poissonian statistics.
Our results in the temperature range , displayed in Fig. 2, confirm this behavior and are in good quantitative agreement with experimental data (solid symbols). Furthermore, in our CDMFT simulations we can access lower temperatures than those experimentally available. In a metallic state, for , remains a monotonic function of at all temperatures and thus becomes more negative with decreasing . In sharp contrast, for , a new temperature scale emerges where becomes less negative or saturates at low temperature. This occurs because the system is entering the Mott insulating state as the temperature is reduced. Hence, states become more localized, or from another point of view, the doublon-holon correlations lead to a reduction of the magnitude of the nonlocal correlations.
Far away from half filling, , the system is metallic and Ref. Drewes et al. (2016) demonstrates that is a monotonic function of , as for the case at shown in Fig. 2. Thus in a metallic state it is the De Broglie thermal wavelength that controls the temperature behavior of . In the next section we show that, for and (so in a doped Mott insulator), a novel emergent phenomenon due to the interplay of Mott physics and short-range correlations is controlling the low temperature behavior of .
IV Density fluctuations across the doping driven Mott transition
In this section we analyze the behavior of the density fluctuations at temperatures lower than those reached by current experiments.
IV.1 First-order transition, critical point, and Widom line
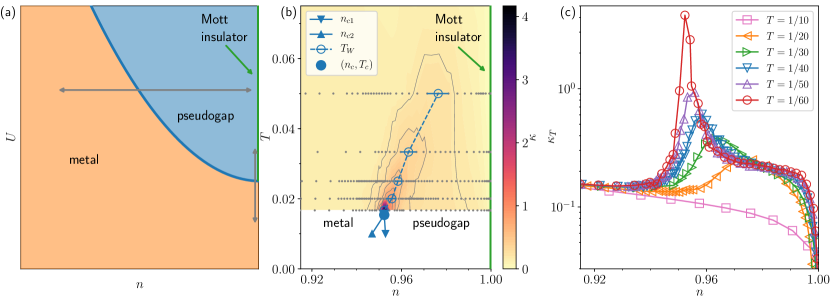
According to previous theoretical work with plaquette CDMFT Sordi et al. (2010, 2011), the key qualitative feature of the phase diagram of the normal state two-dimensional Hubbard model is a low-temperature first-order transition extending from half filling to away from half filling, as sketched with a blue line in the phase diagram in Figure 3(a). At this transition separates a metal from a Mott insulator as increases (this corresponds to the familiar driven Mott transition). For this transition separates two metallic states: as is lowered, one moves from a strongly correlated metal with a pseudogap to a correlated metal.
Adding the temperature axis, the first-order transition line in the phase diagram of Fig. 3(a) becomes a surface of first-order transition in the space. Upon increasing , this surface ends in a second order critical line, from which a crossover emerges. A slice of the space at constant , with , thus gives rise to the phase diagram of Fig. 3(b), which contains our CDMFT results for (i.e. a value of the interaction slightly larger than the critical threshold for obtaining a Mott insulator at ). The first-order transition is delimited by the spinodal lines and (line with solid triangles), where the pseudogap phase and the metallic phase cease to exist, respectively. This first-order transition ends in a second order critical endpoint at ( in units of the bare half-bandwidth), from which a rapid crossover, known as Widom line Xu et al. (2005); McMillan and Stanley (2010), emerges. The endpoint is defined as the location of the divergence of the correlation length and the Widom line as the locus of maxima of the correlation length. As increases, the critical temperature decreases rapidly while the corresponding critical filling increases. While the first-order transition may be masked by long-range ordered phases at low temperature, one expects that in frustrated systems the Widom line will continue to describe high-temperature crossovers.
Operationally we construct the Widom line with the local maxima of the isothermal charge compressibility as a function of (blue dashed line in Fig. 3(b)). As shown in Fig. 3(c), the rather featureless at high temperature develops a broad peak that narrows and grows rapidly in intensity as decreases towards , where diverges. Hence, a region of enhanced charge compressibility emanates from the endpoint into the supercritical region (see Fig. 3(b) and Fig. 3(c)), all the way up to Sordi et al. (2012a). Crossing the Widom line along isotherms or along paths at constant produces sharp but continuous changes in the thermodynamic Sordi et al. (2012a) properties, such as compressibility, dynamic Sordi et al. (2012a) properties such as the local density of states, and transport properties such as -axis resistivity Sordi et al. (2013). In the following, we focus on the changes of the density fluctuations upon crossing the Widom line.
IV.2 Critical opalescence
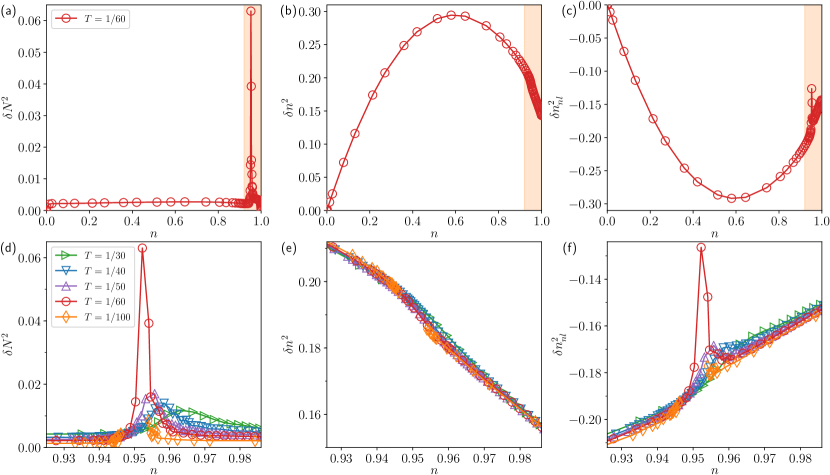
A defining feature of the critical point is the divergence of the correlation length , which quantifies the characteristic distance over which fermion-density fluctuations are correlated. The divergence of is linked to the development of fluctuations in the density at all scale up to infinity, leading to the well known phenomenon of critical opalescence: physically, in our case, this means that any two fermion-density fluctuations are correlated, no matter the distance between them. Thus the thermodynamic fluctuations are expected to diverge. The fluctuation-dissipation theorem associates the divergence of with the divergence of . This expectation is fully confirmed by the calculation of for different temperatures at , as shown in Figs. 4(a)(d). Away from half-filling, in the region [shaded region in Fig. 4(a)], the thermodynamic fluctuations show an anomalous peak that narrows in size and increases in magnitude as the endpoint is approached from above (see Fig. 4(d)). It extends up to or . The position of these peaks are the same of those defining the Widom line. Detection of this non monotonic behavior is a precursor of the endpoint. This behavior is not surprising since we used the fluctuation-dissipation theorem Eq. 2 to calculate , and diverges at (Fig. 3(b) and Ref. Sordi et al. (2012a) for a detailed discussion).
IV.3 Local and nonlocal fluctuations near criticality
Since the pioneering work of Kadanoff Kadanoff (1966) and Wilson Wilson (1971, 1975), it is well known that at the critical point there are fluctuations at all length scales: at the scale of the largest density fluctuations becomes infinite, however fluctuations at smaller scales persist, as illustrated by the phenomenon of critical opalescence in fluids. What remains interesting then, is to pin down the contribution of different length scales of the thermodynamic density fluctuations. Here we focus on the relative contributions of local and of nonlocal fluctuations to the thermodynamic fluctuations .
Let us begin with the local fluctuations . Figure 4(b) shows versus for near . In sharp contrast with , does not show an enhancement along the Widom line (see Fig. 4(e)). Its temperature dependence is controlled by that of double occupancy so it is very weak when is much less than . Local fluctuations are mostly dominated by quantum effects, as we discuss momentarily.
Next we turn to the nonlocal fluctuation , shown in Figure 4(c) again for a temperature close to . Upon crossing the Widom line, has a non-monotonic behavior, showing an additional upward peak as a function of , which sharpens and narrows as the critical endpoint is approached (see Fig. 4(f)). Hence, quite surprisingly, becomes less negative along the Widom line. Note that away from the Widom line (say for ), becomes more negative with decreasing , in agreement with the discussion of Figure 1(c).
To understand the behavior of and of one needs to realize that close to the endpoint and to the Widom line, the system enters into the so-called renormalized classical regime Chakravarty et al. (1989). In this regime, the fluctuations are large and the correlation length becomes larger than the thermal De Broglie wavelength , and hence the most important fluctuations are classical. A large correlation length is associated with a small energy scale so, equivalently, in the renormalized classical regime the characteristic energy of the fluctuations becomes smaller than the energy associated to temperature (). Close to and to the Widom line, the correlation length grows rapidly (equivalently, there is “critical slowing down” so the characteristic frequency of the system decreases), and hence the thermodynamic fluctuations are dominated by the classical contributions ( in mean-field). By contrast with the quantum contribution to the nonlocal fluctuations that is negative, the classical (thermal) contribution to the nonlocal fluctuations is positive. Hence becomes less negative close to or to the Widom line. Returning to the local fluctuations , the classical (i.e. thermal) contribution to is logarithmic in , as one can see using the Ornstein-Zernike form for the susceptibility . This means that does not depend much on . It is controlled mainly by quantum effects, even though strictly speaking there is a diverging contribution at .
Therefore there are two mechanisms governing the temperature behavior of away from half-filling, , for a doped Mott insulator. The first mechanism occurs at high temperature, as discussed in Sec. III. As the temperature decreases below the Fermi energy, quantum mechanical effects become important when becomes larger than the average distance between fermions and it is then that sets a limit to the range of density fluctuations. The non-local correlations are negative because of the Pauli principle and because of fermion-fermion repulsion. A second mechanism occurs at much lower temperatures: as crosses the Widom line, or the critical endpoint, the system becomes renormalized classical: becomes larger than and it is that sets a limit to the range of density fluctuations. Since classical contribution to are positive, becomes less negative close to or to the Widom line.
V Predictions for experiments
Our results lead to the following predictions for quantum simulations of the two-dimensional Hubbard model with ultracold atoms in optical lattices. For larger than the critical value where the Mott transition occurs at half-filling, both the charge compressibility and the thermodynamic density fluctuations will show a peak as a function of the occupation . As is decreased toward , the peak will increase in magnitude and narrow in size. This enhancement in is associated with the nonlocal contribution becoming less negative, while the local fluctuations do not do much. These will be the signature of the Widom line. Below , a first-order transition occurs at finite density and finite temperature, and hence will be discontinuous.
Usual provisos apply. First, the presence of long-range ordered phases, or quasi-long-range ordered phases such as antiferromagnetism Mazurenko et al. (2017); Fratino et al. (2017a) or superconductivity Sordi et al. (2012b); Fratino et al. (2016) in the low temperature region of the phase diagram can prevent the observation of the endpoint or of some portion of the Widom line. Nevertheless, the Widom line extends far away from the endpoint, up to , so it may come out into the normal state. Furthermore, it is possible to shrink the regime of competing states, such antiferromagnetism, by adding frustration (e.g next nearest neighbor hopping Fratino et al. (2017b), or triangular lattice Hébert et al. (2015)). The onset temperature of the antiferromagnetic correlations strongly depends on the interaction and occupation . Within plaquette CDMFT, it is largest at (i.e. zero doping) around , where Fratino et al. (2017a). It decays rapidly as a function of and . For instance, for considered in Sec. IV, antiferromagnetism sets in from to Fratino et al. (2017b), similarly to recent experimental data with ultracold atoms in the antiferromagnetic phase Mazurenko et al. (2017). Therefore the results of this work at half filling of Fig. 2 are quantitatively correct down to at least . Away from half filling, the results for in Figs. 3,4 are quantitatively correct for , but only qualitative for .
Second, our results have been obtained with plaquette CDMFT that treats exactly local and short-range fluctuations within the plaquette. The fate of the first order transition and its associated Widom line with larger cluster size including larger range of fluctuations is computationally very challenging and hence has not been explored systematically. Nevertheless, one of our key findings is that nonlocal fluctuations decrease in absolute value near the Widom line and close to . This suggests that larger nonlocal correlations probed by larger clusters should not qualitatively modify our results.
The significance of the Widom line emanating from the endpoint at finite and stems from the theoretical proposal Sordi et al. (2012a) that identifies the Widom line with the rapid crossovers marking the pseudogap temperature in the phase diagram of hole-doped cuprates Sordi et al. (2012a, 2013). If confirmed by experiments with ultracold atoms, this result could throw new light into the explanation of the pseudogap phase in cuprate high-temperature superconductors.
Acknowledgements.
This work has been supported by the Natural Sciences and Engineering Research Council of Canada (NSERC) under grants RGPIN-2014-04584, the Canada First Research Excellence Fund and by the Research Chair in the Theory of Quantum Materials. Simulations were performed on computers provided by the Canadian Foundation for Innovation, the Ministère de l’Éducation des Loisirs et du Sport (Québec), Calcul Québec, and Compute Canada.References
- Mott (1974) N. F. Mott, Metal-insulator transitions (Taylor & Francis, London, 1974).
- Imada et al. (1998) Masatoshi Imada, Atsushi Fujimori, and Yoshinori Tokura, “Metal-insulator transitions,” Rev. Mod. Phys. 70, 1039–1263 (1998).
- Anderson (1987) P. W. Anderson, “The resonating valence bond state in La2CuO4 and superconductivity,” Science 235, 1196–1198 (1987).
- Lee et al. (2006) Patrick A. Lee, Naoto Nagaosa, and Xiao-Gang Wen, “Doping a mott insulator: Physics of high-temperature superconductivity,” Rev. Mod. Phys. 78, 17–85 (2006).
- Tremblay et al. (2006) A.-M. S. Tremblay, B. Kyung, and D. Sénéchal, “Pseudogap and high-temperature superconductivity from weak to strong coupling. Towards a quantitative theory,” Low Temp. Phys. 32, 424 (2006).
- Troyer and Wiese (2005) Matthias Troyer and Uwe-Jens Wiese, “Computational complexity and fundamental limitations to fermionic quantum monte carlo simulations,” Phys. Rev. Lett. 94, 170201 (2005).
- Gross and Bloch (2017) Christian Gross and Immanuel Bloch, “Quantum simulations with ultracold atoms in optical lattices,” Science 357, 995–1001 (2017).
- Bloch et al. (2008) Immanuel Bloch, Jean Dalibard, and Wilhelm Zwerger, “Many-body physics with ultracold gases,” Rev. Mod. Phys. 80, 885–964 (2008).
- Jaksch and Zoller (2005) D. Jaksch and P. Zoller, “The cold atom hubbard toolbox,” Ann. Phys. 315, 52 (2005).
- Lewenstein et al. (2007) Maciej Lewenstein, Anna Sanpera, Veronica Ahufinger, Bogdan Damski, Aditi Sen, and Ujjwal Sen, “Ultracold atomic gases in optical lattices: mimicking condensed matter physics and beyond,” Adv. Phys. 56, 243 (2007).
- Esslinger (2010) Tilman Esslinger, “Fermi-Hubbard Physics with Atoms in an Optical Lattice,” Annual Review of Condensed Matter Physics 1, 129–152 (2010).
- Bakr et al. (2009) Waseem S. Bakr, Jonathon I. Gillen, Amy Peng, Simon Fölling, and Markus Greiner, “A quantum gas microscope for detecting single atoms in a Hubbard-regime optical lattice,” Nature (London) 462, 74–77 (2009).
- Sherson et al. (2010) Jacob F. Sherson, Christof Weitenberg, Manuel Endres, Marc Cheneau, Immanuel Bloch, and Stefan Kuhr, “Single-atom-resolved fluorescence imaging of an atomic Mott insulator,” Nature (London) 467, 68–72 (2010).
- Cheuk et al. (2015) Lawrence W. Cheuk, Matthew A. Nichols, Melih Okan, Thomas Gersdorf, Vinay V. Ramasesh, Waseem S. Bakr, Thomas Lompe, and Martin W. Zwierlein, “Quantum-gas microscope for fermionic atoms,” Phys. Rev. Lett. 114, 193001 (2015).
- Haller et al. (2015) Elmar Haller, James Hudson, Andrew Kelly, Dylan A. Cotta, Bruno Peaudecerf, Graham D. Bruce, and Stefan Kuhr, “Single-atom imaging of fermions in a quantum-gas microscope,” Nature Physics 11, 738–742 (2015).
- Parsons et al. (2015) Maxwell F. Parsons, Florian Huber, Anton Mazurenko, Christie S. Chiu, Widagdo Setiawan, Katherine Wooley-Brown, Sebastian Blatt, and Markus Greiner, “Site-resolved imaging of fermionic in an optical lattice,” Phys. Rev. Lett. 114, 213002 (2015).
- Omran et al. (2015) Ahmed Omran, Martin Boll, Timon A. Hilker, Katharina Kleinlein, Guillaume Salomon, Immanuel Bloch, and Christian Gross, “Microscopic observation of pauli blocking in degenerate fermionic lattice gases,” Phys. Rev. Lett. 115, 263001 (2015).
- Edge et al. (2015) G. J. A. Edge, R. Anderson, D. Jervis, D. C. McKay, R. Day, S. Trotzky, and J. H. Thywissen, “Imaging and addressing of individual fermionic atoms in an optical lattice,” Phys. Rev. A 92, 063406 (2015).
- Jordens et al. (2008) Robert Jordens, Niels Strohmaier, Kenneth Gunter, Henning Moritz, and Tilman Esslinger, “A Mott insulator of fermionic atoms in an optical lattice,” Nature 455, 204–207 (2008).
- Schneider et al. (2008) U. Schneider, L. Hackermüller, S. Will, Th. Best, I. Bloch, T. A. Costi, R. W. Helmes, D. Rasch, and A. Rosch, “Metallic and Insulating Phases of Repulsively Interacting Fermions in a 3D Optical Lattice,” Science 322, 1520–1525 (2008).
- Cheuk et al. (2016a) Lawrence W. Cheuk, Matthew A. Nichols, Katherine R. Lawrence, Melih Okan, Hao Zhang, and Martin W. Zwierlein, “Observation of 2d fermionic mott insulators of with single-site resolution,” Phys. Rev. Lett. 116, 235301 (2016a).
- Greif et al. (2016) Daniel Greif, Maxwell F. Parsons, Anton Mazurenko, Christie S. Chiu, Sebastian Blatt, Florian Huber, Geoffrey Ji, and Markus Greiner, “Site-resolved imaging of a fermionic mott insulator,” Science 351, 953–957 (2016).
- Cocchi et al. (2016) Eugenio Cocchi, Luke A. Miller, Jan H. Drewes, Marco Koschorreck, Daniel Pertot, Ferdinand Brennecke, and Michael Köhl, “Equation of State of the Two-Dimensional Hubbard Model,” Phys. Rev. Lett. 116, 175301 (2016).
- Hofrichter et al. (2016) Christian Hofrichter, Luis Riegger, Francesco Scazza, Moritz Höfer, Diogo Rio Fernandes, Immanuel Bloch, and Simon Fölling, “Direct Probing of the Mott Crossover in the Fermi-Hubbard Model,” Phys. Rev. X 6, 021030 (2016).
- Cheuk et al. (2016b) Lawrence W. Cheuk, Matthew A. Nichols, Katherine R. Lawrence, Melih Okan, Hao Zhang, Ehsan Khatami, Nandini Trivedi, Thereza Paiva, Marcos Rigol, and Martin W. Zwierlein, “Observation of spatial charge and spin correlations in the 2D Fermi-Hubbard model,” Science 353, 1260–1264 (2016b).
- Parsons et al. (2016) Maxwell F. Parsons, Anton Mazurenko, Christie S. Chiu, Geoffrey Ji, Daniel Greif, and Markus Greiner, “Site-resolved measurement of the spin-correlation function in the Fermi-Hubbard model,” Science 353, 1253–1256 (2016).
- Boll et al. (2016) Martin Boll, Timon A. Hilker, Guillaume Salomon, Ahmed Omran, Jacopo Nespolo, Lode Pollet, Immanuel Bloch, and Christian Gross, “Spin- and density-resolved microscopy of antiferromagnetic correlations in Fermi-Hubbard chains,” Science 353, 1257–1260 (2016).
- Drewes et al. (2016) J. H. Drewes, E. Cocchi, L. A. Miller, C. F. Chan, D. Pertot, F. Brennecke, and M. Köhl, “Thermodynamics versus Local Density Fluctuations in the Metal–Mott-Insulator Crossover,” Phys. Rev. Lett. 117, 135301 (2016).
- Drewes et al. (2017) J. H. Drewes, L. A. Miller, E. Cocchi, C. F. Chan, N. Wurz, M. Gall, D. Pertot, F. Brennecke, and M. Köhl, “Antiferromagnetic correlations in two-dimensional fermionic mott-insulating and metallic phases,” Phys. Rev. Lett. 118, 170401 (2017).
- Nichols et al. (2018) Matthew A. Nichols, Lawrence W. Cheuk, Melih Okan, Thomas R. Hartke, Enrique Mendez, T. Senthil, Ehsan Khatami, Hao Zhang, and Martin W. Zwierlein, “Spin transport in a mott insulator of ultracold fermions,” Science (2018), 10.1126/science.aat4387.
- Brown et al. (2019) Peter T. Brown, Debayan Mitra, Elmer Guardado-Sanchez, Reza Nourafkan, Alexis Reymbaut, Charles-David Hébert, Simon Bergeron, A.-M. S. Tremblay, Jure Kokalj, David A. Huse, Peter Schauß, and Waseem S. Bakr, “Bad metallic transport in a cold atom fermi-hubbard system,” Science 363, 379–382 (2019).
- Islam et al. (2015) Rajibul Islam, Ruichao Ma, Philipp M Preiss, M Eric Tai, Alexander Lukin, Matthew Rispoli, and Markus Greiner, “Measuring entanglement entropy in a quantum many-body system,” Nature 528, 77 (2015).
- Cocchi et al. (2017) E. Cocchi, L. A. Miller, J. H. Drewes, C. F. Chan, D. Pertot, F. Brennecke, and M. Köhl, “Measuring Entropy and Short-Range Correlations in the Two-Dimensional Hubbard Model,” Phys. Rev. X 7, 031025 (2017).
- Walsh et al. (2019a) C. Walsh, P. Sémon, D. Poulin, G. Sordi, and A.-M. S. Tremblay, “Local Entanglement Entropy and Mutual Information across the Mott Transition in the Two-Dimensional Hubbard Model,” Phys. Rev. Lett. 122, 067203 (2019a).
- Walsh et al. (2019b) C. Walsh, P. Sémon, D. Poulin, G. Sordi, and A.-M. S. Tremblay, “Thermodynamic and information-theoretic description of the Mott transition in the two-dimensional Hubbard model,” Phys. Rev. B 99, 075122 (2019b).
- Mazurenko et al. (2017) Anton Mazurenko, Christie S Chiu, Geoffrey Ji, Maxwell F Parsons, Márton Kanász-Nagy, Richard Schmidt, Fabian Grusdt, Eugene Demler, Daniel Greif, and Markus Greiner, “A cold-atom fermi–hubbard antiferromagnet,” Nature 545, 462–466 (2017).
- Müller et al. (2010) Torben Müller, Bruno Zimmermann, Jakob Meineke, Jean-Philippe Brantut, Tilman Esslinger, and Henning Moritz, “Local observation of antibunching in a trapped fermi gas,” Phys. Rev. Lett. 105, 040401 (2010).
- Sanner et al. (2010) Christian Sanner, Edward J. Su, Aviv Keshet, Ralf Gommers, Yong-il Shin, Wujie Huang, and Wolfgang Ketterle, “Suppression of density fluctuations in a quantum degenerate fermi gas,” Phys. Rev. Lett. 105, 040402 (2010).
- Sordi et al. (2010) G. Sordi, K. Haule, and A.-M. S. Tremblay, “Finite Doping Signatures of the Mott Transition in the Two-Dimensional Hubbard Model,” Phys. Rev. Lett. 104, 226402 (2010).
- Sordi et al. (2011) G. Sordi, K. Haule, and A.-M. S. Tremblay, “Mott physics and first-order transition between two metals in the normal-state phase diagram of the two-dimensional Hubbard model,” Phys. Rev. B 84, 075161 (2011).
- Sordi et al. (2012a) G. Sordi, P. Sémon, K. Haule, and A.-M. S. Tremblay, “Pseudogap temperature as a Widom line in doped Mott insulators,” Sci. Rep. 2, 547 (2012a).
- Maier et al. (2005) Thomas Maier, Mark Jarrell, Thomas Pruschke, and Matthias H. Hettler, “Quantum cluster theories,” Rev. Mod. Phys. 77, 1027–1080 (2005).
- Kotliar et al. (2006) G. Kotliar, S. Y. Savrasov, K. Haule, V. S. Oudovenko, O. Parcollet, and C. A. Marianetti, “Electronic structure calculations with dynamical mean-field theory,” Rev. Mod. Phys. 78, 865 (2006).
- Georges et al. (1996) Antoine Georges, Gabriel Kotliar, Werner Krauth, and Marcelo J. Rozenberg, “Dynamical mean-field theory of strongly correlated fermion systems and the limit of infinite dimensions,” Rev. Mod. Phys. 68, 13 (1996).
- Gull et al. (2011) Emanuel Gull, Andrew J. Millis, Alexander I. Lichtenstein, Alexey N. Rubtsov, Matthias Troyer, and Philipp Werner, “Continuous-time Monte Carlo methods for quantum impurity models,” Rev. Mod. Phys. 83, 349–404 (2011).
- Note (1) Our CDMFT calculations required a large computation investment. At high temperature (e.g. ), one CDMFT iteration took about minutes on processors. At low temperature (e.g. ), the computational effort increases, and one CDMFT iteration took about 1 hour on processors. We normally reached convergence within CDMFT iterations, but close to phase boundaries and the Widom line hundred iterations were necessary. Once convergence is reached, averages were taken over at least the last CDMFT iterations (and up to hundreds close to phase boundaries). The resulting root mean square deviation on local quantities such as and that were needed to compute the density fluctuations were on the fifth digit.
- Zhou and Ho (2011) Qi Zhou and Tin-Lun Ho, “Universal thermometry for quantum simulation,” Phys. Rev. Lett. 106, 225301 (2011).
- Duchon et al. (2012) E. Duchon, Y. Kato, and N. Trivedi, “Diagnostic for phases and quantum critical regions using deviations from the local fluctuation-dissipation theorem,” Phys. Rev. A 86, 063608 (2012).
- Cheuk (2017) Lawrence W. Cheuk, Quantum Gas Microscopy of Strongly Correlated Fermions, Ph.D. thesis, Massachusetts Institute of Technology, Cambridge, MA 02139, USA (2017).
- Mahan (2000) Gerald D. Mahan, Many-Particle Physics (Kluwer Academic/Plenum Publishers, New York, NY, USA, 2000).
- Note (2) Virtual processes occur across a bond between neighboring sites of the lattice. It is intriguing that the virtual process description becomes consistent near , the classical bond-percolation threshold of the two-dimensional square lattice.
- Xu et al. (2005) Limei Xu, Pradeep Kumar, S. V. Buldyrev, S.-H. Chen, P. H. Poole, F. Sciortino, and H. E. Stanley, “Relation between the Widom line and the dynamic crossover in systems with a liquid liquid phase transition,” Proc. Natl. Acad. Sci. USA 102, 16558–16562 (2005).
- McMillan and Stanley (2010) Paul F. McMillan and H. Eugene Stanley, “Fluid phases: Going supercritical,” Nat Phys 6, 479–480 (2010).
- Sordi et al. (2013) G. Sordi, P. Sémon, K. Haule, and A.-M. S. Tremblay, “-axis resistivity, pseudogap, superconductivity, and Widom line in doped Mott insulators ,” Phys. Rev. B 87, 041101 (2013).
- Kadanoff (1966) Leo P. Kadanoff, “Scaling laws for ising models near ,” Physics Physique Fizika 2, 263–272 (1966).
- Wilson (1971) Kenneth G. Wilson, “Renormalization Group and Critical Phenomena. I. Renormalization Group and the Kadanoff Scaling Picture,” Phys. Rev. B 4, 3174–3183 (1971).
- Wilson (1975) Kenneth G. Wilson, “The renormalization group: Critical phenomena and the Kondo problem,” Rev. Mod. Phys. 47, 773–840 (1975).
- Chakravarty et al. (1989) Sudip Chakravarty, Bertrand I. Halperin, and David R. Nelson, “Two-dimensional quantum heisenberg antiferromagnet at low temperatures,” Phys. Rev. B 39, 2344–2371 (1989).
- Fratino et al. (2017a) L. Fratino, P. Sémon, M. Charlebois, G. Sordi, and A.-M. S. Tremblay, “Signatures of the Mott transition in the antiferromagnetic state of the two-dimensional Hubbard model,” Phys. Rev. B 95, 235109 (2017a).
- Sordi et al. (2012b) G. Sordi, P. Sémon, K. Haule, and A.-M. S. Tremblay, “Strong Coupling Superconductivity, Pseudogap, and Mott Transition,” Phys. Rev. Lett. 108, 216401 (2012b).
- Fratino et al. (2016) L. Fratino, P. Sémon, G. Sordi, and A.-M. S. Tremblay, “An organizing principle for two-dimensional strongly correlated superconductivity,” Sci. Rep. 6, 22715 (2016).
- Fratino et al. (2017b) L. Fratino, M. Charlebois, P. Sémon, G. Sordi, and A.-M. S. Tremblay, “Effects of interaction strength, doping, and frustration on the antiferromagnetic phase of the two-dimensional Hubbard model,” Phys. Rev. B 96, 241109 (2017b).
- Hébert et al. (2015) Charles-David Hébert, Patrick Sémon, and A.-M. S. Tremblay, “Superconducting dome in doped quasi-two-dimensional organic mott insulators: A paradigm for strongly correlated superconductivity,” Phys. Rev. B 92, 195112 (2015).