VrR-VG: Refocusing Visually-Relevant Relationships††thanks: This work was performed at JD AI Research.
Abstract
Relationships encode the interactions among individual instances, and play a critical role in deep visual scene understanding. Suffering from the high predictability with non-visual information, existing methods tend to fit the statistical bias rather than ‘‘learning’’ to ‘‘infer’’ the relationships from images. To encourage further development in visual relationships, we propose a novel method to automatically mine more valuable relationships by pruning visually-irrelevant ones. We construct a new scene-graph dataset named Visually-Relevant Relationships Dataset (VrR-VG) based on Visual Genome. Compared with existing datasets, the performance gap between learnable and statistical method is more significant in VrR-VG, and frequency-based analysis does not work anymore. Moreover, we propose to learn a relationship-aware representation by jointly considering instances, attributes and relationships. By applying the representation-aware feature learned on VrR-VG, the performances of image captioning and visual question answering are systematically improved with a large margin, which demonstrates the gain of our dataset and the features embedding schema. VrR-VG is available via http://vrr-vg.com/.
1 Introduction
Although visual perception tasks (e.g., classification, detection) have witnessed great advancement in the past decade, visual cognition tasks (e.g., image captioning, question answering) are still limited due to the difficulty of reasoning [16]. Existing vision tasks are mostly based on individual objects analysis. However, a natural image usually consists of multiple instances in a scene, and most of them are related in some ways. To fully comprehend a visual image, a holistic view is required to understand the relationships and interactions among object instances.
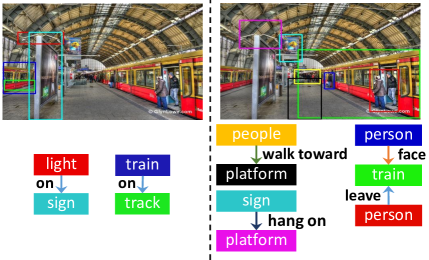
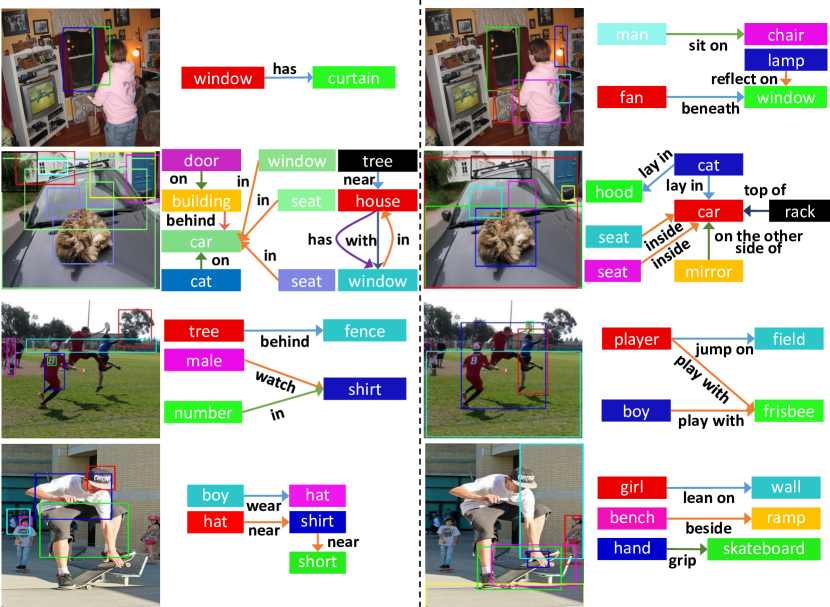
Visual relationships [19, 6, 33, 38, 40], which encode the interplay between individual instances, become the indispensable factor for visual cognitive tasks such as image captioning [36], visual question answering (VQA) [21]. In existing literature, visual relationships are mostly represented as a scene graph (Fig. 1): a node represents a specific instance (either as subject or object), and an edge encodes the relation label (r) between a subject (s) and an object (o). Equivalently, a scene graph can also be represented as a set of triplets . Recently, extensive research efforts [33, 38, 20, 35] are conducted on scene graph generation, which aims to extract the scene graph from an image (Fig. 1). Essentially, scene graph generation bridges the gap between visual perception and high-level cognition.

Among the datasets [26, 16, 19, 34, 24] adopted in visual relationship, Visual Genome (VG) [16] provides the largest set of relationship annotations, offering large-scale (2.3 million relationships) and dense (21 relationships per image) relationship annotations. However, the relationships in VG are heavily noisy, biased and duplicated, since it was automatically extracted from image captions. VG150111We call it “VG150” to distinguish from the original VG dataset [16]. [33], the most popular split derived from VG, is constructed by only keeping the most frequent 150 object categories and 50 relation labels in VG. In existing literature, VG150 serves as the most widely adopted benchmark on scene graph generation [38, 33, 35, 4, 20, 12], but was seldomly adopted on cognitive tasks such as captioning and VQA.
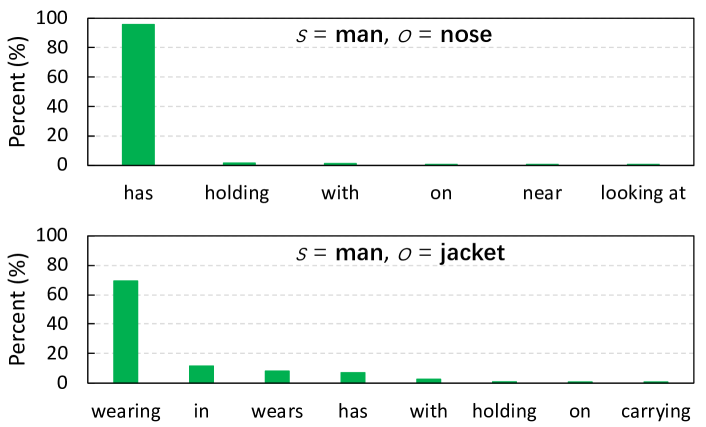
Based on our study, there are still several problems in current visual relationship datasets: visual relationships are actually not that “visual". That is, a large portion of relationships are visually irrelevant. 1) Some spatial relationships (e.g., ‘‘on’’, ‘‘of’’, ‘‘in’’) are less visually informative. As shown in Fig. 2, spatial relationships take up a substantial proportion in VG150. For example, ‘‘on’’ takes 31.9% in all relation labels. However, some spatial relationships can be easily inferred merely based on the bounding box locations of s and o, without even accessing the visual content. 2) Large portion of low diversity relation labels gives rise to frequency analysis. Some relationships (e.g., ‘‘wear’’, ‘‘ride’’, ‘‘has’’) can be roughly estimated only based on language priors or statistical measures, without looking at the visual image. As shown in Fig. 3, given ‘‘s=man’’ and ‘‘o=nose’’, 95.8% of r is ‘‘has’’. Results in [38] also show that simple frequency-counting achieves decent results in many metrics of scene graph generation, which indicates many relation labels in VG150 can be predicted by non-visual factors. Due to these problems, cognitive tasks (e.g., image captioning, VQA) can hardly benefit from relationships learned from current datasets. To the best of our knowledge, no cognitive tasks have benefited from current visual relationship dataset so far, except a few [36, 21] not learning from visual relationship datasets. These phenomenons suggest that current datasets on the visual relationship are quite limited.


In this paper, we propose a novel method to automatically identify visually-relevant relationships and construct a new data split named Visually-relevant Relationships (VrR-VG) based on the original VG. Specifically, a tiny visual discriminator network (VD-Net) is carefully designed to learn the notion of visually-relevant. To exploit the full capacity of VrR-VG on cognitive tasks, we also propose a joint learning method for relationship-aware representation learning. We show that VD-Net is effective in pruning visually-irrelevant relationships from the large corpus. Compared to VG150, VrR-VG focuses more on visually-relevant relations (Fig. 1 and 4), and is more balanced in label distribution (Fig. 2). Our experiments show that non-visual based methods no longer work well on VrR-VG. More importantly, relationship-aware features learned on VrR-VG show more promising results in cognition tasks such as VQA and image captioning. This also indicates that more valuable visual relationships are included in our dataset. The new dataset (VrR-VG) and our pre-trained relationship features will be released to the community to facilitate further researches on scene graph understanding and high-level cognitive tasks. The main contributions of this paper are summarized as follows:
1. A new dataset VrR-VG is constructed to highlight visually-relevant relationships. For this purpose, we also propose a novel visual discriminator to learn the notion of visually-relevant.
2. We propose a relationship-aware feature learning schema for incorporating object instances and their relationships into one feature vector. Objects location / category / attribute as well as their relations are jointly considered, such that semantics and their relations are jointly modeled.
3. Better results on visual cognitive tasks (VQA and image captioning) further verifies the effectiveness of our VrR-VG dataset as well as the relationship-aware feature learning schema.
2 Related Work
Visual relationship datasets: We summarize some datasets in visual relationship in Table 1. Visual phrase dataset [26] focus on relation phrase recognition and detection, which contains 8 object categories from Pascal VOC2008 [8] and 17 relation phrases with 9 different relationships. Scene Graph dataset [14] mainly explores the ability of image retrieval by scene graph. The VRD dataset [19] intends to benchmark the scene graph generation. Open Images [34] provides the largest amount of images for object detection and also presents a challenging task for relationship detection. PIC [1] proposes a segmentation task in the context of visual relationship.
Visual Genome (VG) [16] has the maximum amount of relation triplets with the most diverse object categories and relation labels in all listed datasets. However, the relations in VG contain lots of noises and duplications. Thus VG150 [33] is constructed by pre-processing VG by label frequency. However, most high-frequency relationships are visually-irrelevant as we mentioned before.
In this paper, we exclude visually-irrelevant relationships in VG and construct new Visually-Relevant Relationships dataset (VrR-VG). Rather than suffering from visually irrelevant relationships and easily predictable without visual information, VrR-VG focus on the visually relevant relationships and offers more cognitive abilities for image representation.
Representation Learning: Numerous deep learning methods have been proposed for representation learning with various knowledge [31, 22, 5, 30]. In image representation, these methods offer two aspects in image understanding: one is object category level, the other is instance level. GoogLNet [28], ResNet [11], Inception [27], ResNext [32], etc. trained on Imagenet [7] focus on object category classification. Since the supervision are object categories, the methods tend to give a holistic representation of images and figure out the features with the salient instance attention. Furthermore, as it is common that multiple instances exist in images, focusing on the salient instance is not enough to represent the scene. To explore multiple instances, detection task provides some effective tools. Jin et al. [13] apply selective search [29] to give salience region proposals. A similar idea also appears in RCNN [9], in which the network generates many region proposals first and work out detection result for every instance. Faster-RCNN [25] further improves the idea of region proposals and provide a faster and more elegant method to limited region proposals. Based on region proposals, Peter et al. [2] proposed a bottom-up and top-down attention method to represent images. They utilize the locations, categories, and attributes of instances to learn the representation and get improvement in several cognitive tasks. In our work, we go deeper into multiple instances representation by adding inter-instance relationships. All instance locations, categories, attributes, together with relationships are jointly utilized in representation learning.
3 Visually-relevant Relationships Dataset
To identify visually-irrelevant relationships, a hypothesis is proposed first that, if a relationship label in different triplets is predictable according to any information except visual information, the relationship is visual-irrelevant. For distinguishing visually-relevant relationships, we introduce a novel visual discriminator network (VD-Net). VD-Net is a tiny network to predicate relation labels according to entities’ classes and bounding boxes without images. The relation labels, which are not highly predictive by VD-Net, would be regarded as visually-relevant relationships. After reducing duplicate relationships by hierarchical clustering and filtering out the visually-irrelevant relationships, we constructed a new dataset named Visually-relevant Relationships Dataset (VrR-VG) from VG.
| Dataset | object | bbox | relationship | triplet | image |
|---|---|---|---|---|---|
| Visual Phrase [26] | 8 | 3,271 | 9 | 1,796 | 2,769 |
| Scene Graph [14] | 266 | 69,009 | 68 | 109,535 | 5,000 |
| VRD [19] | 100 | - | 70 | 37993 | 5,000 |
| Open Images [34] | 57 | 3,290,070 | 10 | 374,768 | - |
| Visual Genome [16] | 33,877 | 3,843,636 | 40,480 | 2,347,187 | 108,077 |
| VG150 [33] | 150 | 738,945 | 50 | 413,269 | 87,670 |
| VrR-VG (ours) | 1,600 | 282,460 | 117 | 203,375 | 58,983 |
3.1 Visual Discriminator: VD-Net
In our work, a simple visual discriminator network (VD-Net) is proposed for selecting visually-irrelevant relationships. To prevent the overfitting, the network structure design follows the guideline of ‘‘tinier is better’’. Our VD-Net aims to recognize relationships without visual information from images.
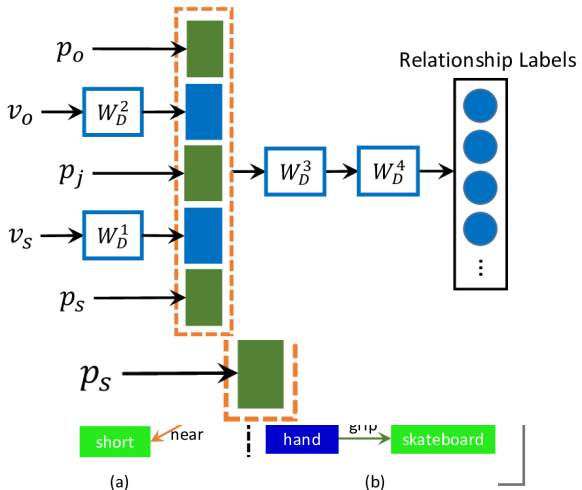
Each bounding box of instance in the image can be defined by a four-tuple that specifies its top-left corner , height and width . The position embedding of object and subject can be represented as four-tuple and respectively, where and . The bounding boxes of given object and subject in related entities are embedded to a jointly vector as following equation:
| (1) | ||||
where are offsets of boxes computed by the difference between the coordinates of subject and object, and are width and height of bounding boxes, and and are the center coordinates of the boxes.
The details of VD-Net are given in Fig. 5 where and are the word vectors of subject and object categories. GloVe [23] is applied for initializing word embeddings. are learnable weights. After a fully-connected layer, instance categories’ features are concatenated with position embedding and correspondingly. Finally, another two fully-connected layers and batch normalization layers are applied for classifying relation labels. We discard relationships which have larger accuracy than a threshold , and those reserved relationships are selected for generating the dataset. In this paper, we set as 50% due to the trade-off between dataset scale and visually-relevant quality.
The VD-Net merely contains three fully-connected layers, but it is already sufficient to predict most of the visually-irrelevant relationships, like ‘‘wear", ‘‘on", ‘‘above", etc. More than 37% of relation labels in VG150 can be predicted with at least 50% accuracy by using such a crude neural network without any visual information.
3.2 Dataset Construction
We pre-process VG and extract top 1600 objects and 500 relationships to generate a basic data split. The raw relation labels in VG contain many duplications, such as ‘‘wears" and ‘‘is wearing a", ‘‘next" and ‘‘next to". Those labels may confuse the network because all those labels are correct to the same object and subject combination. We represent the labels by GloVe word vector, and filter out the duplicate relationships by applying hierarchical clustering [15] on relationships’ word vectors. This simple operation reduces label categories from 500 to 180. We named this dataset after clustering as R-VG. Then, to exclude visually-irrelevant relationships, the VD-Net is utilized to train and evaluate with the 180 relationship labels in R-VG. Finally, we get 117 relation labels as VrR-VG relationships. It means our constructed VrR-VG is the subset of R-VG but filtered out the visually irrelevant relationships.
4 Relationship-Aware Representation Learning
As shown in Fig. 6, to model entire visual information in an image, the properties of isolated instances like category, position, attribute and the interaction of related instances are all useful. In our framework, all the properties are utilized for training features. We extract single instances proposals, and then train the model with all properties in images.

In detail, for the detector setting for single instances, Faster-RCNN [25] with ResNet101 [11] is used as instance detector in our framework. We apply Non-maximum suppression (NMS) operation on regions proposals and then select candidate proposals according to IOU threshold. Then, through a mean-pooling layer, proposals’ features are integrated into the same dimensions.
To learn the single instance properties, together with original detection operation, we set a classifier to learn instance attributes. The overall isolated properties are learned as follow:
| (2) | ||||
where , , , , and are learnable parameters, is concatenate operation. , , and are the bounding boxes, classes and attribute predictions for the -th instance. We learn the relation representation by the following equation:
| (3) | ||||
where and are learnable parameters for mapping instance to relation domain, is the node after mapping, and is the relation prediction between the proposal instances and .
Formally, in training procedure, locations, categories, attributes of single entities and the relationships participate and supervise visual representation learning. The proposal features of single instances are extracted from the detector first. Then, the features are mapped into the relationship space. We fuse the mapped features to get relation predictions between proposals. Since there are proposals in our works, all the combinations participate in features training. As a result, the feature contains all the information of isolated instances and the interaction among instances. We utilize the final features on VQA and image captioning tasks and evaluate the performance gains.
5 Experiments
In this section, we discuss the properties of our data split from two aspects. One is the datasets comparison, the other is dataset quality evaluation by applying the visual representations learned from different datasets on cognitive tasks like VQA and image captioning.
5.1 Datasets Comparison
5.1.1 Relationships Analysis

We compare the accuracy distributions of relationships predicted by VD-Nets trained on different scene graph datasets in Fig. 7. We can find that 75%, 20%, 42% and 37% of relationships in Visual Phrase dataset, Scene Graph dataset, VRD dataset, and VG150 have more than 50% accuracy in relation predicates prediction with VD-Net respectively, which only depends on instances’ locations and categories. Apparently, VrR-VG is more visually-relevant than others. It also means that VrR-VG is far harder than others in predicting relation predicates without visual information from images.
As shown in Fig. 2, top-12 relationship labels take 91.55% of VG150 dataset. Meanwhile, most of these labels are spatial relationships which can be estimated merely by instances’ locations. Comparatively, our top-12 labels take 67.62% and are more significant in the cognitive domain. Relationships like ‘‘hanging on", ‘‘playing with", etc. are hard to be estimated without enough understanding in corresponding scenes. Moreover, VrR-VG consist of 117 relationships is more diverse than the former 50 relationships in VG150. More scene graph examples from our VrR-VG are given in Fig. 8
5.1.2 Scene Graph Generation
| Methods | Datasets | |||||||
| Method specific VG splits | VrR-VG | |||||||
| Metrics | SGDet | SGCls | PredCls | Metrics | SGDet | SGCls | PredCls | |
| MSDN [17] | R@50 | 11.7 | 20.9 | 42.3 | R@50 | 3.59 | - | - |
| R@100 | 14.0 | 24.0 | 48.2 | R@100 | 4.36 | - | - | |
| Vtrans [39] | R@50 | 5.52 | - | 61.2 | R@50 | 0.83 | - | 44.69 |
| R@100 | 6.04 | - | 61.4 | R@100 | 1.08 | - | 44.84 | |
| Methods | VG150 | VrR-VG | ||||||
| Metrics | SGDet | SGCls | PredCls | Metrics | SGDet | SGCls | PredCls | |
| Neural-Motifs [38] | R@50 | 27.2 | 35.8 | 65.2 | R@50 | 14.8 | 16.5 | 46.7 |
| R@100 | 30.3 | 36.5 | 67.1 | R@100 | 17.4 | 19.2 | 52.5 | |
| Message Passing [33] | R@50 | 20.7 | 34.6 | 59.3 | R@50 | 8.46 | 12.1 | 29.7 |
| R@100 | 24.5 | 35.4 | 61.3 | R@100 | 9.78 | 13.7 | 34.3 | |
Since scene graph generation task points to the representability of relationships directly, we also evaluate and compare the task performances in VrR-VG with others datasets by using different widely used scene graph generation methods, including MSDN [17], Vtrans [39], Message Passing [33] and Neural-Motifs [38]. We evaluate following metrics [19, 38] with R@50 and R@100222R@: the fraction of times the correct relationship is predicted in the top- predictions. in scene graph generation:
-
•
Scene Graph Detection (SGDet): given images as inputs, predict instance locations, categories, and relationships.
-
•
Scene Graph Classification (SGCls): given images and instances locations, predict instance categories and relationships.
-
•
Predicate Classification (PredCls): given images, instance locations, and categories, predict relationships.
-
•
Predicate detection (PredDet): given images, instance locations, categories, and relationship connections, predict relationship labels.
As shown in Table 2 , the performances apparently decrease when using our dataset. With the relationships selected by our method, the scene graph generation task becomes more difficult and challenging.
| Methods | Metrics | VG150 | VrR-VG | |
|---|---|---|---|---|
| Message Passing | R@50 | 93.5 | 84.9 | 8.6 |
| R@100 | 97.2 | 91.6 | 5.6 | |
| Frequency-Baseline | R@50 | 94.6 | 69.8 | 24.8 |
| R@100 | 96.9 | 78.1 | 18.8 | |
| Neural-Motifs | R@50 | 96.0 | 87.6 | 8.4 |
| R@100 | 98.4 | 93.4 | 5.0 |
| Dataset | Object Category | Object Annotation | Attribute Category | Attributes Annotation | Image |
|---|---|---|---|---|---|
| BottomUp-VG [2] | 1600 | 3,404,999 | 400 | 1,829,438 | 107,120 |
| VrR-VG | 1600 | 2,106,390 | 400 | 1,109,650 | 58,983 |
| VQA Method | Feature Learning Method | Used Relation | Dataset | Yes/No | Numb. | Others | All |
|---|---|---|---|---|---|---|---|
| MUTAN [3] | BottomUp [2] | ✘ | BottomUp-VG | 81.90 | 42.25 | 54.41 | 62.84 |
| ✘ | VrR-V | 80.46 | 42.93 | 54.89 | 62.93 | ||
| Ours | ✔ | VG150 | 79.00 | 39.78 | 49.87 | 59.49 | |
| ✔ | R-VG | 82.35 | 43.91 | 54.89 | 63.77 | ||
| ✔ | VrR-VG | 83.09 | 44.83 | 55.71 | 64.57 | ||
| MFH [37] | BottomUp | ✘ | BottomUp-VG | 82.47 | 45.07 | 56.77 | 64.89 |
| ✘ | VrR-V | 82.37 | 45.17 | 56.40 | 64.68 | ||
| Ours | ✔ | VG150 | 78.86 | 38.32 | 50.98 | 59.80 | |
| ✔ | R-VG | 82.43 | 43.70 | 55.81 | 64.22 | ||
| ✔ | VrR-VG | 82.95 | 45.90 | 57.34 | 65.46 |
Notably, as the metric excluding the influence of detector performances, the relation predicates detection use paired detection ground truth for inputs and show the theoretical optimal performance in scene graph generation. As experimental results in Table 3, the gaps of performances between statistical and learnable methods are notably larger. The values of R@50 and R@100 in Frequency-Baseline are merely 69.8 and 78.1, which are far from results in VG150. This means the frequency-based method does not work anymore in VrR-VG. Experiments reflect the previously proposed methods really ‘‘learn’’ in VrR-VG, instead of using visually-irrelevant information to fit the data defeats.
5.2 Relationship-Aware Representation on Cognitive Tasks
To evaluate the relation quality in cognitive level, we choose VQA and image captioning in experiments and apply the visual features learned from our constructed dataset on these cognitive tasks. We also compared our relationship-aware representation learning method with the previous instance level representation learning method Bottom-Up [2]. We named the dataset used in Bottom-Up as BottomUp-VG, which is also collected from VG dataset. The detail statistics of BottomUp-VG and VrR-VG are shown in Table 4. The experimental results of feature learned by Bottom-Up and our relationship-aware representation learning method are shown as ‘‘Not Used Relation’’ and ‘‘Used Relation’’ in Table 5 and Table 6 respectively. To be fair, our proposed relationship-aware representation learning method follows the basic settings in Bottom-Up [2]. The experimental results demonstrate that the visually-relevant relationship plays an important role in high-level visual understanding.
Additionally, we introduce a variant dataset VrR-V, which is based on VrR-VG but excludes relation data for ablation study. We apply our proposed feature learning for VrR-V too, but without the weight of the relationship and relation loss is set as 0.

VQA:
We applied two widely used VQA methods MUTAN [3] and MFH [37] for evaluating the quality of image feature learned from different datasets. Table 5 reports the experimental results on validation set of VQA-2.0 dataset [10]. We can find that features trained with our VrR-VG obtain the best performance in all the datasets. We also compared the dataset used in Bottom-Up attention [2], which is regarded as the strongest feature representation learning method for VQA.
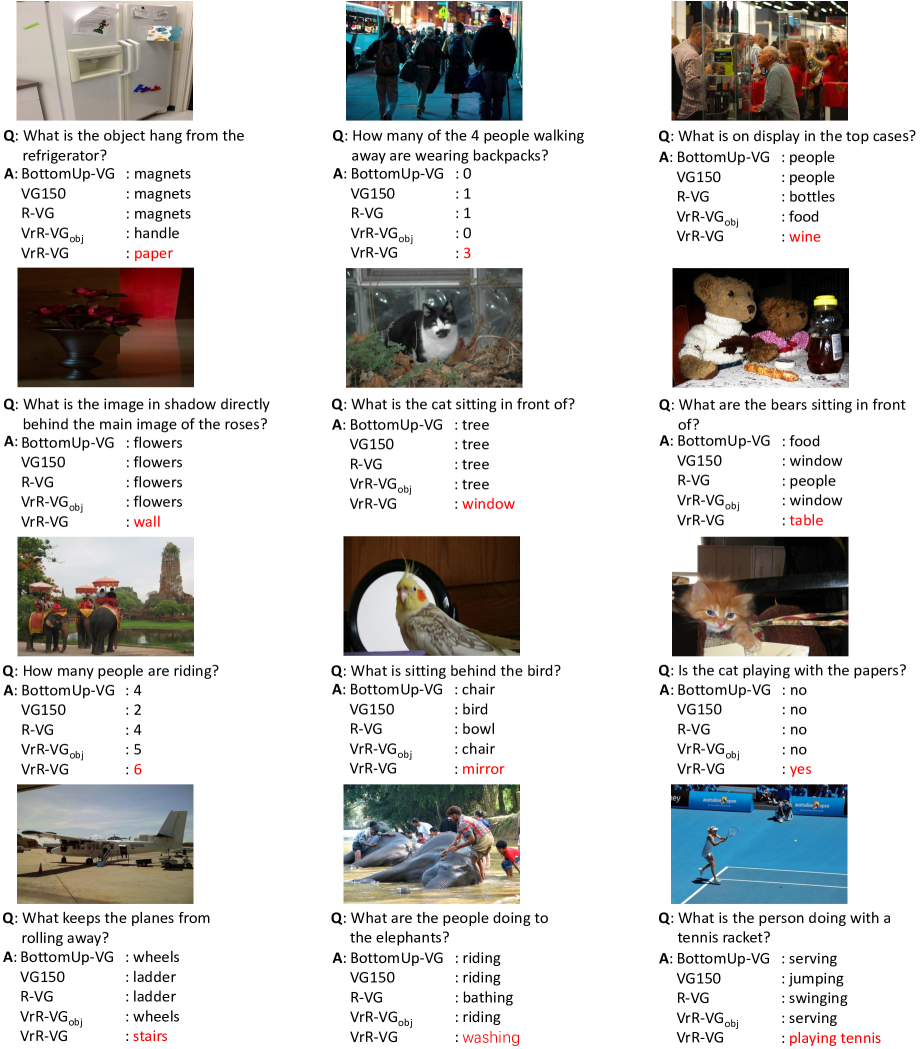
With relation data, our VrR-VG performs better than dataset used in Bottom-Up attention and VrR-V. The results indicate that the relationship data is useful in VQA task, especially in the cognitive related questions as shown in Fig. 9. It also demonstrates that our proposed informative visual representation method can extract more useful features from images. Besides, we also apply our proposed feature learning method on VG150 dataset. Since VG150 contains a majority of visually-irrelevant relationships which can be inferred easily by data bias as we mentioned, the features learned from VG150 usually lack the ability to represent complex visual semantics.
Moreover, the experimental results also show that VrR-VG has better performance than R-VG, which demonstrates that filtering out visually-irrelevant relationship is beneficial to learning high-quality representations, and further demonstrate the merits of VD-Net.
Image Captioning:
|
|
|
Used Relation | BLEU-1 | BLEU-4 | METEOR | ROUGLE-L | CIDEr | SPICE | ||||||
|---|---|---|---|---|---|---|---|---|---|---|---|---|---|---|---|
| Cross-Entropy Loss | BottomUp [2] | BottomUp-VG | ✘ | 76.9 | 36.0 | 26.9 | 56.2 | 111.8 | 20.2 | ||||||
| VrR-V | ✘ | 76.2 | 35.4 | 26.8 | 55.7 | 110.3 | 19.9 | ||||||||
| Ours | VG150 | ✔ | 74.2 | 32.7 | 25.3 | 53.9 | 102.1 | 18.5 | |||||||
| R-VG | ✔ | 76.3 | 35.4 | 27.0 | 56.0 | 111.2 | 20.0 | ||||||||
| VrR-VG | ✔ | 76.9 | 36.0 | 27.2 | 56.3 | 114.0 | 20.4 | ||||||||
| CIDEr Optimization | BottomUp | BottomUp-VG | ✘ | 79.6 | 36.0 | 27.6 | 56.7 | 118.2 | 21.2 | ||||||
| VrR-V | ✘ | 78.8 | 35.8 | 27.3 | 56.4 | 116.8 | 21.0 | ||||||||
| Ours | VG150 | ✔ | 76.7 | 32.7 | 25.8 | 54.3 | 108.0 | 19.6 | |||||||
| R-VG | ✔ | 79.1 | 35.8 | 27.5 | 56.5 | 118.8 | 21.2 | ||||||||
| VrR-VG | ✔ | 79.4 | 36.5 | 27.7 | 56.9 | 120.7 | 21.6 |
Similar to the experiment process used in VQA task, we first generate the image features based on VG150, VrR-V, R-VG and VrR-VG respectively. Then we apply the caption model [2] for these image features with the same settings.
As shown in Table 6, we report the performances in VrR-VG and VG150 in both the original optimizer for cross entropy loss and CIDEr optimizer for CIDEr score. Features generated from our data split works better than VG150. All metrics in captioning have better performance when using both of the optimizers. Moreover, in the comparison of adding relation or not, our complete VrR-VG has better performance than the VrR-V and R-VG. This indicates that visually-relevant relationships are useful for image captioning. Despite the dataset BottomUp-VG has much more object annotations, attributes annotations and images than VrR-VG as shown in Table 4, relationship-aware representation learned from VrR-VG can still achieve comparable or better results with object, attribute based representations learned from BottomUp-VG, owing to the visually-relevant relation information.
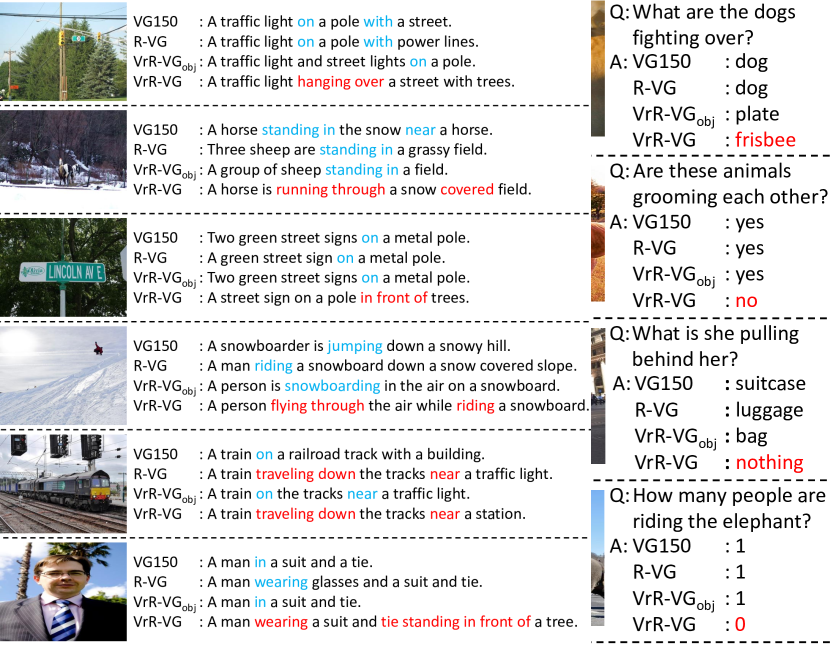
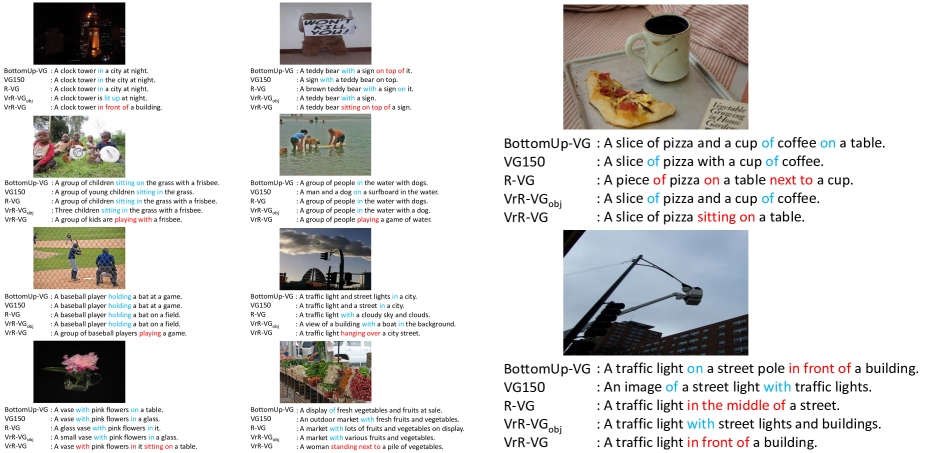
In examples of caption results as shown in Fig. 10, the features learned from our VrR-VG dataset lead to more diverse predicates and more vivid description than others. Rather than some simple predicates like ‘‘on", ‘‘with", etc., our features provide more semantic information and help models achieve more complex expression like ‘‘hanging", ‘‘covered", etc. Although this kinds of expressions may not lead to high scores in captioning metrics, these vivid and specific results are valuable for cognitive tasks.
In total, the higher quality of relation data energizes the features learned from our dataset and leads to a better performance in the open-ended VQA and image captioning tasks.
6 Conclusion
A new dataset for visual relationships named Visually-relevant relationships dataset (VrR-VG) is constructed by filtering visually-irrelevant relationships from VG.
Compared with previous datasets, VrR-VG contains more cognitive relationships, which are hard to be estimated merely by statistical bias or detection ground-truth. We also proposed an informative visual representation learning method learning image feature jointly considering entity labels, localizations, attributes, and interactions. The significant improvements in VQA and image captioning demonstrate that: (1) VrR-VG has much more visually-relevant relationships than previous relationship datasets, (2) visually-relevant relationship is helpful for high-level cognitive tasks, (3) our proposed informative visual representation learning method can effectively model different types of visual information jointly.
Acknowledgements: This work was in part supported by the NSFC (No.61602463, 61772407, 61732008, 61332018, u1531141), the National Key R&D Program of China under Grant 2017YFF0107700, the World-Class Universities (Disciplines), the Characteristic Development Guidance Funds for the Central Universities No.PYl3A022, the Open Project Program of the National Laboratory of Pattern Recognition.
References
- [1] picdataset.com. http://picdataset.com/challenge/index/, 2018.
- [2] Peter Anderson, Xiaodong He, Chris Buehler, Damien Teney, Mark Johnson, Stephen Gould, and Lei Zhang. Bottom-up and top-down attention for image captioning and visual question answering. In 2018 IEEE Conference on Computer Vision and Pattern Recognition, CVPR 2018, Salt Lake City, UT, USA, June 18-22, 2018, pages 6077--6086, 2018.
- [3] Hedi Ben-younes, Rémi Cadène, Matthieu Cord, and Nicolas Thome. MUTAN: multimodal tucker fusion for visual question answering. CoRR, abs/1705.06676, 2017.
- [4] Long Chen, Hanwang Zhang, Jun Xiao, Xiangnan He, Shiliang Pu, and Shih-Fu Chang. Scene dynamics: Counterfactual critic multi-agent training for scene graph generation. CoRR, abs/1812.02347, 2018.
- [5] Z. Chen, L. Duan, S. Wang, Y. Lou, T. Huang, D. O. Wu, and W. Gao. Towards knowledge as a service over networks: A deep learning model communication paradigm. IEEE Journal on Selected Areas in Communications, pages 1--1, 2019.
- [6] Bo Dai, Yuqi Zhang, and Dahua Lin. Detecting visual relationships with deep relational networks. In 2017 IEEE Conference on Computer Vision and Pattern Recognition, CVPR 2017, Honolulu, HI, USA, July 21-26, 2017, pages 3298--3308, 2017.
- [7] J. Deng, W. Dong, R. Socher, L.-J. Li, K. Li, and L. Fei-Fei. ImageNet: A Large-Scale Hierarchical Image Database. In CVPR09, 2009.
- [8] Mark Everingham, Luc J. Van Gool, Christopher K. I. Williams, John M. Winn, and Andrew Zisserman. The pascal visual object classes (VOC) challenge. International Journal of Computer Vision, 88(2):303--338, 2010.
- [9] Ross B. Girshick, Jeff Donahue, Trevor Darrell, and Jitendra Malik. Rich feature hierarchies for accurate object detection and semantic segmentation. CoRR, abs/1311.2524, 2013.
- [10] Yash Goyal, Tejas Khot, Douglas Summers-Stay, Dhruv Batra, and Devi Parikh. Making the V in VQA matter: Elevating the role of image understanding in visual question answering. CoRR, abs/1612.00837, 2016.
- [11] Kaiming He, Xiangyu Zhang, Shaoqing Ren, and Jian Sun. Deep residual learning for image recognition. In 2016 IEEE Conference on Computer Vision and Pattern Recognition, CVPR 2016, Las Vegas, NV, USA, June 27-30, 2016, pages 770--778, 2016.
- [12] Roei Herzig, Moshiko Raboh, Gal Chechik, Jonathan Berant, and Amir Globerson. Mapping images to scene graphs with permutation-invariant structured prediction. In Advances in Neural Information Processing Systems (NIPS), 2018.
- [13] Junqi Jin, Kun Fu, Runpeng Cui, Fei Sha, and Changshui Zhang. Aligning where to see and what to tell: image caption with region-based attention and scene factorization. CoRR, abs/1506.06272, 2015.
- [14] Justin Johnson, Ranjay Krishna, Michael Stark, Li-Jia Li, David A. Shamma, Michael S. Bernstein, and Fei-Fei Li. Image retrieval using scene graphs. In IEEE Conference on Computer Vision and Pattern Recognition, CVPR 2015, Boston, MA, USA, June 7-12, 2015, pages 3668--3678, 2015.
- [15] Stephen C Johnson. Hierarchical clustering schemes. Psychometrika, 32(3):241--254, 1967.
- [16] Ranjay Krishna, Yuke Zhu, Oliver Groth, Justin Johnson, Kenji Hata, Joshua Kravitz, Stephanie Chen, Yannis Kalantidis, Li-Jia Li, David A. Shamma, Michael S. Bernstein, and Fei-Fei Li. Visual genome: Connecting language and vision using crowdsourced dense image annotations. CoRR, abs/1602.07332, 2016.
- [17] Yikang Li, Wanli Ouyang, Bolei Zhou, Kun Wang, and Xiaogang Wang. Scene graph generation from objects, phrases and region captions. In IEEE International Conference on Computer Vision, ICCV 2017, Venice, Italy, October 22-29, 2017, pages 1270--1279, 2017.
- [18] Tsung-Yi Lin, Michael Maire, Serge J. Belongie, Lubomir D. Bourdev, Ross B. Girshick, James Hays, Pietro Perona, Deva Ramanan, Piotr Dollár, and C. Lawrence Zitnick. Microsoft COCO: common objects in context. CoRR, abs/1405.0312, 2014.
- [19] Cewu Lu, Ranjay Krishna, Michael S. Bernstein, and Fei-Fei Li. Visual relationship detection with language priors. In Computer Vision - ECCV 2016 - 14th European Conference, Amsterdam, The Netherlands, October 11-14, 2016, Proceedings, Part I, pages 852--869, 2016.
- [20] Alejandro Newell and Jia Deng. Pixels to graphs by associative embedding. In Advances in Neural Information Processing Systems 30: Annual Conference on Neural Information Processing Systems 2017, 4-9 December 2017, Long Beach, CA, USA, pages 2168--2177, 2017.
- [21] Will Norcliffe-Brown, Efstathios Vafeias, and Sarah Parisot. Learning conditioned graph structures for interpretable visual question answering. CoRR, abs/1806.07243, 2018.
- [22] Heiko Paulheim. Knowledge graph refinement: A survey of approaches and evaluation methods. Semantic web, 8(3):489--508, 2017.
- [23] Jeffrey Pennington, Richard Socher, and Christopher D. Manning. Glove: Global vectors for word representation. In Proceedings of the 2014 Conference on Empirical Methods in Natural Language Processing, EMNLP 2014, October 25-29, 2014, Doha, Qatar, A meeting of SIGDAT, a Special Interest Group of the ACL, pages 1532--1543, 2014.
- [24] Julia Peyre, Ivan Laptev, Cordelia Schmid, and Josef Sivic. Weakly-supervised learning of visual relations. In ICCV, 2017.
- [25] Shaoqing Ren, Kaiming He, Ross B. Girshick, and Jian Sun. Faster R-CNN: towards real-time object detection with region proposal networks. IEEE Trans. Pattern Anal. Mach. Intell., 39(6):1137--1149, 2017.
- [26] Mohammad Amin Sadeghi and Ali Farhadi. Recognition using visual phrases. 2011.
- [27] Christian Szegedy, Sergey Ioffe, and Vincent Vanhoucke. Inception-v4, inception-resnet and the impact of residual connections on learning. CoRR, abs/1602.07261, 2016.
- [28] Christian Szegedy, Wei Liu, Yangqing Jia, Pierre Sermanet, Scott E. Reed, Dragomir Anguelov, Dumitru Erhan, Vincent Vanhoucke, and Andrew Rabinovich. Going deeper with convolutions. CoRR, abs/1409.4842, 2014.
- [29] Jasper R. R. Uijlings, Koen E. A. van de Sande, Theo Gevers, and Arnold W. M. Smeulders. Selective search for object recognition. International Journal of Computer Vision, 104(2):154--171, 2013.
- [30] Petar Veličković, William Fedus, William L Hamilton, Pietro Liò, Yoshua Bengio, and R Devon Hjelm. Deep graph infomax. arXiv preprint arXiv:1809.10341, 2018.
- [31] Quan Wang, Zhendong Mao, Bin Wang, and Li Guo. Knowledge graph embedding: A survey of approaches and applications. IEEE Trans. Knowl. Data Eng., 29(12):2724--2743, 2017.
- [32] Saining Xie, Ross B. Girshick, Piotr Dollár, Zhuowen Tu, and Kaiming He. Aggregated residual transformations for deep neural networks. CoRR, abs/1611.05431, 2016.
- [33] Danfei Xu, Yuke Zhu, Christopher B. Choy, and Li Fei-Fei. Scene graph generation by iterative message passing. In 2017 IEEE Conference on Computer Vision and Pattern Recognition, CVPR 2017, Honolulu, HI, USA, July 21-26, 2017, pages 3097--3106, 2017.
- [34] Danfei Xu, Yuke Zhu, Christopher B. Choy, and Li Fei-Fei. Scene graph generation by iterative message passing. In 2017 IEEE Conference on Computer Vision and Pattern Recognition, CVPR 2017, Honolulu, HI, USA, July 21-26, 2017, pages 3097--3106, 2017.
- [35] Jianwei Yang, Jiasen Lu, Stefan Lee, Dhruv Batra, and Devi Parikh. Graph R-CNN for scene graph generation. In Computer Vision - ECCV 2018 - 15th European Conference, Munich, Germany, September 8-14, 2018, Proceedings, Part I, pages 690--706, 2018.
- [36] Ting Yao, Yingwei Pan, Yehao Li, and Tao Mei. Exploring visual relationship for image captioning. In Computer Vision - ECCV 2018 - 15th European Conference, Munich, Germany, September 8-14, 2018, Proceedings, Part XIV, pages 711--727, 2018.
- [37] Zhou Yu, Jun Yu, Chenchao Xiang, Jianping Fan, and Dacheng Tao. Beyond bilinear: Generalized multi-modal factorized high-order pooling for visual question answering. CoRR, abs/1708.03619, 2017.
- [38] Rowan Zellers, Mark Yatskar, Sam Thomson, and Yejin Choi. Neural motifs: Scene graph parsing with global context. In 2018 IEEE Conference on Computer Vision and Pattern Recognition, CVPR 2018, Salt Lake City, UT, USA, June 18-22, 2018, pages 5831--5840, 2018.
- [39] Hanwang Zhang, Zawlin Kyaw, Shih-Fu Chang, and Tat-Seng Chua. Visual translation embedding network for visual relation detection. In 2017 IEEE Conference on Computer Vision and Pattern Recognition, CVPR 2017, Honolulu, HI, USA, July 21-26, 2017, pages 3107--3115, 2017.
- [40] Ji Zhang, Yannis Kalantidis, Marcus Rohrbach, Manohar Paluri, Ahmed M. Elgammal, and Mohamed Elhoseiny. Large-scale visual relationship understanding. CoRR, abs/1804.10660, 2018.
Appendix A Scene Graph Comparison
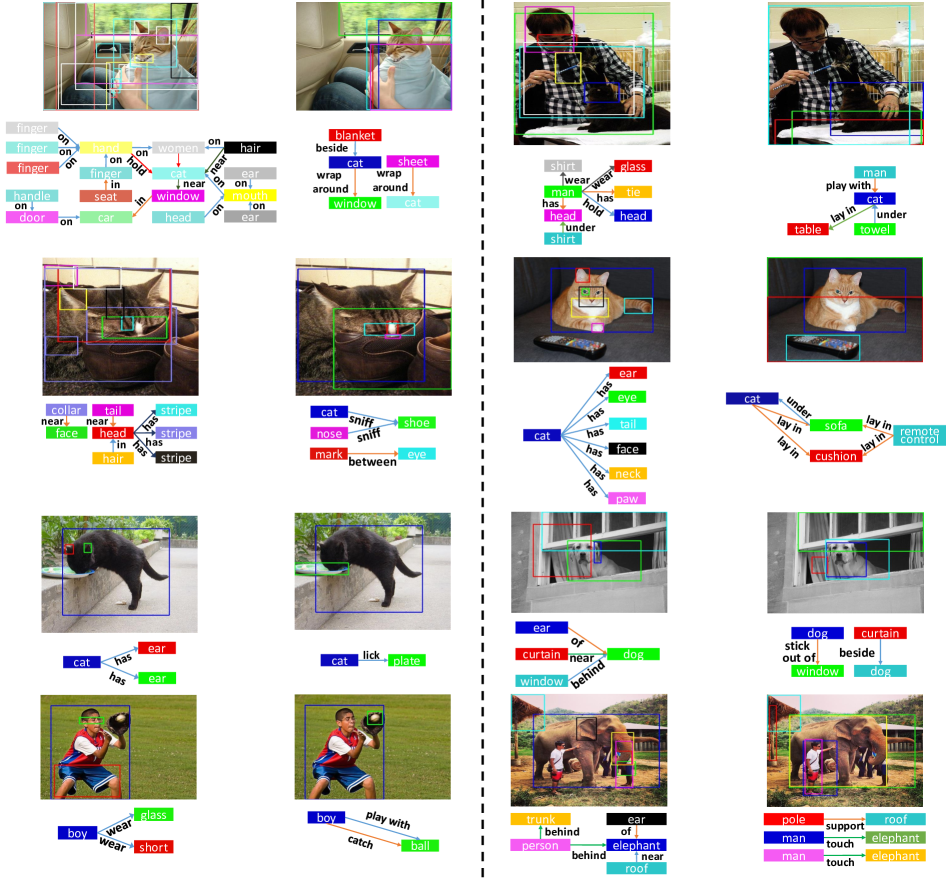
We show additional scene graph examples from dataset VG150 and VrR-VG in Fig. 11. Most of the visually-irrelevant relationships in VG150 like ‘‘on’’, ‘‘near’’, ‘‘has’’, etc. are excluded.
Appendix B Results comparison on VQA task
Additional VQA results are shown in Fig. 12. Thanks to the relationship-aware representation learned from VrR-VG, most of the hard questions about the interactions of instances can be well answered.
Appendix C Results Comparison on Image Captioning Task
As shown in Fig. 13, results in VrR-VG provide more diverse and informative predicates in describing scenes. Although some expressions like “scissors laying on a table" may not lead to high scores in captioning metrics, these vivid and specific results are valuable for cognitive tasks.
![[Uncaptioned image]](/html/1902.00313/assets/x14.png)