High-resolution, accurate MR-TOF-MS for short-lived, exotic nuclei of few events in their ground and low-lying isomeric states
Abstract
Mass measurements of fission and projectile fragments, produced via 238U and 124Xe primary beams, have been performed with the multiple-reflection time-of-flight mass spectrometer (MR-TOF-MS) of the FRS Ion Catcher with a mass resolving powers (FWHM) up to 410,000 and an uncertainty of . The nuclides were produced and separated in-flight with the fragment separator FRS at 300 to 1000 MeV/u and thermalized in a cryogenic stopping cell. The data-analysis procedure was developed to determine with highest accuracy the mass values and the corresponding uncertainties for the most challenging conditions: down to a few events in a spectrum and overlapping distributions, characterized only by a broader common peak shape. With this procedure, the resolution of low-lying isomers is increased by a factor of up to three compared to standard data analysis. The ground-state masses of 31 short-lived nuclides of 15 different elements with half-lives down to 17.9 ms and count rates as low as 11 events per nuclide were determined. This is the first direct mass measurement for seven nuclides. The excitation energies and the isomer-to-ground state ratios of six isomeric states with excitation energies down to about 280 keV were measured. For nuclides with known mass values, the average relative deviation from the literature values is . The measured two-neutron separation energies and their slopes near and at the N=126 and Z=82 shell closures indicate a strong element-dependent binding energy of the first neutron above the closed proton shell Z=82. The experimental results deviate strongly from the theoretical predictions, especially for N=126 and N=127.
I Introduction
Masses are a key property of atomic nuclei. Accurate measurements are needed to understand the evolution of nuclear structure Bohr and Mottelson (1998) and stellar nucleosynthesis Schatz (2013). In particular, nuclear masses indicate the limits of nuclear existence, changes in nuclear deformation and the onset of nuclear collectivity Zhang et al. (2016). Accurate mass values are an important nuclear ingredient to r-process calculations Mumpower et al. (2016). They significantly affect the description of the equation-of-state of nuclear matter, which can be extended to describe neutron-star matter and crustal composition Wolf et al. (2013a).
The knowledge of isomer excitation energies and isomer-to-ground state ratios are of great importance to nuclear structure and reactions. Direct measurements of excitation energies can be complementary to gamma de-excitation measurements. Mass measurements are for long-lived isomers the only applicable method.
Driven by this motivation, multiple-reflection time-of-flight mass spectrometry Wollnik and Przewloka (1990) has been developed to determine nuclear masses of very exotic nuclei at ground and isomeric states, which have half-lives as short as a few milliseconds and which can only be produced with a few events per hour or day Plaß et al. (2013a). It has a unique combination of performance parameters: fast (cycle times of a few milliseconds), accurate (relative mass measurement uncertainty below ), sensitive (only a few detected ions per nuclide are required for the accurate mass determination) and non-scanning (simultaneous measurement of many different nuclides). Established methods for mass measurements of exotic nuclei, such as isochronous Knöbel et al. (2016) or Schottky mass spectrometry Litvinov et al. (2005); Chen et al. (2010) in storage rings, or TOF-ICR Blaum et al. (2013)) or PI-ICR Eliseev et al. (2013) in Penning traps, do not offer these four characteristics simultaneously. Typically, they are either very accurate or fast, but not both at the same time. Therefore, MR-TOF-MS is the technique of choice for highly accurate mass measurements of the most exotic nuclides, especially when dealing with short half-lives, low rates, a high amount of contaminants, or low-lying isomers.
Multiple-reflection time-of-flight mass spectrometers (MR-TOF-MS) have been developed for mass measurements at different rare isotope beam (RIB) facilities world-wide Dickel et al. (2015a); Wolf et al. (2013b); Schury et al. (2013); Jesch et al. (2015). Such MR-TOF-MS measurements have been performed at the forefront in the field Wienholtz et al. (2013); Leistenschneider et al. (2018); Ito et al. (2018); Reiter et al. (2018). In these measurements, typical mass resolving powers of 100,000 to 200,000 and relative accuracies in the range from to corresponding to absolute accuracies of 30 keV/c2 to 200 keV/c2. Recently it has even been shown that the uncertainties in MR-TOF-MS mass measurements can be reduced by an order of magnitude, well below Dickel et al. (2015a); Schury et al. (2013); Kimura et al. (2018) and thus it has reached an accuracy region that was previously accessible with Penning traps only. However, present MR-TOF-MS with a mass resolving power of 100,000 require more than 1000 detected ions to reach a mass accuracy of . For rare exotic nuclei such a measurement requires many hours or even days of accelerator beam time. With our superior mass resolving power compared to other MR-TOF-MS we can resolve low-lying isomeric states for the first timeKimura et al. (2018).
The MR-TOF-MS Dickel et al. (2015a) developed for the FRS Ion Catcher (FRS-IC) Plaß et al. (2013b) and the MATS experiment Rodriguez et al. (2010) at FAIR has been designed to overcome these problems Plaß et al. (2013a) and to enable mass measurements on the accuracy level of with a few tens of detected ions. This can be achieved due to its much higher mass resolving power than that of MR-TOF-MS installed at other RIB facilities around the world. However, even at very high resolving powers, low-lying isomers can result in overlapping peaks. Therefore, a data-analysis procedure is required, which is suitable for spectra with overlapping peaks and few events only. Special measures within the data-analysis procedure have to be taken to determine accurately the ground state mass, the excitation energy, the isomer-to-ground state ratios, and their respective uncertainties.
In this work, close-lying peaks are classified as follows; a corresponding illustration is given in Fig. 1.
Class A: The sum of the distributions reaches almost zero between the peaks. In this case the distributions is considered as non-overlapping and can be analyzed independently.
Class B: The sum of the distributions has a minimum between the peaks, which is significantly larger than zero, even at the minimum. The distributions can be considered as resolved overlapping peaks and an appropriate analysis is performed. In this case the determination of the exact peak shape is important for the extraction of accurate values for the masses and their abundance ratios.
Class C: The sum of the distributions does not have a minimum between the peaks. The existence of a double peak can be determined only from a change in the peak shape, e.g. a peak shoulder or a peak broadening, as compared to an individual peak. In this challenging case, the proper determination of the peak shape is a crucial prerequisite in order to first, detect the existence of a second peak and second, to extract the mass values and abundance ratios of the peaks.
Class D: Both peaks overlap almost completely. No change in the peak shape can be observed in the sum of the distributions. In this case the peaks must be considered as unresolved, and the (possible) existence of overlapping peaks can only be taken into account by increasing the uncertainty of the mass value(s).
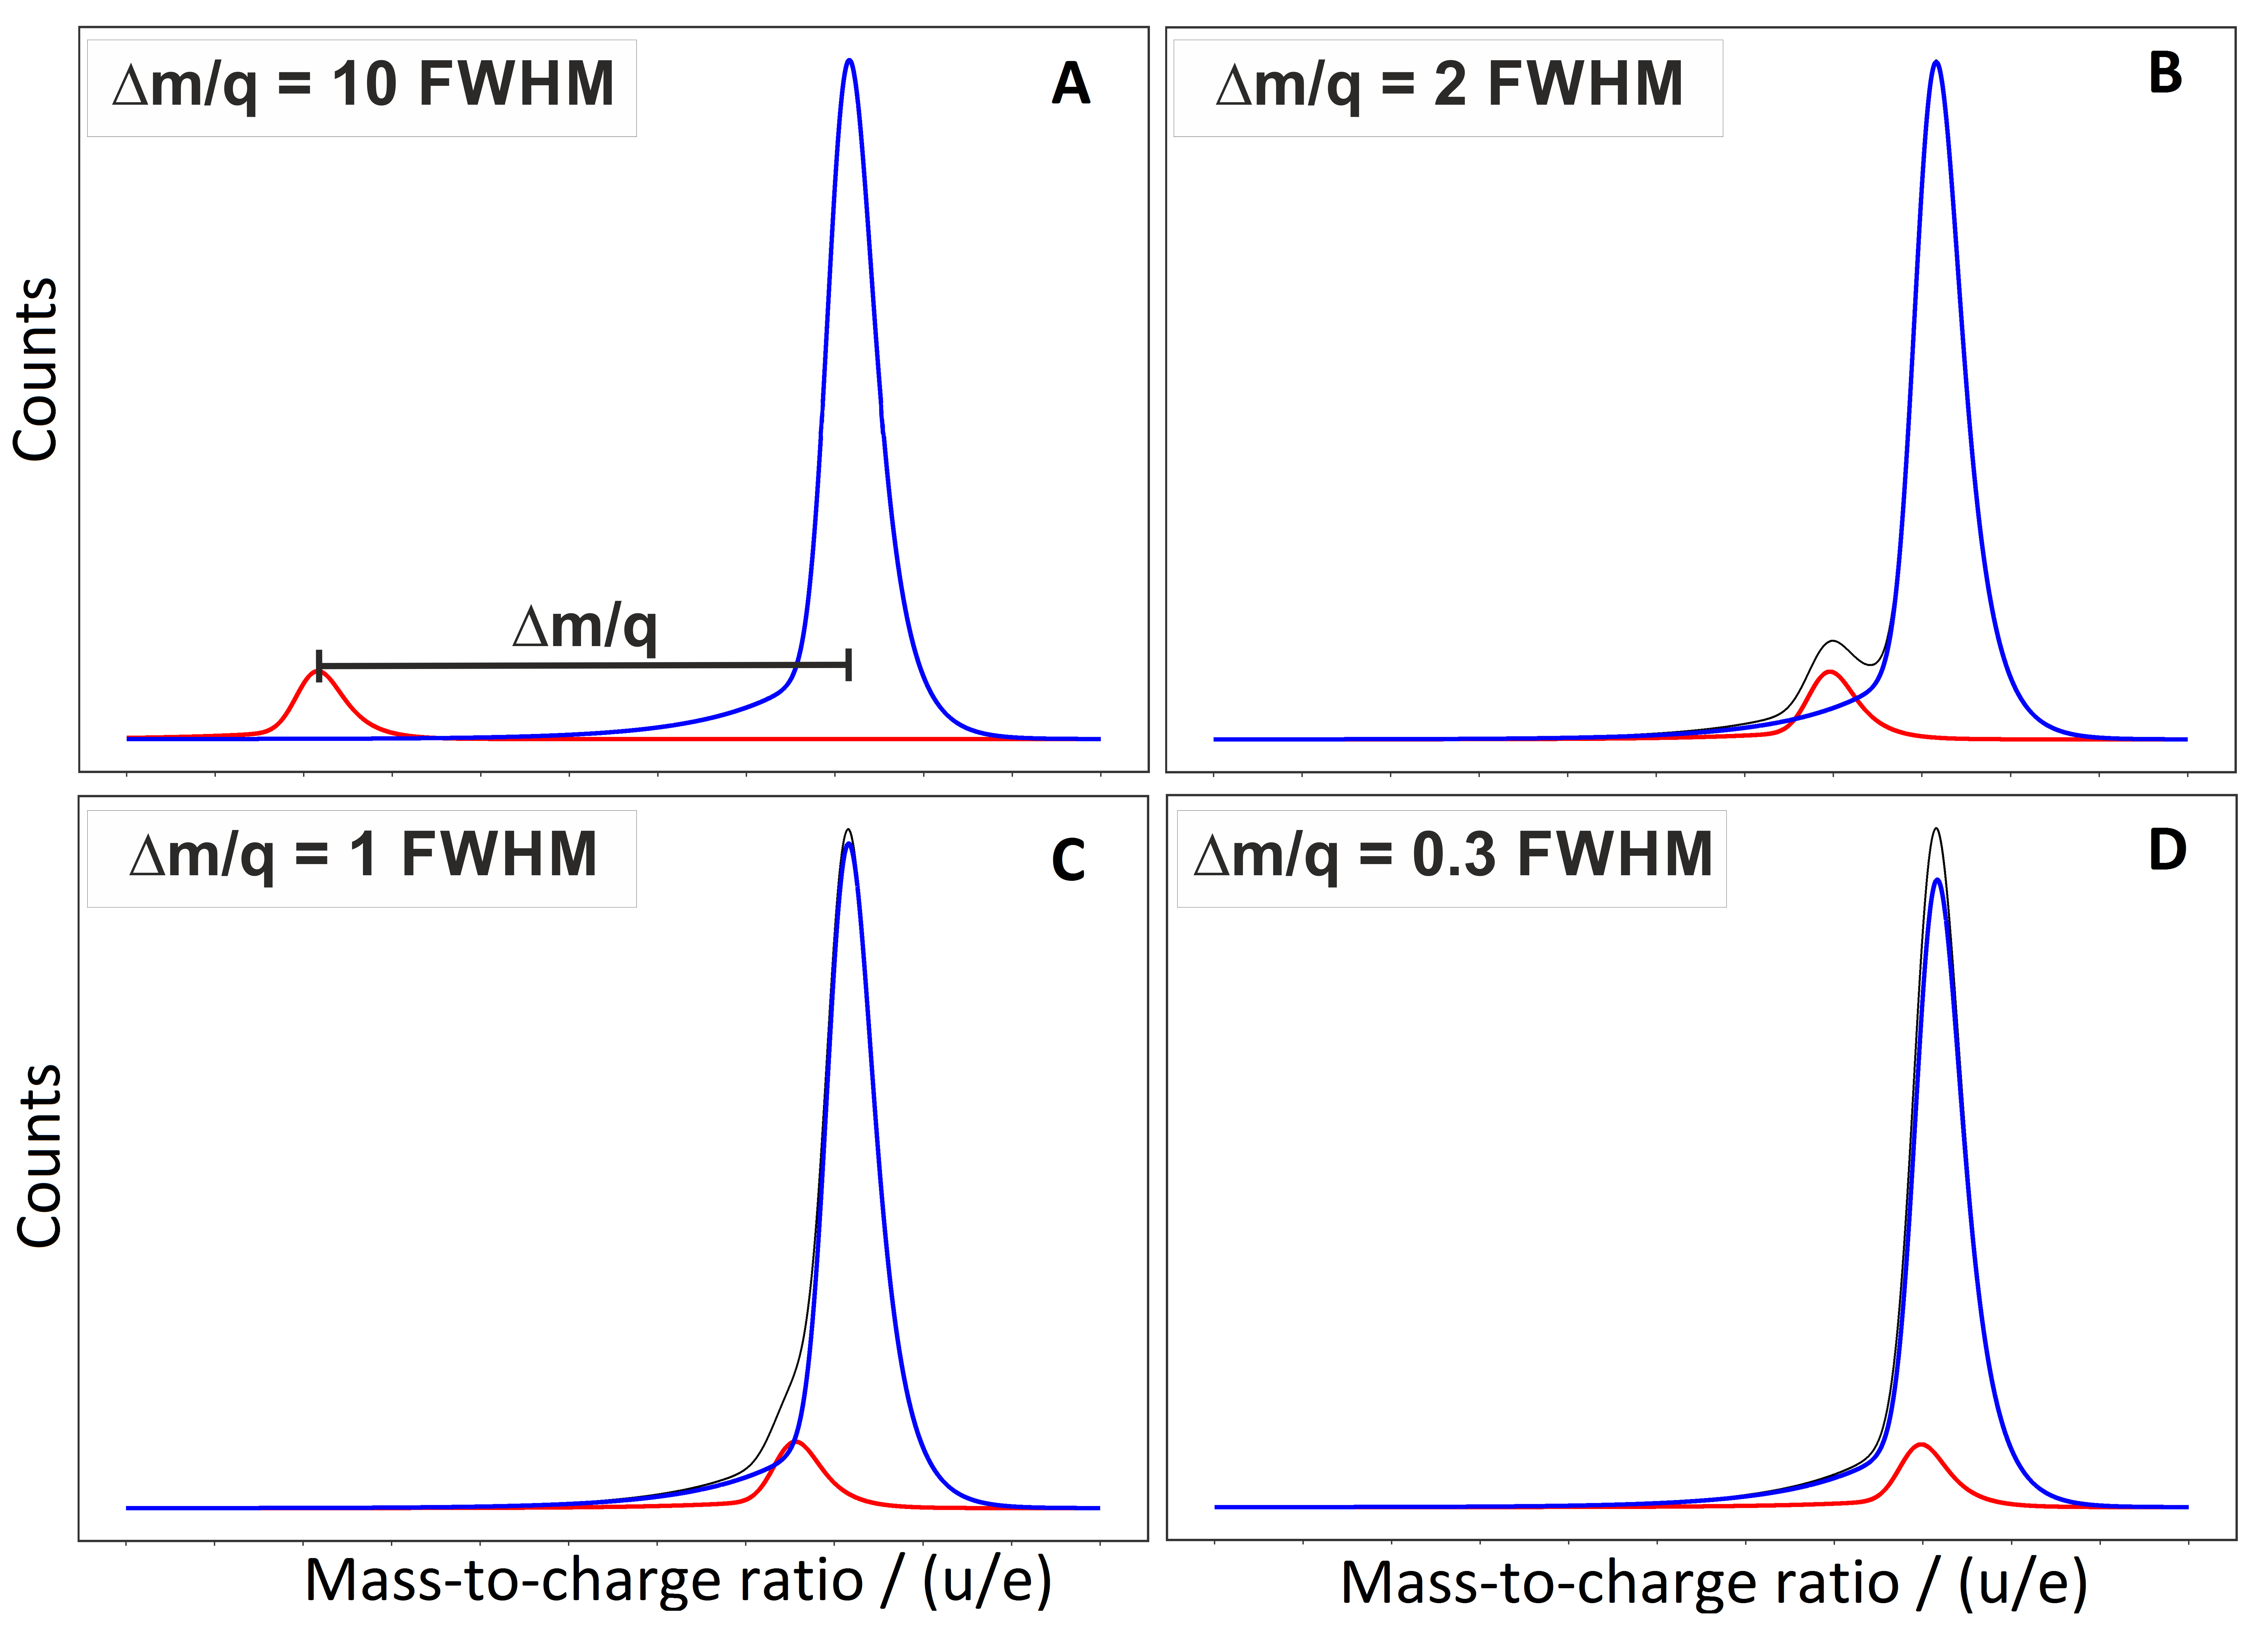
The mass-to-charge ratio difference between the distributions, the peak shapes and the abundance ratio determine to which class a measurement belongs. While simple data analysis methods can obtain accurate mass and abundance values only for Classes A and B, particularly for peaks with a few events, the data analysis method developed in this work is capable of extracting accurate mass and abundance values even for Class C. For the example shown in Fig. 1 this corresponds to an increase in the effective mass resolving power for overlapping peaks by a factor of about three.
In this publication, mass measurements of 238U and 124Xe projectile fragments and of 238U fission fragments with the MR-TOF-MS of the FRS Ion Catcher at GSI (Germany), the data-analysis procedure and the results are presented. The work includes the measurement with a mass-to-charge ratio difference corresponding down to 280 keV/(c2e) and with down to 11 events. Further details can be found in Ebert (2016); Ayet San Andrés (2018); Hornung (2018).
II Experiments
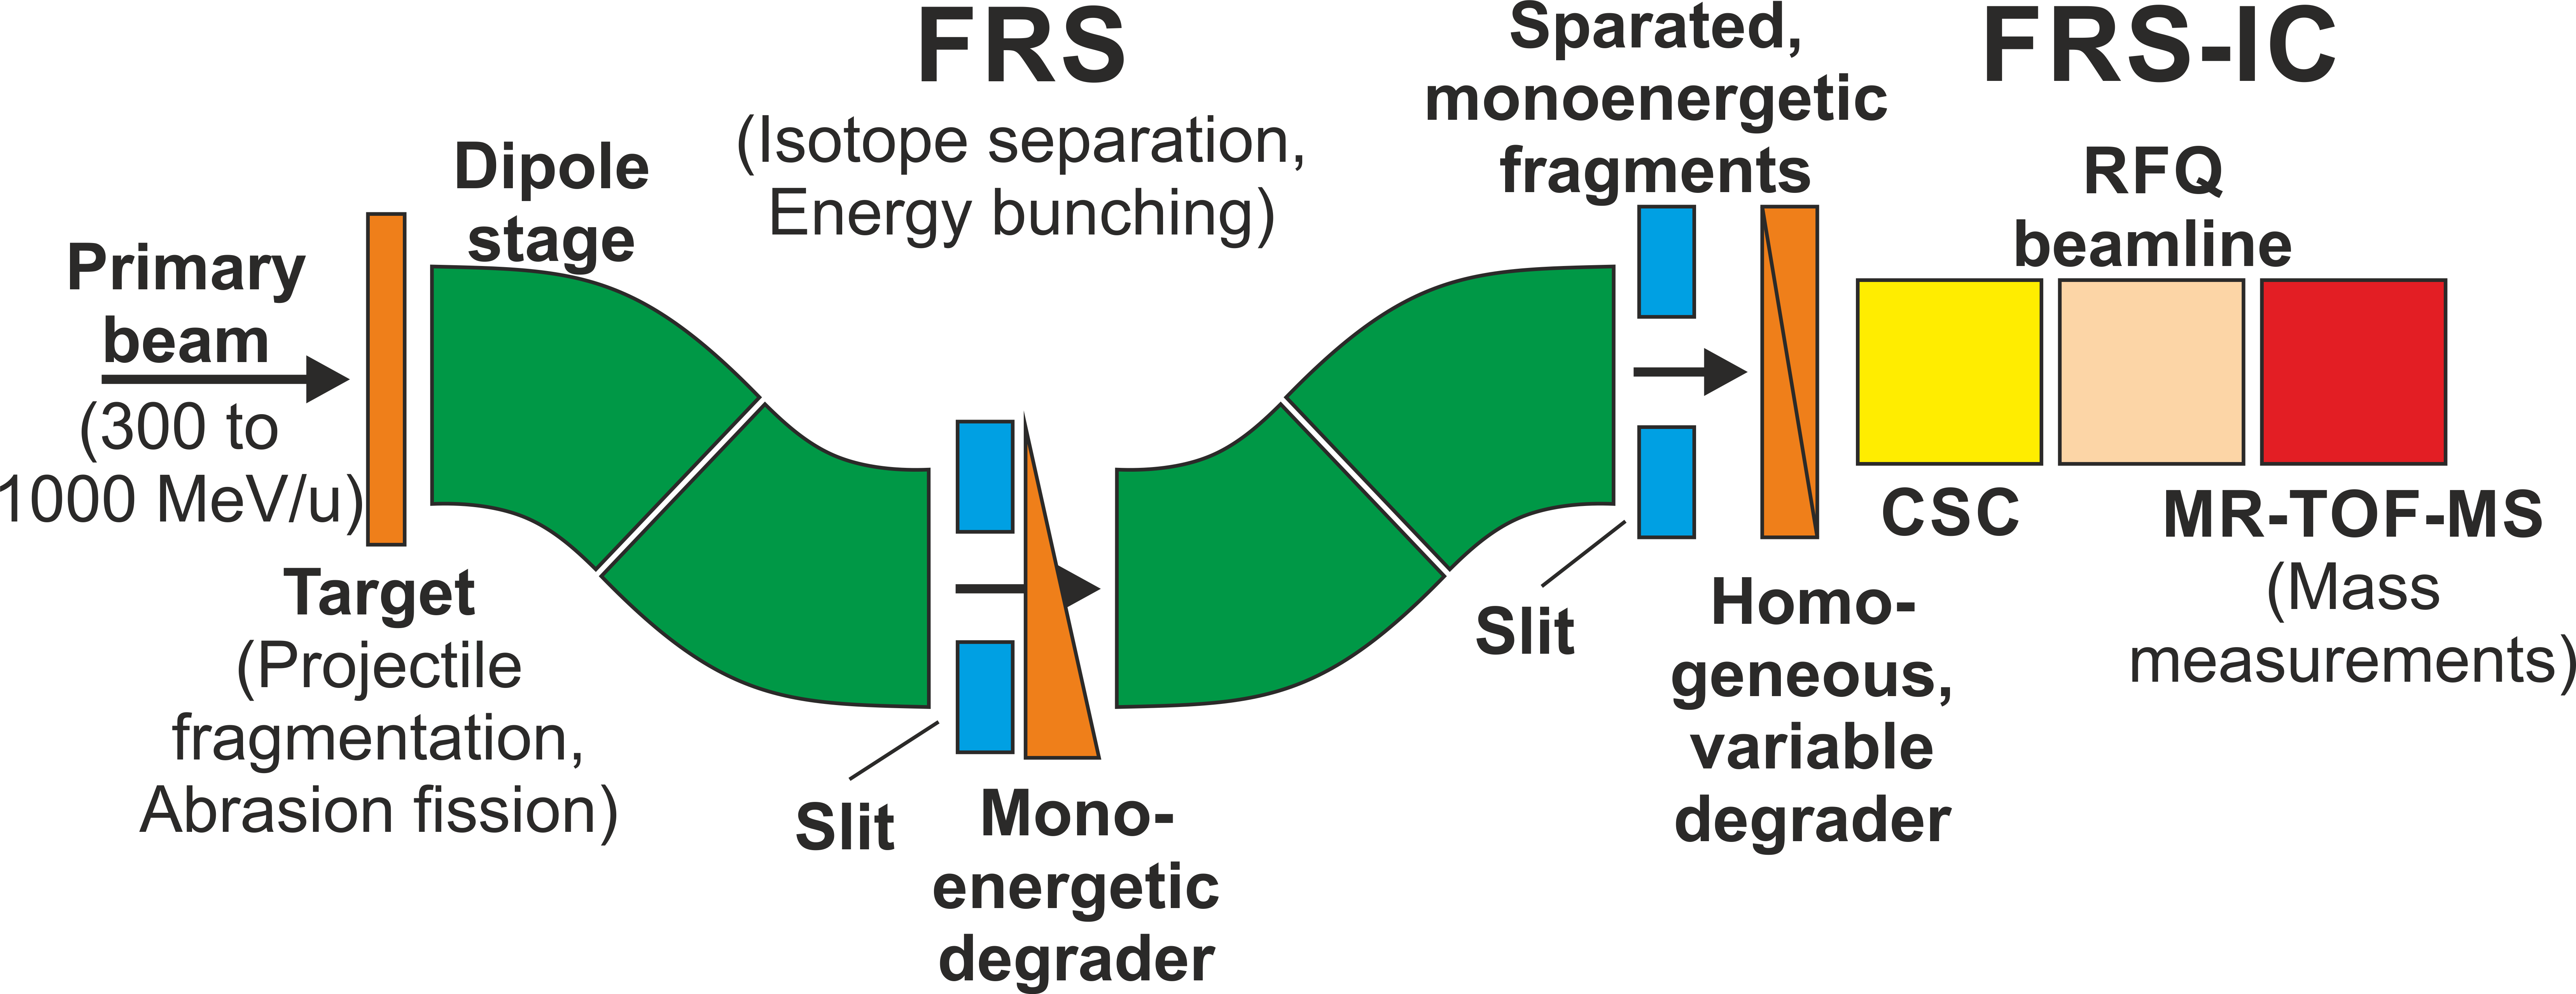
The FRS Ion Catcher is an experimental setup installed at the final focal plane of the fragment separator FRS Geissel et al. (1992) at GSI. The FRS in combination with the FRS-IC enables experiments with thermalized exotic nuclei. In Fig. 2 a schematic view of the FRS-IC with its three main parts is shown: (i) the gas-filled Cryogenic Stopping Cell (CSC) Ranjan et al. (2011); Purushothaman et al. (2013); Ranjan et al. (2015); Reiter (2015) for complete slowing-down of the exotic nuclei produced at relativistic energies, (ii) a beamline, based on Radio Frequency Quadrupoles (RFQ) Reiter (2015, 2011); Miskun et al. (2015); Haettner et al. (2018) for mass-selective transport and differential pumping. Furthermore, it is equipped with detectors (channeltrons and silicon detectors) for ion counting and -decay spectroscopy and with ion sources for diagnostic purposes. (iii) The MR-TOF-MS Dickel et al. (2015a); Plaß et al. (2008); Dickel (2010) for performing direct mass measurements.
The MR-TOF-MS includes a buffer gas-filled RFQ-based switchyard Greiner (2013); Plaß et al. (2015); Ebert (2016), which is capable of merging, guiding and splitting low energy ion beams. A combination of a thermal ion source (HeatwaveLabs, Watsonville, CA, USA; mixed source: Ca, Sr and Ba) and an electron-impact ion source is mounted on the top of the switchyard, which generates calibrant ions over a broad mass-to-charge range Ebert (2016), using various gases such as SF6, Xe or C3F8. Additional ions for calibration were provided by an 223Ra open -recoil ion source mounted inside the CSC. After the first two experiments the 223Ra ion source was replaced by the longer-lived -emitter 228Th Rink (2017).
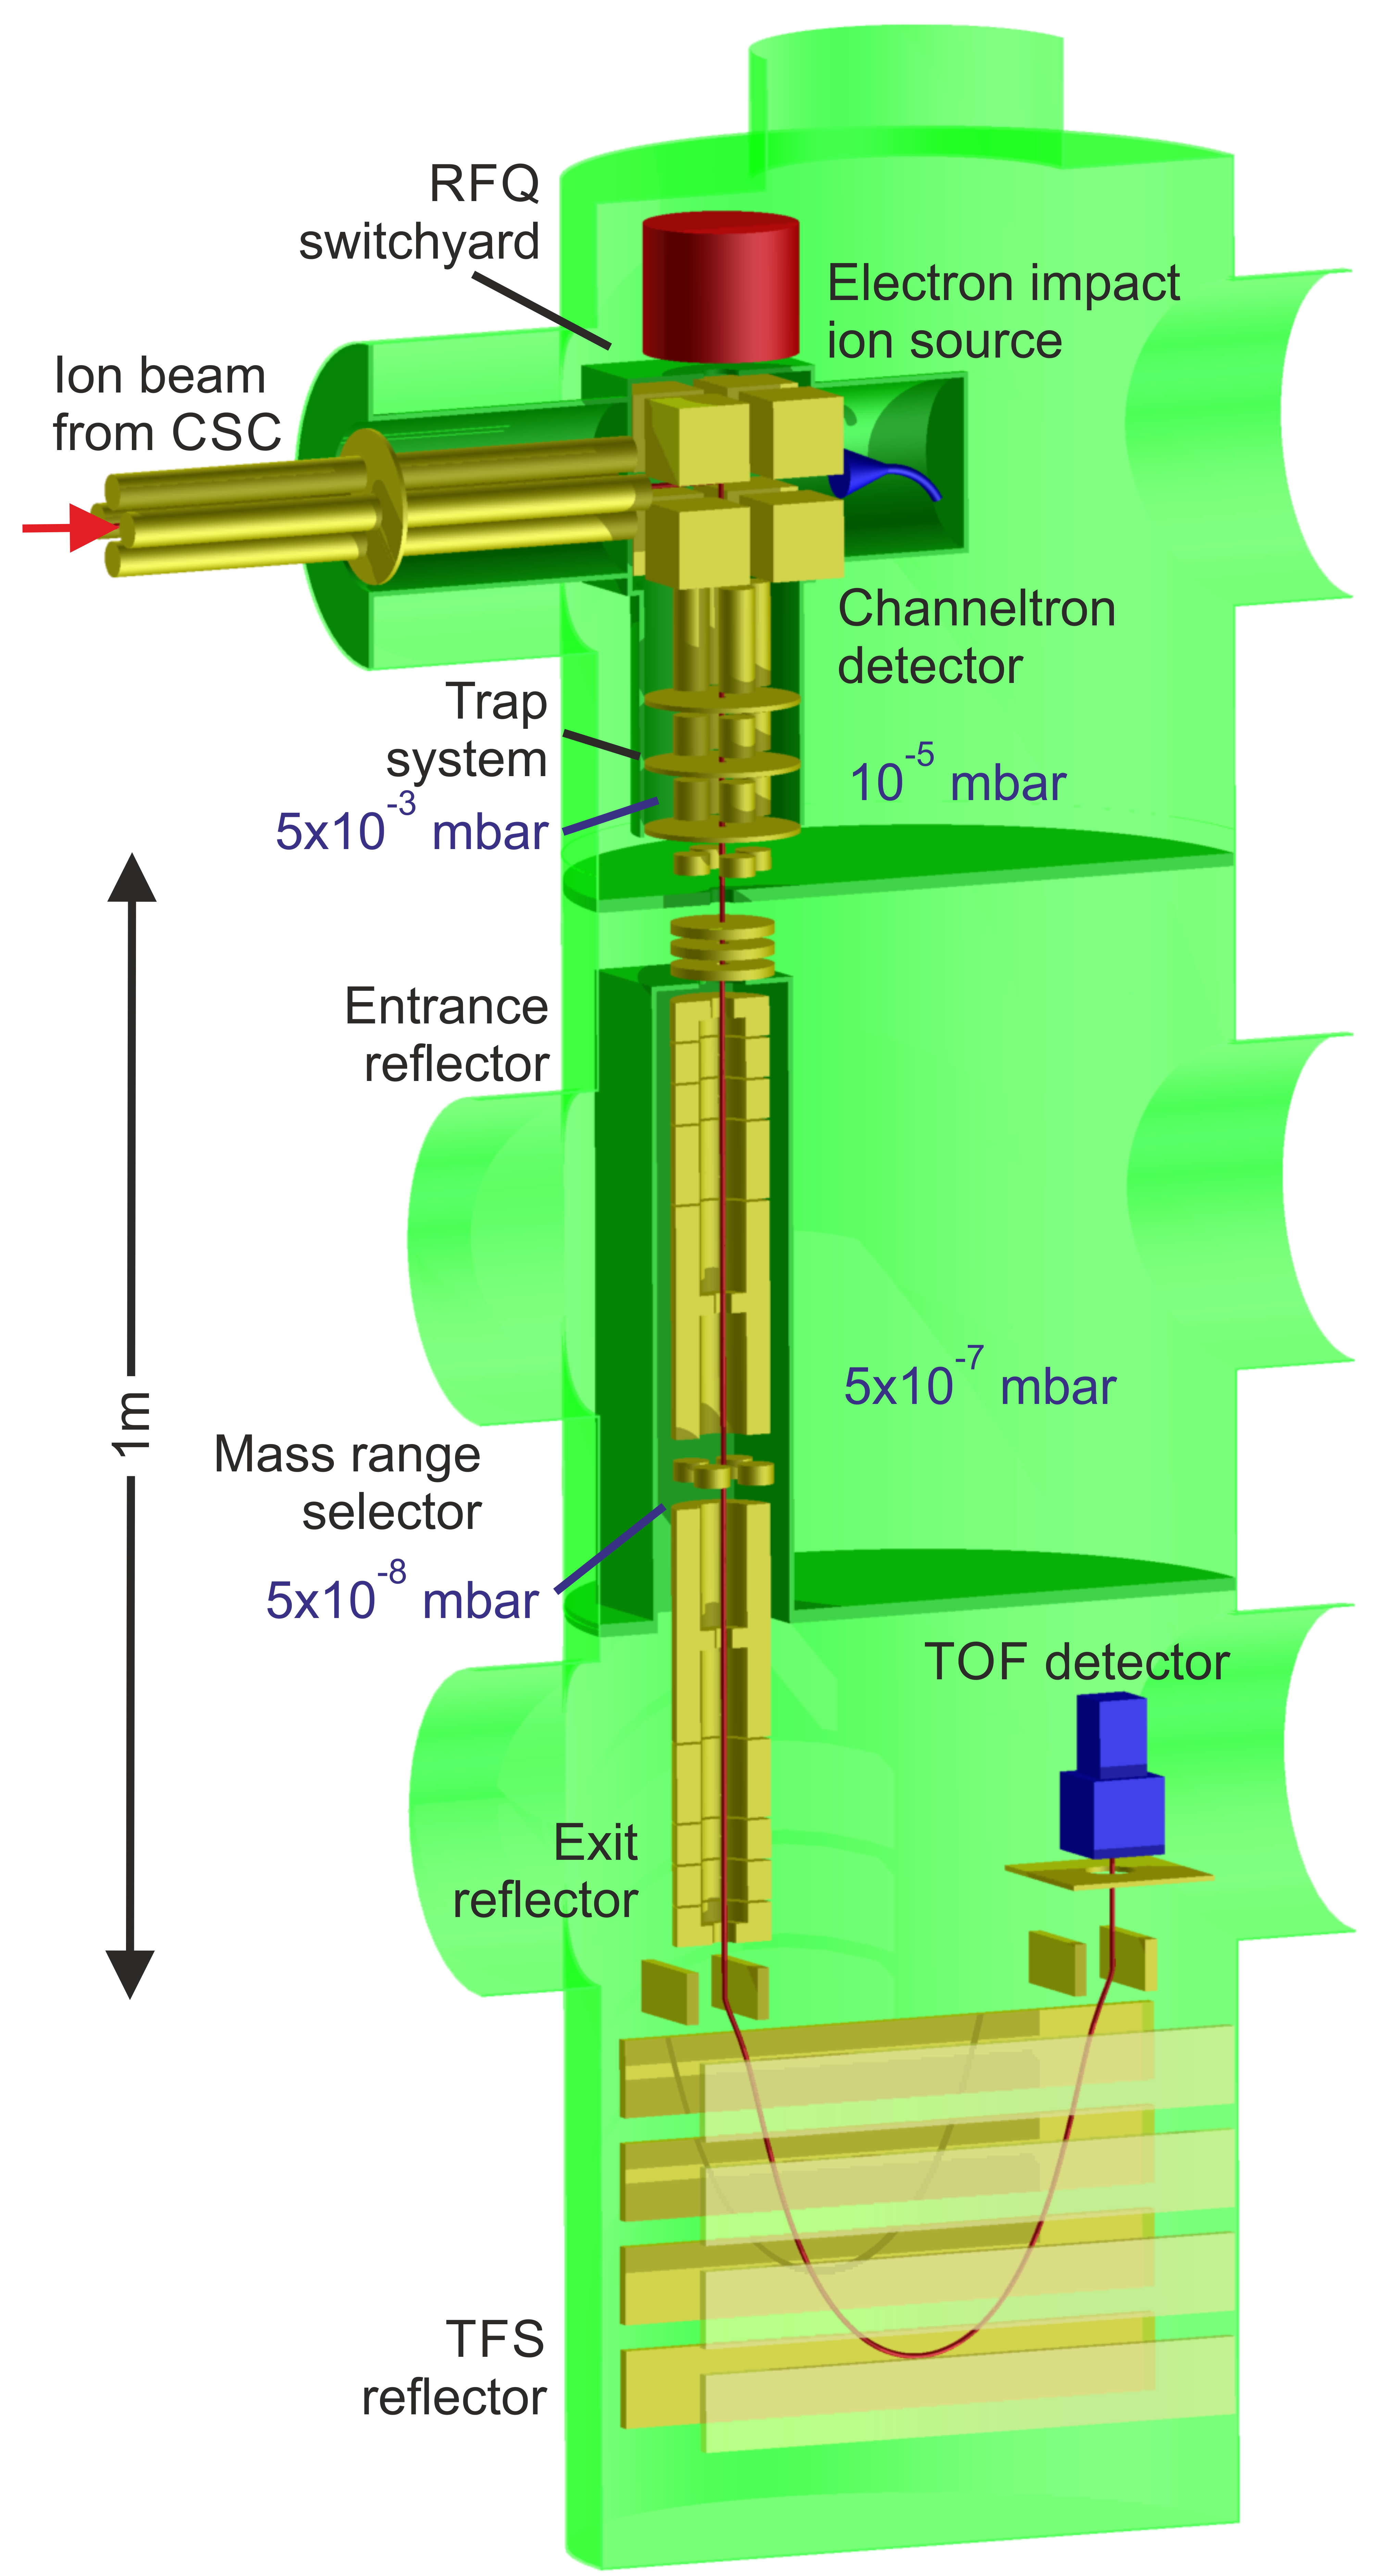
A schematic view of the MR-TOF-MS of the FRS-IC is shown in Fig. 3. The ions enter the MR-TOF-MS with a kinetic energy of a few eV. In a trap system, they are bunched, their reference potential is raised from about -100 V to 1300 V and they are injected with a repetition rate of 50 Hz towards the analyzer, which is formed by two electrostatic reflectors. The drift tube is at ground potential. The outer electrodes of both reflectors are switched for injection and ejection of the ions towards the time-of-flight (TOF) detector (ETP MagneTOF). In the center of the analyzer is a mass-range selector (MRS) based on a pulsed quadrupolar deflector, which controls the transmitted mass-to-charge window, i.e., ensures an unambiguous mass-to-charge ratio spectrum.
After the ions are ejected from the analyzer, they pass through the time-focus shift (TFS) reflector Plaß et al. (2008); Yavor et al. (2015); Dickel et al. (2017a), which was previously referred to as post-anaylzer reflector according to its position in the device, and impinge on the TOF detector. As an alternative to measurements with the TOF detector, the ions can also be spatially separated with a Bradbury-Nielsen Gate, such that the MR-TOF-MS can be used as an isobar and isomer separator Plaß et al. (2008); Dickel et al. (2015b). The data acquisition system is based on a commercial Time-to-Digital Converter (TDC), model Ortec-9353. The control of the different electrode potentials along the ion path, are performed via an FPGA-based system Jesch (2016).
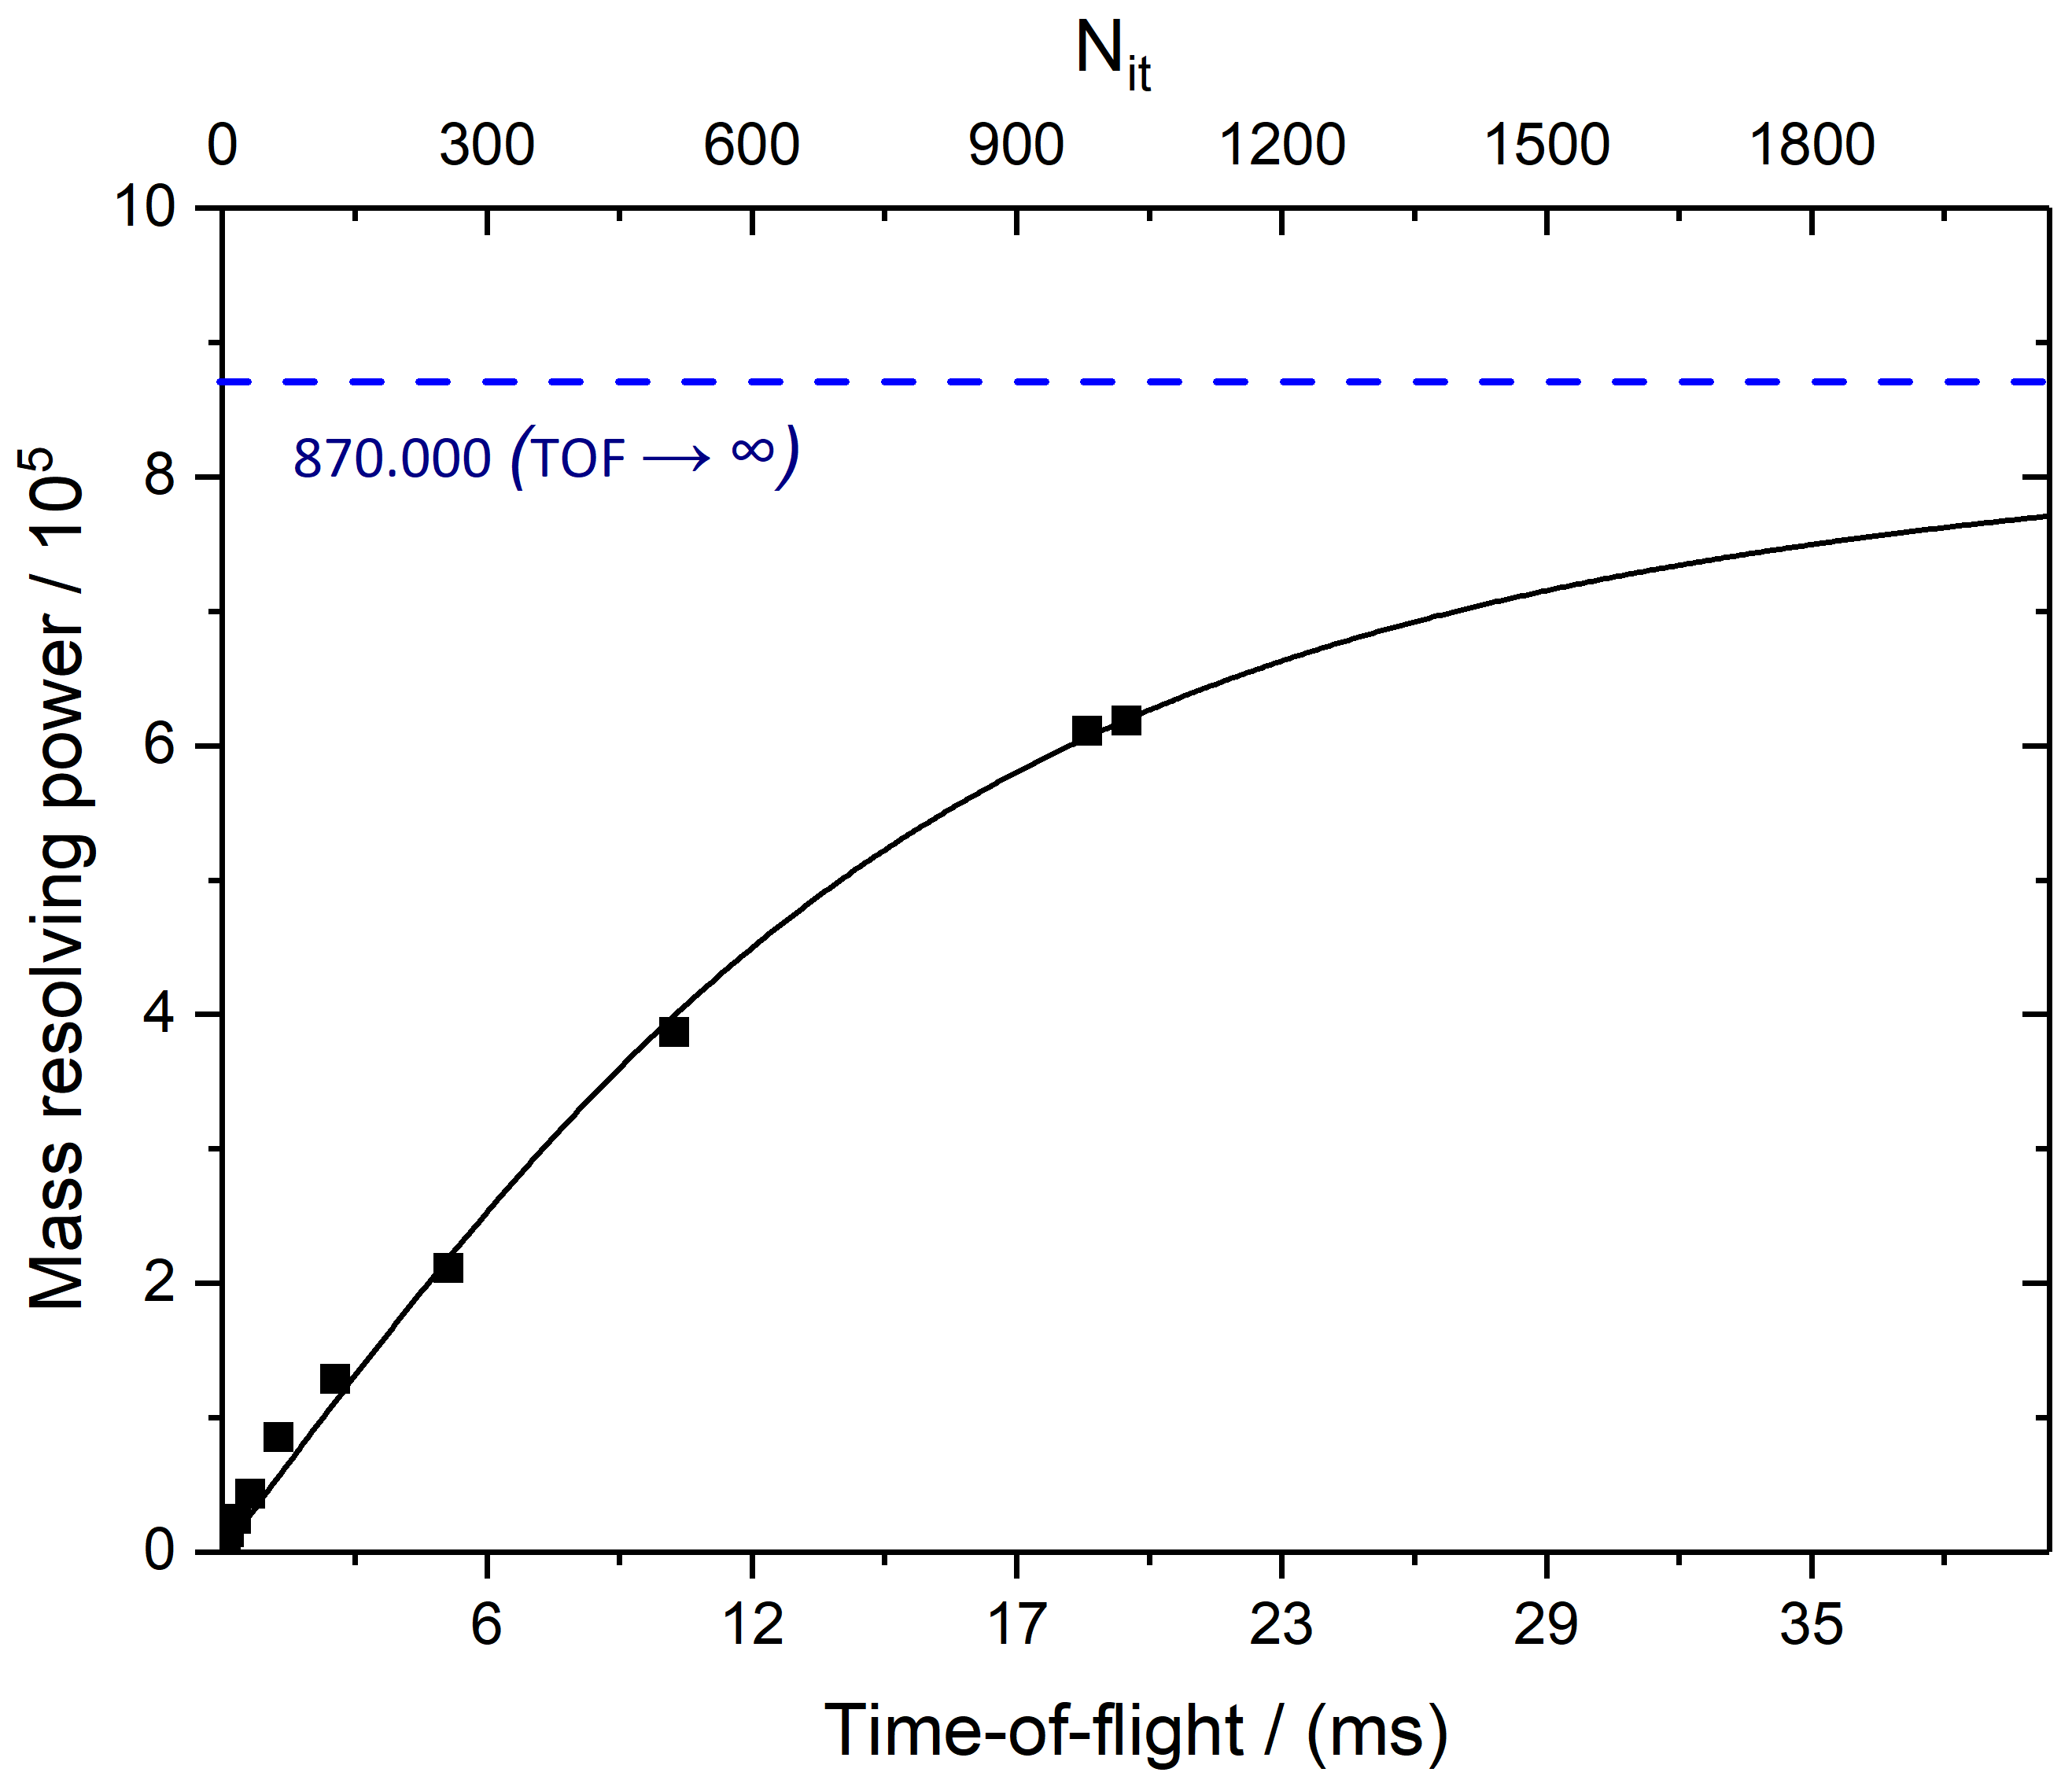
Recently, major improvements have been made to the MR-TOF-MS. (i) The kinetic energy of the ions in the drift tube has been increased by a factor 1.7 Plaß et al. (2015). Together with an improved ion-optical tuning this has lead to an increase in the mass resolving power (FWHM) to above 600,000. Figure 4 shows the mass resolving power determined in a measurement of 39K1+ ions as a function of the number of turns in the analyzer and the time-of-flight. After a flight time of 2 ms a mass resolving power of more than 100,00 is obtained. After a flight time of 20 ms, i.e. the maximum time that is possible for the chosen cycle frequency of 50 Hz, a mass resolving power of 620,000 has been achieved. The asymptote, which is determined by the ion-optical aberration limit, amounts to almost 900,000. (ii) The repetition rate of the MR-TOF-MS has been increased to more than 1 kHz. This increases the rate capability of the device and gives access to shorter-lived nuclei. (iii) The operational reliability and stability have been improved. (iv) The temperature coefficient of MR-TOF-MS has been reduced to 8 ppm/K. (iv) The cleanliness of the buffer gas in the RFQ and trap system has been improved, reducing possible ion losses in the device due to charge-exchange and molecule formation.
In four experiments with the FRS-IC, various exotic nuclei were produced via projectile fragmentation and abrasion-fission. The primary beams were 300 MeV/u and 1000 MeV/u 238U ions and a 600 MeV/u 124Xe ions. The priority of these experiments was the commissioning and characterization of the CSC Reiter et al. (2016). Details of the experimental conditions and the setups are discussed in the following.
Experiment I: 1000 MeV/u uranium fragmentation
A 1000 MeV/u 238U projectile beam was provided from the heavy-ion synchrotron SIS-18 Blasche with an intensity of up to ions per spill, with a spill length of 2 s. A beryllium production target with an areal density of 1.629 g/cm2 with a niobium backing of 0.233 g/cm2 was used at the entrance of the FRS. The ions were energy-bunched via a mono-energetic degrader with an areal density of 4.063 g/cm2 at the central focal plane of the FRS Geissel et al. (1989); Weick et al. (2000). The ions were injected into the CSC with a helium areal density of 3.5 mg/cm2, corresponding to a pressure of 64 mbar, at a temperature of 88 K. For the measurement of 211Po ions, the areal density was increased to 5.6 mg/cm2, corresponding to a pressure of 95 mbar at a temperature of 86 K.
Experiment II: 1000 MeV/u uranium fission
Same conditions as for Experiment I were used, but the areal density of the beryllium production target was 6.333 g/cm2.
Experiment III: 300 MeV/u uranium fragmentation
A 300 MeV/u 238U projectile beam was provided from the heavy-ion synchrotron SIS-18 with an intensity of up to ions per spill, with a typical spill length of 1 s. A beryllium production target with an areal density of 0.270 g/cm2 was used. Due to the low primary beam energy, the material in the beamline was minimized. The mono-energetic degrader at the central focal plane had an areal density of 737.1 mg/cm2. The CSC had an areal density of 3.8 mg/cm2 helium, corresponding to a pressure of 75 mbar at a temperature of 99 K.
Experiment IV: 600 MeV/u xenon fragmentation
A 600 MeV/u 124Xe projectile beam was provided from the SIS-18 with an intensity of up to ions per spill, with a typical spill length of 500 ms. A beryllium production target with an areal density of 1.622 g/cm2 was used. The CSC had an areal density of 3.8 mg/cm2 helium, corresponding to a pressure of 75 mbar at a temperature of 99 K.
The priority in Experiments III and IV were high transmission from the production target to the MR-TOF-MS, whereas Experiments I and II were optimized for spatial isotope separation with the FRS. Due to this difference, the abundance ratio of background to ion of interest (IOI) delivered from the FRS was about 1000 times higher in Experiments III and IV with respect to Experiments I and II. In addition, most of the measurements in Experiments III and IV were done with a broader mass-to-charge range, i.e. several mass-to-charge units simultaneously in the spectrum. This increased the background. The amount of background from molecular ions was reduced in Experiment IV by consecutive ion isolation in the RF mass filter of the RFQ beam line, collision-induced dissociation in an RFQ, McLuckey (1992); Schury et al. (2006)) and again ion isolation, also referred to as the Isolation-Dissociation-Isolation (IDI) method Greiner (2017).
III Basics of MR-TOF-MS
The time-of-flight (TOF) in the MR-TOF-MS is the sum of the TOF from the injection trap to the detector without reflections in the analyzer , and the TOF for reflections:
| (1) |
where is the number of turns in the analyzer and the TOF for each turn. Similarly, the total flight path is given by
| (2) |
where is the path length from the injection trap to the detector and is the path length for one turn in the analyzer. The ion motion from the injection trap to the detector is made isochronous by the shift of the time focus (time-focus-shift, TFS) by means of the TFS-reflector. Each turn in the analyzer preserves the isochronicity Dickel et al. (2017a).
In a time-of-flight mass spectrometer the classical relationship between TOF and mass-to-charge ratio is given by
| (3) |
where and are the mass and charge of the ion, respectively. is the effective voltage, which takes into account the variation of the electric potential along the flight path. The mass resolving power of a time-of-flight mass spectrometer is given by:
| (4) |
where is the spread in time-of-flight. In an experiment, the measured time includes an time delay between the start signal and the real start of ions, caused by the cables and electronic modules, thus:
| (5) |
| (6) |
where and .
| (7) |
where is the turn-around time Wiley and McLaren (1955). is the time spread due to ion-optical aberrations from the injection trap to the detector without reflections in the analyzer. and together represent the error of . is the time spread per turn in the analyzer, which is typically dominated by ion-optical aberrations. Dividing by allows to use measured flight time ratios of a reference ions. To simplify further is replaced by , the mass resolving power for . The turn-around time is calculated for the reference ion and IOI. The mass resolving power for all mass-to-charge ratios and number of turns measured under the identical ion-optical conditions can be calculated by:
| (8) |
IV The data-analysis procedure
The analysis procedure of the MR-TOF-MS data has specific requirements and challenges. The peak-fitting routine must be able to cope with overlapping peaks with very low number of events, where the masses of the nuclei, their abundance and their uncertainties have to be determined with the highest accuracy possible. The knowledge of the individual uncertainty contributions are important to obtain higher accuracies in future experiments.
The TOF of the different nuclei is recorded using the Mass Acquisition (MAc) software Bergmann (2018). This software is also used for the first steps of the data-analysis procedure. The final analysis is performed in the programming language R R Core Team (2017). In Fig. 5, a flow diagram of the data-analysis procedure is shown.
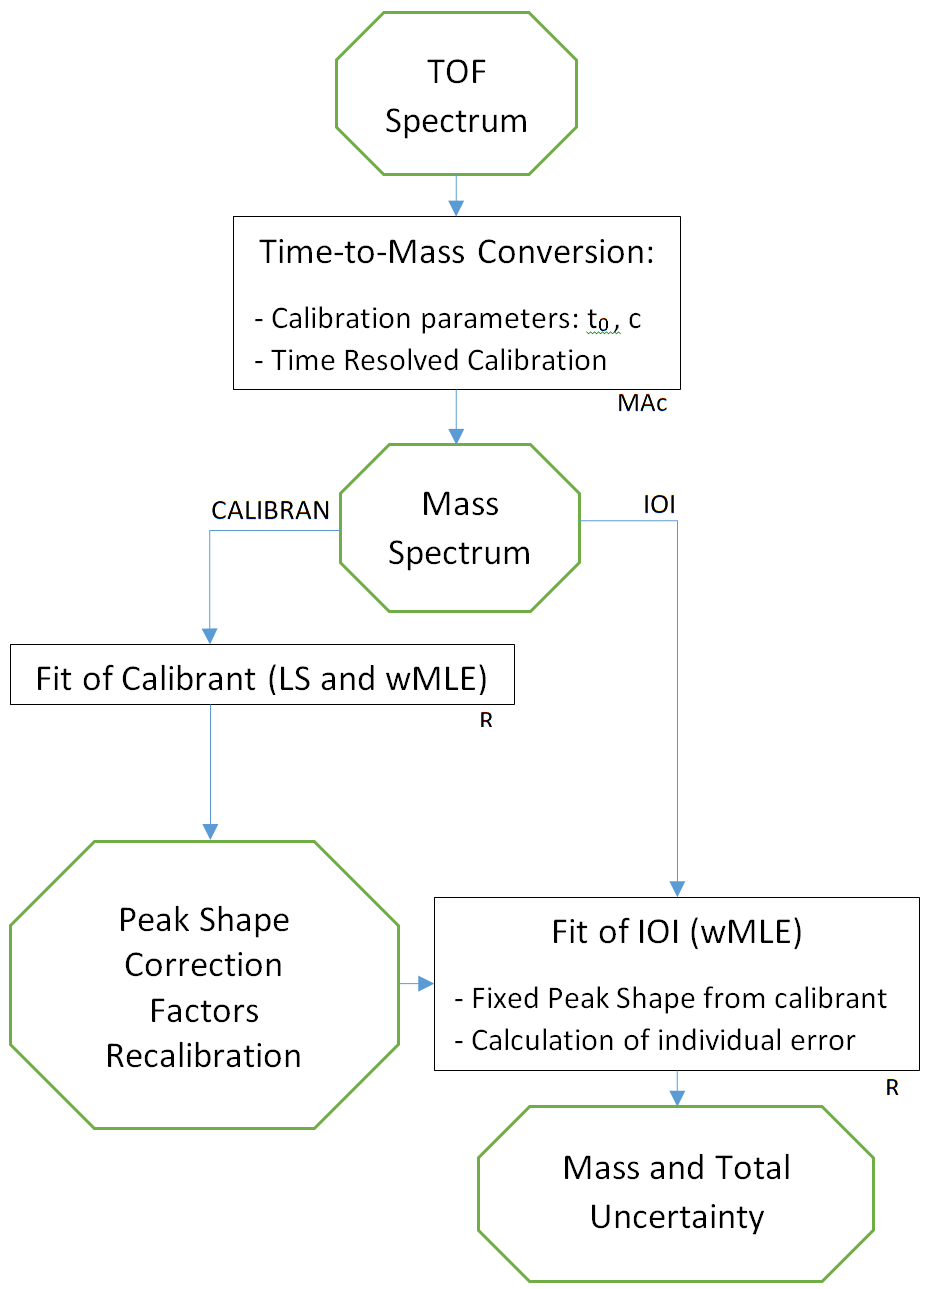
In the following, the data-analysis procedure well suited for close-lying peaks is described.
IV.1 The time-resolved mass calibration (TRC)
The first step in the data-analysis procedure is the conversion of the TOF spectrum into a mass-to-charge spectrum. The TOF of a certain mass-to-charge ratio can fluctuate during the measurement, mainly due to two reasons: changes in the potentials applied to the reflector electrodes in the analyzer, and thermal expansion of the analyzer. High-frequency fluctuations in the kHz range and higher are not relevant during the flight of the ions, since the ions are stored in the analyzer for several milliseconds. The fluctuations at lower frequency (down to 0.1 Hz) are minimized by custom made RC low-pass filters. To cope with even slower changes (mHz and lower) a drift correction in the TOF spectrum Wolf et al. (2013b); Ito et al. (2013) or a time-resolved mass calibration (TRC) can be performed, as it is done in the present work. In TRC the correction is performed in the mass-to-charge spectrum rather than in the TOF spectrum. The TRC is the more powerful method, since it does not introduce additional uncertainties, see Schury et al. (2018). Furthermore, it requires only a single calibrant, even for ions with different number of turns. Note, a relatively coarse mass-to-charge determination is sufficient to perform the TRC.
Equation (6) relates the TOF of an ion to its mass-to-charge ratio. The parameters , and have to be determined using calibrant ions. The parameter is calculated, before or after the actual mass measurement of the IOI, using the TOF of at least two calibrant ion species that were measured without isochronous turns, in the so-called time-focus shifting (TFS) mode Dickel et al. (2017a). Two options are possible to determine and : (i) The high-resolution mass-to-charge spectrum containing the IOI and two calibrant ion species undergoing different turn numbers yield both and . (ii) The high-resolution spectrum contains calibrants with the same number of turns, then is calculated from this spectrum and from the TFS measurement.
The parameter is constant as long as the electronics and cables are not changed. In a high-resolution measurement with many turns, the TOF during the TFS is short compared to the TOF in the analyzer. Thus temporal drifts during the TFS can be neglected compared to the temporal drifts during the flight in the analyzer. Hence can be assumed to be constant during a measurement, if a time-dependence of is allowed for, and changes only when the ion-optical settings of the TFS mode is changed. Therefore it is sufficient to obtain the time-resolved TOF of a single calibrant.
In order to perform the TRC, a certain number of spectra (typically a few seconds) are summed into a single spectrum (calibration block). A determination of the parameter is performed for these calibration blocks. For a given number of total events the optimum choice of the number of spectra in a calibration block is a compromise between the accuracy of each and the time resolution of the TRC. A linear interpolation is applied between the calibration blocks.
The TRC fully corrects the drifts, if the calibrant ions and the IOI experience the same electric fields. The FWHM of the IOI is slightly larger, if they do not experience the same electric fields. Since the width of the peak of the IOI must inferred from the measured width of the peak of the calibrant (Section IV.3), the increase in the peak width was measured in the Experiments I-IV. The peak width increase mainly depends on the time between successive calibration blocks and on the average number of counts in each calibration block. An effective time between calibration blocks is used, since the time between calibration blocks is not necessarily constant:
| (9) | |||||
where is the center of each calibration block, and are the begin and end of the measurement of the IOI, respectively, and is the number of calibration blocks. The increase of the peak width was calculated as the root-mean-square of the relative mass-to-charge deviation between the true mass-to-charge ratio and the value determined by the linear interpolation between TRC blocks. This increase was tabulated for different times between blocks () and different number of test ions in each block. For all measurements performed in Experiments I-IV, the increase of the peak width is obtained from these values.
An example for the effect of TRC is shown in Fig. 6, where the mass-to-charge spectrum is shown with a single calibration at the beginning of the acquisition and with TRC.
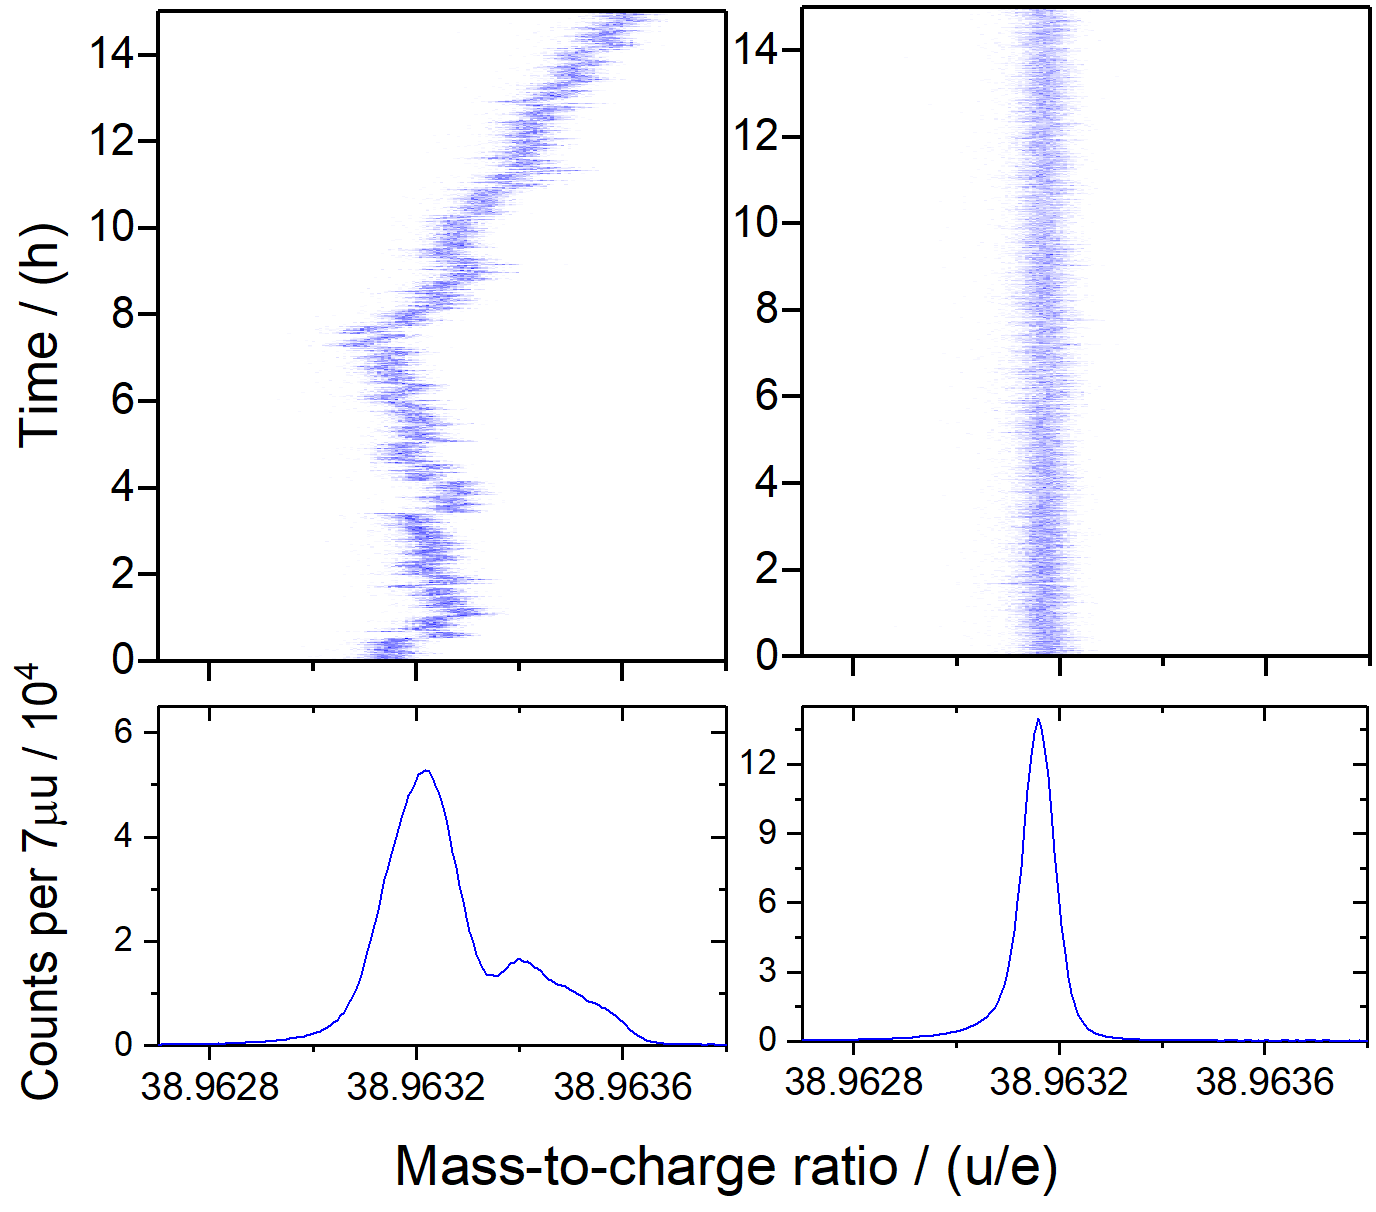
With the TRC method, the mass-to-charge ratio of each event of the measurement is calculated and saved in list mode for further analysis.
IV.2 Ion Identification
Based on the mass-to-charge ratio of the ions, an particle identification of the peaks in the mass-to-charge spectra is performed. The identification can be checked according to several criteria: (i) A comparison of absolute and relative detected rates with the results of theoretical simulations or experimental methods, e.g. -spectroscopy or particle identification in flight with the detectors of the FRS (ii) A comparison of the identification performed for measurements with two different turn numbers (iii) The coincidence between the events in the MR-TOF-MS and the primary beam (iv) The correlation of the detected events in the MR-TOF-MS with the experimental atomic range of the ions in matter in front of the CSC.
IV.3 Determination of the peak-shape parameters
It is well known that the mass resolving power of TOF mass spectrometers is mass independent, thus peak shapes are the same for all ions with the same charge state. However, their width is proportional the mass of the ion. This has also been studied in detail for MR-TOF-MS in Jesch (2016). Thus we take the peak shape of a distribution with high statistics and use this for all other distributions measured under the same experimental conditions. In a TOF mass spectrometer the peak shapes can be well described empirically Purushothaman et al. (2017). They can be determined by fitting a suitable analytical formula to a peak with a large number of events, obtained simultaneously with the IOI. The fit is done by a least-squares (LS) minimization based on the Levenberg-Marquardt algorithm Moré (1978). For the LS-fitting the data has to be binned. The Freedmann-Diaconis rule Freedman and Diaconis (1981) is used to determine the bin width , which is defined as
| (10) |
with being the number of events and is the interquartile range ( 25 % of the counts around the central event) of a single non-overlapping peak. The analytical formula describing the peaks obtained with the MR-TOF-MS is the Hyper-EMG(L,R) Purushothaman et al. (2017) function, which consists of a weighted sum of a given number of left (L) and right (R) exponentially modified Gaussian (EMG) functions. The parameter of the function that determines the mass-to-charge values is , which is the mean of the Gaussian in the EMG.
In some cases, a relatively small Gaussian distribution (5-10% of the area of the main distribution) has to be added in order to get a better determination of the peak shape, see Fig. 7. This Gaussian distribution appears due to ion-optical aberrations in the MR-TOF-MS and its strength depends on the tuning of the analyzer. A uniformly distributed background can be taken into account.
The determination of the peak shape with this high level of accuracy is needed for analyzing data with overlapping peaks. The number of exponentials and the existence of a Gaussian distribution is determined based on the reduced , the uncertainty of the fit parameters, and the accuracy of the peak-shape model as determined with a Kolmogorow-Smirnow-test (KS-test) Purushothaman et al. (2017). The peak shape is determined over a mass-to-charge window up to the limits of one event per bin on average.
Results of the peak determination obtained with the MR-TOF-MS at the FRS-IC are presented in Figs. 8 and 7. In both figures the data are compared with different Hyper-EMG functions and a regular Gaussian.
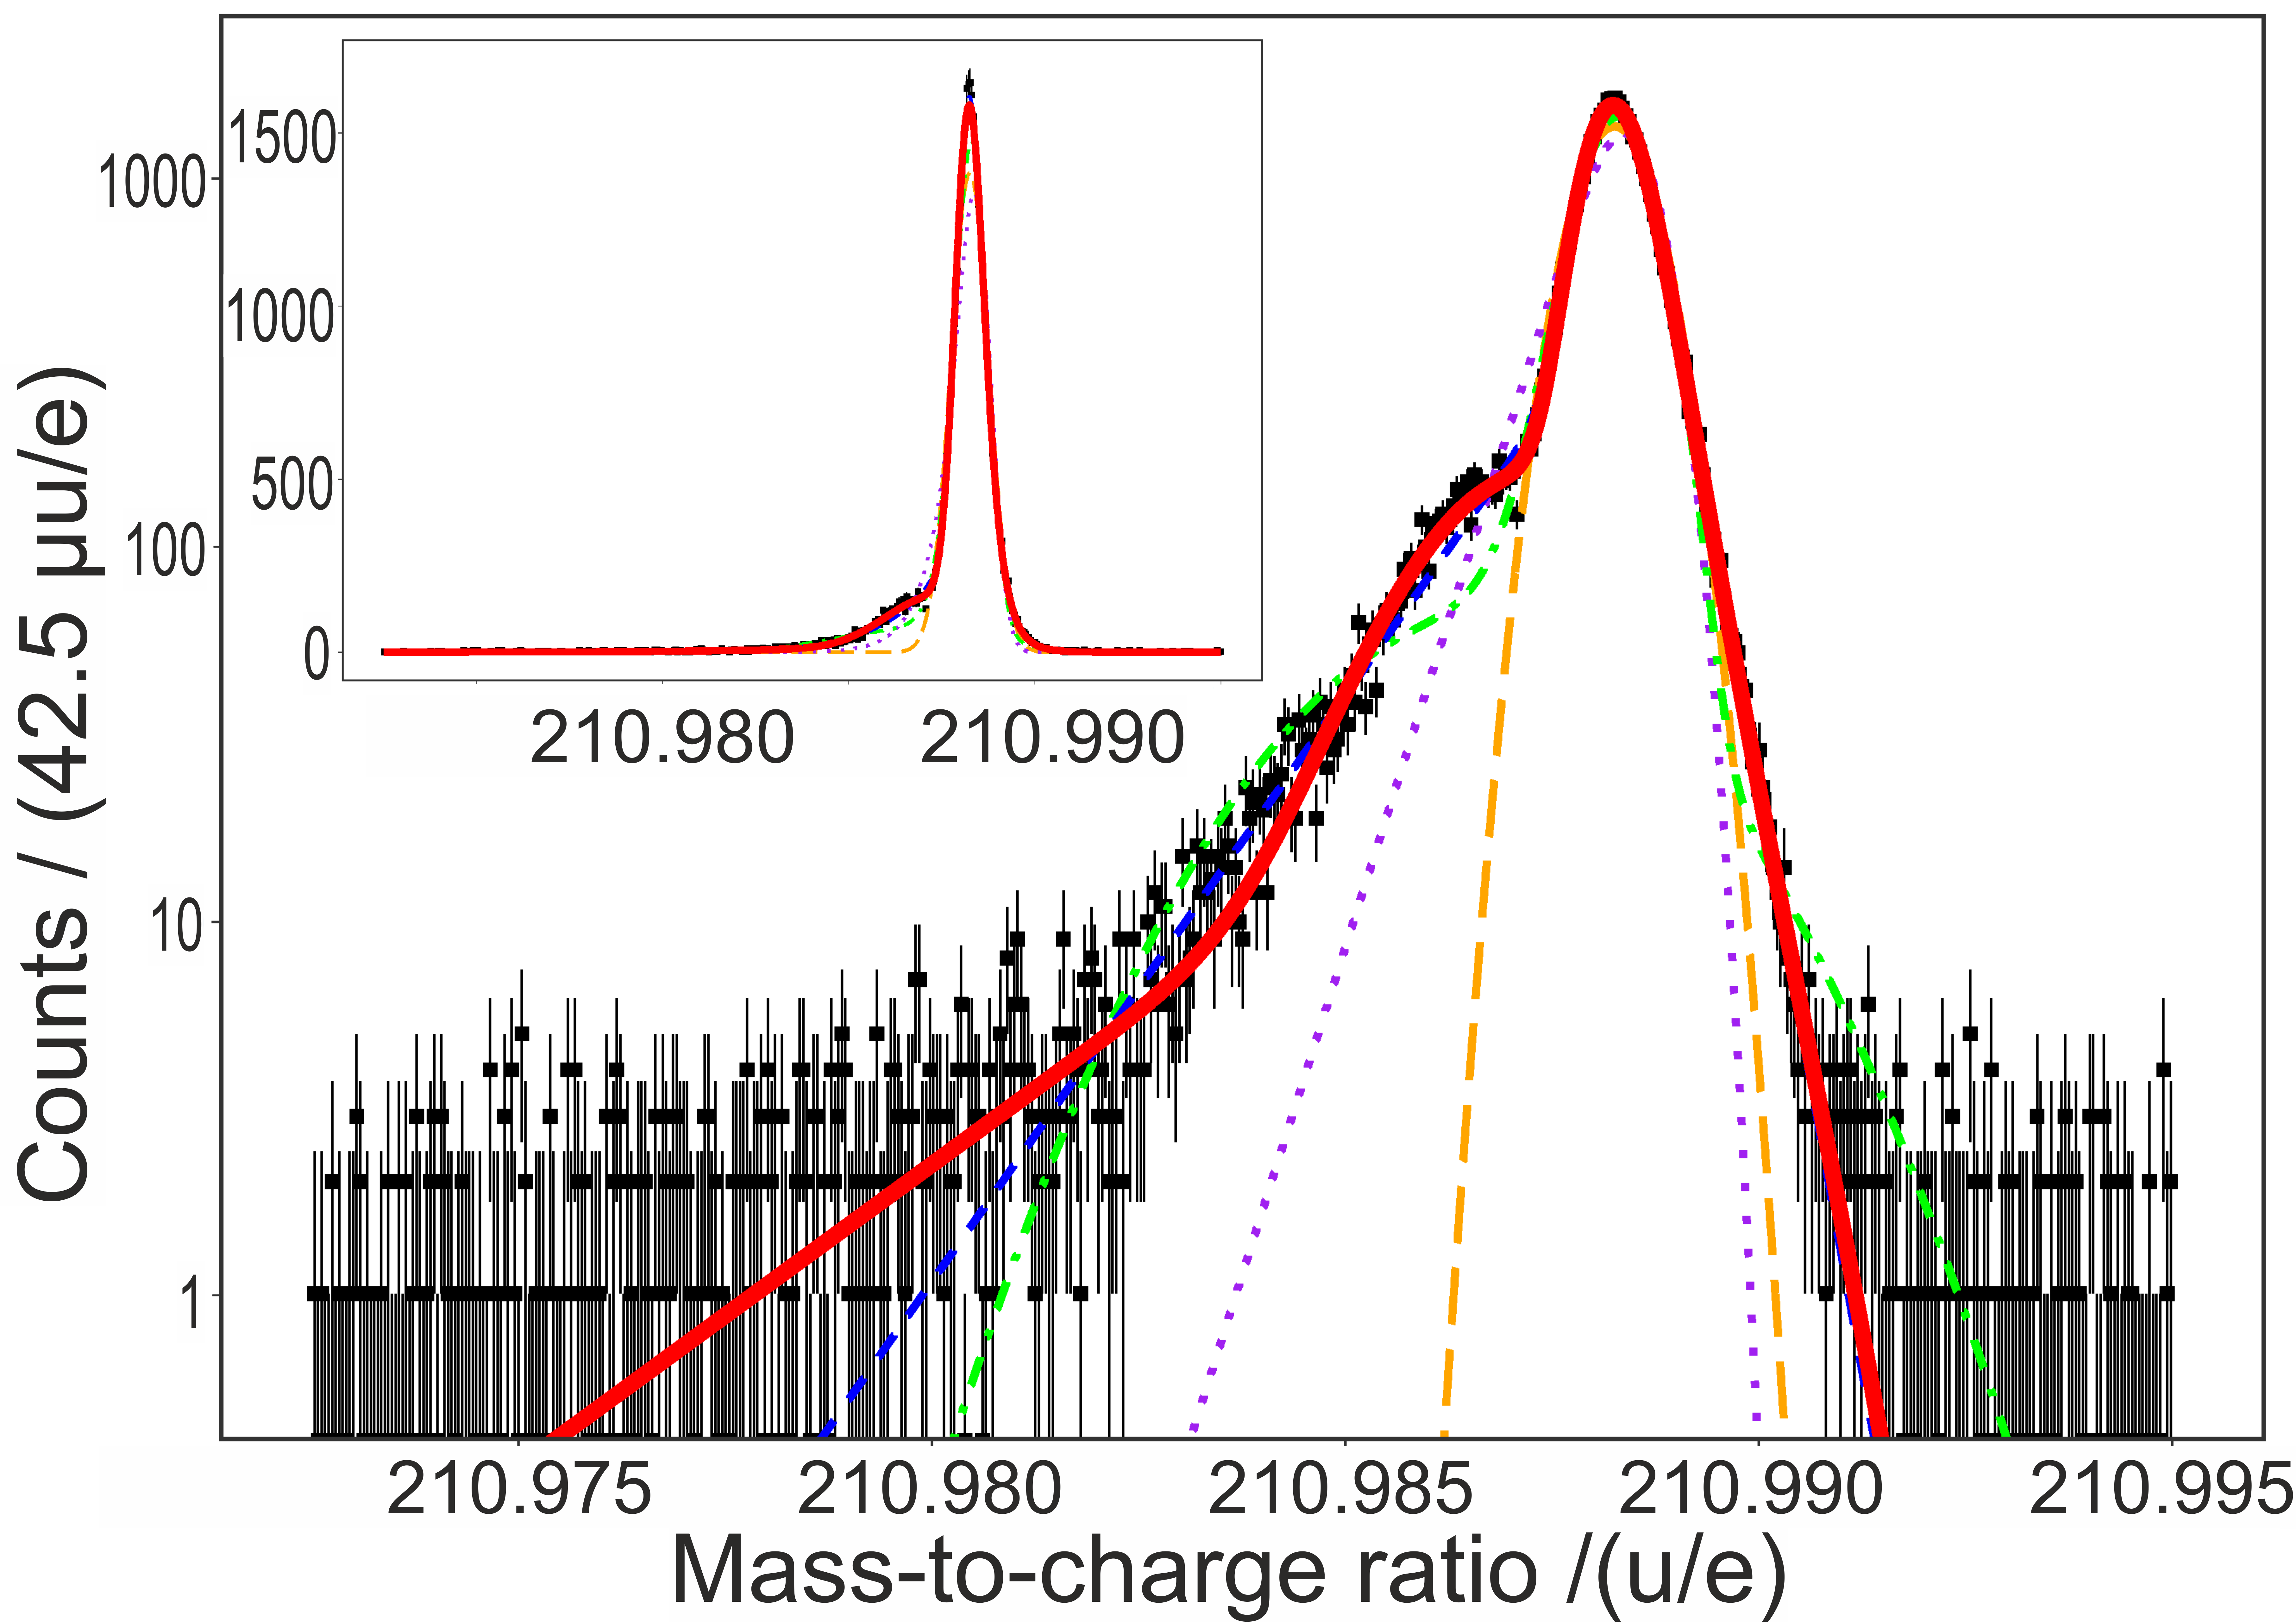
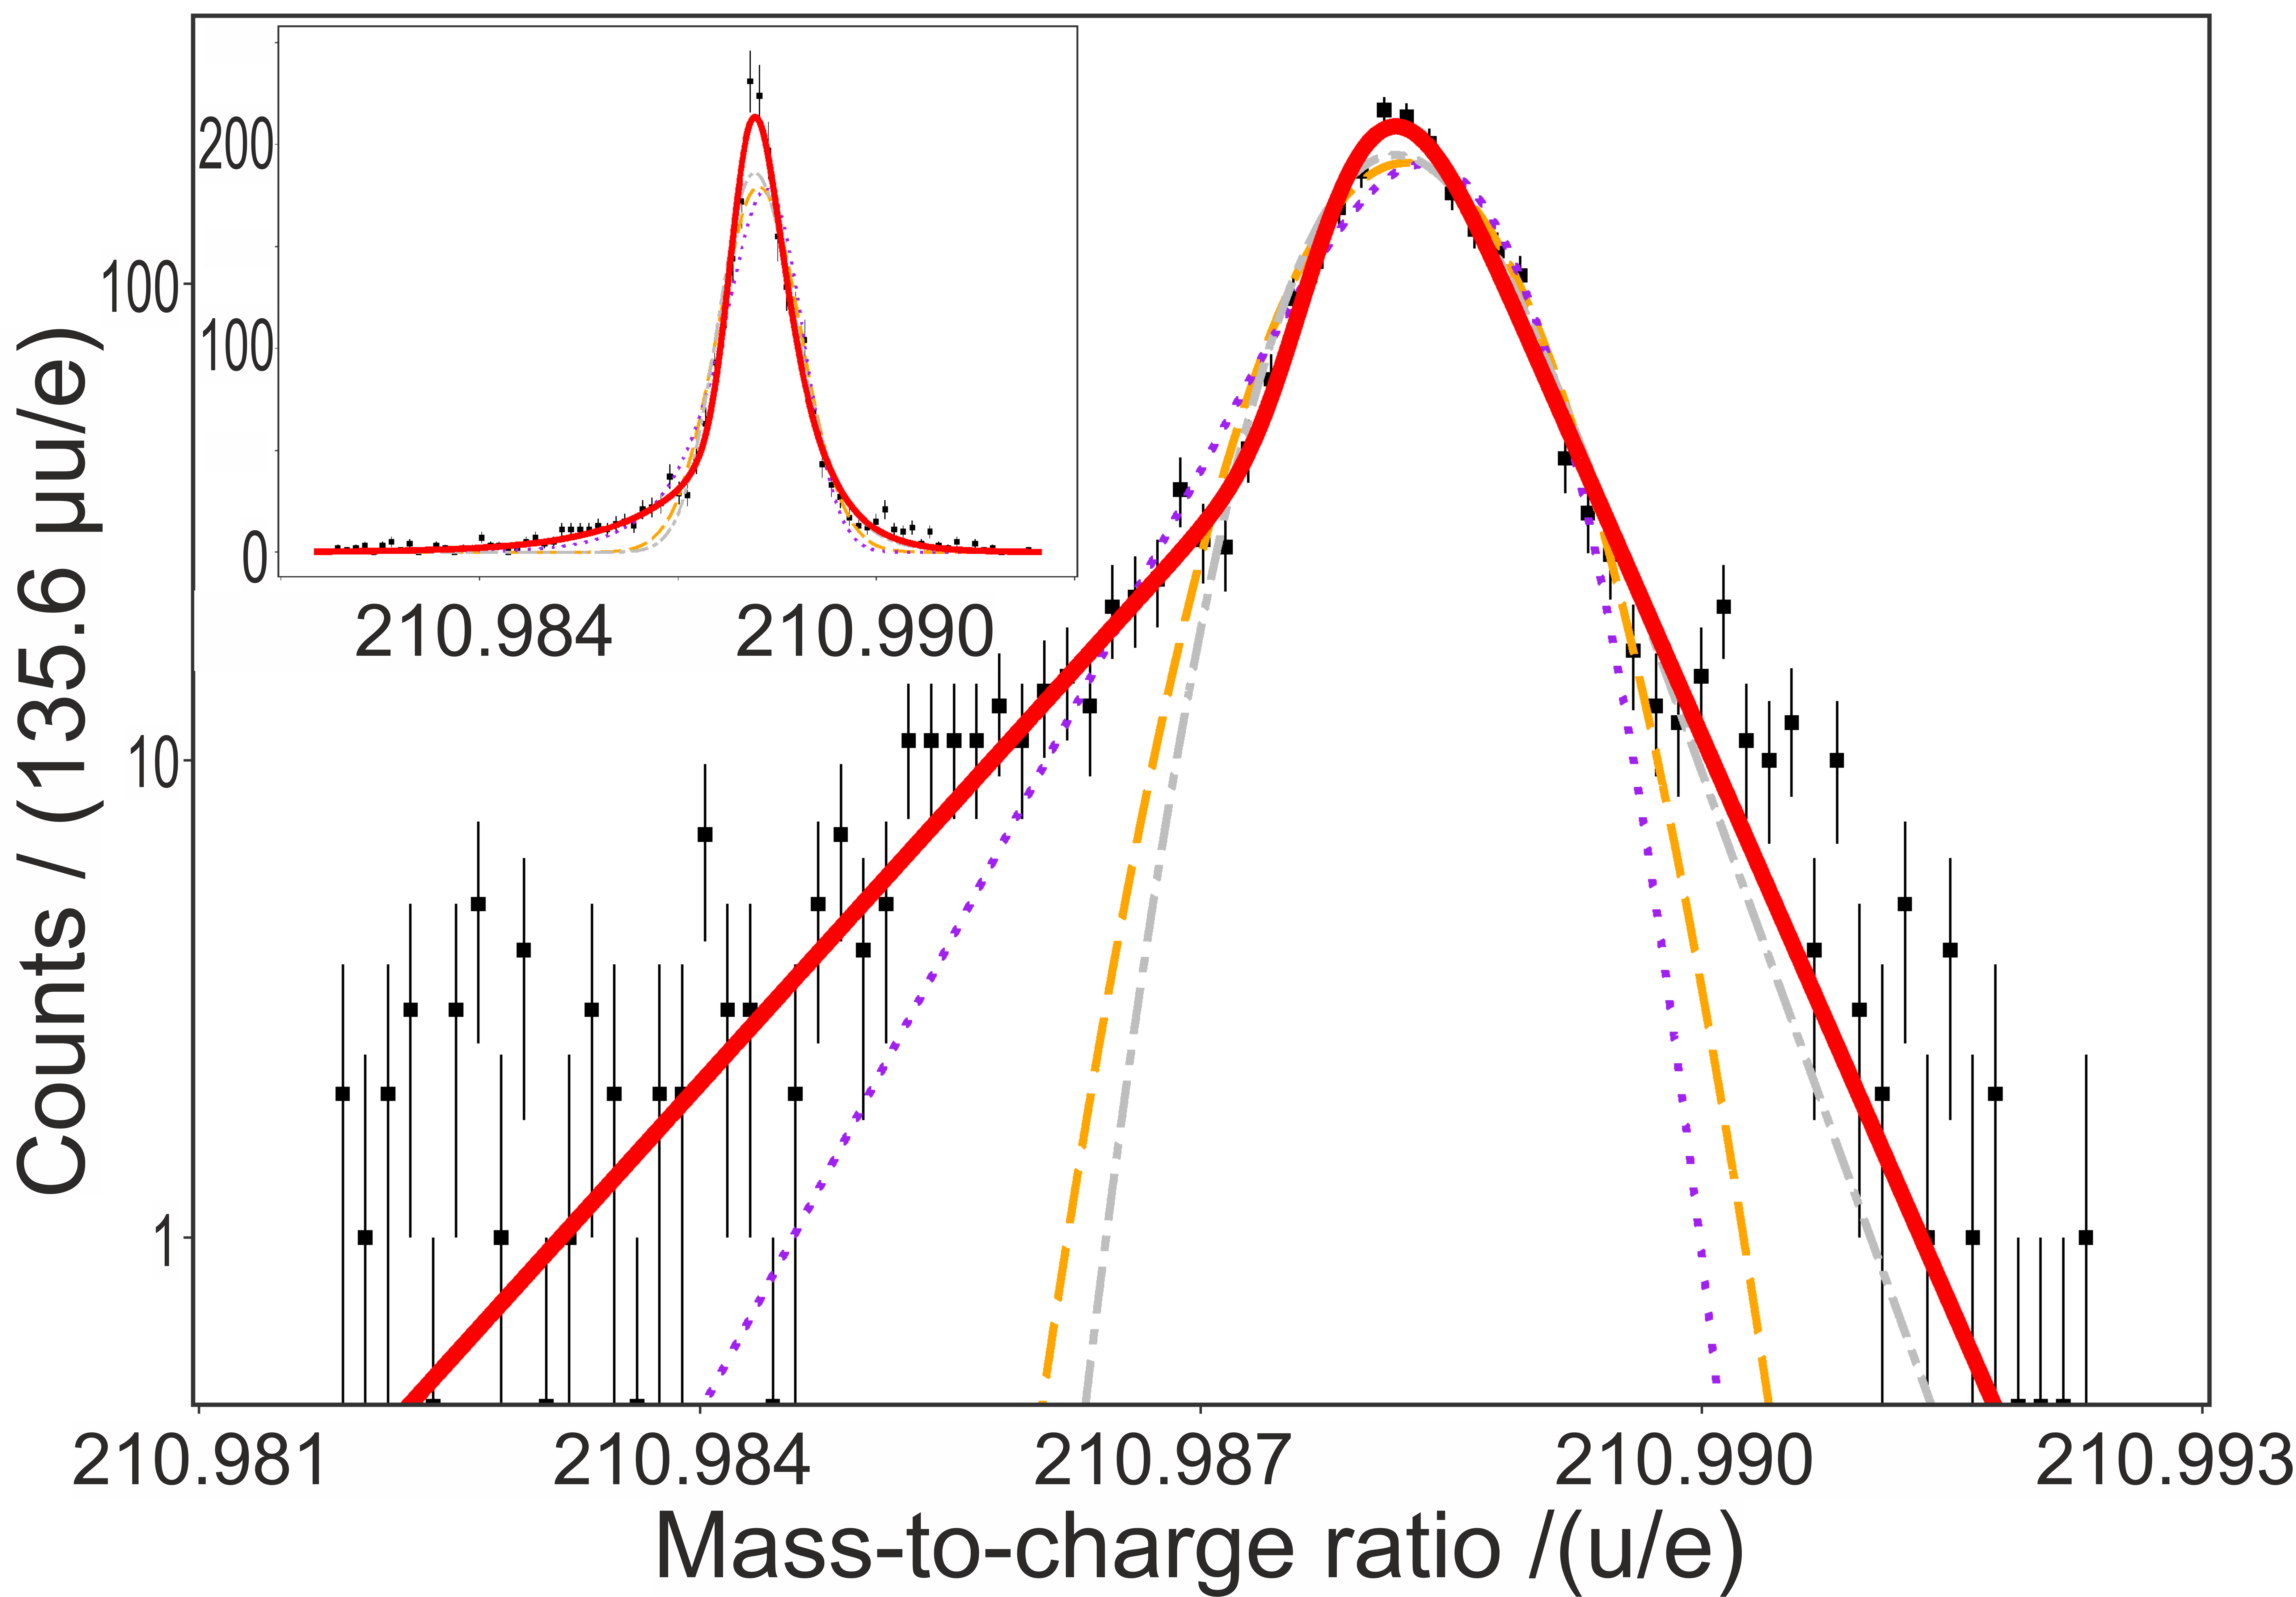
The peak-shape parameters calculated from the calibrant distribution have been scaled to the IOI distribution. The scaling factor takes into account the general increase of the peak width with increasing mass-to-charge ratio, as well as the different contributions to the mass-resolving power discussed in Section III. The scaling factor is given by:
| (11) |
where are the corresponding mass-to-charge ratio of the IOI and the calibrant. are the corresponding mass resolving power for the IOI and the calibrant ion, as given by Eq. (8). For the scaling of the parameters of the peak tails, the turn-around time is set to zero, because the peak tails are due to optical aberrations. The aberrations do not depend on the turn-around time. The peak broadening, in case IOI and calibrant do not experience the same electric fields, is also taken into account, see Section IV.1.
IV.4 Fitting of the mass-to-charge value
The position of the mass-to-charge value for a given nucleus in the experimental spectrum has been determined by using the well-known weighted maximum-likelihood estimation (wMLE) Hu and Zidek (2002). However, the measured distribution, was described by the function determined by the Least Square (LS) method for the ion used for calibration. In the wMLE fit all parameters of the Hyper-EMG, besides and the area, are fixed. In the wMLE analysis unbinned data was treated. This has the advantage to avoid additional errors due to the width and position of the bins. In addition, this method is superior to LS fitting for data with low count rates. The weighting of the data is used to increase the robustness of the fit by minimizing the influence of outliers on the determination of . The weighting function , dependent on the mass-to-charge value, has been chosen as the truncated natural logarithm of the function . The weighted log-likelihood function is given by:
| (12) |
After investigations of several types of different weighting functions, by applying bootstrapping, the proposed weighting function Ebert (2016) was found to be the best compromise between accuracy, outlier suppression and universality for the atomic mass determination.
IV.5 Effect of the mass-range selector (MRS)
When measuring ion species, which undergo different numbers of turns, the mass-to-charge spectrum can be ambiguous. By isolation of ions of a certain mass-to-charge range, i.e. removal of all ions outside this mass-to-charge range, an unambiguous identification of all ion species can be obtained Dickel et al. (2015a). Isolation is performed by the mass-range selector (MRS), which is a deflector mounted in the middle of the analyzer. By switching the MRS deflector between transmission and deflection with proper timing only the ions of interested are transmitted.
A turn in the analyzer with the MRS in operation is referred to as an isolation cycle (IC). In each IC the MRS is switched four times. Each switching causes a small change in the voltages applied to the MRS. As a consequence, the flight times of the transmitted ions shift. For a given electrical setup of the MRS, the shift is the same for all ions of the same mass-to-charge ratio and for the same number of IC. The shift increases linearly with number of IC , and according to Eq. (3) the shift in the time-of-flight is proportional to . Therefore, a measurement of the MRS shift can be made and be used as the basis for a correction of the MRS shift in all subsequent mass measurements.
The result of a measurement of the MRS shift is shown in Fig. 9. The measured shift in the time-of-flight was normalized with of the ion, here 133Cs ions, and fitted to the equation:
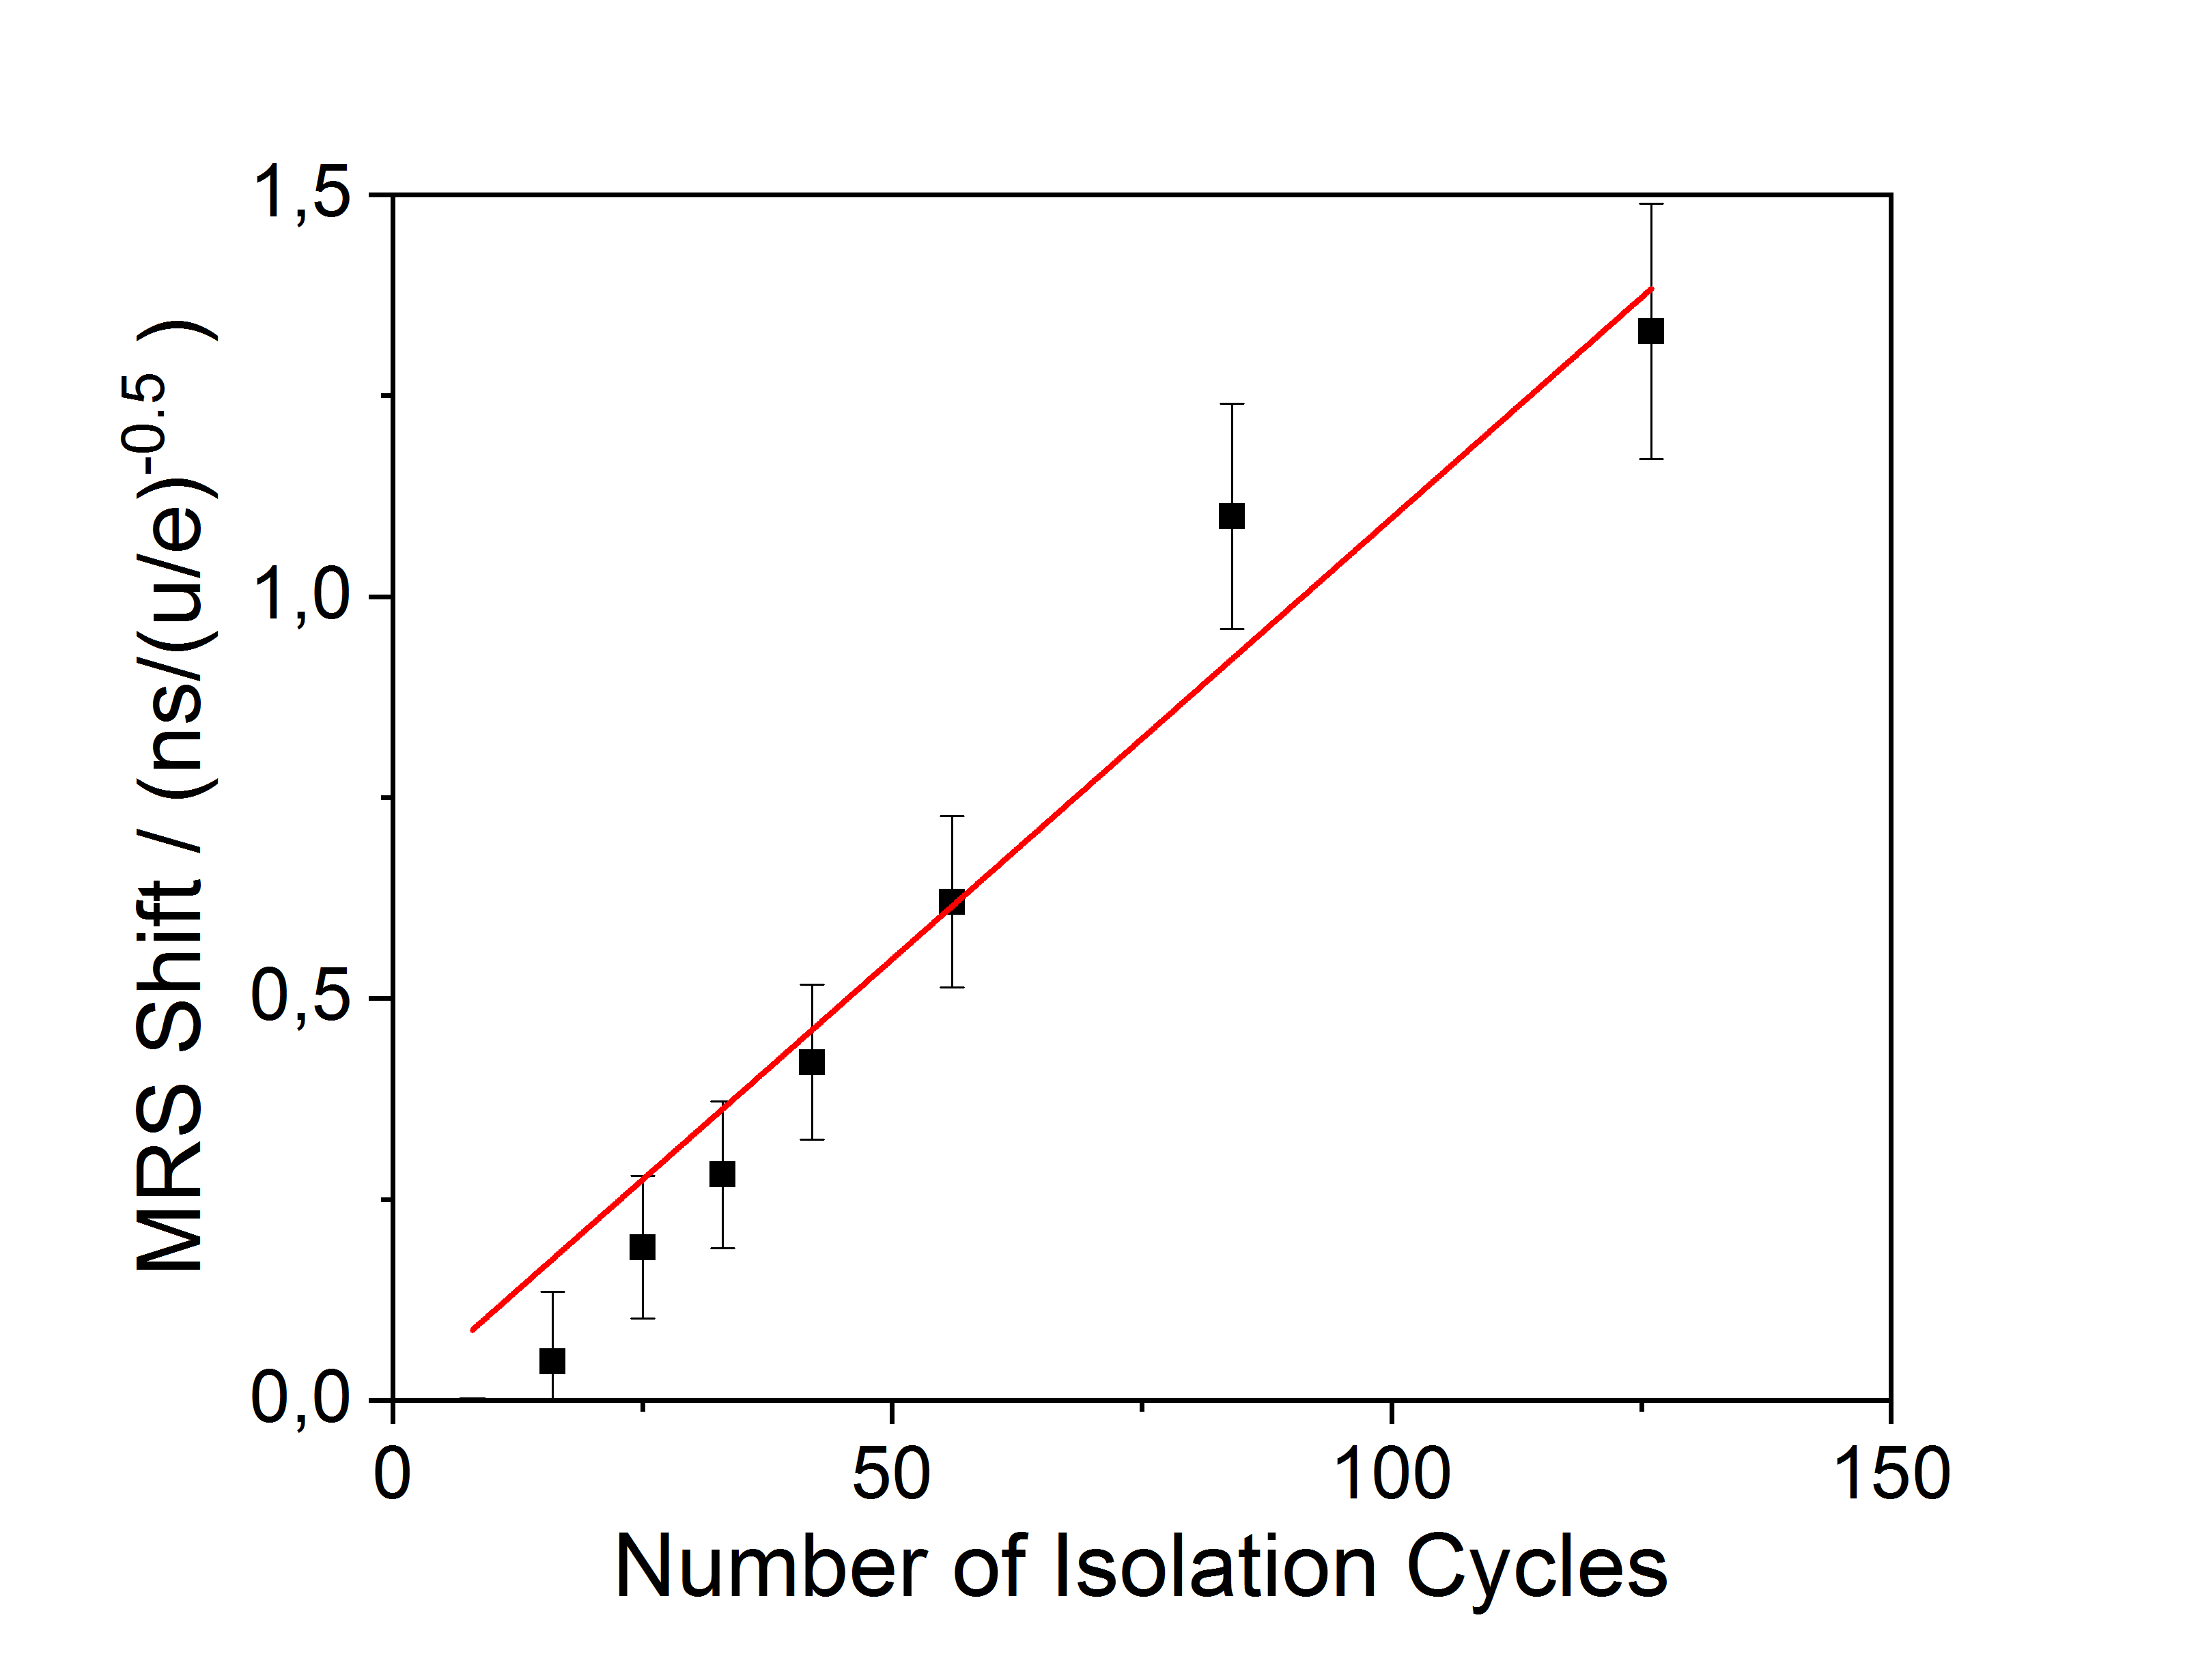
| (13) |
The MRS shift for all other ions can be calculated from
| (14) |
where Eq. (4) has been used to convert the shift in the time-of-flight into a corresponding shift in the mass-to-charge ratio. The factor applies to the case where the MRS was in operation for a part of the experiment only. It is the ratio, during which the MRS was in operation, to the overall duration of the measurement. This MRS shift is applied as a correction to the mass-to-charge values of both the IOI and the calibrant ion.
This method for correcting the MRS shift was tested in a measurement of 123Xe ions under conditions, where the magnitude of the shift due the MRS was maximized. Without the correction, the measured mass of 123Xe ions deviated by more than three standard deviations from the literature mass. After applying the MRS shift correction and adding its uncertainty (see Section IV.9.7) to the overall uncertainty of the measurement, the measured mass agreed with the literature mass within one standard deviation.
IV.6 Overlapping peaks
The weighting of the wMLE method causes a smaller distance between the fitted values of overlapping peaks. This effect is stronger for closer peaks and a larger difference in area. A correction algorithm for overlapping peaks of class B and C is used, to cope with this effectEbert (2016). In this iterative algorithm first a wMLE fit is performed, which gives the initial mass-to-charge ratio of each peak. From this the distance between peaks is calculated. Then, spectra are simulated with these parameters and fitted, and an average mass-to-charge distance () of the simulated data is calculated. A new simulated data set is generated and fitted with a mass-to-charge distance corrected by . The procedure is repeated until is smaller than the threshold. A final fit with a fixed distance between the peaks, corresponding to the distance of the last simulated spectrum, is performed.
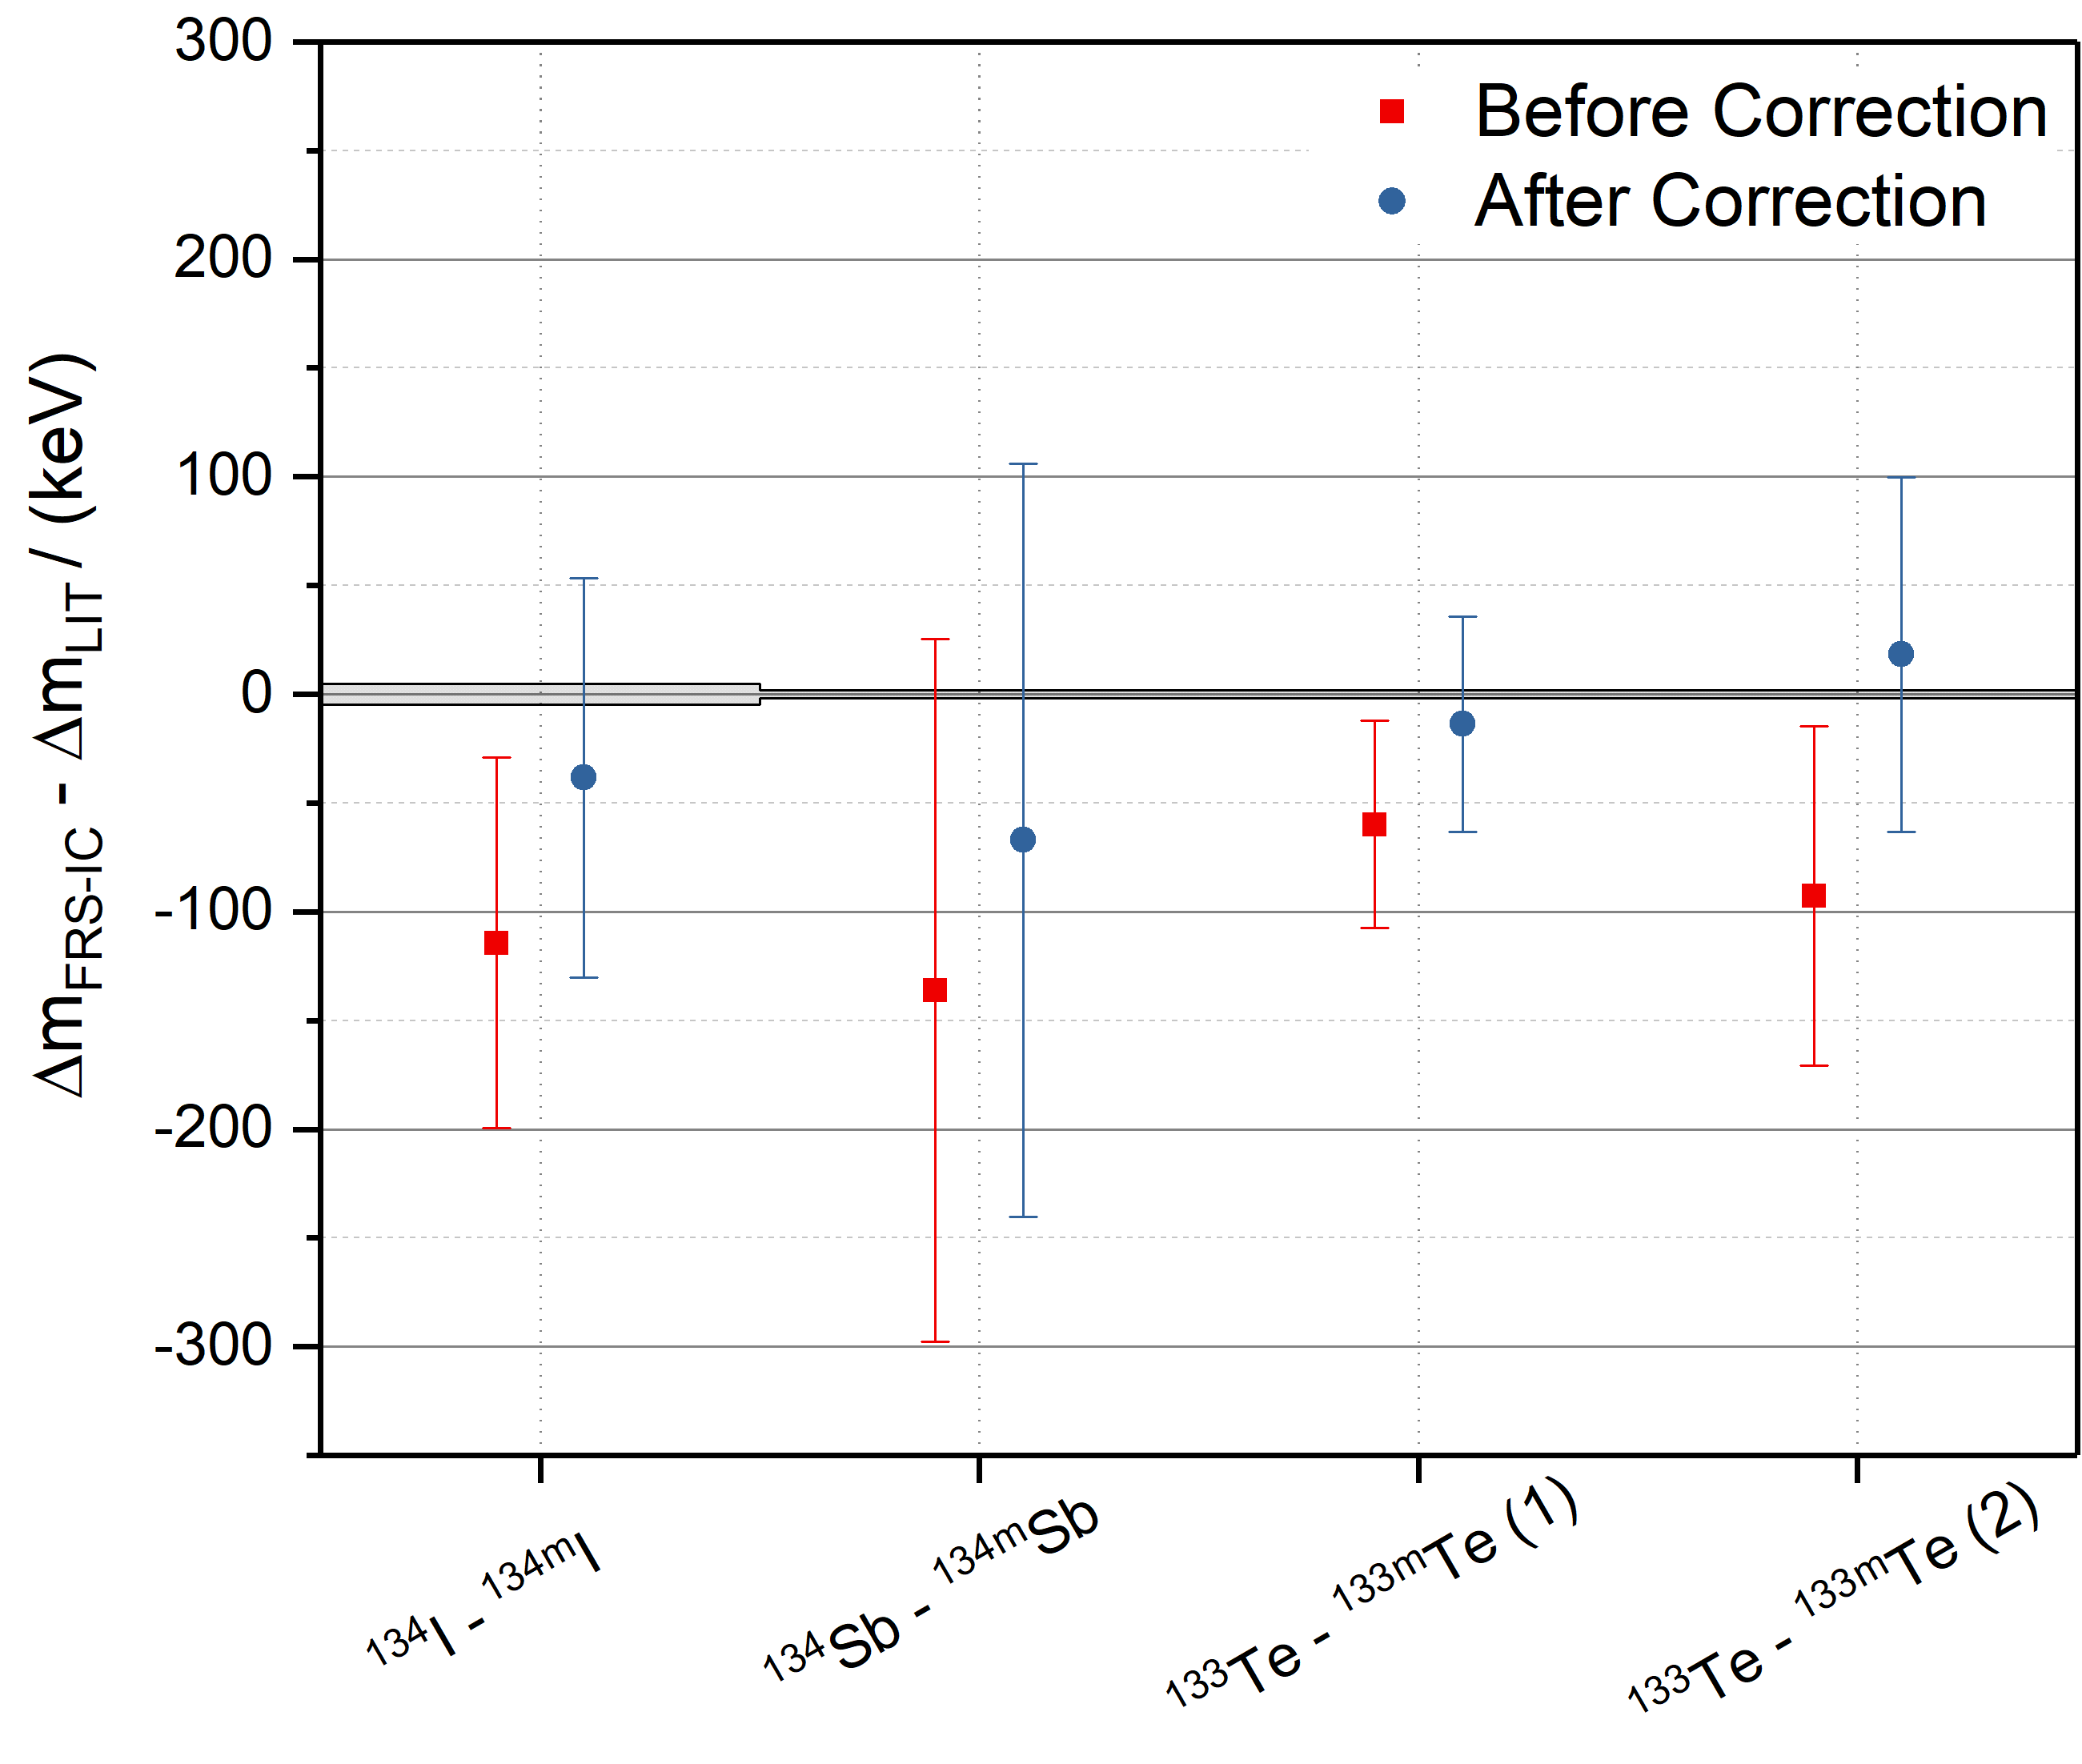
The algorithm for overlapping peaks of Class C was tested with simulated and real data. The simulated data have a similar peak shape as shown in Fig. 15. The distance between the peaks is u. Without correction the peak distance obtained was u/e, and with correction, u/e, demonstrating the powerful correction. In Fig. 10, examples of the measured nuclides are presented, where this special algorithm was applied. The deviations from the literature values are presented before and after the correction. All these pairs of ground and isomeric states correspond to overlapping peaks of Class C. For these examples the mass-to-charge difference tends to be underestimated without the correction. After the correction the values are in perfect agreement with the literature values.For overlapping peaks of Class B, this correction is negligible.
IV.7 Relativistic correction
The kinetic energy of the ions in the MR-TOF-MS was treated classically. Therefore the mass deviation between relativistic and classical treatment is estimated by a Taylor expansion of the relativistic formula:
| (15) |
The uncertainty of the classical treatment () can be estimated by calculating the ratio between the first order correction and the classical part. Higher order corrections are negligible. If the velocity is replaced by the kinetic energy (classical) one obtains
| (16) |
that is a mass-independent correction, which depends only on the average kinetic energy. This energy has been determined to an accuracy of about 1% by a combination of measurements and simulations. The resulting correction for the mass-to-charge value of all ions is -1.73 keV/ multiplied by the charge state of the ions. The calibration formula, including relativistic effects, is obtained by adding the correction () to Eq. 6. With this, the uncertainty is reduced to a few even in the cases of largest possible mass-to-charge differences.
IV.8 Final mass-to-charge value
The final mass-to-charge value of the IOI is obtained from the fitted mass-to-charge value of IOI , calibrant ion , and the literature value for the mass-to-charge value of the calibrant ion . It is given by
| (17) |
Note that up to this step in the data-analysis procedure, the mass-to-charge scale has been established using an interpolated median Ramachandran and Tsokos (2009) in the TRC. Therefore, both the IOI and the calibrant ion have to be fitted with the wMLE to obtain the final mass-to-charge value and corresponding uncertainty.
IV.9 Uncertainty contributions
The final mass-to-charge uncertainty is calculated by adding in quadrature the various uncertainties described in the following. Effects like the earth magnetic fields are not discussed in detail, because they have been found to be negligible. The uncertainty of mass-to-charge differences of close-lying peaks, e.g., excitation energy of isomers, partially cancel. In this case, the remaining uncertainties are due to the statistics, the unresolved peaks, the overlapping peaks, the space charge and the dead-time.
IV.9.1 Statistical uncertainty
In samples obeying a normal distribution, the statistical uncertainty of the mean value is given by:
| (18) |
where FWHM is the full width half maximum of the normal distribution and the number of samples. For the wMLE fit with a Hyper-EMG function, an empirical approach has been taken to determine the statistical uncertainty, because there is no analytical solution for this case.
Random numbers are drawn (same number of events as measured) according to the distribution function determined for the calibrant and IOI and are fitted with the wMLE. This is repeated many times (typically 1000). The standard deviation of the mass-to-charge values obtained from this, is the statistical uncertainty of the calibrant or the IOI. The statistical uncertainties determined in this way for mass measurements of 213Fr ions in Experiment I as a function of the number of counts per spectrum are shown in Fig. 11. The equation:
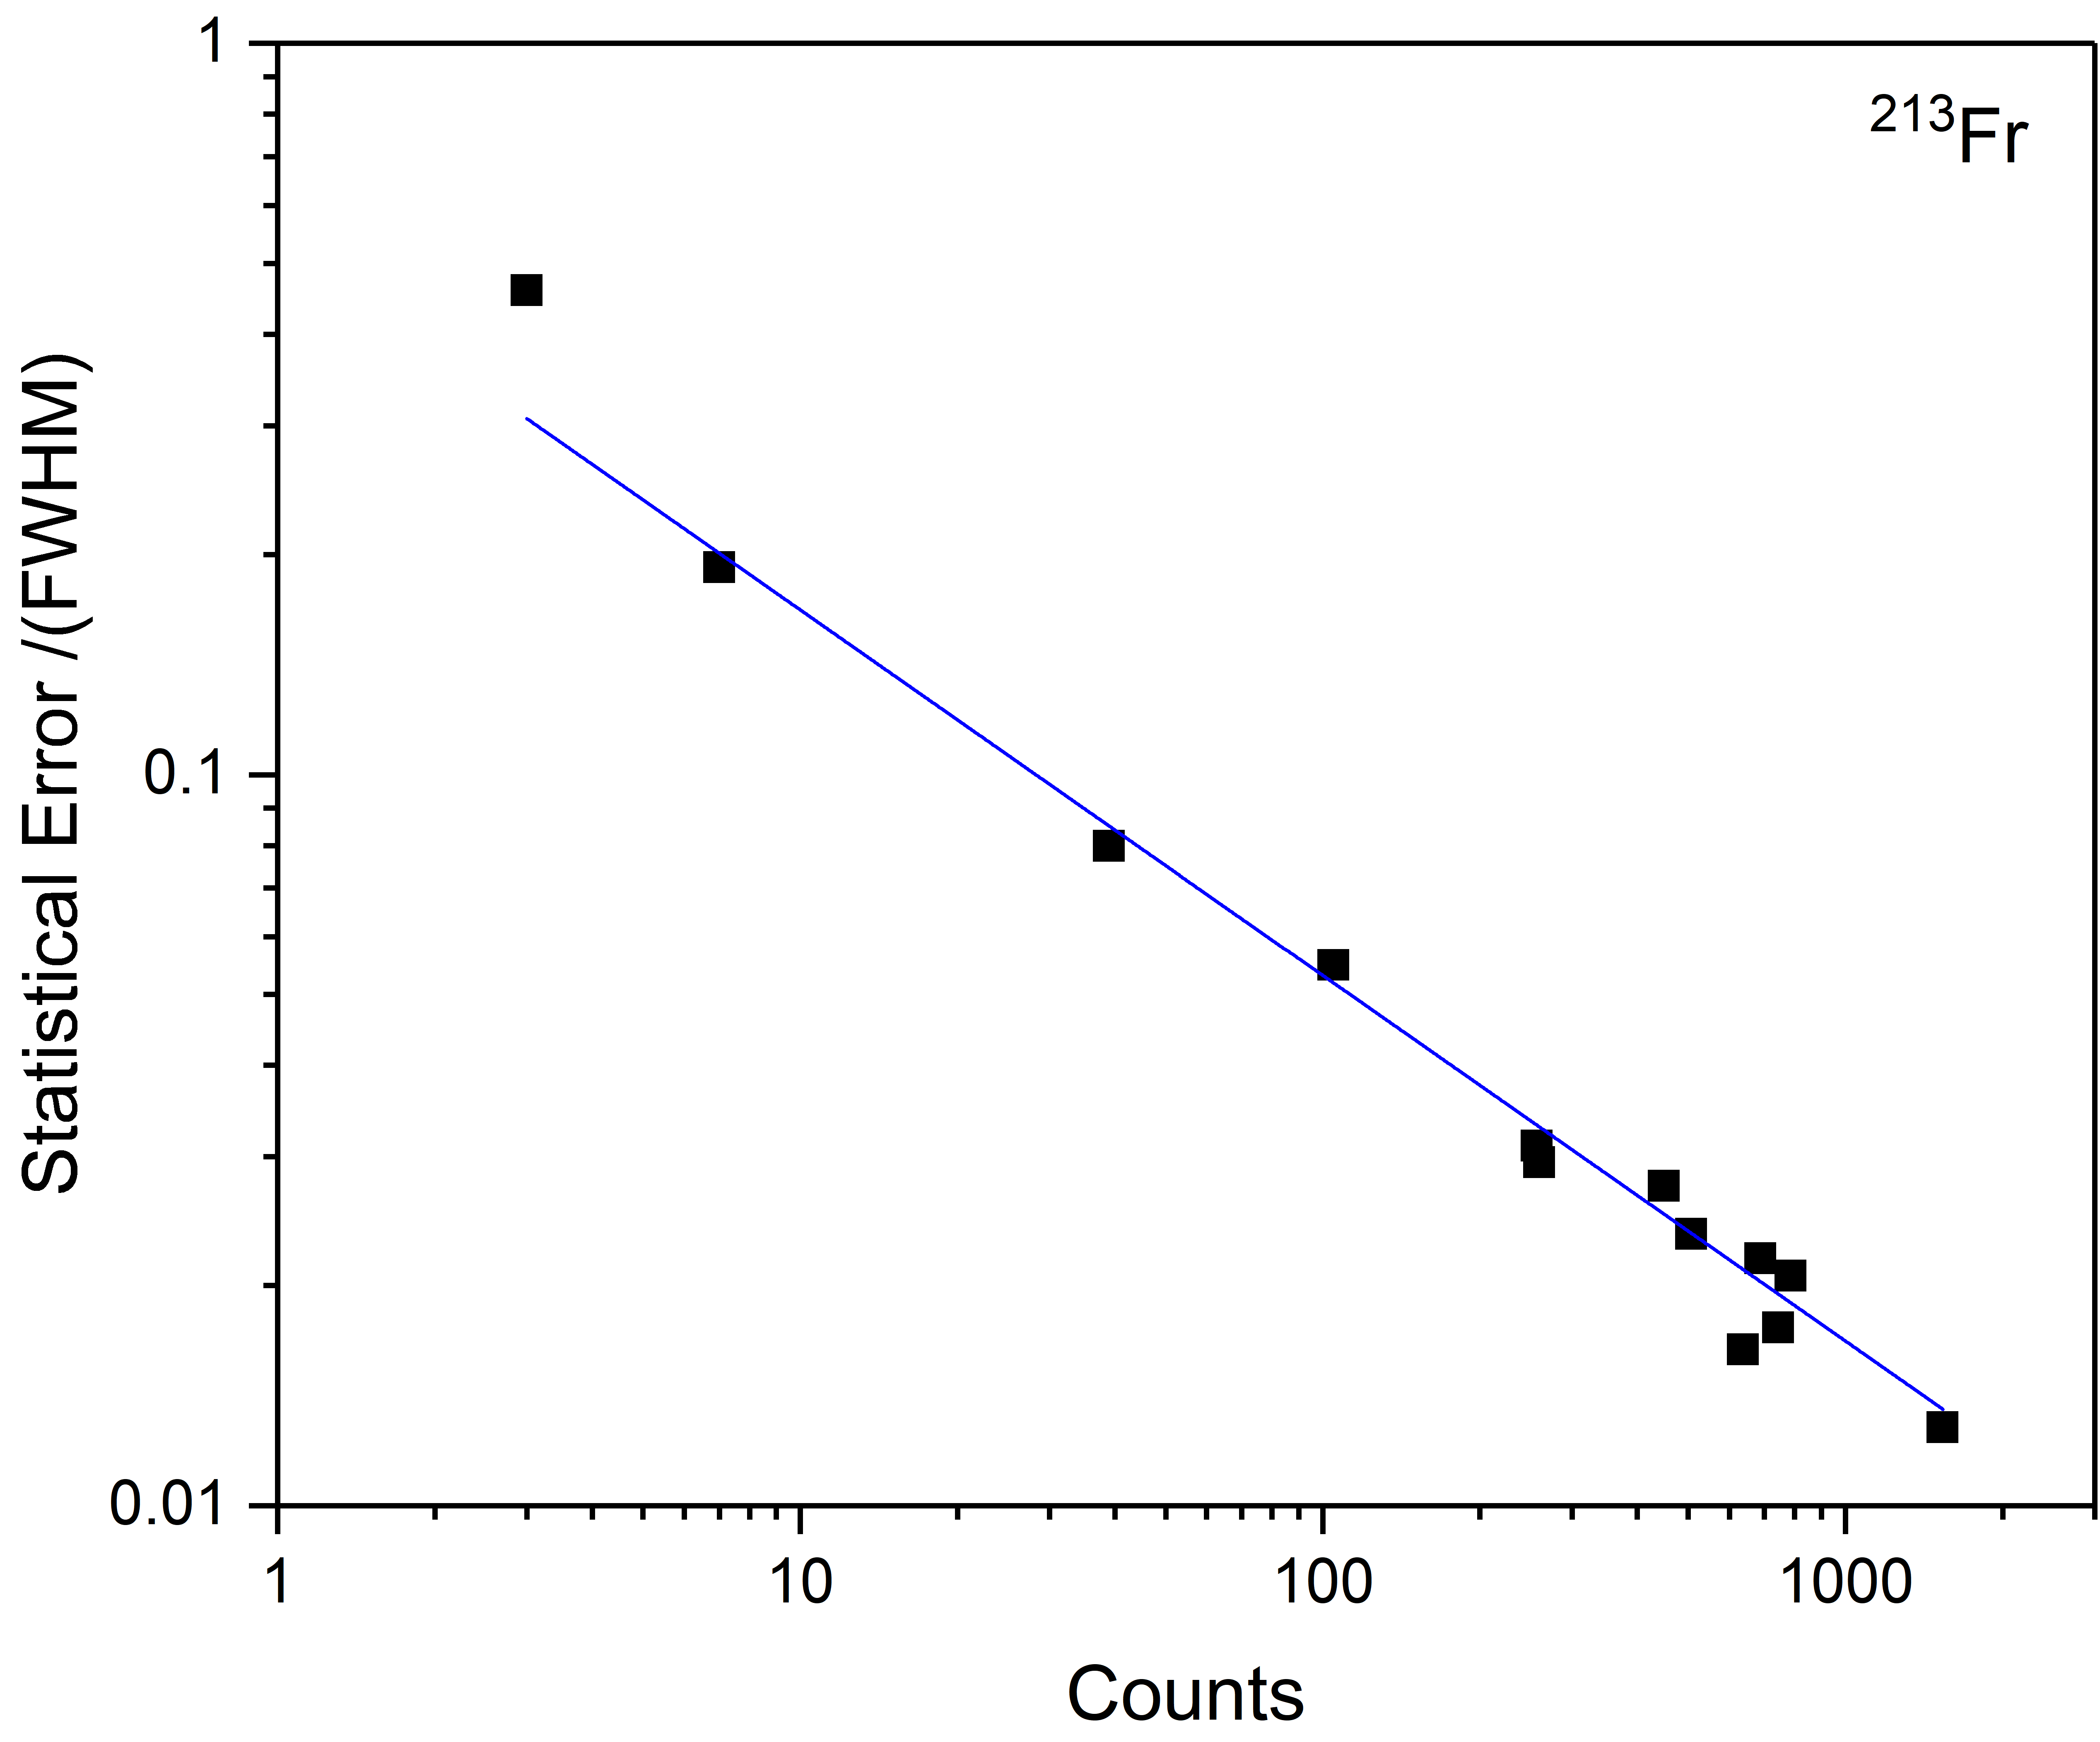
| (19) |
was fitted to the data points. A value of was obtained. The value is typical for the measurements presented in the paper. It is about 25 % larger than the uncertainty of the mean of a normal distribution with the same FWHM and area. The reason for this difference is the weighting used in the wMLE fit and the differences in the peak tails between normal distribution and Hyper-EMG.
IV.9.2 Peak-shape uncertainty
The uncertainty of the determined peak-shape parameters are considered in the following. It is assumed that the uncertainties of the different parameters contribute independently to the uncertainty of the mass-to-charge value (). Each parameter of the model is changed by its uncertainty, while keeping the others unchanged, and the peak is fitted again with the wMLE method. The relative change in the obtained mass-to-charge ratio is calculated for the calibrant and the IOI. The deviations are calculated for all parameter and are quadratically added to obtain the peak-shape uncertainty.
IV.9.3 Uncertainty of the time-resolved calibration (TRC)
The TRC has an uncertainty in addition to the described peak broadening (Section IV.1) of the IOI compared to the calibrant. This is caused by the uncertainty of the interpolated calibration parameter . Likewise for the peak broadening, this effect has been determined for all experiments in dedicated measurements. A measure for this deviation is the square root of the quadratic difference between the RMS of the mean relative mass-to-charge deviation for each calibration block and the RMS value of the statistical uncertainties of each calibration block. The latter is given by , where is the effective number of calibration blocks
| (20) |
These values were determined for different effective times between blocks and different number of counts of the calibrant in each calibration block.
This uncertainty contribution can then be calculated from the determined deviation for a given and number of calibrant ions as
| (21) |
IV.9.4 Calibration uncertainty
This uncertainty includes the statistical uncertainty and the uncertainty of the literature mass of the calibrant. Based on Eq. (17), the uncertainty due to the calibrant can be written as
| (22) | |||||
where is the literature uncertainty for the calibrant mass and the statistical uncertainty in the fitted calibrant mass-to-charge ratio. In case the mass value of the calibrant ions in the literature changes a new and updated mass for the ion of interest can be calculated by the following relation:
| (23) |
where is the old mass-to-charge value of the IOI.
IV.9.5 Uncertainty of the calibration parameters (, and )
The uncertainties of the calibration parameters, and , and , are determined during the conversion of the time-of-flight into a mass-to-charge ratio spectrum. The peak positions of the calibrant ions, used for determining these parameters, are shifted in time separately by plus/minus their uncertainty and the calibration parameters are recalculated. The maximum deviation of the calibration parameters for each calibrant species from the overall mean value is calculated and summed quadratically for each calibration parameter separately. The resulting values are used as the individual uncertainties and . The mass-to-charge uncertainty () due to the uncertainty in is given by:
| (24) | |||||
The uncertainty in determining and results in an uncertainty component of the final mass-to-charge value in units of u/e, which is given by
| (25) |
When the calibrant ion and the IOI have the same number of isochronous turns in the analyzer, the uncertainty component is zero. This is because the calibration parameters and are not independent and the uncertainty is described fully by the uncertainty of . The higher the difference of turns between the calibrant used for and the IOI, the higher the contribution of the uncertainty of . The uncertainty of is included in the calibration uncertainty, IV.8.
IV.9.6 Scaling-parameter uncertainty
The uncertainty is calculated from the difference between the scaling factors for same and different resolving powers for calibrant and IOI (see Eq. 11 for scaling factor). This uncertainty is quadratically added to the parameter uncertainty of and the different before the values are used for the peak-shape uncertainty determination. The scaling uncertainty also influences the statistical error. This uncertainty is estimated by multiplying the statistical error with the normalized mean of the two scaling factors. This uncertainty is smaller than 5% of the total uncertainty of all cases presented here.
IV.9.7 Uncertainty due to the Mass-range selector (MRS)
The uncertainty due to switching fields of the MRS is assumed to be 50% of the correction in the final mass-to-charge value due to the MRS (Section IV.5).
IV.9.8 Uncertainty of the Non-ideal ejection (NIE)
The voltages applied to the analyzer electrodes need time, some s, to reach the final value. During extraction from the analyzer, ions with different mass-to-charge ratios that are spatially separated might experience different fields. The deviation of the TOF is measured depending on the opening time of the output reflector to determine this influence. Since this effect occurs only during ejection from the analyzer, its absolute value is constant and independent on the number of turns. Therefore, measurements with a low number of turns (typically 2) are used to quantify it. The data taken with 133Cs ions (two turns) for the Experiments III and IV is shown in Fig. 12. The ions in the “switched” field region experience a shift in the kinetic energy. This results in a change of the flight time to the detector, as shown in the upper panel of Fig. 12. Similar effects happen during the closing of the reflector after injection of the ions. The effect on the mass uncertainty is negligible for isobars, because they are not yet spatially separated.
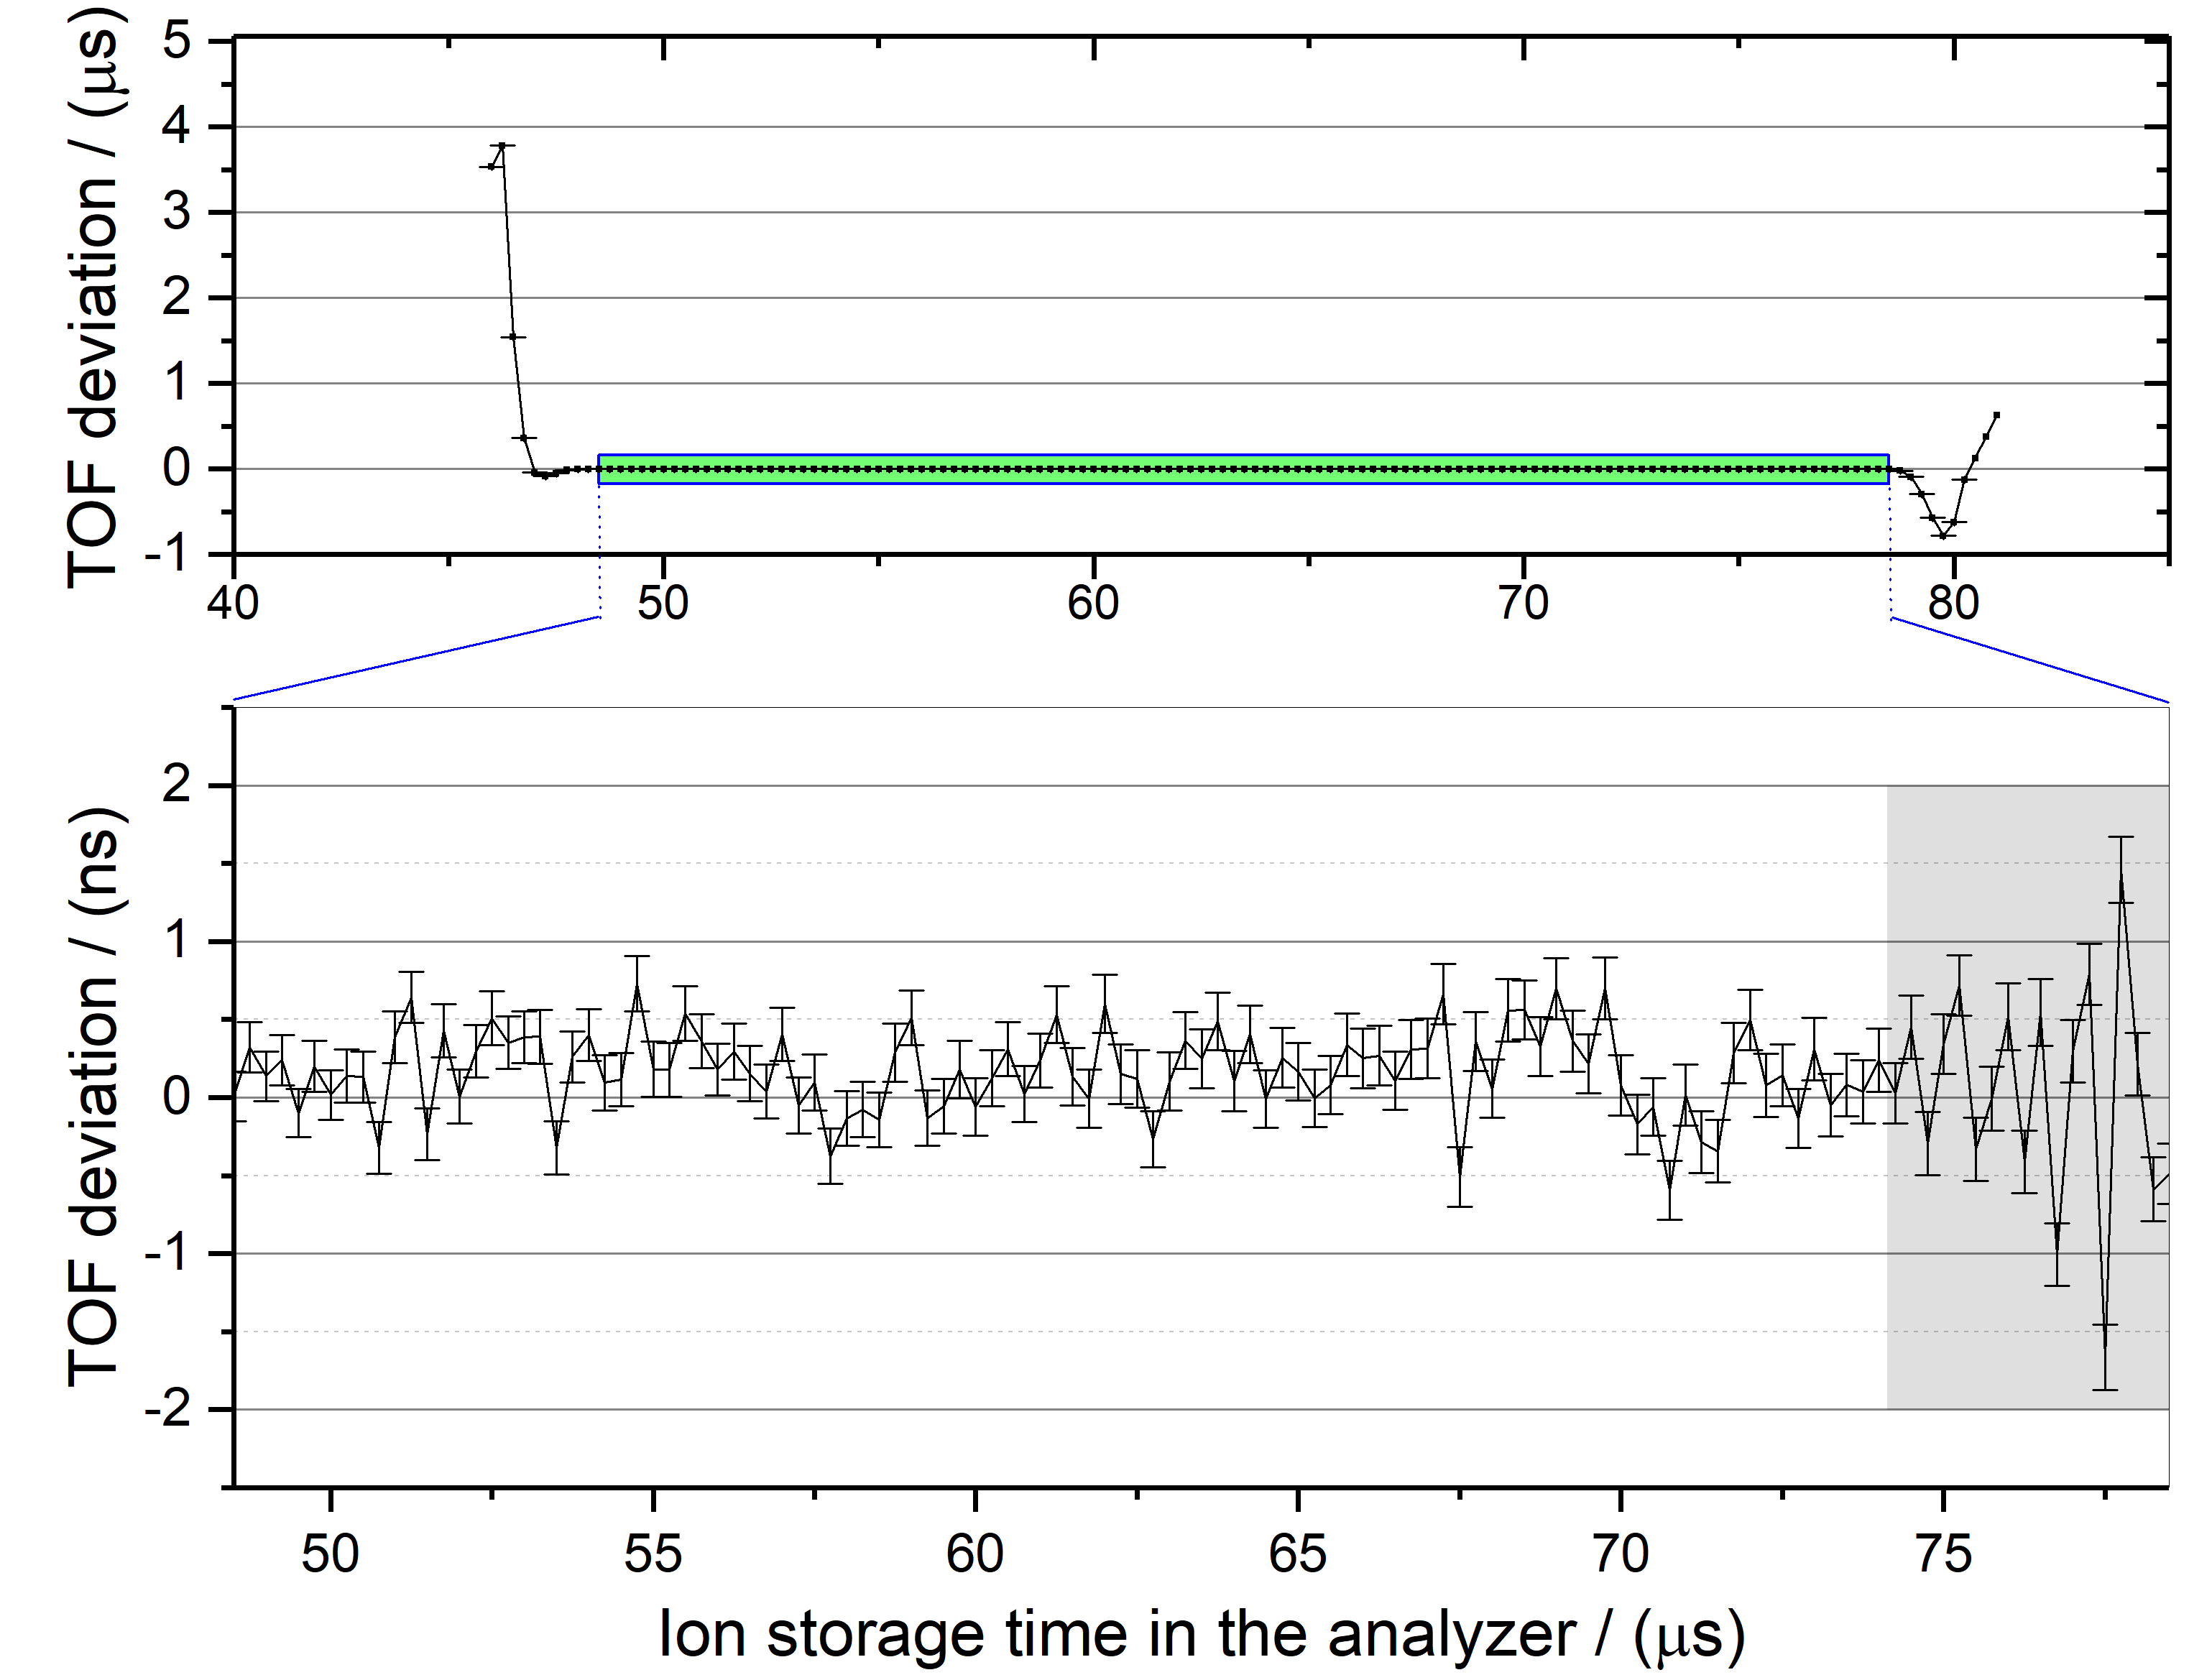
From the green region in the upper panel in Fig. 12, the standard deviation is calculated and compared with the uncertainties of the individual measurement points in the plot. Based on this, is estimated. If the ions are outside of this region, they are discarded form the analysis. The uncertainty contribution is calculated by
| (26) |
where is the uncertainty contribution due to non-ideal ejection, is the mass-to-charge ratio of the ion used to obtain the data, is the total TOF for the IOI and is the mass-to-charge ratio of the IOI.
The values of were determined to be 0.1 ns and 0.5 ns for the data obtained in Experiments I & II and Experiments III & IV, respectively. The ions that travel towards the detector very close to the output reflector while it is being opened, experience an electrical ringing from the reflector electrodes. This is reflected in an oscillation in the TOF deviation for the longer opening delays, as shown in the grey area of the lower panel from Fig. 12. When the ions experience these fields, will be increased to the peak value of the oscillation, which is about 2 ns for the example shown in Fig. 12.
IV.9.9 Uncertainty of resolved overlapping peaks
The uncertainty from the correction for overlapping peaks is estimated to be 25 % of the difference between the mass-to-charge ratio obtained with and without the correction, as described in section IV.6.
IV.9.10 Unresolved-peaks uncertainty
In case of possible close-lying peaks of Class D, an additional uncertainty is added to the mass-to-charge value. When the expected peaks have a known distance but their abundance ratio is unknown, e.g. an unresolved isomer, isobar or an expected contamination, the estimated additional uncertainty is times the expected mass-to-charge difference of the unresolved peaks Wang et al. (2017). For the mass-to-charge ratios, a single-peak fit is performed and half of the known distance is added and subtracted to obtain the mass-to-charge values of the two unresolved peaks Wang et al. (2017).
When an unknown unresolved peak is probable, its effect is estimated with simulated data containing two peaks: one representing the IOI and the other a possible contamination. The abundance ratio between the IOI and the contamination is estimated by the highest unknown peak appearing with the same mass-to-charge number as the IOI. Then, the contaminant peak is moved over the IOI, calculating the mass-to-charge shift due to the influence of the contaminant. For each step a KS-test assuming a single peak is then performed to estimate whether such a contamination could be detected. For the uncertainty contribution, the maximum of mass-to-charge shift multiplied with the probability value of the KS-test is used, thereby taking into account the probability to identify the unknown peak.
IV.9.11 Phase-space uncertainty
The phase space from the injection trap will be different for nuclei that have a different mass-to-charge ratio. These effects have been studied by computer experiments (SIMION, Manura, D. and Dahl D. (2008)). Also the effects of non-prefect voltages have been studied: (i) finite rise and fall times ( 150 ns) of the push-pull voltages in the RF trap, (ii) RF fields in the trap during ejection, (iii) residual RF signals ( 1V0p, capacitively coupled from the RF electrodes) at the push-pull apertures and (iv) imbalanced RF voltages (1%) on the RF trap. For isobars and neighboring mass-to-charge ratios this is negligible. Even for relative mass-to-charge ratio differences as large as the relative uncertainty does not exceed for (i,ii) and for (iii,iv). Since the RF is switched of shortly before ion ejection from the trap the effects of (ii-iv) are reduced by an order of magnitude.
IV.9.12 Uncertainty due to dead-time of data-acquisition system
The TDC used for the data-acquisition, Ortec-9353, has a non-extending dead-time (1 ns) and the detector has an extending dead-time (0.5 ns). This means that after the detection of an event, there will be a window of time (1.5 ns in the case of Ortec-9353) where no event will be recorded. This effect results in an attenuation of the amplitude of the central part of the peak compared to the tails, thus altering the peak shape and increasing . A dead-time correction Greiner (2017) is implemented in MAc to correct this uncertainty. The relative mass-to-charge uncertainty contribution due to the dead-time effects is less than . This holds even for the condition of 0.5 ions detected on average per dead time. No uncertainty contribution has to be added in the data presented here.
IV.9.13 Space-charge uncertainty
This contribution takes into account the interaction between isobaric ions while they travel close together in the analyzer. The magnitude of this effect in the relative mass-to-charge uncertainty is measured and described in Dickel et al. (2015b), and amounts to about per detected isobaric ion per MR-TOF-MS cycle. It can be neglected for all the data presented in this work.
IV.10 Final mass value from individual measurements
The mass-to-charge ratio and uncertainty obtained from the described data-analysis procedure can be converted to the mass value and uncertainty by Eq. 27 and Eq. 28, respectively:
| (27) |
| (28) |
where and are the final atomic mass and its uncertainty, and are the mass-to-charge ratio and its uncertainty obtained in the data-analysis procedure, is the electron mass and is the charge state of the measured IOI. Since measurements are performed on singly- or doubly-charged ions, the electron binding energies in the neutral atom can be neglected.
Combining results for the mass and abundance value of the same IOI, there are two cases: a) different measurements; b) different analysis of the same data set. To determine the mass value a weighted mean is calculated according in Eq. 29. It is assumed that all uncertainties are independent.
| (29) |
where and are the individual values and their uncertainties, respectively. For case a) the uncertainty is divided in an independent component, calculated via the variance of the weighted mean, and a dependent one, calculated via the weighted mean. The uncertainty components are added quadratically. In case of b) the weighted mean of the uncertainties is used.
V Results
The data-analysis procedure and the MR-TOF-MS system have been used for the four experiments described in Section 2. The measured results presented here, cover the following topics: (i) accuracy of the procedure with isotopes of well-known masses, (ii) first-time direct mass measurements, and (iii) first-time measurements of isomer-to-ground state ratios.
V.1 Mass accuracy
The broadband characteristic of the MR-TOF-MS enables simultaneous measurement of exotic nuclei with different mass () and element numbers (). This allows very efficient measurements. As a consequence the broadband measurements with the highest resolving powers yield complex mass-to-charge spectra. However, the data-analysis procedure developed here is capable of analyzing these spectra. An example is given in Fig. 13.
The species shown have a maximum difference of 25 isochronous turns and cover about 10 u/e. The measured Mass Excesses (ME) values are compared with the literature values in dependence of the number of turns in Fig. 14.

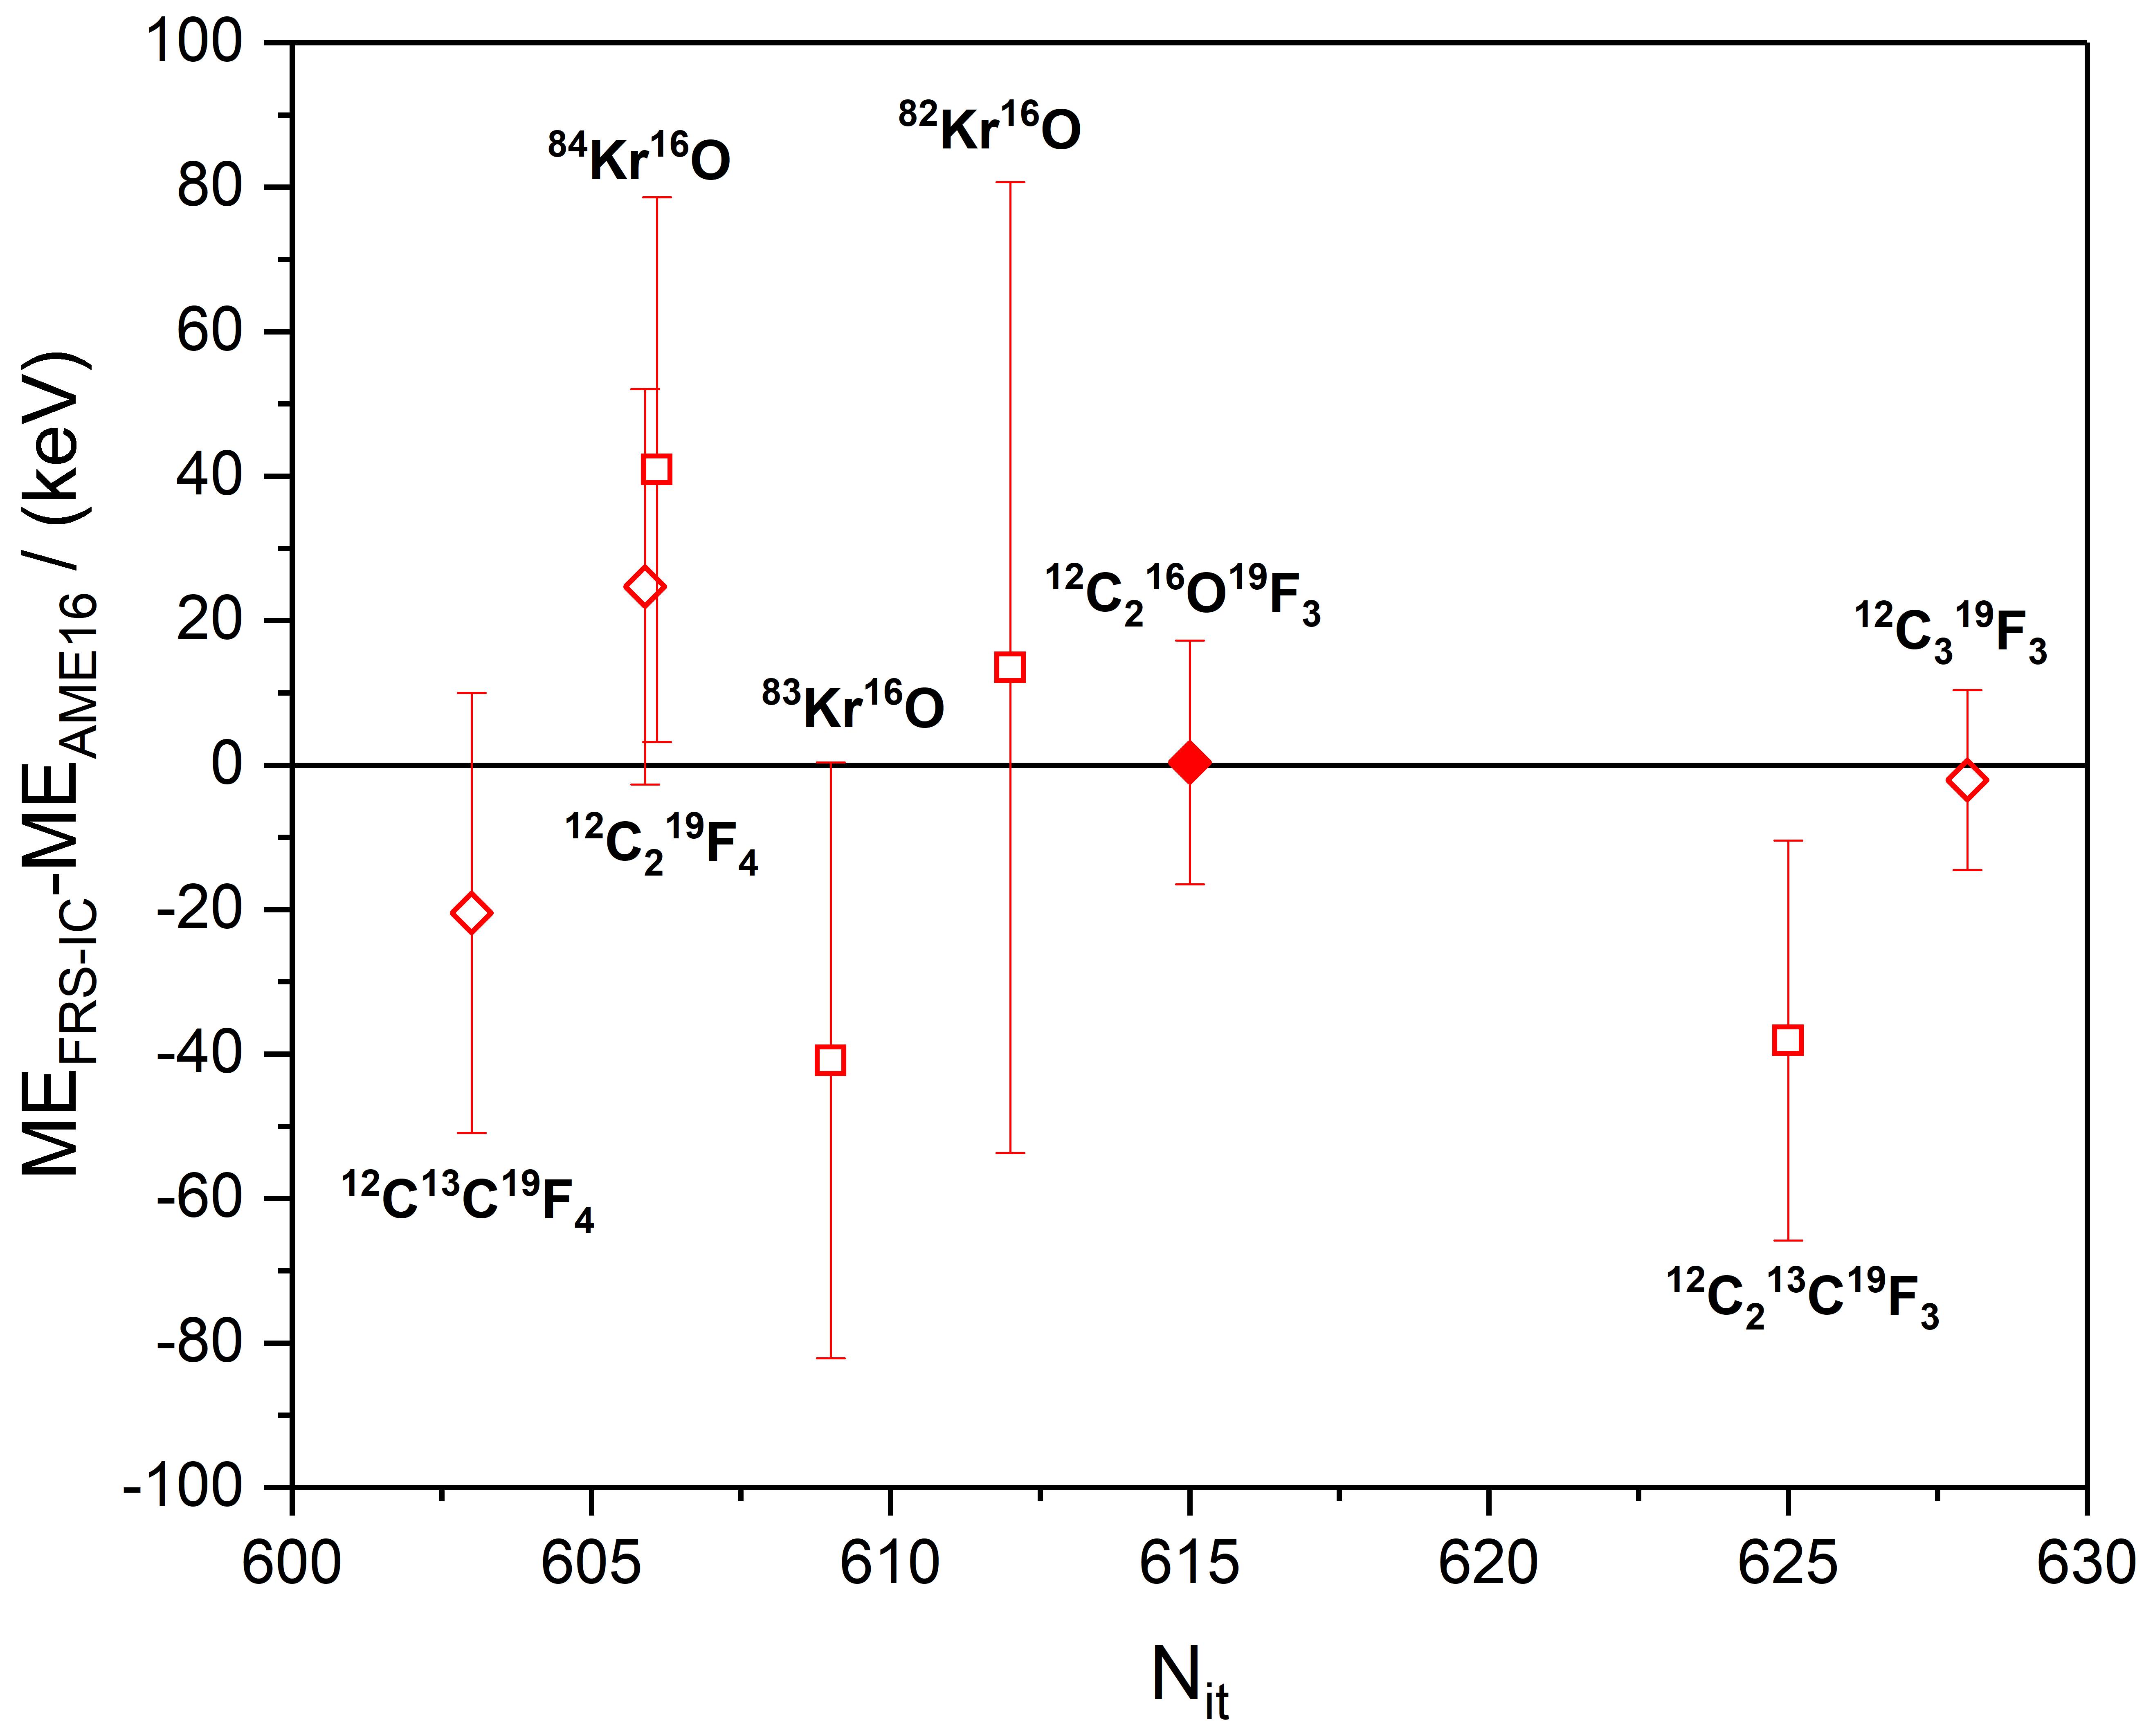
The experimental results agree with the literature values with typical uncertainties of 20 keV. Note, that this uncertainty is merely the result for the example presented here and higher accuracies can be achieved for spectra for different turn numbers.
Nuclei with masses known to high accuracy were studied to determine the mass accuracy of the system and the data-analysis procedure. These include low-lying isomers with low statistics, thus representing the most challenging cases for the data-analysis procedure.
In Fig. 15, a spectrum taken with the MR-TOF-MS during Experiment II and analyzed with the procedure described above is shown. In this spectrum, the calibrant and two nuclides with their long-lived isomeric states are seen, whose masses and excitation energies are well-known from literature.
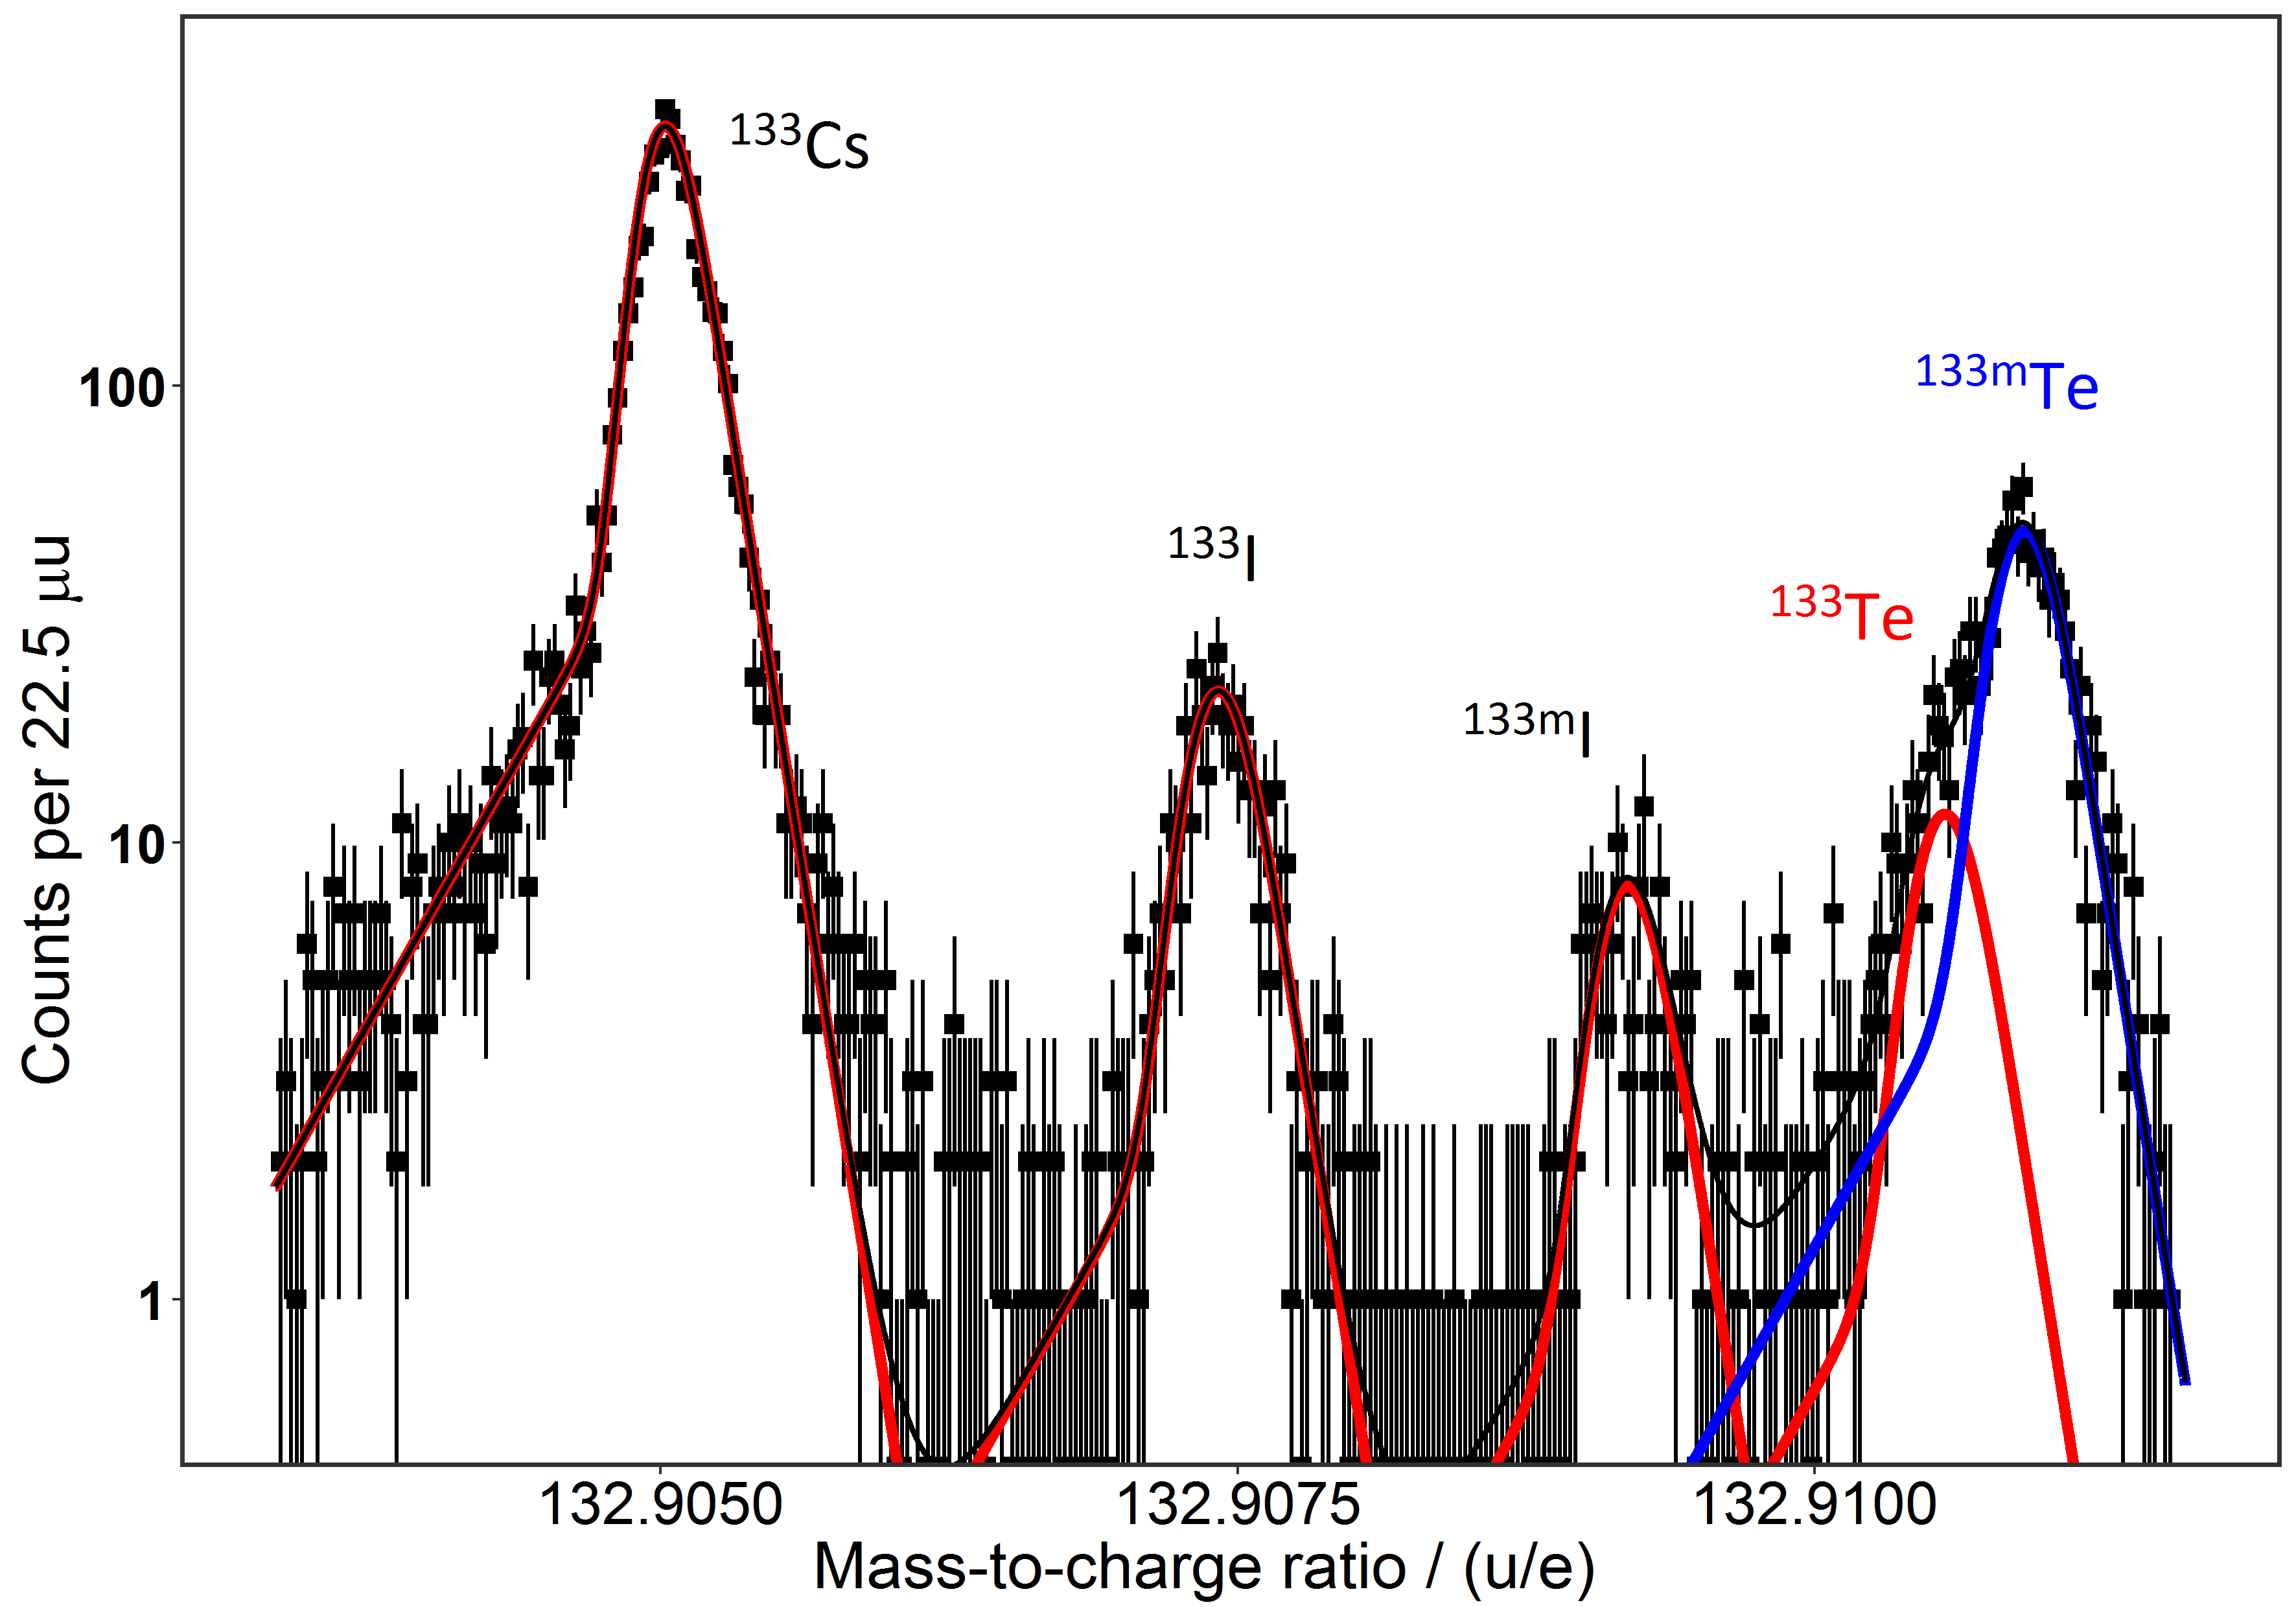
The acquisition time for this measurement was about 2 hours. The excitation energies of the isomers are 1634 keV and 334 keV for iodine and tellurium, respectively. In the case of iodine, the ground and isomeric states can be clearly resolved. For tellurium, the ground and isomeric states are overlapping, and the isomer is visible only as a shoulder on the left side of the isomeric peak. Our data-analysis procedure enabled extraction of the masses and abundance ratios also in the most challenging case.
The next case shows overlapping peaks with very low statistics, placing an even harder challenge for the data-analysis procedure.
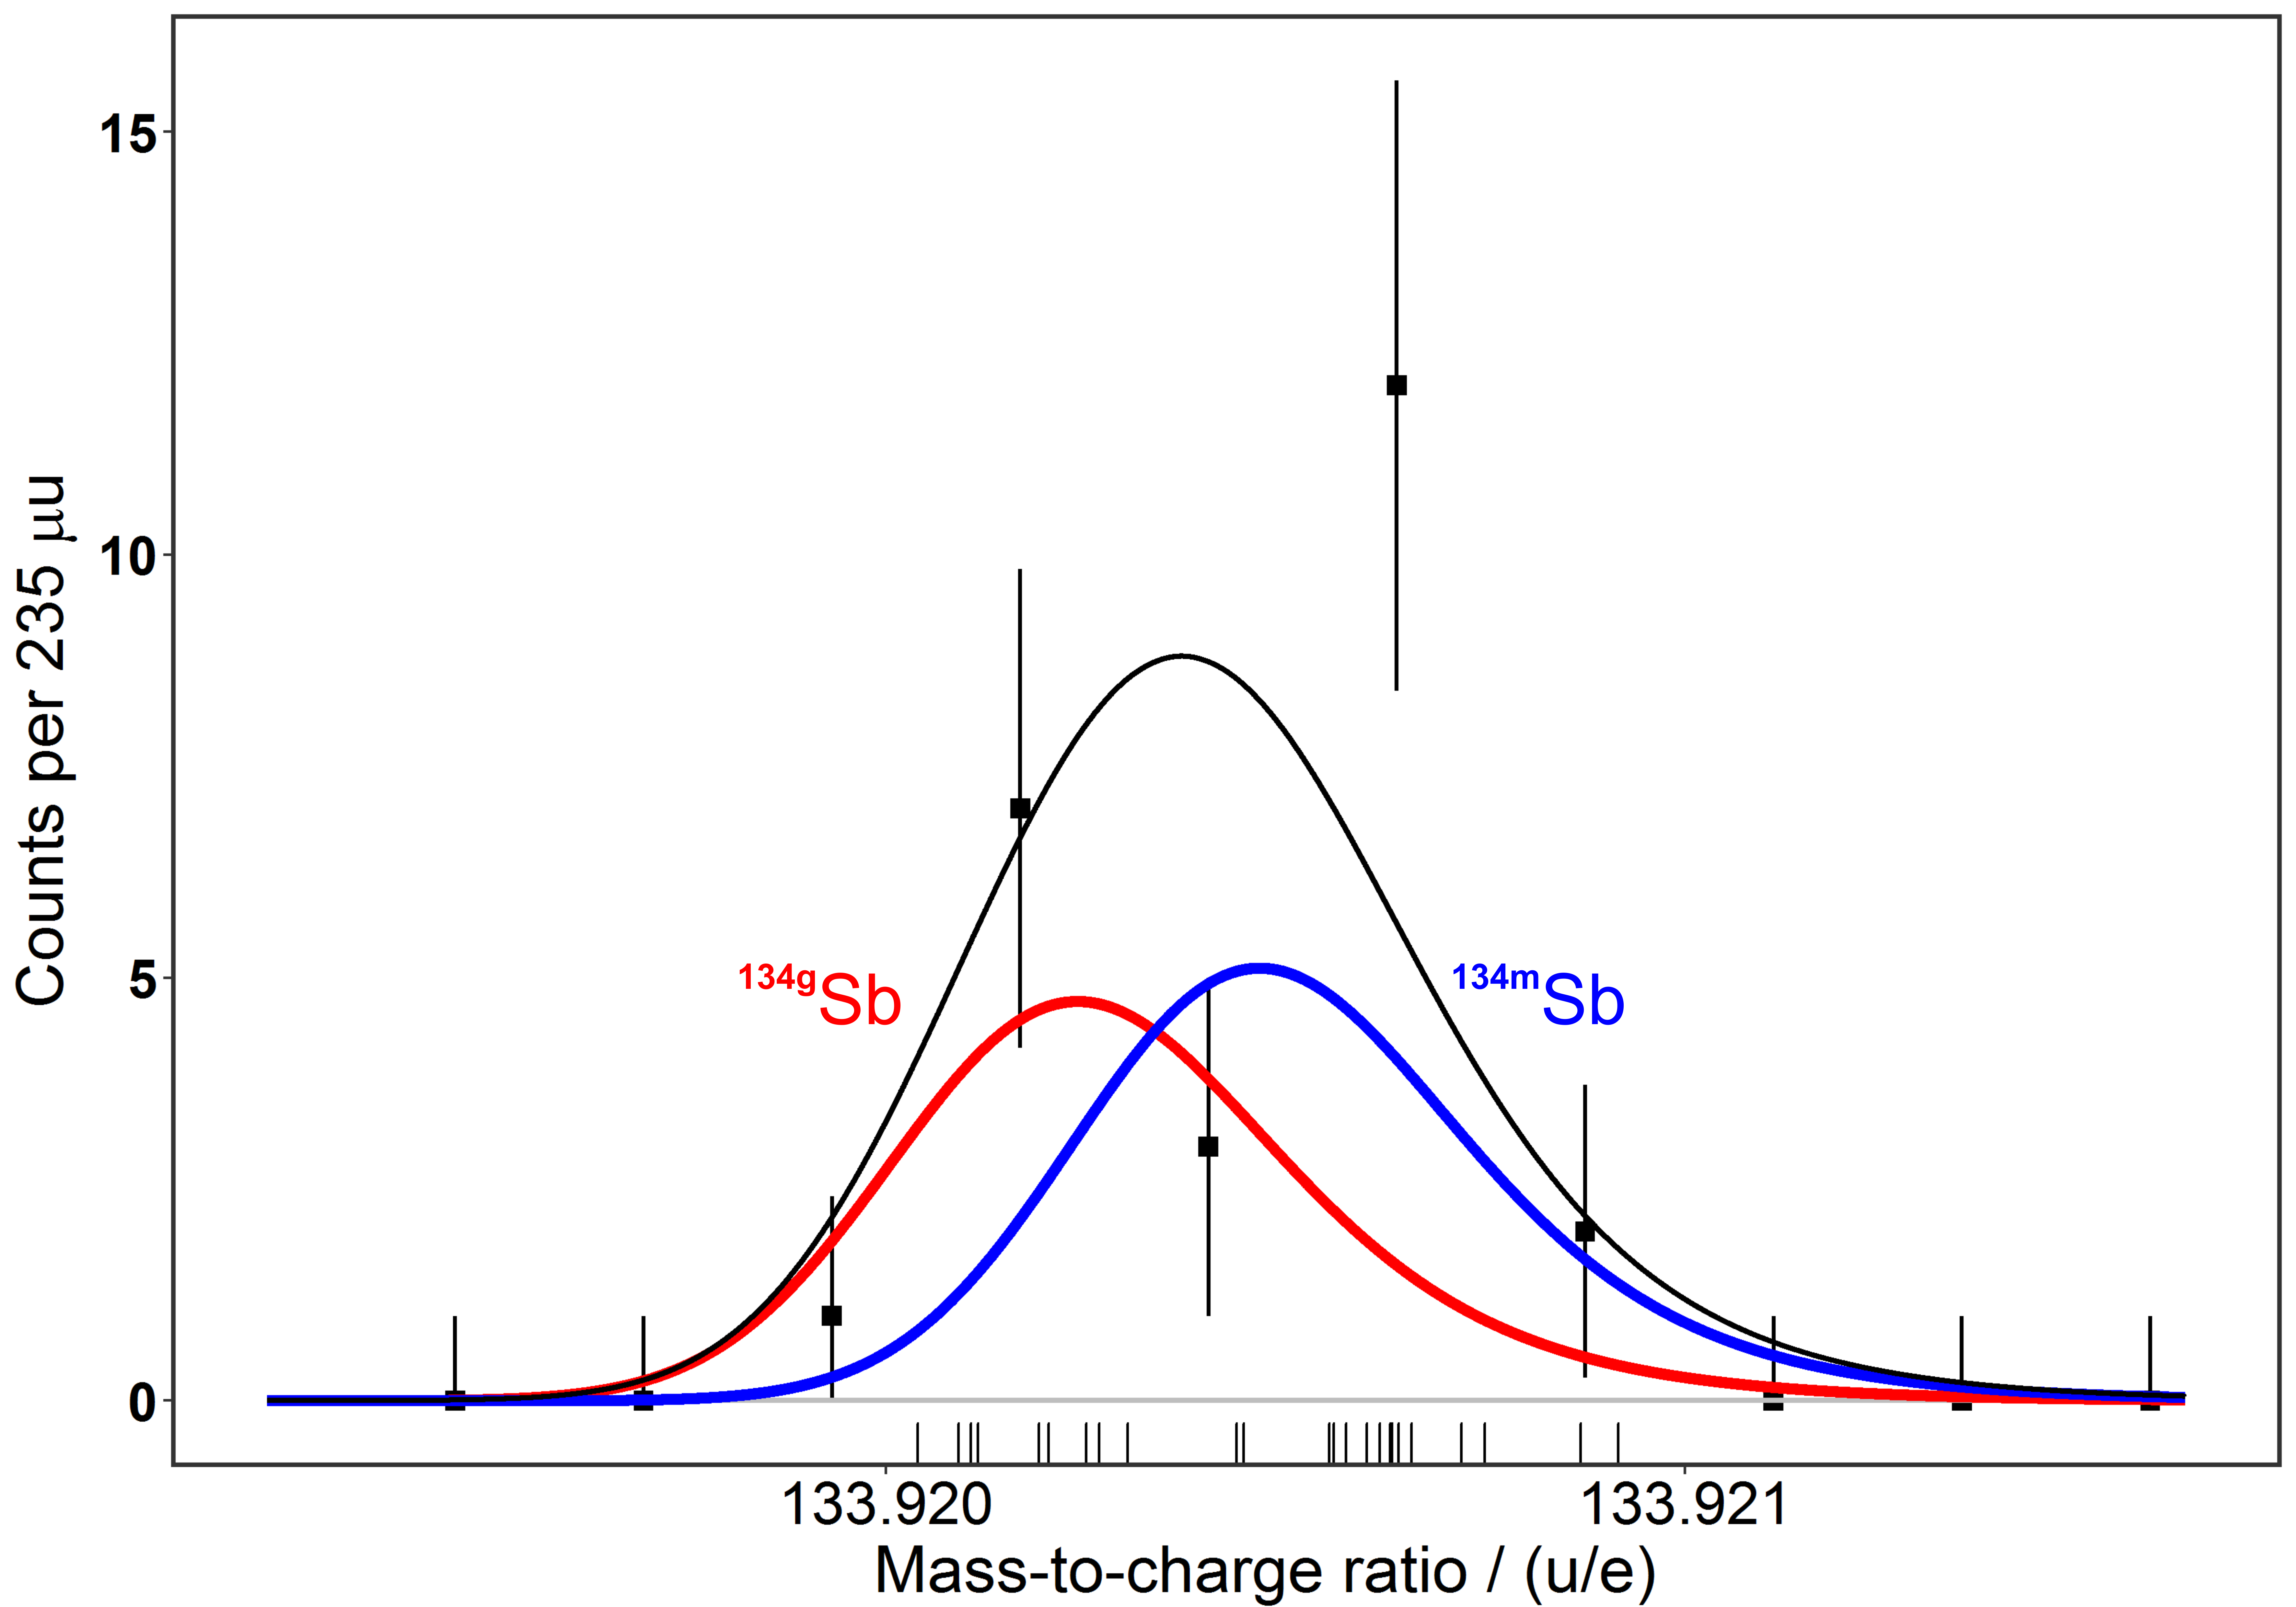
Due to a detection rates of only 12 events per hour, only 25 counts were available for both the ground and isomeric state, expected at an excitation energy of 279 keV. A single-peak fit to the data of 134Sb and 134mSb, with peak-shape parameters obtained from the calibrant peak (Hyper-EMG(0,1)), resulted in a mass value in between the isomer and ground state with a p-value of the KS test of 0.29. When performing a double-peak fit with two Hyper-EMG(0,1) functions, a higher p-value of 0.42 and mass values of the ground state and the isomeric state consistent with literature mass were obtained, with relative uncertainties below 10-6 (see Fig.17 and table 1).
The result of the double-peak fit to the data is shown in Fig. 16. In addition to the ground state mass and isomer excitation energy, the abundance ratio has been determined to be . The uncertainty is dominated by the fact that the peaks are overlapping. If they were resolved, an uncertainty of about 0.4 would be expected just from statistics. This level of uncertainty (mass, excitation energy and isomer-to-ground state ratio) with such a low number of events is possible only due to the high resolving power of the MR-TOF-MS and the data-analysis procedure described here.
| Nuclide | Half-life | Exp. | Reference ion | MEFRS-IC | MEAME16 | MEFRS-IC - MEAME16 | Number |
|---|---|---|---|---|---|---|---|
| / keV | / keV | / keV | of events | ||||
| 213Fr | 34.14 0.06 s | I | 211Pb | -3561.9 12.3 | -3553 5 | -8.9 13.3 | 6022 |
| 212Fr | 20.0 0.6 min | I | 211Pb | -3530 28 | -3516 9 | -14 29 | 445 |
| 211Fr | 3.10 0.02 min | I | 211Pb | -4108 40 | -4140 12 | 32 41 | 126 |
| 134I | 52.5 0.2 min | II | 134Xe | -84062 54 | -84043 5 | -19 54 | 172 |
| 134Sb | 780 60 ms | II | 134Xe | -73915 122 | -74021 2 | 106 122 | 12 |
| 134Te | 41.8 0.8 min | II | 134Xe | -82543 41 | -82534 3 | -10 41 | 61 |
| 133I | 20.83 0.08 h | II | 133Cs | -85852 15 | -85858 6 | 5 15 | 566 |
| 133Te | 12.5 3 min | II | 133Cs | -82932 40 | -82937 2 | 5 40 | 423 |
| 126Cs | 1.64 0.02 min | III | 126Xe | -84340 46 | -84351 10 | 11 47 | 22 |
| 125Cs | 46.7 0.1 min | III | 126Xe | -84040 42 | -84088 8 | 48 43 | 609 |
| 124Cs | 30.9 0.4 s | III | 126Xe | -81700 39 | -81269 8 | 31 40 | 23 |
| 119I | 19.1 0.4 min | III | 12C2 19F5 (A=119) | -83796 34 | -83766 28 | -30 44 | 90 |
| 119Xe | 5.8 0.3 min | III | 12C2 19F5 (A=119) | -78816 57 | -78794 10 | -22 58 | 31 |
| 117I | 2.22 0.04 min | III | 12C2 19F5 (A=119) | -80488 47 | -80436 26 | -51 54 | 1022 |
| 116Te | 2.49 0.04 h | III | 12C2 19F5 (A=119) | -85268 51 | -85269 28 | 1 58 | 1183 |
| 114Sb | 3.49 0.03 min | III | 12C2 19F5 (A=119) | -84497 47 | -84497 22 | -1 52 | 347 |
| 114Te | 15.2 0.7 min | III | 12C2 19F5 (A=119) | -81893 50 | -81889 28 | -4 58 | 269 |
| 107Cd | 6.50 0.02 h | IV | 84Kr 14N2 (A=112) | -86963 90 | -86990 2 | 27 90 | 47 |
| 100Ag | 2.01 0.09 min | IV | 12C2 19F4 (A=100) | -78146 41 | -78138 5 | -8 41 | 36∗ |
| 97Pd | 3.10 0.09 min | IV | 12C2 16O 19F3 (A=97) | -77790 37 | -77806 5 | 16 37 | 35 |
| 96Pd | 122 2 s | IV | 12C2 19F4 (A=100) | -76246 38 | -76183 4 | -63 39 | 224 |
| 94Rh | 70.6 0.6 s∗∗ | IV | 12C2 16O 19F3 (A=97) | -72848 24 | -72908 3 | 60 24 | 338 |
| 94Ru | 51.8 0.6 min | IV | 12C3 13C 19F3 (A=94) | -82547 26 | -82584 3 | 37 26 | 88 |
| 93Ru | 59.7 0.6 s | IV | 12C2 16O 19F3 (A=97) | -77177 44 | -77217 2 | 40 44 | 20 |
All the masses and excitation energies measured and listed in table 1 and table 2 have been directly measured previously by techniques such as Penning trap mass spectrometry (TOF-ICR) or Schottky Mass Spectrometry in storage rings. Therefore, they can be used as references to test possible systematic shifts and unknown systematic uncertainties of the spectrometer or data-analysis procedure presented in this work.
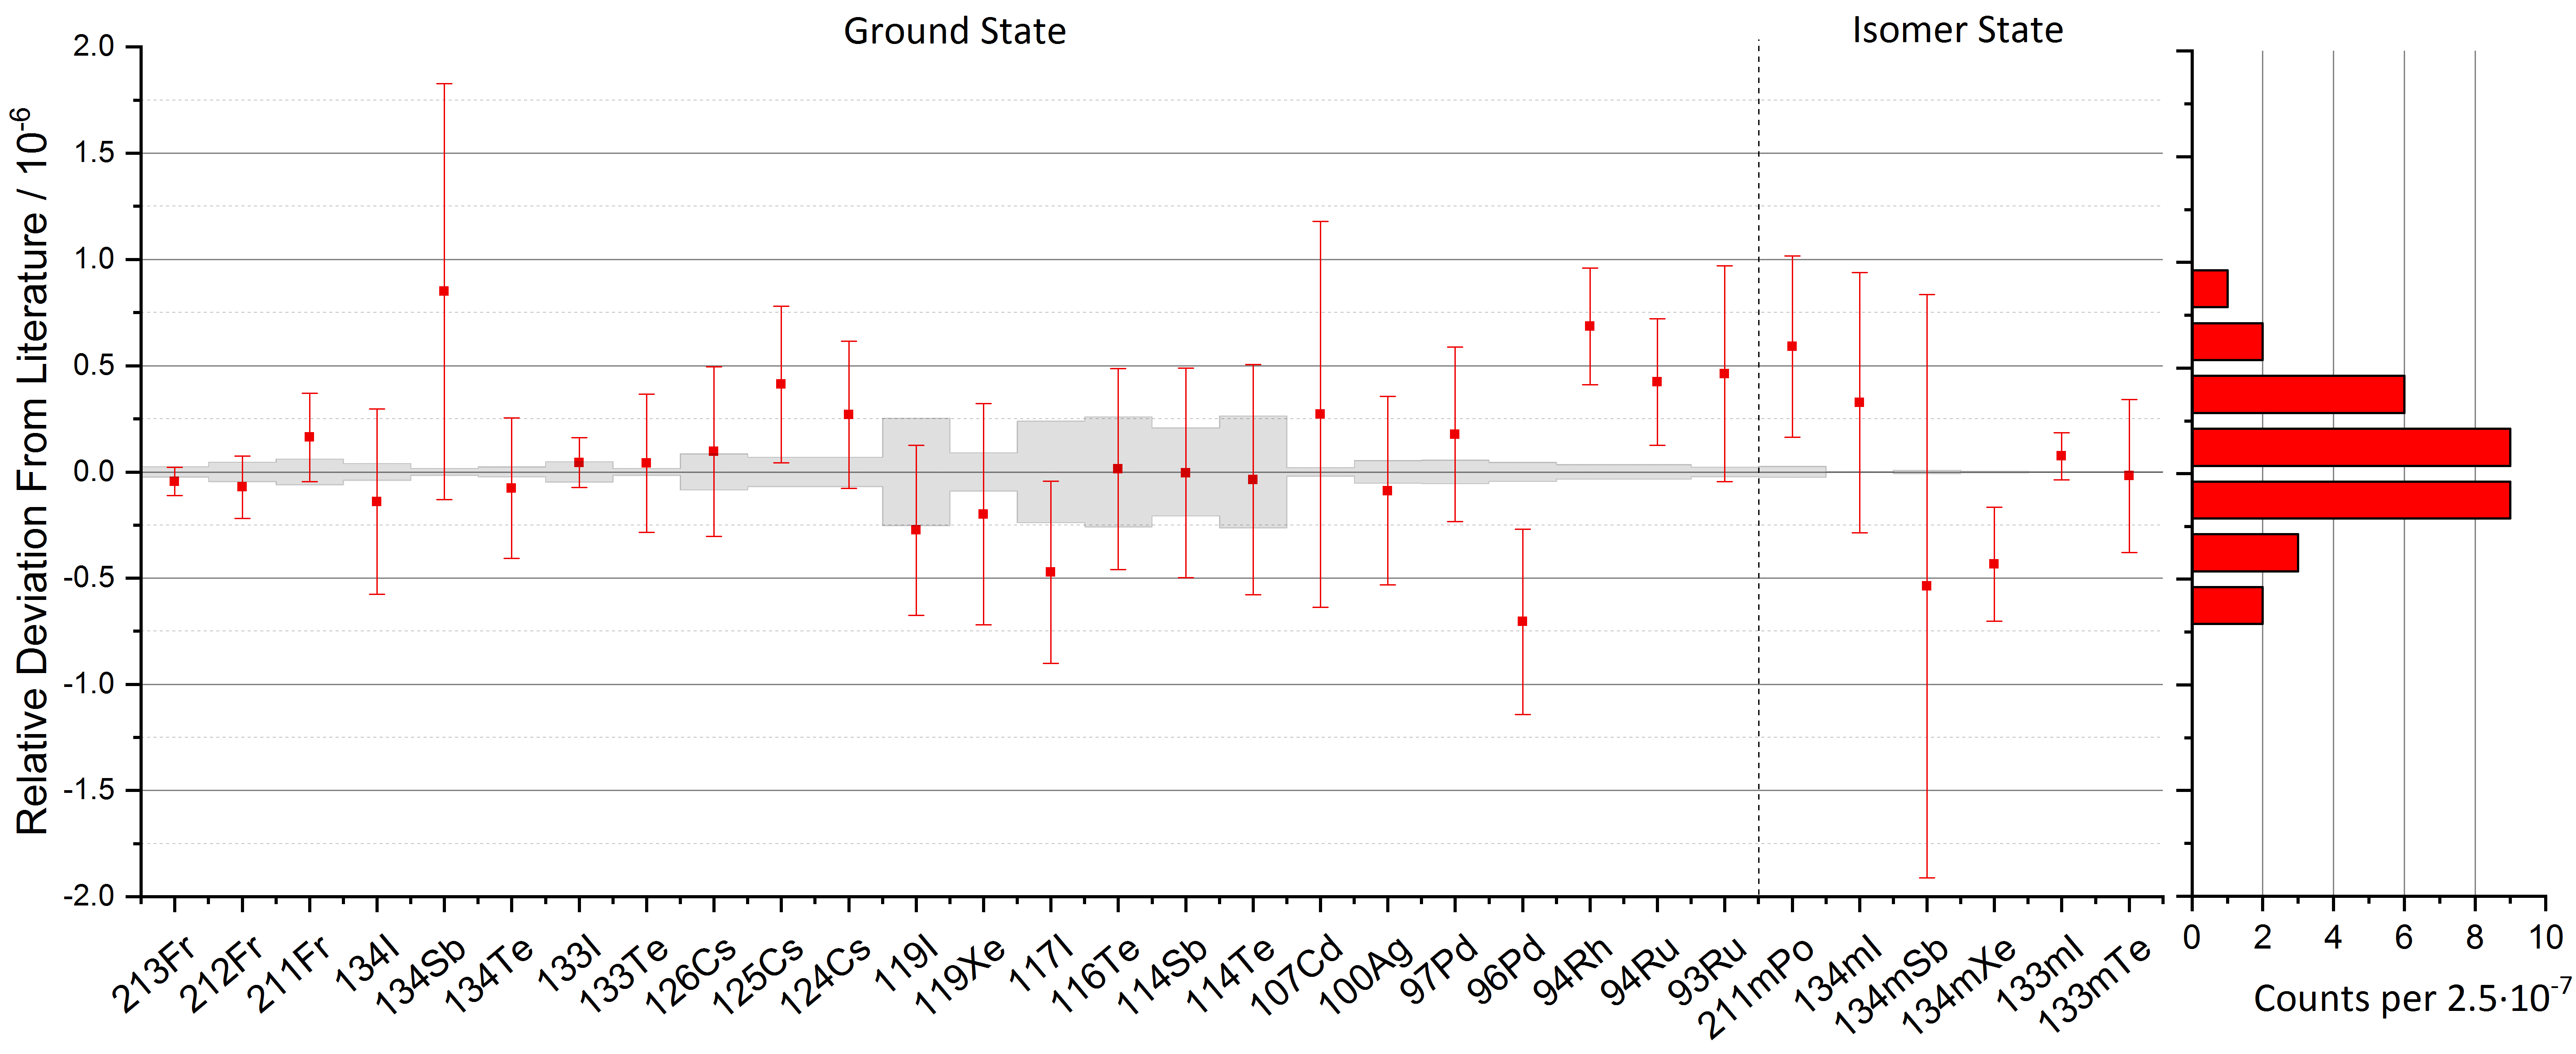
A histogram of the relative deviations between the masses and excitation energies obtained with the MR-TOF-MS of the FRS-IC and the literature values Wang et al. (2017) is shown in the right side of Fig. 17, with a weighted mean of ( and a standard deviation of . This clearly demonstrates that the system and the data-analysis procedure provide highly accurate mass values. Note, about half of the masses have been measured with less than 100 events, and about a quarter of the peaks are not baseline-resolved, i.e. they belong to Class B, C or D.
For 100Ag it is known to have an low-lying isomeric states with excitation energies of 15.5 keV, which were not resolved in the measurement. Their corresponding half-lives are similar on the time scale of the measurement. Therefore it is assumed to be measured as a mixture of both states. The ground state masses are evaluated as described in section IV.9.10.
V.2 Isomer-to-ground state ratios
Isomer-to-ground state ratio shed light on fragmentation in peripheral heavy-ion collisions at relativistic energies, guiding the efficient use of in-flight fragmentation at future radioactive beam facilities Bowry et al. (2013). When nuclides are produced by fission, isomer-to-ground state ratio provide insights regarding the origin of the angular momentum of the fission fragments, which in turn may reveal properties of the dynamical evolution of the fissioning nucleus from the saddle point until its descent to scission Rakopoulos et al. (2018).
The ratios of isomer-to-ground state measured with the MR-TOF-MS are given in table 2. The isomer-to-ground state ratio of 134Sb ions has now been studied in 235U thermal neutron-induced fission Kerek et al. (1972), 232Th 25-MeV proton induced fission Kankainen et al. (2013), 252Cf spontaneous fission Siegl et al. (2018) and now with 238U abrasion-fission.
| Isomer | Half-life | Exp. | Eex,FRS-IC | Eex,LIT | Eex,FRS-IC - Eex,LIT | Isomer-to-ground | |
|---|---|---|---|---|---|---|---|
| / keV | / keV | / keV | state ratio | ||||
| 211mPo | 25.2 0.6 s | I | 1578 84 | 1462 5 | 116 84 | 3.30 1.42 | |
| 134mI | 3.52 0.04 min | II | 357 76 | 316.49 0.22 | 41 76 | 1.26 0.26 | |
| 134mSb | 10.07 0.05 s | II | 212 171 | 279 1 | -67 171 | 1.08 0.73 | |
| 134mXe | 290 17 ms | II | 1911 34 | 1965.5 0.5 | -55 34 | 0.035 0.006 | |
| 133mI | 9 2 s | II | 1643 14 | 1634.148 0.010 | 9 14 | 0.35 0.02 | |
| 133mTe | 55.4 0.4 min | II | 332 45 | 334.26 0.04 | -2 45 | 4.12 0.26 |
V.3 Masses of short-lived nuclides directly measured for the first time
Above the doubly-magic nucleus 208Pb a region of very short-lived nuclei opens up in the nuclear chart with half-lives down to nanoseconds. The masses of these nuclei were measured so far only via their -values. They relate the mother and daughter nuclei masses via -decay. This is only unambiguous if the initial and final states are known. Therefore, direct mass measurements are desirable for the -emitters, such as the recent mass measurements performed at RIKEN Rosenbusch et al. (2018). In the following, we present first-time direct mass measurements of seven -emitters in this region of interest. The measured results are listed in table 3.
| Nuclide | Half-life | Exp. | Reference ion | MEFRS-IC | MEAME16 | MEFRS-IC - MEAME16 | Number |
|---|---|---|---|---|---|---|---|
| / keV | / keV | / keV | of events | ||||
| 220Ra | 17.9 1.4 ms | I | 34S 19F4 (A=110) | 10609 320 | 10270 8 | 339 320 | 11 |
| 218Rn | 33.75 0.15 ms | I | 219Rn | -5089 54 | -5217.3 2.3 | -128 55 | 162 |
| 217At | 32.62 0.24 ms | I | 219Rn | 4433 135 | 4395 5 | 38 135 | 19 |
| 213Rn | 19.5 0.1 ms | I | 211Pb | -5737 63∗ | -5696 3 | -41 63∗ | 165 + 29∗ |
| 212At | 314 2 ms | I | 211Pb | -8601 86 | -8628.2 2.4 | -27 86 | 1496∗∗ |
| 212Rn | 23.9 1.2 min | I | 211Pb | -8609 30 | -8660 3 | 51 30 | 514 |
| 211Po | 516 3 ms | I | 211Pb | -12593 137∗ | -12432.6 1.3 | -160 137∗ | 78 + 411∗ |
V.3.1 212, 213, 218Rn isotopes
The 212Rn nucleus has a closed shell with 126 neutrons and a half-life of 23.9 min, the neighboring isotope 213Rn has a much shorter half-life of 19.5 ms and the 218Rn nucleus has a half-life of 33.75(15) ms.
The present mass measurement was performed with 128 isochronous turns, corresponding to a TOF of about 5.8 ms and a mass resolving power of about 200,000. The masses of these three nuclides were determined in the past by -decay (212Rn:Momyer et al. (1955); Golovkov et al. (1971); 213Rn:Valli et al. (1967, 1970); 218Rn:Bowman et al. (1982); Asaro and Perlman (1956))
V.3.2 211Po isotope
The ground and isomeric states of 211Po nuclei have been studied by -spectroscopy (eg., Jentschke et al. (1954); Walen et al. (1962); Bowman et al. (1982)) in the past. In our mass measurement, the 211Po ions traveled 192 isochronous turns in the analyzer of the MR-TOF-MS, resulting in a mass resolving power of 300,000. This is not enough to resolve the ground state of 211Pb and the isomeric state of 211Po, separated by 574 keV/c2. The radioactive ion source installed in the CSC has produced the 211Pb ions. They were used for calibration at the beginning and end of the measurement, when no beam entered the CSC. During operation with beam, the 211Pb ion source was blocked by an electric field (220 V, DC), but some 211Pb background ions remained. This was taken into account in the data analysis by including a third peak for 211Pb. The parameters for this peak was fixed. The uncertainty of the parameters of the third peak, especially the rate of the 211Pb background ions, has been considered for the final mass uncertainty. For the -isomer of 211Po an excitation energy of 1578(84) keV was measured which is in agreement with our previously direct measurement 1472 (120) keV Dickel et al. (2015a), the literature value is 1462(5) keV Jain et al. (2015).
V.3.3 220Ra isotope
The measurement and data analysis of 220Ra ions was especially challenging, because: (i) 220Ra nuclides has a half-life of 17.9 ms, which is the shortest-lived isotope measured with an MR-TOF-MS up to now, (ii) the ion was measured as doubly-charged, (iii) only 11 counts were recorded. The MR-TOF-MS and the data-analysis procedures described in this paper have been developed to cope with these challenges.
V.3.4 212, 217At isotopes
The 212At nucleus has a half-life of 314 ms for the ground state and 119 ms for the isomeric state with an excitation energy of 222.9(0.9) keV. This mass difference was not resolved in the measurement. Both states decay via -decay. In this measurement, the FRS was set to the very short-lived fragment 216Fr, which was stopped in the CSC and decayed into 212At via -decay. Both nuclei, 216Fr and 212At, have a isomeric state. The isomer of 216Fr decays in similar manner to its ground state via -decay Kurcewicz et al. (2007). The ground state and the isomer have similar half-lives - 700 ns and 850 ns, respectively. Therefore both states decay in the CSC, the recoil energy is absorbed by the helium gas, and the ground and isomeric state of 212At are populated. Kurcewicz et al. Kurcewicz et al. (2007) reported an isomeric ratio for the state of 0.28(1) for 212At and 0.31(2) for 216Fr. The latter nucleus was populated via -decay of 220Ac. In a later investigation Wojtasiewicz et al. (2009) the isomeric ratio for the state in 212At was again determined. The obtained value was 0.09(2) which differs strongly from the reported value of reference Kurcewicz et al. (2007).
217At has a half-life of 32.3 ms. Its production cross section is 18 barn, the smallest of all isotopes presented here. Therefore, the uncertainty in its mass measurement is dominated by statistics, as the spectrum included only 19 ions. The mass of 217At nuclides was measured previously only by -spectroscopy Vorob’ev et al. (1960); Bowman et al. (1982).
VI Experimental results compared with theoretical predictions at the lead shell closures
Accurate mass values and also their differences can provide basic information of the strong interaction in nuclei and are essential for the understanding of the synthesis of the elements in the universe Schatz (2013). Nuclear shell stabilization is the reason for the existence of the heaviest experimentally known elements and particularly for the superheavy elements Oganessian (2001); Muenzenberg (2015). The doubly magic nucleus 208Pb, formed by bound 82 protons and 126 neutrons, represents the heaviest experimentally and theoretically well-known proton shell closure. The masses in this domain have been experimentally determined mainly via decay data and are now for the first time directly measured with the MR-TOF-MS. Therefore, this region of nuclides is an ideal testing ground for our new experimental method discussed in this work. The new mass values, measured with the MR-TOF-MS, have been applied, together with the experimentally known data, to investigate the accuracy of different basic theoretical predictions in the Pb region.
The two-neutron separation energy () is defined by the relation of the mass excess values (ME):
| (30) |
where is the mass excess of the neutron. The surface in the Pb mass region is shown in Fig. 18.
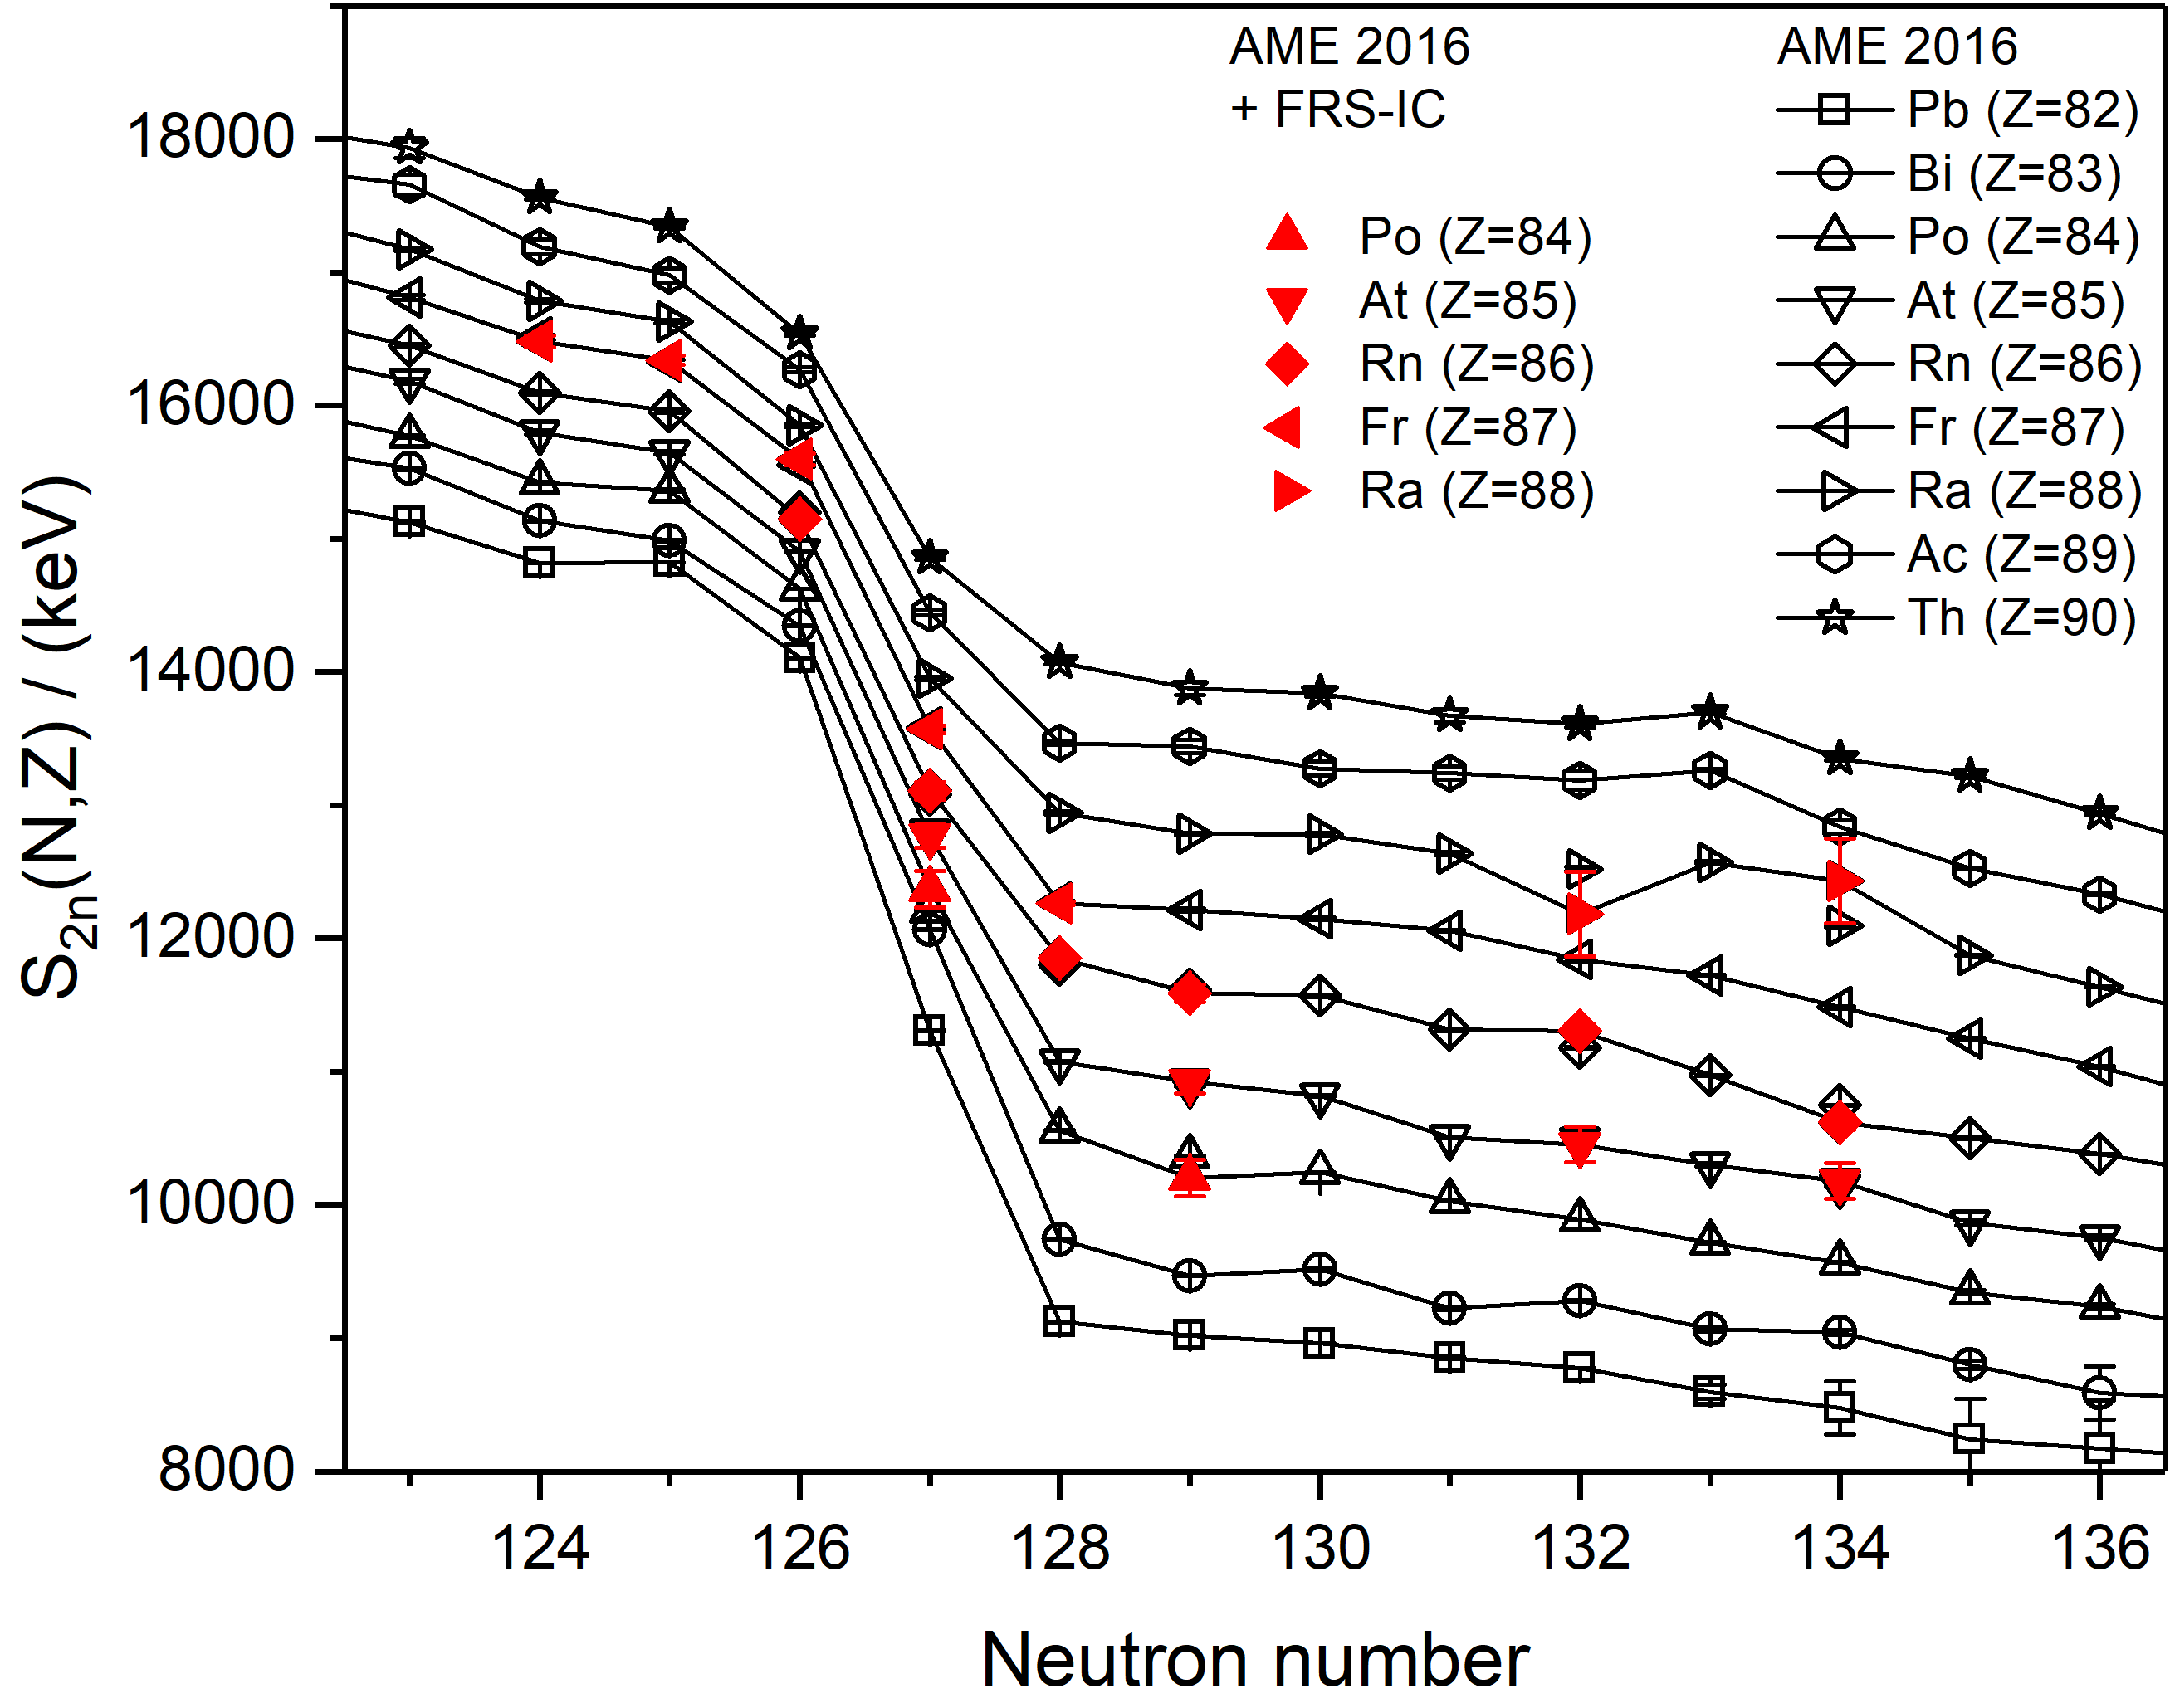
As already presented in the previous chapters, the new MR-TOF-MS data are in excellent agreement with previously known data which have been determined via Qα values and other quite different experimental methods. The experimental values show the expected steep drop at the N=126 shell for all elements in the region. A closer look indicates that the slope becomes shallower with an increasing difference of the proton number from the closed shell Z=82.
This evolution of the shell gap near the double magicity can be illustrated by the slope of the difference of the two-neutron separation energies for different elements.
For this goal, we study the difference given by
| (31) |
thus mapping the proton shell closure at lead. Figure 19 presents this correlation using the experimental data of this work and the AME2016 data base Wang et al. (2017). The symbols denoted by a blue color indicate the mass excess data of the present experiments.

The observation is that except for the chain of N=126 and N=127 the correlation is very weak, manifested in the horizontal slopes with small staggering. The behavior of N=127 and N=126 is significantly different. The curves exhibit a positive slope beyond the Z=82 shell closure, undergo a minimum near the proton shell closure. The peculiar experimental observation has been manifested by our direct mass measurements.
In the next step of this study, it is interesting to investigate the predictions of different theoretical models in the same mass range. We have selected successful mass models based on quite different theoretical approaches. The predictive power of different models have been recently compared with experimental data in reference Sobiczewski and Litvinov (2014).
In figure 20, the theoretical slopes for two neutron separation energies with neutron numbers 124-128 are shown as a function of the atomic number. In general, the theoretical data strongly deviate from the experimental observation, especially for the N=126 and N=127 chains.

In the top panel of figure 20 the predictions of Myers and Swiatecki Myers and Swiatecki (1996), based on the Thomas-Fermi (TF) model, are presented. This model had one of the best predictive power over the full range of isotopes Sobiczewski and Litvinov (2014). The TF model indicates for all neutron chains horizontal slopes with small staggering features. Except for the N=126 and N=127 chains this reflects the experimental observation. However, for N=126 and N=127 the TF model deviates strongly and has deviations of several hundred keV. The two other theoretical comparisons show two pure microscopic approaches. In the middle panel a Hartree-Fock-Bogolubov model, denoted as ’HFB-21’ Goriely et al. (2013) and in the bottom panel an energy density functional ’UNEDF0’ Kortelainen et al. (2010) were employed. The strong deviation of experimental and theoretical data especially for N=126 and N=127 is manifested in all panels of figure 20.
In the HFB-21 approach, one can see a staggering with amplitude near 1 MeV, which is clearly not observed in the experimental data. This suggests that the pairing force is not properly adjusted in this model. In the UNEDF0 approach, the corresponding curves are smooth and horizontal. However, both theories cannot reproduce the experimental observation. The UNEDF0 model has even a reversed order for the N=126 and N=127 shells. The observed experimental peculiarity is certainly a stringent test for the accuracy and limitation of the present theories. Therefore, it represents a strong motivation for theoretical improvements even in the so-called well-known domain of the doubly magic nucleus 208Pb and for the domain of shell effects of superheavy elements.
VII Summary and Outlook
Direct mass measurements of fission and projectile fragments produced with 238U and 124Xe primary beams have been performed with the MR-TOF-MS of the FRS Ion Catcher in four experiments. The nuclides were produced, separated in-flight, and energy-bunched with the FRS and finally thermalized in gas-filled cryogenic stopping cell (CSC). An MR-TOF-MS specialized for the accurate mass measurements for rare isotopes, with a few counts only, has been used in the present experiments. A data-analysis procedure was developed to determine the mass values and their uncertainties. The analysis is well suited for overlapping peaks, which solely can be distinguished from a single peak by a change in the peak shape. With this data-analysis procedure, the effective mass resolving power for overlapping peaks is increased by a factor of up to three compared to standard data analysis. This procedure has a direct impact for the resolution of low-lying isomers.
The masses of 31 unstable nuclides with half-lives down to 18 ms were measured. Mass resolving powers beyond 400,000 were achieved. This is the highest mass resolving power reached in mass measurements of short-lived nuclides with an MR-TOF-MS up to now. The masses of six isomeric states with excitation energies down to 280 keV were determined. Nuclides of 15 different elements were measured with count rates as low as 11 events per nuclide. It was further possible to extract mass values for isotopes with ion detection rates of as low as 12 events per hour. The weighted mean of the relative deviations from literature for all the measured masses is . The minimum relative uncertainty obtained with the MR-TOF-MS is .
The first direct mass measurements of seven isotopes close to the double magic nucleus 208Pb allowed to study the evolution of the two-neutron separation energies. A strong element-dependency is seen for the first neutron above the closed proton shell Z=82. The experimental results deviate strongly from different theoretical predictions, especially for N=126 and N=127. Therefore, it is a new challenge for the theoretical models even in the so-called well-known domain of the doubly magic nucleus 208Pb.
These results demonstrate the competitiveness of a high-resolution MR-TOF-MS for measuring masses of short-lived nuclides with an accuracy high enough to yield significant information for nuclear physics and astrophysics. It opens the door for measurements of unknown masses with an accuracy that was up to now only possible with Penning traps.
Future efforts will focus on the following improvements: isobaric continuous calibration will be provided by a newly designed laser ablation carbon cluster ion source included in the upgraded RFQ beamline between the CSC and the MR-TOF-MS Hornung et al. (2018); the improved operation mode and electronics for the MRS will make this uncertainty negligible Bergmann et al. (2018), and the resolving power will be further increased by means of an improved ion-optical tuning, longer cycle times, and further improved stability of the voltages supplied to the analyzer. With these improvements a relative uncertainty in the range of is within reach.
While in previous experiments with the FRS Ion Catcher the focus was placed on the commissioning and characterization of the CSC, experiments in the coming years will be dedicated physics experiments. Several experimental runs will be performed during FAIR Phase-0 at GSI/FAIR. These experiments include mass measurements at =126 below 208Pb Pietri et al. (2018) and for nuclides below 100Sn Plaß et al. (2018). Moreover the system will be used to identify reactions and decay products and thereby measure beta-delayed neutron emission probabilities Mardor et al. (2018) and multi-nucleon transfer reaction product cross-sections Dickel et al. (2018).
Acknowledgments
In memory, we gratefully acknowledge the long-standing, fruitful collaboration with our dear colleague and friend A. Sobiczewski.
We would like to thank K.-H. Behr, T. Blatz, A. Brünle, C. Karagiannis, A. Kratz, C. Lotze, C. Schlör, B. Szczepanczky, J. Siebring, T. Wasem and R. Weiß for excellent technical support. L. Schlüter, V. Munoz, G. Kripko-Koncz and M. Macko we would like to thank for helping in debugging the data analysis code. This work was supported by the German Federal Ministry for Education and Research (BMBF) under under contracts no. 05P12RGFN8 and 05P15RGFN1, by Justus-Liebig-Universität Gießen and GSI under the JLU-GSI strategic Helmholtzpartnership agreement, by HGS-HIRe, and by the Hessian Ministry for Science and Art (HMWK) through the LOEWE Center HICforFAIR.
References
- Bohr and Mottelson (1998) A. Bohr and B. Mottelson, World Scientific, Singapore , (1998).
- Schatz (2013) H. Schatz, Int. J. Mass Spectrom. 349 - 350, 181 (2013).
- Zhang et al. (2016) Y. H. Zhang, Y. A. Litvinov, T. Uesaka, and H. S. Xu, Phys. Scr. 91, 073022 (2016).
- Mumpower et al. (2016) M. R. Mumpower, R. Surman, G. C. McLaughlin, and A. Aprahamian, Prog. Part. Nucl. Phys. 86, 86 (2016).
- Wolf et al. (2013a) R. N. Wolf, D. Beck, K. Blaum, C. Böhm, C. Borgmann, M. Breitenfeldt, N. Chamel, S. Goriely, F. Herfurth, M. Kowalska, S. Kreim, D. Lunney, V. Manea, E. Minaya Ramirez, S. Naimi, D. Neidherr, M. Rosenbusch, L. Schweikhard, J. Stanja, F. Wienholtz, and K. Zuber, Phys. Rev. Lett. 110, 041101 (2013a).
- Wollnik and Przewloka (1990) H. Wollnik and M. Przewloka, Int. J. Mass Spectrom. Ion Processes 96, 267 (1990).
- Plaß et al. (2013a) W. R. Plaß, T. Dickel, and C. Scheidenberger, Int. J. of Mass Spectrom. 349 - 350, 134 (2013a).
- Knöbel et al. (2016) R. Knöbel, M. Diwisch, H. Geissel, Y. A. Litvinov, Z. Patyk, W. R. Plaß, C. Scheidenberger, B. Sun, H. Weick, F. Bosch, D. Boutin, L. Chen, C. Dimopoulou, A. Dolinskii, B. Franczak, B. Franzke, M. Hausmann, C. Kozhuharov, J. Kurcewicz, S. A. Litvinov, M. Matoš, M. Mazzocco, G. Münzenberg, S. Nakajima, C. Nociforo, F. Nolden, T. Ohtsubo, A. Ozawa, J. Stadlmann, M. Steck, T. Suzuki, P. M. Walker, M. Winkler, and T. Yamaguchi, Eur. Phys. J. A 52, 138 (2016).
- Litvinov et al. (2005) Y. Litvinov, H. Geissel, T. Radon, F. Attallah, G. Audi, K. Beckert, F. Bosch, M. Falch, B. Franzke, M. Hausmann, M. Hellström, T. Kerscher, O. Klepper, H.-J. Kluge, C. Kozhuharov, K. Löbner, G. Münzenberg, F. Nolden, Y. Novikov, W. Quint, Z. Patyk, H. Reich, C. Scheidenberger, B. Schlitt, M. Steck, K. Sümmerer, L. Vermeeren, M. Winkler, T. Winkler, and H. Wollnik, Nucl. Phys. A 756, 3 (2005).
- Chen et al. (2010) L. Chen, W. R. Plaß, H. Geissel, R. Knöbel, C. Kozhuharov, Y. A. Litvinov, Z. Patyk, C. Scheidenberger, K. Siegień-Iwaniuk, B. Sun, H. Weick, K. Beckert, P. Beller, F. Bosch, D. Boutin, L. Caceres, J. J. Carroll, D. M. Cullen, I. J. Cullen, B. Franzke, J. Gerl, M. Górska, G. Jones, A. Kishada, J. Kurcewicz, S. Litvinov, Z. Liu, S. Mandal, F. Montes, G. Münzenberg, F. Nolden, T. Ohtsubo, Z. Podolyák, R. Propri, S. Rigby, N. Saito, T. Saito, M. Shindo, M. Steck, P. Ugorowski, P. Walker, S. Williams, M. Winkler, H.-J. Wollersheim, and T. Yamaguchi, Phys. Lett. B 691, 234 (2010).
- Blaum et al. (2013) K. Blaum, J. Dilling, and W. Nörtershäuser, Phys. Scr. T152, 014017 (2013).
- Eliseev et al. (2013) S. Eliseev, K. Blaum, M. Block, C. Droese, M. Goncharov, E. Minaya Ramirez, D. A. Nesterenko, Y. N. Novikov, and L. Schweikhard, Phys. Rev. Lett. 110, 082501 (2013).
- Dickel et al. (2015a) T. Dickel, W. R. Plaß, A. Becker, U. Czok, H. Geissel, E. Haettner, C. Jesch, W. Kinsel, M. Petrick, C. Scheidenberger, A. Simon, and M. I. Yavor, Nucl. Instrum. Methods A 777, 172 (2015a).
- Wolf et al. (2013b) R. N. Wolf, F. Wienholtz, D. Atanasov, D. Beck, K. Blaum, C. Borgmann, F. Herfurth, M. Kowalska, S. Kreim, Y. A. Litvinov, D. Lunney, V. Manea, D. Neidherr, M. Rosenbusch, L. Schweikhard, J. Stanja, and K. Zuber, Int. J. of Mass Spectrom. 349 - 350, 123 (2013b).
- Schury et al. (2013) P. Schury, M. Wada, Y. Ito, S. Naimi, T. Sonoda, H. Mita, A. Takamine, K. Okada, H. Wollnik, S. Chon, H. Haba, D. Kaji, H. Koura, H. Miyatake, K. Morimoto, K. Morita, and A. Ozawa, Nucl. Instrum. Methods B 317, 537 (2013).
- Jesch et al. (2015) C. Jesch, T. Dickel, W. R. Plaß, D. Short, S. Ayet San Andrés, J. Dilling, H. Geissel, F. Greiner, J. Lang, K. G. Leach, W. Lippert, C. Scheidenberger, and M. I. Yavor, Hyperfine Interact. 235, 97 (2015).
- Wienholtz et al. (2013) F. Wienholtz, D. Beck, K. Blaum, C. Borgmann, M. Breitenfeldt, R. B. Cakirli, S. George, F. Herfurth, J. D. Holt, M. Kowalska, S. Kreim, D. Lunney, V. Manea, J. Menéndez, D. Neidherr, M. Rosenbusch, L. Schweikhard, J. Simonis, J. Stanja, R. Wolf, and K. Zuber, Nature 498, 346 (2013).
- Leistenschneider et al. (2018) E. Leistenschneider, M. P. Reiter, S. Ayet San Andrés, B. Kootte, J. D. Holt, P. Navrátil, C. Babcock, C. Barbieri, B. R. Barquest, J. Bergmann, J. Bollig, T. Brunner, E. Dunling, A. Finlay, H. Geissel, L. Graham, F. Greiner, H. Hergert, C. Hornung, C. Jesch, R. Klawitter, Y. Lan, D. Lascar, K. G. Leach, W. Lippert, J. E. McKay, S. F. Paul, A. Schwenk, D. Short, J. Simonis, V. Somà, R. Steinbrügge, S. R. Stroberg, R. Thompson, M. E. Wieser, C. Will, M. Yavor, C. Andreoiu, T. Dickel, I. Dillmann, G. Gwinner, W. R. Plaß, C. Scheidenberger, A. A. Kwiatkowski, and J. Dilling, Phys. Rev. Lett. 120, 062503 (2018).
- Ito et al. (2018) Y. Ito, P. Schury, M. Wada, F. Arai, H. Haba, Y. Hirayama, S. Ishizawa, D. Kaji, S. Kimura, H. Koura, M. MacCormick, H. Miyatake, J. Y. Moon, K. Morimoto, K. Morita, M. Mukai, I. Murray, T. Niwase, K. Okada, A. Ozawa, M. Rosenbusch, A. Takamine, T. Tanaka, Y. X. Watanabe, H. Wollnik, and S. Yamaki, Phys. Rev. Lett. 120, 152501 (2018).
- Reiter et al. (2018) M. P. Reiter, S. Ayet San Andrés, E. Dunling, B. Kootte, E. Leistenschneider, C. Andreoiu, C. Babcock, B. R. Barquest, J. Bollig, T. Brunner, I. Dillmann, A. Finlay, G. Gwinner, L. Graham, J. D. Holt, C. Hornung, C. Jesch, R. Klawitter, Y. Lan, D. Lascar, J. E. McKay, S. F. Paul, R. Steinbrügge, R. Thompson, J. L. Tracy, M. E. Wieser, C. Will, T. Dickel, W. R. Plaß, C. Scheidenberger, A. A. Kwiatkowski, and J. Dilling, Phys. Rev. C 98, 024310 (2018).
- Kimura et al. (2018) S. Kimura, Y. Ito, D. Kaji, P. Schury, M. Wada, H. Haba, T. Hashimoto, Y. Hirayama, M. MacCormick, H. Miyatake, J. Moon, K. Morimoto, M. Mukai, I. Murray, A. Ozawa, M. Rosenbusch, H. Schatz, A. Takamine, T. Tanaka, Y. Watanabe, and H. Wollnik, Int. J. of Mass Spectrom. 430, 134 (2018).
- Plaß et al. (2013b) W. R. Plaß, T. Dickel, S. Purushothaman, P. Dendooven, H. Geissel, J. Ebert, E. Haettner, C. Jesch, M. Ranjan, M. P. Reiter, H. Weick, F. Amjad, S. Ayet San Andrés, M. Diwisch, A. Estrade, F. Farinon, F. Greiner, N. Kalantar-Nayestanaki, R. Knöbel, J. Kurcewicz, J. Lang, I. Moore, I. Mukha, C. Nociforo, M. Petrick, M. Pfützner, S. Pietri, A. Prochazka, A.-K. Rink, S. Rinta-Antila, D. Schäfer, C. Scheidenberger, M. Takechi, Y. K. Tanaka, J. S. Winfield, and M. I. Yavor, Nucl. Instrum. Methods B 317, 457 (2013b).
- Rodriguez et al. (2010) D. Rodriguez et al., Eur. Phys. J.-Spec. Top. 183, 1 (2010).
- Ebert (2016) J. Ebert, Mass Measurements of 238-U-Projectile Fragments for the First Time with a Multiple-Reflection Time-Of-Flight Mass Spectrometer, Ph.D. thesis, Universität Gießen (2016).
- Ayet San Andrés (2018) S. Ayet San Andrés, Developments for Multiple-Reflection Time-of-Flight Mass Spectrometers and their Application to High Resolution Mass Measurements of Exotic Nuclei, Ph.D. thesis, Universität Gießen (2018).
- Hornung (2018) C. Hornung, High-Resolution Experiments with the MR-TOF-MS at the FRS, Ph.D. thesis, Universität Gießen (2018).
- Geissel et al. (1992) H. Geissel, P. Armbruster, K. Behr, A. Brünle, K. Burkard, M. Chen, H. Folger, B. Franczak, H. Keller, O. Klepper, B. Langenbeck, F. Nickel, E. Pfeng, M. Pfützner, E. Roeckl, K. Rykaczewski, I. Schall, D. Schardt, C. Scheidenberger, K.-H. Schmidt, A. Schröter, T. Schwab, K. Sümmerer, M. Weber, G. Münzenberg, T. Brohm, H.-G. Clerc, M. Fauerbach, J.-J. Gaimard, A. Grewe, E. Hanelt, B. Knödler, M. Steiner, B. Voss, J. Weckenmann, C. Ziegler, A. Magel, H. Wollnik, J. Dufour, Y. Fujita, D. Vieira, and B. Sherrill, Nucl. Instrum. Methods B 70, 286 (1992).
- Ranjan et al. (2011) M. Ranjan, S. Purushothaman, T. Dickel, H. Geissel, W. R. Plaß, D. Schäfer, C. Scheidenberger, J. V. de Walle, H. Weick, and P. Dendooven, Europhys. Lett. 96, 52001 (2011).
- Purushothaman et al. (2013) S. Purushothaman, M. P. Reiter, E. Haettner, P. Dendooven, T. Dickel, H. Geissel, J. Ebert, C. Jesch, W. R. Plaß, M. Ranjan, H. Weick, F. Amjad, S. Ayet San Andrés, M. Diwisch, A. Estrade, F. Farinon, F. Greiner, N. Kalantar-Nayestanaki, R. Knöbel, J. Kurcewicz, J. Lang, I. D. Moore, I. Mukha, C. Nociforo, M. Petrick, M. Pfützner, S. Pietri, A. Prochazka, A.-K. Rink, S. Rinta-Antila, C. Scheidenberger, M. Takechi, Y. K. Tanaka, J. S. Winfield, and M. I. Yavor, Europhys. Lett. 104, 42001 (2013).
- Ranjan et al. (2015) M. Ranjan, P. Dendooven, S. Purushothaman, T. Dickel, M. Reiter, S. Ayet San Andrés, E. Haettner, I. Moore, N. Kalantar-Nayestanaki, H. Geissel, W. Plaß, D. Schäfer, C. Scheidenberger, F. Schreuder, H. Timersma, J. V. de Walle, and H. Weick, Nucl. Instrum. Methods A 770, 87 (2015).
- Reiter (2015) M. P. Reiter, Pilot experiments with relativistic uranium projectile and fission fragments thermalized in a cryogenic gas-filled stopping cell, Ph.D. thesis, Universität Gießen (2015).
- Reiter (2011) M. P. Reiter, Simulation of the cryogenic stopping cell of the FRS Ion Catcher experiment and construction of a novel RFQ beam line system, Master thesis, Universität Gießen (2011).
- Miskun et al. (2015) I. Miskun, M. P. Reiter, A. Rink, T. Dickel, S. Ayet San Andrés, J. Ebert, H. Geissel, F. Greiner, E. Haettner, C. Hornung, W. R. Plaß, S. Purushothaman, and C. Scheidenberger, GSI Sci. Rep. 2014 2015-1, 146 p. (2015).
- Haettner et al. (2018) E. Haettner, W. R. Plaß, U. Czok, T. Dickel, H. Geissel, W. Kinsel, M. Petrick, T. Schäfer, and C. Scheidenberger, Nucl. Inst. Methods A 880 (2018).
- Plaß et al. (2008) W. R. Plaß, T. Dickel, U. Czok, H. Geissel, M. Petrick, K. Reinheimer, C. Scheidenberger, and M. Yavor, Nucl. Instrum. Methods B 266, 4560 (2008).
- Dickel (2010) T. Dickel, Design and Commissioning of an Ultra-High-Resolution Time-of-Flight Based Isobar Separator and Mass Spectrometer, Ph.D. thesis, Universität Gießen (2010).
- Greiner (2013) F. Greiner, Construction and Commissioning of an RFQ switchyard, Bachelor thesis, Universität Gießen (2013).
- Plaß et al. (2015) W. R. Plaß, T. Dickel, S. Ayet San Andrés, J. Ebert, F. Greiner, C. Hornung, C. Jesch, J. Lang, W. Lippert, T. Majoros, D. Short, H. Geissel, E. Haettner, M. P. Reiter, A.-K. Rink, C. Scheidenberger, and M. I. Yavor, Phys. Scr. T166, 014069 (2015).
- Rink (2017) A.-K. Rink, Mass and Life-time Measurement of the 1.7 ms 215-Po Isotope - A Crucial Test of the Novel Concept of the Cryogenic Ion Catcher for the Super-FRS at GSI-FAIR, Ph.D. thesis, Universität Gießen (2017).
- Yavor et al. (2015) M. I. Yavor, W. R. Plaß, T. Dickel, H. Geissel, and S. C., Int. J. Mass Spectrom. 381 - 382, 1 (2015).
- Dickel et al. (2017a) T. Dickel, M. I. Yavor, J. Lang, W. R. Plaß, W. Lippert, H. Geissel, and C. Scheidenberger, Int. J. Mass Spectrom. 412, 1 (2017a).
- Dickel et al. (2015b) T. Dickel, W. R. Plaß, S. Ayet San Andrés, J. Ebert, H. Geissel, E. Haettner, C. Hornung, I. Miskun, S. Pietri, S. Purushothaman, M. P. Reiter, A. K. Rink, C. Scheidenberger, H. Weick, P. Dendooven, M. Diwisch, F. Greiner, F. Heisse, R. Knöbel, W. Lippert, I. D. Moore, I. Pohjalainen, A. Prochazka, M. Ranjan, M. Takechi, J. S. Winfield, and X. Xu, Phys. Lett. B 744, 137 (2015b).
- Jesch (2016) C. Jesch, The multiple-reflection time-of-flight isobar separator for TITAN and direct mass measurements at the FRS Ion Catcher, Ph.D. thesis, Universität Gießen (2016).
- Reiter et al. (2016) M. P. Reiter, A.-K. Rink, T. Dickel, E. Haettner, F. Heiße, W. R. Plaß, S. Purushothaman, F. Amjad, S. Ayet San Andrés, J. Bergmann, D. Blum, P. Dendooven, M. Diwisch, J. Ebert, H. Geissel, F. Greiner, C. Hornung, C. Jesch, N. Kalantar-Nayestanaki, R. Knöbel, J. Lang, W. Lippert, I. Miskun, I. D. Moore, C. Nociforo, M. Petrick, S. Pietri, M. Pfützner, I. Pohjalainen, A. Prochazka, C. Scheidenberger, M. Takechi, Y. K. Tanaka, H. Weick, J. Winfield, and X. Xu, Nucl. Instrum. Methods B 376, 240 (2016).
- (45) K. Blasche, GSI-Rep. GSI-SIS-INT 86-2.
- Geissel et al. (1989) H. Geissel, T. Schwab, P. Armbruster, J. P. Dufour, E. Hanelt, K.-H. Schmidt, B. Sherrill, and G. Münzenberg, Nuclear Instruments and Methods in Physics Research Section A 282, 247 (1989).
- Weick et al. (2000) H. Weick, H. Geissel, C. Scheidenberger, F. Attallah, T. Baumann, D. Cortina, M. Hausmann, B. Lommel, G. Münzenberg, N. Nankov, F. Nickel, T. Radon, H. Schatz, K. Schmidt, J. Stadlmann, K. Sümmerer, M. Winkler, and H. Wollnik, Nucl. Instrum. Methods B 164-165, 168 (2000).
- McLuckey (1992) S. A. McLuckey, J. Am. Soc. Mass Spectr. 3, 599 (1992).
- Schury et al. (2006) P. Schury, G. Bollen, M. Block, D. J. Morrissey, R. Ringle, A. Prinke, J. Savory, S. Schwarz, and T. Sun, Hyperfine Interact. 173, 165 (2006).
- Greiner (2017) F. Greiner, Collision-induced Dissociation - An effective Method for Removing Molecular Contaminants in Beams of short-lived Nuclei, Master thesis, Universität Gießen (2017).
- Dickel et al. (2017b) T. Dickel, W. R. Plaß, W. Lippert, J. Lang, M. I. Yavor, H. Geissel, and C. Scheidenberger, J. Am. Soc. Mass Spectr. 28, 1079 (2017b).
- Wiley and McLaren (1955) W. C. Wiley and I. H. McLaren, Rev. Sci. Instrum. 26, 1150 (1955).
- Bergmann (2018) J. Bergmann, Manuscript in Preparation, Ph.D. thesis, Universität Gießen (2018).
- R Core Team (2017) R Core Team, R: A Language and Environment for Statistical Computing, R Foundation for Statistical Computing, Vienna, Austria (2017).
- Ito et al. (2013) Y. Ito, P. Schury, M. Wada, S. Naimi, T. Sonoda, H. Mita, F. Arai, A. Takamine, K. Okada, A. Ozawa, and H. Wollnik, Phys. Rev. C 88, 011306 (2013).
- Schury et al. (2018) P. Schury, Y. Ito, M. Rosenbusch, H. Miyatake, M. Wada, and H. Wollnik, International Journal of Mass Spectrometry 433, 40 (2018).
- Purushothaman et al. (2017) S. Purushothaman, S. Ayet San Andrés, J. Bergmann, T. Dickel, J. Ebert, H. Geissel, C. Hornung, W. R. Plaß, C. Rappold, C. Scheidenberger, Y. K. Tanaka, and M. I. Yavor, Int. J. Mass Spectrom. 421, 245 (2017).
- Moré (1978) J. J. Moré, in Numerical analysis (Springer, 1978) pp. 105–116.
- Freedman and Diaconis (1981) D. Freedman and P. Diaconis, Z. Wahrscheinlichkeit. 57, 453 (1981).
- Hu and Zidek (2002) F. Hu and J. V. Zidek, Can. J. Stat. 30, 347 (2002).
- Wang et al. (2017) M. Wang, G. Audi, F. G. Kondev, W. J. Huang, S. Naimi, and X. Xu, Chinese Phys. C 41 (2017).
- Ramachandran and Tsokos (2009) K. M. Ramachandran and C. P. Tsokos, Mathematical Statistics with Applications (Elsevier, 2009).
- Manura, D. and Dahl D. (2008) Manura, D. and Dahl D., SIMION® 8.0 User Manual, Scientific Instrument Services Inc, Ringoes, NJ. (2008).
- Audi et al. (2017) G. Audi, F. G. Kondev, M. Wang, W. J. Huang, and S. Naimi, Chinese Phys. C 41, 030001 (2017).
- Birge (1932) R. T. Birge, Phys. Rev. 40, 207 (1932).
- Bowry et al. (2013) M. Bowry, Z. Podolyák, S. Pietri, J. Kurcewicz, M. Bunce, P. H. Regan, F. Farinon, H. Geissel, C. Nociforo, A. Prochazka, H. Weick, N. Al-Dahan, N. Alkhomashi, P. R. P. Allegro, J. Benlliure, G. Benzoni, P. Boutachkov, A. M. Bruce, A. M. Denis Bacelar, G. F. Farrelly, J. Gerl, M. Górska, A. Gottardo, J. Grebosz, N. Gregor, R. Janik, R. Knöbel, I. Kojouharov, T. Kubo, N. Kurz, Y. A. Litvinov, E. Merchan, I. Mukha, F. Naqvi, B. Pfeiffer, M. Pfützner, W. Plaß, M. Pomorski, B. Riese, M. V. Ricciardi, K.-H. Schmidt, H. Schaffner, C. Scheidenberger, E. C. Simpson, B. Sitar, P. Spiller, J. Stadlmann, P. Strmen, B. Sun, I. Tanihata, S. Terashima, J. J. Valiente Dobón, J. S. Winfield, H.-J. Wollersheim, and P. J. Woods, Phys. Rev. C 88, 024611 (2013).
- Rakopoulos et al. (2018) V. Rakopoulos, M. Lantz, A. Solders, A. Al-Adili, A. Mattera, L. Canete, T. Eronen, D. Gorelov, A. Jokinen, A. Kankainen, V. S. Kolhinen, I. D. Moore, D. A. Nesterenko, H. Penttilä, I. Pohjalainen, S. Rinta-Antila, V. Simutkin, M. Vilén, A. Voss, and S. Pomp, Phys. Rev. C 98, 024612 (2018).
- Kerek et al. (1972) A. Kerek, G. Holm, S. Borg, and L.-E. de Geer, Nuclear Physics A 195, 177 (1972).
- Kankainen et al. (2013) A. Kankainen, J. Hakala, T. Eronen, D. Gorelov, A. Jokinen, V. S. Kolhinen, I. D. Moore, H. Penttilä, S. Rinta-Antila, J. Rissanen, A. Saastamoinen, V. Sonnenschein, and J. Äystö, Phys. Rev. C 87, 024307 (2013).
- Siegl et al. (2018) K. Siegl, K. Kolos, N. D. Scielzo, A. Aprahamian, G. Savard, M. T. Burkey, M. P. Carpenter, P. Chowdhury, J. A. Clark, P. Copp, G. J. Lane, C. J. Lister, S. T. Marley, E. A. McCutchan, A. J. Mitchell, J. Rohrer, M. L. Smith, and S. Zhu, Phys. Rev. C 98, 054307 (2018).
- Jain et al. (2015) A. K. Jain, B. Maheshwari, S. Garg, M. Patial, and B. Singh, Nucl. Data Sheets 128, 1 (2015).
- Rosenbusch et al. (2018) M. Rosenbusch, Y. Ito, P. Schury, M. Wada, D. Kaji, K. Morimoto, H. Haba, S. Kimura, H. Koura, M. MacCormick, H. Miyatake, J. Y. Moon, K. Morita, I. Murray, T. Niwase, A. Ozawa, M. Reponen, A. Takamine, T. Tanaka, and H. Wollnik, arXiv preprint arXiv:1801.02823 (2018).
- Momyer et al. (1955) F. F. Momyer, F. Asaro, and E. K. Hyde, J. Inorg. Nucl. Chem. 1, 267 (1955).
- Golovkov et al. (1971) N. A. Golovkov, R. B. Ivanov, A. Kolachkovski, Y. V. Norseev, and V. G. Chumin, decay of neutron-deficient radon isotopes, Tech. Rep. (Joint Inst. for Nuclear Research, Dubna (USSR). Lab. of Nuclear Problems, 1971).
- Valli et al. (1967) K. Valli, E. Hyde, and W. Treytl, J. Inorg. Nucl. Chem. 29, 2503 (1967).
- Valli et al. (1970) K. Valli, E. K. Hyde, and J. Borggreen, Phys. Rev. C 1, 2115 (1970).
- Bowman et al. (1982) J. D. Bowman, R. E. Eppley, and E. K. Hyde, Phys. Rev. C 25, 941 (1982).
- Asaro and Perlman (1956) F. Asaro and I. Perlman, Phys. Rev. 104, 91 (1956).
- Jentschke et al. (1954) W. Jentschke, A. C. Juveland, and G. H. Kinsey, Phys. Rev. 96, 231 (1954).
- Walen et al. (1962) R. J. Walen, V. Nedovessov, and G. Bastin-Scoffier, Nucl. Phys. 35, 232 (1962).
- Kurcewicz et al. (2007) J. Kurcewicz, W. Czarnacki, M. Karny, M. Kasztelan, M. Kisielinski, A. Korgul, W. Kurcewicz, J. Kurpeta, S. Lewandowski, P. Majorkiewicz, H. Penttila, A. Plochocki, B. Roussiere, O. Steczkiewicz, and A. Wojtasiewicz, Phys. Rev. C 76 (2007).
- Wojtasiewicz et al. (2009) A. Wojtasiewicz, W. Czarnacki, M. Kasztelan, M. Kisielinski, A. Korgul, J. Kurcewicz, W. Kurcewicz, S. Lewandowski, S. Mianowski, A. Plochocki, B. Roussiere, and O. Steczkiewicz, Search for -decaying isomers in trans-lead isotopes using the IGISOL device, Tech. Rep. B-10 (University of Warsaw Heavy Ion Laboratory, 2009) annual Report 2008.
- Vorob’ev et al. (1960) A. A. Vorob’ev, A. P. Komar, and V. A. Korolev, Zhur. Eksptl’. i Teoret. Fiz. 39 (1960).
- Oganessian (2001) Y. Oganessian, Nature 413, 122 (2001).
- Muenzenberg (2015) G. Muenzenberg, NUCLEAR PHYSICS A 944, 5 (2015).
- Sobiczewski and Litvinov (2014) A. Sobiczewski and Y. A. Litvinov, Phys. Rev. C 89, 024311 (2014).
- Myers and Swiatecki (1996) W. Myers and W. Swiatecki, Nuclear Physics A 601, 141 (1996).
- Goriely et al. (2013) S. Goriely, N. Chamel, and J. M. Pearson, Physical Review C 88, 024308 (2013).
- Kortelainen et al. (2010) M. Kortelainen, T. Lesinski, J. Moré, W. Nazarewicz, J. Sarich, N. Schunck, M. Stoitsov, and S. Wild, Physical Review C 82, 024313 (2010).
- Hornung et al. (2018) C. Hornung, D. Amanbayev, S. Ayet San Andrés, J. Bergmann, T. Dickel, H. Geissel, F. Greiner, L. Gröf, W. R. Plaß, A.-K. Rink, and C. Scheidenberger, GSI Sci. Rep. 2018-1 (2018).
- Bergmann et al. (2018) J. Bergmann, S. Ayet San Andrés, S. Beck, and T. Dickel, Internal Report (2018).
- Pietri et al. (2018) S. Pietri, A. M. Bruce, T. Grahn, W. R. Plaß, C. Scheidenberger, T. Dickel, A. Kelić-Heil, H. Geissel, H. Weick, F. Ameil, T. Arici, L. Audouin, S. Ayet San Andrés, J. Aysto, S. Bagchi, M. Bai, S. B. J. Benlliure, G. Benzoni, C. Bruno, D. Cortina, T. Davisson, J. Gerl, M. Górska, F. Greiner, E. Haettner, O. Hall, L. H. Brennan, A. Heinz, A. Helert, C. Hornung, J. Hucka, A. Jokinen, A. Kankainen, D. Kahl, B. Kindler, I. Kojuharov, D. Kostyleva, N. Kuzminchuk, M. Labiche, C. L. Woods, B. Lomme, G. Matinez Pinedo, I. Miskun, G. Münzenberg, I. Mukha, R. Page, M. Pfützner, Z. Podolyak, A. Prochazka, S. Purushothaman, C. Rappold, P. Regan, M. V. Ricciardi, S. R. Antila, S. Saha, T. Saito, H. Schaffner, F. Schirru, J. Simpson, H. Simon, P. Spiller, J. Stadlmann, J. Taieb, Y. Tanaka, I. Tanihata, J. Vesic, B. Voss, P. M. Walker, P. J. Woods, J. Winfield, and M. Winkler, GSI Sci. Rep. 2018-1 (2018).
- Plaß et al. (2018) W. R. Plaß, T. Dickel, S. Ayet San Andrés, S. Bagchi, D. Balabanski, S. Beck, P. Constantin, T. Eronen, H. Geissel, F. Greiner, E. Haettner, C. Hornung, A. Jokinen, A. Kankainen, D. Kostyleva, N. Kuzminchuk, B. Kindler, B. Lommel, I. Mardor, I. Moore, I. Miskun, I. Mukha, G. Münzenberg, Z. Patyk, E. Piasetzky, S. Pietri, I. Pomerantz, A. Prochazka, S. Purushothaman, C. Rappold, R. Sami, T. Saito, C. Scheidenberger, H. Weick, J. Winfield, and J. Äystö, GSI Sci. Rep. 2018-1 (2018).
- Mardor et al. (2018) I. Mardor, T. Dickel, S. Ayet San Andrés, S. Bagchi, S. Beck, H. Geissel, F. Greiner, E. Haettner, C. Hornung, D. Kostyleva, N. Kuzminchuk, B. Kindler, B. Lommel, G. Martinez Pinedo, I. Miskun, I. Mukha, E. Piasetzky, S. Pietri, W. Plaß, I. Pomerantz, A. Prochazka, S. Purushothaman, C. Rappold, T. Saito, C. Scheidenberger, Y. Tanaka, H. Weick, and J. Winfield, GSI Sci. Rep. 2018-1 (2018).
- Dickel et al. (2018) T. Dickel, P. Constantin, J. Winfield, S. Ayet San Andrés, S. Bagchi, D. Balabanski, S. Beck, H. Geissel, F. Greiner, E. Haettner, C. Hornung, S. Heinz, A. Kankainen, A. Karpov, D. Kostyleva, N. Kuzminchuk, B. Kindler, B. Lommel, I. Mardor, G. Martinez Pinedo, I. Miskun, I. Mukha, G. Münzenberg, Z. Patyk, E. Piasetzky, S. Pietri, W. R. Plaß, I. Pomerantz, A. Prochazka, S. Purushothaman, C. Rappold, T. Saito, V. Saiko, C. Scheidenberger, and H. Weick, GSI Sci. Rep. 2018-1 (2018).