copyrightbox
Multi-Tier Buffer Management and Storage System Design for Non-Volatile Memory
Abstract.
The design of the buffer manager in database management systems (DBMSs) is influenced by the performance characteristics of volatile memory (DRAM) and non-volatile storage (e.g., SSD). The key design assumptions have been that the data must be migrated to DRAM for the DBMS to operate on it and that storage is orders of magnitude slower than DRAM. But the arrival of new non-volatile memory (NVM) technologies that are nearly as fast as DRAM invalidates these previous assumptions.
This paper presents techniques for managing and designing a multi-tier storage hierarchy comprising of DRAM, NVM, and SSD. Our main technical contributions are a multi-tier buffer manager and a storage system designer that leverage the characteristics of NVM. We propose a set of optimizations for maximizing the utility of data migration between different devices in the storage hierarchy. We demonstrate that these optimizations have to be tailored based on device and workload characteristics. Given this, we present a technique for adapting these optimizations to achieve a near-optimal buffer management policy for an arbitrary workload and storage hierarchy without requiring any manual tuning. We finally present a recommendation system for designing a multi-tier storage hierarchy for a target workload and system cost budget. Our results show that the NVM-aware buffer manager and storage system designer improve throughput and reduce system cost across different transaction and analytical processing workloads.
1. Introduction
The buffer manager in a DBMS provides access to data stored on non-volatile storage (e.g., SSD) by bringing them into volatile memory (DRAM) when they are needed. The canonical approaches for buffer management in DBMSs are predicated on the assumptions that (1) the data must be copied to DRAM for the DBMS to operate on it, and (2) storage is orders of magnitude slower than DRAM (Hellerstein et al., 2007; Ramakrishnan and Gehrke, 2003; Bernstein et al., 1986). But emerging non-volatile memory (NVM) technologies upend these design assumptions.
NVM is a broad class of memory technologies, including phase-change memory (Cutress and Tallis, 2018; int, 2017, 2015; Raoux et al., 2008) and memristors (hpe, 2017; Strukov et al., 2008)111Intel is shipping Optane DIMMs that bring NVM onto the DDR4 memory bus since mid 2018 (Cutress and Tallis, 2018).. NVM devices support low latency reads and writes similar to DRAM, but with persistent writes and large storage capacity like an SSD. The traditional approaches for buffer management are incompatible with this new hardware landscape. This stems from two differences between NVM and canonical storage technologies. First, to process disk-resident data, the buffer manager must copy it to DRAM before the DBMS can perform any operations. In contrast, the CPU can directly operate on NVM-resident data. Second, NVM shrinks the performance gap between volatile and non-volatile devices.
In this paper, we present techniques for managing and designing a multi-tier storage hierarchy comprising of DRAM, NVM, and SSD 222First-generation NVM devices are expected to be slower (and less expensive) than DRAM and, at the same time, faster (but more expensive) than SSD (int, 2017). To maximize performance and minimize cost of the storage system, NVM will likely co-exist with DRAM and SSD.. We propose a set of optimizations for maximizing the utility of data migration between different devices in the storage hierarchy. These optimizations are enabled by the introduction of NVM. For example, since the DBMS can directly operate on NVM-resident data, the buffer manager need not eagerly copy data from NVM to DRAM. Our results show that such a lazy data migration technique ensures that only frequently referenced data is promoted to DRAM.
Recent research has focused on optimizing the buffer management policy for a particular NVM technology and storage hierarchy. Renen et al. present a multi-tier buffer manager that eagerly migrates data from SSD to DRAM (van Renen et. al., 2018). When a page is evicted from DRAM, the buffer manager admits it into the NVM buffer based on whether it was recently accessed. Kwon et al. present a multi-tier file-system that does not cache NVM-resident data on DRAM and bypasses DRAM while performing synchronous write operations (Kwon et al., 2017). Although these buffer management policies work well in their target environment, they do not generalize to other NVM technologies, storage hierarchies, and workloads.
We address this problem by introducing a taxonomy for data migration optimizations that subsumes the specific techniques employed in previous systems. We illustrate that the buffer management policy must be tailored based on device and workload characteristics. Given this, we make the case for an adaptation mechanism in the buffer manager, called adaptive data migration, that achieves a near-optimal buffer management policy for an arbitrary workload and storage hierarchy without requiring any manual tuning. Prior research on NVM-aware storage management has not tackled the problem of designing a multi-tier storage system for a target workload and system cost budget (Oukid et al., 2014; Kimura, 2015; Eisenman et al., 2018; van Renen et. al., 2018; Kwon et al., 2017; Arulraj et al., 2015). We present a storage system recommender to address this problem. In summary, we make the following contributions:
-
We introduce a taxonomy for NVM-aware data migration optimizations and present a policy for managing a multi-tier storage hierarchy (Section 3).
-
We introduce an adaptation mechanism in the buffer manager that achieves a near-optimal policy for an arbitrary workload and storage hierarchy without requiring any manual tuning (Section 4).
-
We introduce a recommendation system for designing a multi-tier storage hierarchy for a target workload and system cost budget (Section 5).
-
We demonstrate that the NVM-aware buffer manager and storage system designer improve throughput and reduce cost across different transaction and analytical processing workloads (Section 6).
2. Background
We now provide an overview of buffer management in DBMSs. We then make the case for the introduction of NVM in the storage hierarchy.
2.1. Buffer Management
The buffer manager partitions the available memory into a set of fixed-size slots, which is collectively termed as a buffer. The higher-level components of the DBMS, such as the query execution engine, need not concern themselves with whether a page is in the buffer or not. They only need to request the buffer manager to retrieve a page. If a page requested by another component is not present in the buffer, the buffer manager transparently retrieves the page from non-volatile storage.
The buffer manager maintains transient meta-data about each page in the in-memory buffer. This meta-data includes the number of active references made to the page and whether the page has been modified since it was brought into the buffer from storage. If a page requested by another component is already present in the buffer, then it increments the number of active references to the page and returns the address of the slot containing the page. Otherwise, the buffer manager chooses a slot for replacement based on the replacement policy (e.g., least recently used) (O’Neil et al., 1993). If the page selected for replacement contains any modifications, the buffer manager propagates those changes to the corresponding page on non-volatile storage. It then copies the requested page from storage into the replacement slot and returns the slot’s address.
The buffer manager does not have complete autonomy over when and what pages are flushed to non-volatile storage (Agrawal and Jagadish, ; Franklin, 1997). It coordinates with the DBMS’s log manager to ensure that the changes made by a transaction are durable when it is committed, and that the changes made by transactions that were not committed at the time of a system failure are reversed during recovery. These constraints are referred to as the durability and failure atomicity properties.
If a transaction modifies a block and then commits, and the buffer manager has not yet written the updated block to durable storage, then a failure will leave the block in its old invalid state, thereby violating the durability property. On the other hand, if the buffer manager decides to write a modified block belonging to an active transaction, it violates the atomicity property. To prevent such scenarios, the buffer manager refrains from making autonomous replacement decisions.
Since the contents of the DRAM buffer are lost after a system failure, the log manager records information needed to recover from a failure on durable storage. Before updating a page, the DBMS writes its old contents to the log (i.e., the before image of the page). Similarly, when a page is about to be evicted from the buffer pool, its current contents are recorded in the log (i.e., the after image of the page). During recovery, the DBMS uses the information in the log to restore the database to a transactionally consistent state. To bound the amount of time taken to replay the log during recovery, the DBMS periodically takes checkpoints at runtime (Mohan et al., 1992).
| DRAM | PCM | RRAM | SSD | HDD | |
|---|---|---|---|---|---|
| Read latency | 50 ns | 50 ns | 100 ns | 25 s | 10 ms |
| Write latency | 50 ns | 200 ns | 100 ns | 300 s | 10 ms |
| Bandwidth | 60 GB/s | 10 GB/s | 10 GB/s | 1 GB/s | 0.1 GB/s |
| $/GB | 10 | 1 | 1 | 0.2 | 0.02 |
| Persistent | No | Yes | Yes | Yes | Yes |
| Endurance |
2.2. Non-Volatile Memory DBMSs
A DBMS’s performance is constrained by the speed with which it can retrieve data from and persist data (e.g., pages containing log records) on disk (Harizopoulos et al., 2008). As illustrated in Figure 1a, the buffer manager copies pages from SSD to DRAM for the DBMS to operate on them. Since DRAM accesses are 100 faster than SSD operations, DBMSs manage a large buffer pool on DRAM. It is difficult, however, to deploy high-capacity DRAM systems due to three factors. First, it drives up the total cost of the system since it is 50 more expensive than secondary storage technologies. Second, increasing DRAM capacity raises the total system power consumption. Lefurgy et al. report that as much as 40% of the total system energy is consumed by DRAM in commercial servers (Lefurgy et al., 2003). Lastly, DRAM scaling faces significant challenges due to limitations in scaling techniques used in earlier generations for transistors and capacitors (Mandelman et al., ).
Emerging NVM technologies bridge the performance and cost differentials between DRAM and SSD. Table 1 compares the characteristics of candidate NVM technologies. NVM latency is within an order of magnitude higher than that of DRAM. Unlike SSDs/HDDs that use the SAS or SATA interfaces, NVM can be plugged into DIMM slots to deliver higher bandwidths and lower latencies to CPUs.
NVM supports higher data density than DRAM due to its intrinsic device characteristics333For example, phase-change memory (PCM) is a NVM technology that exploits the ability of chalcogenide glass to oscillate between amorphous and crystalline states when heated using electrical pulses (Raoux et al., 2008). A PCM cell can exist in different degrees of partial crystallization, thereby enabling more than one bit to be stored in each cell.. It is, therefore, less expensive than DRAM. Similar to SSDs, the number of write cycles per bit is limited in NVM technologies. Reducing the number of writes using an NVM-aware buffer management policy extends the lifetime of devices with limited write-endurance.
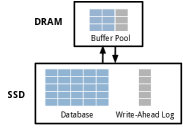
Since NVM devices are slower than DRAM, replacing the latter with a similarly priced NVM device with higher capacity can reduce the performance of the DBMS. This architecture, as illustrated in Figure 1b, delivers performance comparable to that of a DRAM-SSD hierarchy only if NVM latency is less than 2 that of DRAM (Section 6.7).
A multi-tier storage hierarchy with DRAM, NVM, and SSD, as shown in Figure 1c, can simultaneously maximize performance and minimize cost of the storage system. The reasons for this are twofold. First, the NVM buffer caches a significant fraction of the working set, thereby reducing SSD accesses. Second, the DRAM buffer serves as a cache on top of NVM and only stores the hottest pages in the database.
In a DRAM-SSD hierarchy, the buffer manager decides what pages to move between disk and memory and when to move them. With a DRAM-NVM-SSD system, however, in addition to deciding what/when data should be migrated, it must also decide where to move them (i.e., what storage tier). In the next section, we discuss how this decision is influenced by the characteristics of NVM.
3. NVM-Aware Buffer Management
NVM introduces new data flow paths in the storage hierarchy. By leveraging these additional options, the buffer manager reduces data movement between different tiers and minimizes the number of writes to NVM. The former results in improving the DBMS’s performance, while the latter extends the lifetime of NVM devices with limited write-endurance (Raoux et al., 2008).
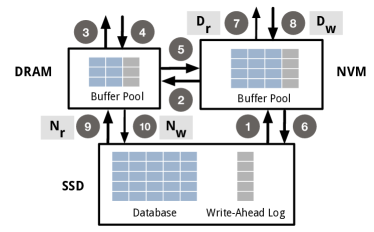
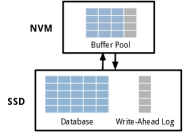
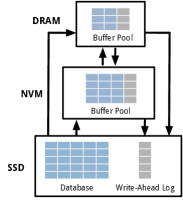
Figure 2 presents the data flow paths in the multi-tier storage hierarchy. The default read path comprises of three steps: moving data from SSD to NVM (➊), then to DRAM (➋), and lastly to the processor cache (➌). Similarly, the default write path consists of three steps: moving data from processor cache to DRAM (➍), then to NVM (➎), and finally to SSD (➏). We now describe how the buffer manager leverages the additional data flow paths in Figure 2 (➐,➑,➒,➓) to minimize the performance impact of NVM and to extend the lifetime of the NVM device.
3.1. Bypass DRAM during Reads
Unlike SSDs, the processor can directly access data on NVM via read operations (➐). To access a block on SSD, in a disk-centric DBMS, the DBMS copies it over to DRAM (➒), before it can operate on the copied data. With NVM, the buffer manager can leverage this new data flow path to lazily migrate data from NVM to DRAM while serving read operations.
Let represent the probability that the buffer manager copies data to DRAM during read operations. With existing storage technologies, = 1. We refer to this data migration policy as eager migration. With NVM, the buffer manager can employ a wider range of lazy migration policies with smaller values for . Such policies reduce upward data migration between NVM and DRAM during read operations. They are beneficial when the capacity of DRAM is smaller than that of NVM. A lazy migration strategy ensures that colder data (i.e., data that has not been frequently accessed) on NVM do not evict hotter data in DRAM.
The optimal value of depends on the application’s workload. An eager migration policy ( 0.5) works well if the working set fits within the DRAM buffer. A lazier policy would delay the promotion of data to DRAM, thereby increasing the impact of NVM latency on performance. However, a migration policy with higher works well if the working set does not fit in DRAM and fits in the NVM buffer. This strategy ensures that only the hot data is stored in DRAM.
In addition to the size of the working set, depends on the ratio between the capacities of the DRAM and NVM buffers. In a storage hierarchy where the ratio approaches one, a more eager policy enables the buffer manager to leverage the space available in DRAM. Smaller values for work well when the ratio approaches zero since they ensure that the DRAM buffer only contains frequently referenced data.
With the eager migration policy, the buffer manager always brings the block to DRAM while serving the read operation. Consequently, if the application then updates the same block, the writes are performed on DRAM. In contrast, a lazy migration policy increases the number of writes on NVM. This is because it is more likely that the block being updated is residing on NVM when the buffer manager adopts such a policy. This is not a problem for DBMS applications with skewed access patterns (Beaver et al., 2010; Sikka et al., 2012). Such applications tend to modify hot data that is cached in DRAM even when the buffer manager employs a lazy migration policy.
3.2. Bypass DRAM during Writes
Ensuring the persistence of pages containing log and checkpoint records is critical for the recoverability of the DBMS as we discussed in Section 2.1. The DBMS’s performance is constrained by the I/O overhead associated with persisting these pages on non-volatile storage. As transactions tend to generate multiple log records that are each small in size, most DBMSs use the group commit optimization to reduce this I/O overhead (DeWitt et al., 1984). The DBMS first batches the log records for a group of transactions in the DRAM buffer (➍) and then flushes them together with a single write to SSD (➏). This improves the operational throughput and amortizes the I/O overhead across multiple transactions.
Unlike SSDs, the CPU can directly persist data on NVM via write operations (➑). The buffer manager leverages this path to provide synchronous persistence with lower overhead (Arulraj et al., 2017; Kwon et al., 2017). The write operation bypasses DRAM since the data must be eventually persisted, and this data migration optimization shrinks the overall latency of the operation, especially on NVM devices whose write latencies are comparable to that of DRAM. In addition to eliminating the redundant write to DRAM, it also avoids potential eviction of other hot pages from the DRAM buffer.
Let represent the probability with which the buffer manager copies data into DRAM during write operations. With canonical storage technologies, similar to , = 1. With NVM, the buffer manager can employ lazy migration policies with smaller . Such policies reduce the frequency of downward data migration to DRAM during write operations thereby ensuring that pages containing log and checkpoint records do not evict hotter data in DRAM.
3.3. Bypass NVM During Reads
The data migration optimizations presented in Sections 3.1 and 3.2 improve the performance of the DBMS at the expense of increasing the number of writes to NVM. We next present optimizations for reducing the number of writes to NVM using alternate data flow paths.
The default read path consists of moving the data from SSD to NVM (➊) and eventually migrating it to DRAM (➋). This optimization makes use of the direct data flow path from SSD to DRAM (➒). When the buffer manager observes that a requested page is not present in both the DRAM and NVM buffers, it copies the data on SSD directly to DRAM, thus bypassing NVM during read operations. If the data read into the DRAM buffer is not subsequently modified, and is selected for replacement, then the buffer manager discards it. If the page is modified and later selected for eviction from DRAM, the buffer manager considers admitting it to NVM (➎).
Let represent the probability with which the buffer manager copies data from SSD to NVM during read operations. With the default read path, = 1. When a page is fetched from SSD and later evicted from DRAM, an eager policy necessitates two writes to NVM: once at fetch time and again when the page is evicted from DRAM. With a lazy policy (i.e., smaller ), the buffer manager installs a copy of a modified page on NVM only after it has been evicted from DRAM. This eliminates the first write to NVM when the page is fetched from SSD.
3.4. Bypass NVM During Writes
Another data migration optimization for reducing the number of writes to NVM consists of bypassing NVM while serving write operations. The default write path consists of moving the data from DRAM to NVM (➎) and then eventually migrating it to SSD (➏). Instead of using the default path, this optimization makes use of the direct data flow path from DRAM to SSD (➓).
By bypassing NVM during writes, the buffer manager ensures that only pages frequently swapped out of DRAM are stored on NVM (van Renen et. al., 2018). This optimization reduces the number of writes to NVM since only warmer pages identified by the buffer manager are stored in the NVM buffer. If the buffer manager employs an eager policy while reading data into DRAM (i.e., high ), this optimization prevents colder DRAM-resident pages from polluting the NVM buffer.
Let represent the probability with which the buffer manager copies data from DRAM to NVM during write operations. With the default write path, = 1. Lower values of reduce downward data migration into NVM. Such a lazy policy is beneficial when the capacity of DRAM is comparable to that of NVM since it ensures that colder data on DRAM does not evict warmer data in the NVM buffer.
4. Adaptive Data Migration
The data migration policy consists of the probabilities with which the buffer manager bypasses DRAM and NVM while serving read and write operations (Sections 3.1, 3.2, 3.3 and 3.4). All of the above data migration optimizations are moot unless the buffer manager can effectively adapt the overall policy based on the characteristics of the workload and the storage hierarchy. We now present an adaptation mechanism in the buffer manager that achieves a near-optimal policy for an arbitrary workload and storage hierarchy without requiring any manual tuning.
The crux of our approach is to track the target metrics on recent query workload at runtime, and then periodically adapt the policy in the background. Over time, this process automatically optimizes the policy for the application’s workload and the storage hierarchy, and amortizes the adaptation cost across multiple queries. We now describe the information that the buffer manager collects to guide this process.
The buffer manager keeps track of two target metrics while executing the workload. These include the operational throughput of the buffer manager and the number of write operations performed on NVM. The goal is to determine the optimal configuration of the data migration policies that maximizes the throughput and minimizes writes to NVM. The cost function associated with a candidate data migration policy configuration consists of two weighted components associated with these target metrics.
To adapt the buffer manager’s data migration policy, we employ an iterative search method called simulated annealing (SA) (Kirkpatrick et al., 1983). This technique searches for a policy configuration that maximizes the cost function presented. An attractive feature of SA is that it avoids getting caught at local optima, which are configurations that are better than any other nearby configurations, but are not the globally optimal configuration (Ioannidis and Wong, 1987). It is a probabilistic hill climbing algorithm that migrates through a set of local optima in search of the global extremum.
SA consists of two stochastic processes for generating candidate policy configurations and for accepting a new configuration. Algorithm 1 presents the algorithm for tuning the data migration policy using SA. At each time step, SA randomly selects a new configuration () close to the current one (). It then evaluates the cost of that configuration (). Lastly, it decides to accept the configuration or stay with based on whether the cost of is lower or higher than that of the current configuration. If is better than , then it immediately transitions to . Otherwise, it randomly accepts the new configuration with higher cost () based on the Boltzmann acceptance probability factor.
SA is theoretically guaranteed to reach the global optima with high probability. The control parameter determines the magnitude of the perturbations of the energy function . SA gradually decreases over time. During the initial steps of SA, at high temperatures, the probability of uphill moves in the energy function (E ¿ 0) is large. Despite temporarily increasing the energy, such non-beneficial downhill steps (E ¡ 0) allows for a more extensive search for the global optimal configuration. Over time, SA reduces the temperature. This gradual cooling mechanism corresponds to slowly decreasing the probability of accepting worse configurations as it explores the configuration state space.
5. Storage Hierarchy Selection
We have so far focused on identifying an optimal data migration policy configuration for a particular workload given a storage hierarchy. The tuning algorithm presented in Section 4 assumes that we have already provisioned a multi-tier storage hierarchy that is a good fit for the workload. It is unclear, however, how to select such a hierarchy for a particular workload given a system cost constraint.
In this section, we formulate an analytical model of a hierarchical storage system to improve the intuition behind provisioning a multi-tier storage hierarchy. We then identify the limitation of the model and present a recommender system that addresses them.
5.1. Hierarchical Storage System Model
We can model the multi-tier storage system as a linear hierarchy with levels, , ,, . The performance of a particular level in the hierarchy is determined by two factors: the average access time and the device capacity (Jacob et al., 1996). We assume that a copy of all blocks in level exists in every level greater than (i.e., in all lower levels in the hierarchy). The maximum information that can be stored in the system is equal to the capacity of the lowest level , since copies of all blocks stored in the higher levels of the system must be present in .
We can characterize the performance impact of the device capacity at a particular level by the probability of finding the requested data block in that level. This is termed as the hit ratio . is a monotonically increasing function with respect to device capacity . Let the cost per storage unit (e.g., per GB) of the device technology used at a particular level be given by the cost function . It decreases monotonically with respect to the access time of the device technology.
Since a copy of all data blocks at level exists in every level greater than , the probability of a hit in level and misses in the higher levels, is given by:
Here, represents the relative number of successful data accesses at level in the storage hierarchy. The effective average access time per block request, is then given by:
To maximize the operational throughput of the DBMS, we need to minimize
subject to storage system cost constraints. Given a storage system
cost budget , the goal is to select the device technology and
determine the device capacity for each level in the storage hierarchy.
We formulate this problem as follows:
Minimize:
Subject to the storage system cost budget:
5.2. Storage Hierarchy Recommender System
is a function of the workload locality and does not have a closed-form expression. We circumvent this limitation by developing a recommender system that measures the actual throughput on a target workload across candidate storage hierarchies to identify the optimal system. The goal of the recommender system is to identify a multi-tier storage hierarchy consisting of DRAM, NVM, and/or SSD that maximizes a user-defined objective function given a system cost budget.
The recommender system searches across candidate storage hierarchies that meet the user-specified budget. Let represent the set of candidate DRAM devices, the set of candidate NVM devices, and the set of candidate SSD devices. These devices have varying capacities and costs. We are provided with a cost function that returns the cost of a particular device. For instance, returns the cost of the DRAM device with capacity .
We can prune the set of candidate storage hierarchies by only considering devices whose capacities are powers of two. With this restriction, the size of set of candidate storage hierarchies is small (, , and ¡ 10). The recommender system does a pure grid search over the entire set (Bergstra and Bengio, 2012). During a particular trial on a grid, we only consider device triples that meet the user-specified budget , as given by:
The system then measures the operational throughput on the storage hierarchy corresponding to the device triple . We configure to model storage hierarchies containing only NVM and SSD devices (i.e., those that do not have DRAM). Similarly, we set and to model storage hierarchies without NVM and SSD, respectively. We note that the entire database must fit in the lowest level of storage hierarchy. Since the cost of NVM is 10 higher than that of SSD, the latter device will likely continue to occupy the lowest level.
6. Experimental Evaluation
In this section, we present an analysis of the proposed NVM-aware buffer management policies and the storage hierarchy recommendation system. Our goal is to demonstrate that:
-
NVM improves throughput by reducing accesses to canonical storage devices due to its higher capacity-cost ratio compared to DRAM (Section 6.4).
-
The selection of a data migration policy depends on the runtime performance requirements, write endurance characteristics of NVM, and the relative size of the DRAM buffer compared to NVM (Section 6.5).
-
Tuning the buffer management policy for the workload and the storage hierarchy improves throughput and extends the lifetime of the NVM device (Section 6.6).
-
The selection of a multi-tier storage hierarchy for a given workload depends on the working set size, the frequency of persistent writes, the system cost budget, and the performance and cost characteristics of NVM (Section 6.7).
-
A combination of data migration optimizations presented in Section 3 outperforms the state-of-the-art buffer management policy (Section 6.8).
6.1. Trace-Driven Buffer Manager
We developed a trace-driven buffer manager to evaluate different storage hierarchy designs and data migration policies. We gather traces from a real DBMS by running OLTP, OLAP, and HTAP workloads. The trace contains information about individual buffer pool operations.
At the beginning of the trace period, we take a snapshot of the DBMS’s meta-data regarding the blocks stored in memory and on storage. This snapshot does not contain any user data. The buffer manager only simulates the movement of user data blocks and not their actual contents. This allows us to effectively run simulations of buffer management operations on large databases and devices.
The buffer manager runs on top of a multi-tier storage hierarchy consisting of DRAM, NVM, and/or SSD. For instance, in case of a three-tier DRAM-NVM-SSD hierarchy, it maintains two buffer pools on DRAM and NVM. While processing the trace requests, the buffer manager issues read and write operations to the appropriate devices depending on the data migration policy. The simulator models the physical contiguity of the user-data blocks while distributing the I/O operations across the device.
We conduct our experiments on a NVM hardware emulator. Existing NVM devices cannot store large databases due to their limited capacities and prohibitive costs. We instead use the persistent memory evaluation platform (PMEP) developed by Intel Labs (Dulloor et al., 2014; Zhang et al., 2015). PMEP models the latency and bandwidth characteristics of upcoming NVM technologies. It allows us to tune the memory read and write latencies and bandwidths. This enables us to evaluate multiple NVM device profiles that are not specific to a particular technology. A detailed description of PMEP is provided in Appendix A.
6.2. Experimental Setup
We perform our experiments by running the trace-driven buffer manager on the NVM hardware emulator. By default, we set the capacity of the DRAM and NVM buffers to be 2 GB and 128 GB, respectively. Unless otherwise stated, we configured the NVM latency to be 2 that of DRAM and validated these settings using Intel’s memory latency checker. The emulator’s storage hierarchy also includes two additional devices:
-
HDD: Seagate Barracuda (3 TB, 7200 RPM, SATA 3.0)
-
SSD: Intel DC S3700 (400 GB, SATA 2.6)
Workloads
We next describe the workloads from the OLTP-Bench testbed that we use in our
evaluation (olt, ; Difallah et al., 2013). These workloads differ in their workload
skews and frequencies of persistent writes.
TPC-C:
This benchmark is the industry standard for evaluating the performance of OLTP
systems (The Transaction Processing Council, 2007). It simulates an order-entry application of a wholesale
supplier and consists of five transaction types with nine tables.
Voter:
This is an OLTP benchmark that simulates a phone-based election application. It
is derived from the software system used to record votes for a television talent show.
The workload consists of short-lived transactions that each update a small
number of tuples.
CH-benCHmark:
This is a complex HTAP workload that is derived from a transactional workload
based on the order entry processing of TPC-C and a corresponding
TPC-H-equivalent OLAP query suite. It is useful to evaluate DBMSs designed to
serve both OLTP and OLAP workloads. CH-benCHmark extends the TPC-C benchmark with 22 additional analytical queries.
AuctionMark:
This is an OLTP benchmark that models the workload characteristics of an on-line
auction site (Angkanawaraphan and Pavlo, ).
The user-to-item ratio follows a highly skewed Zipfian distribution.
The total number of transactions that target each item is temporally skewed, as
items receive more activity as the auction approaches its closing.
Trace Collection We collect traces by running the benchmarks on an instrumented fork of Postgres DBMS (v9.4) (pos, ). All the transactions execute with the same serializable isolation level and durability guarantees. To collect the traces, we first ran each benchmark for a warm-up period. At the end of the warm-up period, we take a snapshot of the DBMS’s meta-data regarding the location of blocks in volatile memory and on durable storage. We then start recording the buffer pool references in the trace. During simulation, the buffer manager first loads the snapshot before executing the operations recorded in the trace.
The amount of data referenced at least once in a trace is termed as its footprint. An important issue in using trace-driven simulations to study storage hierarchy design is that the traces must have a sufficiently large footprint for the storage configurations of interest (Hsu et al., 2001). Table 2 presents the footprints of the traces associated with different benchmarks. For all experiments, we used half of the trace to warm-up the simulator. We collect system statistics only after the buffer pools have been warmed up.
| Benchmark | Footprint |
|---|---|
| TPC-C | 1.32 TB |
| CH-benCHmark | 1.13 TB |
| Voter | 1.05 TB |
| AuctionMark | 815 GB |
6.3. Workload Skew Characterization
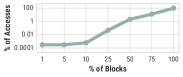
We begin with a characterization of the workload skew present in the different workloads. Figure 3 shows the cumulative distribution function (CDF) of the number of buffer pool accesses per block in the workload traces.
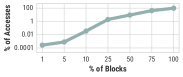
For the TPC-C benchmark shown in Figure 3a, 13% of buffer pool references are made to 75% of the blocks and 25% of the blocks only account for 0.05% of the accesses. This illustrates that this workload is not highly skewed and has a large working set. Similarly, the CH-benCHmark also exhibits low skew as depicted in Figure 3d. 50% and 75% of the blocks account for 9% and 43% of the buffer pool references, respectively.
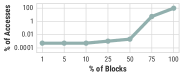
Figure 3b shows that the Voter benchmark exhibits the lowest
degree of skew among all workloads since 75% of the referenced blocks account
for only 6% of buffer pool references. This is because the workload
consists of short-lived transactions that generate writes to the log.
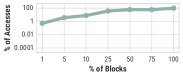
In contrast, AuctionMark exhibits the highest degree of skew
among all workloads. 0.001% of the blocks account for 8% of the buffer pool
references and 61% of the buffer pool accesses are made to 25% of the blocks.
We attribute this to the temporally skewed item access patterns in
AuctionMark.
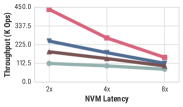
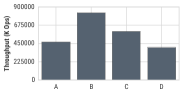
6.4. Impact of NVM on Runtime Performance
In this section, we compare the buffer manager’s throughput on similarly priced NVM-SSD and DRAM-SSD storage hierarchies to examine the impact of NVM on runtime performance. We do not consider a DRAM-NVM-SSD hierarchy in this experiment to isolate the utility of NVM. We configured the cost budget to be $10,000. Given this budget, the capacity of the NVM and DRAM devices are 128 GB and 1 TB, respectively444The cost of NVM is derived from the price of Intel’s 3D XPoint-based Optane SSD 905P (opt, 2018). The latter device’s capacity is 8 higher than that of the former due to NVM’s higher capacity-cost ratio. To obtain insights that are applicable for a wider range of NVM technologies, we quantify the impact of NVM on different latency configurations. We ran the experiment under three NVM latency configurations for the emulator ranging from 2–8 DRAM latency (320–1280 ns).

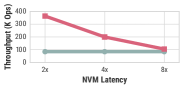
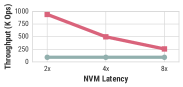
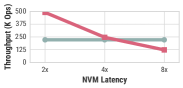
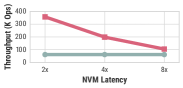
The results shown in Figure 4 illustrate that the NVM-SSD hierarchy outperforms its DRAM-based counterpart on most workloads and latency configurations. On the TPC-C benchmark, we observe that with the 2 latency configuration, the NVM-based hierarchy outperforms the DRAM-SSD hierarchy by 4.3. This is because NVM reduces the number of SSD accesses by 19 due to its capacity advantage over DRAM. The reduction in time spent on disk operations overrides the performance impact of slower NVM accesses. With the 4 latency configuration, the performance gap drops to 2.1. This illustrates the impact of NVM’s higher latency relative to DRAM. The 8 latency configuration is the break-even point at which both storage hierarchies deliver comparable throughput. In this setting, slower NVM accesses nullify the benefits of its higher capacity.
The impact of NVM is more pronounced on the Voter benchmark. This benchmark saturates the DBMS with short-lived transactions that each update a small number of tuples. The buffer manager frequently flushes dirty blocks to durable storage while executing this workload. NVM improves runtime performance by efficiently absorbing these writes. As shown in Figure 4b, the performance gap between the two storage hierarchies varies from 10.5 to 2.8 on the 2 and 8 latency configurations, respectively.
On the AuctionMark workload shown in Figure 4c, the NVM-SSD hierarchy outperforms its DRAM-based counterpart by 2.2 with the 2 latency configuration. However, the trend reverses on the 8 latency configuration, where the latter hierarchy delivers 1.8 higher throughput than the former. We attribute this to the workload’s smaller working set that fits in the DRAM buffer. So, the NVM buffer is not as beneficial on this workload, particularly with slower latency configurations.
The results for the CH-benCHmark workload, shown in Figure 4d, illustrate that the NVM-based hierarchy delivers 5.9 higher throughput compared to its DRAM-based counterpart on the 2 latency configuration. We attribute this to the larger working set associated with this workload. Even on the 8 latency configuration, the former storage hierarchy delivers 1.7 higher throughput than the latter. This demonstrates the performance impact of NVM on HTAP workloads.
6.5. Data Migration Policies
In this section, we look at the impact of data migration policies on runtime
performance and the number of writes performed on NVM.
We begin by comparing the performance of the buffer manager when it employs the
lazy and eager policies presented in Section 3.
We consider a storage hierarchy with 16 GB DRAM and 1 TB NVM buffers on top of
SSD. We quantify the performance impact of four data flow optimizations:
(1) bypassing DRAM (, ), and (2) bypassing NVM
(, ) while serving read and write operations.
To derive insights that are applicable for a wider range of NVM technologies,
we do this analysis across three NVM latency configurations ranging from
2–8 DRAM latency.
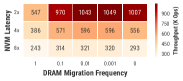
Performance Impact of Bypassing DRAM Figure 5 illustrates the performance impact of bypassing DRAM while serving reads and write operations. We vary the DRAM migration probabilities (, ) in lockstep from 1 through 0. We configured the buffer manager to adopt an eager policy for NVM (, = 1). Since the DRAM migration probabilities are updated in lockstep in this experiment, we denote them by . With the baseline policy ( = 1), the buffer manager eagerly moves data to DRAM. The results in Figure 5 demonstrate that the lazy migration policies work well for DRAM on most workloads.
For the TPC-C benchmark shown in Figure 5a, the throughput observed when is 0.01 is 79% higher than that with the eager migration policy on the 2 latency configuration. The reasons for this are twofold. First, the lazy policy reduces the data migration between NVM and DRAM. Second, it ensures that only frequently referenced data are moved to DRAM. The performance gap drops to 33% on the 8 latency configuration. This is because the lazy policy amplifies the performance impact of slower NVM operations.
The benefits of lazy data migration are more prominent on the write-intensive Voter workload. Bypassing DRAM while performing writes nearly doubles the throughput, as shown in Figure 5b. With the lazy policy, the buffer manager directly flushes dirty blocks to NVM instead of first writing them on DRAM. Since DRAM write latencies are comparable to those of NVM, particularly on the 2 latency configuration, bypassing DRAM during writes shrinks the overall write latency.
Unlike other workloads, eager policy works well for the AuctionMark workload, as depicted in Figure 5c. It outperforms the lazy policy ( = 0.1) by 60% on the 2 latency configuration. This is because the workload’s working set fits in the DRAM buffer and shifts over time. But, the lazy policy delays the migration of hot data from NVM to DRAM, thereby reducing the utility of the DRAM buffer. The performance gap shrinks to 32% with a lazier policy ( = 0.001). The reduction in data movement between DRAM and NVM dampens the impact of delayed migration of the working set.
Lastly, on the CH-benCHmark workload, lazy policy delivers 85% higher
throughput than its eager counterpart, as shown
in Figure 5d. The working set of this workload is
comparatively more stable. So, even though the lazy policy results in delayed
migration, the buffer manager eventually loads the working set in the DRAM
buffer. Thus, the optimal migration policy depends on the workload
characteristics.
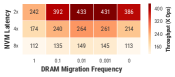
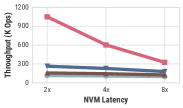
Performance Impact of Bypassing NVM Figure 6 illustrates the performance impact of bypassing NVM while serving reads and write operations. In this experiment, we vary the NVM migration probabilities (, ) in lockstep from 1 through 0. We configured the buffer manager to adopt an eager policy for DRAM (, = 1). Since the NVM migration probabilities are updated in lockstep, we denote them by . The results in Figure 6 show that eager migration ( = 1) works well for NVM on most workloads.
For the TPC-C benchmark shown in Figure 6a, the throughput observed when is set to 0.1 is 68% lower than that with the eager policy on the 2 latency configuration. This is because the time spent on SSD operations increases by 15 due to bypassing NVM during writes. The performance impact of lazy migration marginally drops to 43% on the 8 latency configuration. Slower NVM accesses dampen the effect of writes landing on SSD with this configuration.
The performance impact of NVM bypass is more prominent on the Voter workload shown in Figure 6b. The throughput drops by 91%
when is set to 0.1 on the 2 latency configuration.
These results illustrate that while lazy migration policies work well for DRAM,
eager policies are a better fit for NVM.
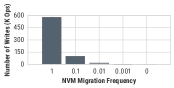
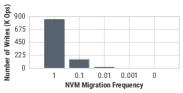
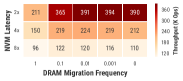
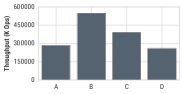
Impact of NVM Bypass on Writes to NVM Although lazy data migration negatively impacts runtime performance, it reduces the number of writes performed on NVM. Figure 7 presents the impact of NVM bypass on the number of NVM writes. For the TPC-C benchmark, as shown in Figure 7a, the buffer manager performs 5.5 fewer writes to NVM with a lazy migration policy ( = 0.1) in comparison to eager migration. The impact of NVM bypass on the number of writes performed on NVM is equally pronounced on the Voter workload as shown in Figure 7b. Adopting a lazy migration policy ( = 0.1) reduces the number of NVM writes by 8.5.
These results illustrate that the optimal data migration policy must be chosen
depending on the runtime performance requirements and write endurance
characteristics of NVM.
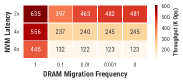
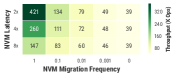
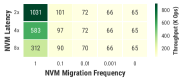
Impact of Storage Hierarchy We next consider how the optimal data migration policy varies across storage hierarchies. In this experiment, we consider two three-tier storage hierarchies with 4 GB and 64 GB DRAM buffers. We configured both systems to use a 1 TB NVM buffer on top of SSD. The results for the TPC-C benchmark depicted in Figure 8 show that the utility of lazy data migration varies across storage systems.
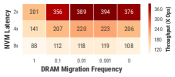
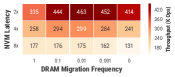
On the first system, as shown in Figure 8a, the throughput with lazy migration ( = 0.01) is 94% higher than that with its eager counterpart. The performance gap between the policies on this system is larger than that observed with a larger DRAM buffer (16 GB) in Figure 5a. This is because the lazy policy increases the utility of the smaller DRAM buffer by not polluting it with colder data. For this system, the optimal migration frequency remains unchanged even on slower latency configurations.
The results for the second system shown in Figure 8b illustrate that the lazy policy delivers 38% higher throughput on the 2 latency configuration. The utility of lazy migration is not as prominent on this system since the capacity of the DRAM buffer is one-sixteenth of that of the NVM buffer. The performance with the eager policy ( = 1) is comparable to that with its lazy counterpart on the 8 latency configuration. This is because the latter policy amplifies the impact of slower NVM operations, particularly when the relative size of the DRAM buffer compared to the NVM buffer is large.
These results show that the optimal migration policy depends not only on the workload and device characteristics, but also on the relative size of the DRAM buffer compared to the NVM buffer.
6.6. Adaptive Data Migration

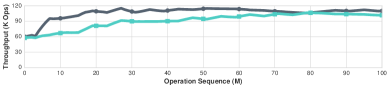
In the previous experiments, we examined the utility of a fixed data migration policy. In the real world, identifying the optimal data migration policy is challenging due to diversity of workloads and storage hierarchies. Thus, we now examine the ability of buffer manager to automatically adapt the management policy at runtime. In this experiment, the buffer manager begins executing the workload with an eager policy for both DRAM ( = 1) and NVM ( = 1). During execution, it adapts the policy using the simulated annealing (SA) algorithm presented in Section 4. This technique searches for the policy that maximizes the throughput given a target workload and storage hierarchy. We use an operation sequence with 100 M entries. We set and to 0.9 and 10, respectively. We configure the initial and final temperatures of the annealing process to 800 and 0.00008. We configure the duration of a tuning step to be 1 M operations to ensure that the impact of policy changes are prominently visible to the SA algorithm.
The results in Figure 9 show that the buffer manager converges to a near-optimal policy for different workloads without requiring any manual tuning. For the TPC-C and Voter workloads, tuning the data migration policy increases throughput by 79% and 92%, respectively. The buffer manager converges to a hybrid policy, with lazy migration for DRAM and eager migration for NVM on both workloads. The throughput converges to a global optima over time. We attribute this to the gradual cooling mechanism in SA that decreases the probability of accepting worse policies.
6.7. Storage System Recommendation
We next focus on the storage hierarchy recommendation problem presented in Section 5. In this experiment, we compare the performance/price numbers of multi-tier storage hierarchies. If the cost of a storage hierarchy is $ and the throughput it delivers is operations per second, then the performance/price number is given by . This represents the number of operations executed per second per dollar. Given a system cost budget and a target workload, the recommender system identifies the storage hierarchy with the highest performance/price number.
Each storage system consists of at most three devices: DRAM, NVM, and SSD.
We vary the capacity of the DRAM and NVM devices from 4 GB through
64 GB, and from 512 GB through 2 TB, respectively. We configured the capacity
of the SSD device to 2 TB. We examine the runtime performance of the buffer
manager on both two- and three-tier storage hierarchies: DRAM-SSD, NVM-SSD,
and DRAM-NVM-SSD. We configured the NVM latency to be 2 that of DRAM.
Storage System Cost:
Figure 10a presents the cost of candidate storage hierarchies.
The cost of the DRAM-SSD hierarchy raises from $339 to $924 when we
vary the capacity of the DRAM device from 2 GB through 32 GB.
The cost of the NVM-SSD hierarchy increases from $800 to $2300 when we
vary the capacity of the NVM device from 512 GB through 2 TB.
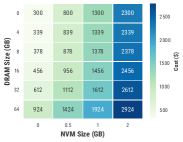
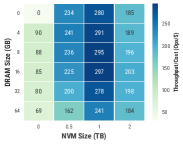
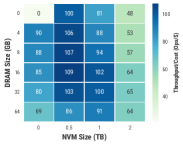
Storage Hierarchy Recommendation: Figure 10 shows the performance/price numbers of candidate storage hierarchies across different workloads. The recommender system performs a grid search to identify the storage hierarchy with the highest performance/price number on a target workload given a cost budget.
For the TPC-C benchmark, as shown in Figure 10b, the storage system that delivers the highest performance/price number consists of 16 GB DRAM and 1 TB NVM on top of SSD. Expanding the capacity of the DRAM buffer to 64 GB improves performance by 7%. But, this also raises the storage system cost by 32%. Similarly, reducing the capacity of the DRAM buffer to 4 GB shrinks performance and cost by 10% and 8%, respectively. The recommended storage hierarchy outperforms its NVM-SSD counterpart by 19%. This is because the DRAM buffer reduces the time spent on NVM read operations by 63%.
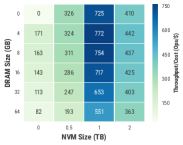
The optimal storage system for the Voter workload consists of 4 GB DRAM and 128 GB NVM, as shown in Figure 10c. While executing this workload, the buffer manager frequently flushes dirty blocks to durable storage. In the absence of NVM, the buffer manager spends more time flushing data to SSD. So, the performance/price number on a similarly priced 128 GB DRAM-SSD system is 16 lower than its NVM-based counterpart.
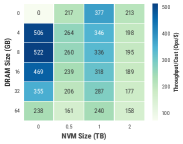
On the AuctionMark workload, as shown in Figure 10d, a DRAM-SSD system consisting of 8 GB DRAM delivers the highest performance/price number. It delivers 2.9 lower throughput compared to a 3.4 higher priced NVM-SSD system with 1 TB NVM. We attribute this to the workload’s smaller working set that fits in the DRAM buffer. So, the utility of the NVM buffer is not as prominent on this workload. Adding a 4 GB DRAM buffer on top of NVM-SSD hierarchy does not improve performance on the AuctionMark workload. Instead, it reduces throughput by 6%. The I/O overhead associated with data migration between DRAM and NVM overrides the utility of caching data on DRAM.
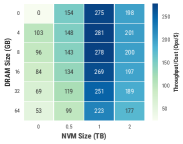
For the CH-benCHmark workload, the results in Figure 10e
show that the maximal performance/price number is delivered by a DRAM-NVM-SSD
system with 4 GB DRAM and 1 TB NVM. Adding a 4 GB DRAM buffer on top of NVM
increases throughput by 5% on this workload. This is because it reduces time
spent on NVM operations by 11%, thereby justifying the cost of data migration.
Impact of NVM latency: We next examine the impact of NVM latency on the selection of storage hierarchy. Figure 10f presents the results for the TPC-C benchmark with the 8 latency configuration. The storage system that delivers the highest performance/price number consists of 16 GB DRAM and 512 GB NVM on top of SSD. The capacity of the NVM buffer has shrunk from 1 TB with the 2 latency configuration. This shows that the utility of the NVM buffer has decreased due to slower NVM accesses.
The results in Figure 10 illustrate how the selection of a multi-tier storage system for a given workload depends on the working set size, the frequency of persistent writes, the performance and cost characteristics of NVM, and the system cost budget.
6.8. Policy Comparison
| Policy | ||||
|---|---|---|---|---|
| (van Renen et. al., 2018) | 1 | 1 | 0.01 | 0.5 |
| 0.01 | 0.01 | 0.2 | 1 | |
| 0.01 | 0.01 | 0.2 | 0.5 | |
| 0.01 | 0.01 | 0.2 | 0.3 |
We now compare a family of buffer management policies against the policy presented in (van Renen et. al., 2018). As shown in Table 3, consists of eager migration for DRAM ( = 1, = 1), and lazy migration for NVM during reads ( = 0.01) and writes ( = 0.5). We construct policies , , and based on the data migration optimizations in Section 6.5 to improve runtime performance and extend the lifetime of the NVM device. These policies adopt lazy migration to DRAM ( = 0.01, = 0.01) and NVM during reads ( = 0.2), and differ in how they migrate data to NVM during writes ( = [1, 0.5, 0.3]). They differ from in two ways. With , the buffer manager initially moves data to DRAM and stores data evicted from DRAM on NVM. It bypasses NVM during writes to ensure that only frequently referenced data is stored on NVM. In contrast, with the former policies, the buffer manager initially moves data into NVM and lazily migrates it to DRAM. It frequently bypasses DRAM during writes and directly persists data on NVM.
The results in Figure 11 illustrate that works well across different workloads. For the TPC-C workload shown in Figure 11a, it outperforms by 3.5. The reasons for this are twofold. First, with , the buffer manager bypasses NVM during writes. Although this scheme reduces the number of writes to NVM by 2, it increases the time spent by the buffer manager on SSD operations by 8.8. The former policy circumvents this problem by absorbing more writes on NVM. The buffer manager reclaims space in the NVM buffer by discarding unmodified blocks. Second, bypassing DRAM during reads ( = 0.01) reduces the data migration overhead between NVM and DRAM and ensures that only frequently referenced blocks are stored on DRAM.

The results in Figure 11b show the utility of eager migration to NVM during writes. outperforms by 6.6 on this workload. With the former policy, the buffer manager directly persists data on NVM instead of first buffering it on DRAM. Since DRAM write latencies are comparable to those of NVM, particularly on the 2 latency configuration, bypassing DRAM during writes reduces the overall write latency, thereby improving runtime performance.
The performance impact of NVM latency is not as prominent with .
The throughput only drops by 18% when we transition from a 2 latency
configuration to a 8 configuration. This is because lazy migration to
NVM increases the time spent on SSD operations, thereby reducing the impact of
slower NVM operations.
Impact on NVM Device Lifetime: With , the buffer manager performs 2 more writes to NVM than with . This shrinks the lifetime of NVM devices with limited write-endurance (Raoux et al., 2008). To circumvent this problem, we construct policies and , which lazily migrate data to NVM during writes (i.e., ¡ 1).
The results in Figure 12 illustrate the impact of these policies on device lifetime. In comparison to , the number of writes to NVM on the TPC-C workload drops by 1.4 and 2.1 with and , respectively. These policies outperform by 2.2 and 1.6, respectively. The buffer manager picks among these policies depending on the write-endurance characteristics of the NVM device.
The results in Figures 11 and 12 illustrate how a combination of data migration optimizations presented in Section 3 maximizes both runtime performance and device lifetime.
7. Related Work
We now discuss the previous research on NVM, especially in the context of buffer
management in DBMSs and file-systems.
NVM-Aware Buffer Management in DBMSs: Renen et al. present a NVM-aware multi-tier buffer manager that eagerly migrates data from SSD to DRAM (van Renen et. al., 2018). When a page is evicted from DRAM, the buffer manager considers admitting it into the NVM buffer. The key idea is to only admit recently referenced pages. The buffer manager maintains an admission queue to keep track of pages considered for admission and only admits pages that were recently denied admission. While this buffer management policy works well in their target storage hierarchy, it does not generalize to other NVM technologies, storage hierarchies, and workloads. We introduce a taxonomy of data migration optimizations that subsumes the specific scheme adopted in their system. We study how the optimal policy depends on workload and storage system characteristics and address the problem of designing a multi-tier storage system.
SOFORT (Oukid et al., 2014) is a hybrid storage engine that targets a two-tier storage
system with DRAM and NVM. The engine stores the primary copy of the data on NVM,
and supports the maintenance of auxiliary data structures on DRAM and NVM.
FOEDUS is a scalable OLTP engine designed for a two-tier storage system with
DRAM and NVM (Kimura, 2015). It is based on the dual page primitive
that points to a pair of logically equivalent pages, a mutable volatile page in
DRAM containing the latest changes, and an immutable snapshot page on NVM.
Arulraj et al. compare three storage management architectures for an NVM-only
system and demonstrate that in-place updates architecture maximizes performance
and minimizes the wear on the NVM device (Arulraj et al., 2015). Unlike these systems,
this paper focuses on managing and designing multi-tier storage hierarchy with
DRAM, NVM, and SSD.
NVM-aware Buffer Management in File Systems: Beyond DBMSs, researchers have explored using NVM in file-systems. BPFS uses a variant of shadow paging on NVM to support atomic fine-grained updates by relying on a special hardware instruction that ensures ordering between writes in different epochs (Condit et al., 2009). PMFS is another filesystem from Intel Labs that is designed for byte-addressable NVM (Dulloor et al., 2014). It relies on a write-ahead logging for meta-data and uses shadow paging for data. EXT4 DAX extends the EXT4 file system to support direct mapping of NVM by bypassing the buffer cache (Corbet, 2014). Aerie provides direct access for file data I/O using user-level leases for NVM updates (Volos et al., 2014). NOVA is a novel per-inode log-structured file system that provide synchronous file system semantics on NVM, but requires system calls for every operation (Xu and Swanson, 2016). F2FS is an SSD-optimized log-structured file system that sorts data to reduce file system write amplification (Lee et al., 2015).
Strata is a cross-media file system that supports performance-isolated access to
NVM using a per-application log by efficiently operating on SSDs and
HDDs (Kwon et al., 2017). This system is optimized for a specific NVM technology that
is 2 slower than DRAM. So it does not cache NVM-resident data on DRAM.
For the same reason, it bypasses DRAM while performing synchronous write operations.
While this buffer management policy works well in their target environment,
it does not generalize to other NVM technologies, storage hierarchies, and
workloads. We tackle the buffer management problem within the context of a DBMS.
Operating inside a DBMS allows us to support, and requires us to handle, a
broader class of application access patterns.
Buffer Management in Systems without NVM:
Before the advent of NVM technologies, researchers have studied multi-tier
buffer management in storage systems without NVM.
FlashStore is a key-value store that uses an SSD as a fast cache between DRAM and
HDD and minimizes the number of SSD accesses (Debnath et al., 2010).
RAMCloud is a sharded data storage system that uses disk as a back up for data
stored on replicated DRAM (Ousterhout et al., 2015). It improves the DRAM utilization
by employing a log-structured design on both DRAM and disk (Ongaro et al., 2011).
Nitro is an SSD caching system that relies on data compression and deduplication
to maximize storage utilization (Li et al., 2014).
RIPQ is a novel caching layer that shrinks write amplification by using the
local SSD as a read-only cache for remote storage (Tang et al., 2015).
Unlike these systems, this paper focuses on NVM-aware buffer management.
8. Conclusion
This paper presented techniques for managing and designing a multi-tier storage hierarchy comprising of DRAM, NVM, and SSD. We introduced a taxonomy for NVM-aware data migration optimizations and discussed how the buffer management policy can be synthesized based on the performance requirements and write endurance characteristics of NVM. We presented an adaptation mechanism in the buffer manager that achieves a near-optimal policy for an arbitrary workload and storage hierarchy without requiring any manual tuning. We developed a recommendation system for designing a multi-tier storage hierarchy for a target workload and system cost budget. Our results demonstrate that the NVM-aware buffer manager and storage system designer improve system throughput and reduce system cost across different transaction and analytical processing workloads.
References
- [1] OLTPBenchmark.com. http://oltpbenchmark.com.
- [2] Persistent memory file system (PMFS). https://github.com/linux-pmfs/pmfs.
- [3] PostgreSQL. https://www.postgresql.org/.
- tim [2007] Oracle TimesTen Products and Technologies. Technical report, February 2007.
- int [2015] Intel’s 3d memory is 1,000 times faster than modern storage. https://www.engadget.com/2015/07/28/intel-3d-memory-1000-times-faster/, July 2015.
- hpe [2017] Hpe unveils computer built for the era of big data. https://news.hpe.com/a-new-computer-built-for-the-big-data-era/, May 2017.
- int [2017] A new breakthrough in persistent memory gets its first public demo. https://itpeernetwork.intel.com/new-breakthrough-persistent-memory-first-public-demo/, May 2017.
- opt [2018] Intel Optane SSD 905P Series. https://www.intel.com/content/www/us/en/products/memory-storage/solid-state-drives/gaming-enthusiast-ssds/optane-905p-series.html, 2018.
- [9] R. Agrawal and H. V. Jagadish. Recovery algorithms for database machines with nonvolatile main memory. IWDM’89, pages 269–285.
- [10] V. Angkanawaraphan and A. Pavlo. AuctionMark: A Benchmark for High-Performance OLTP Systems. http://hstore.cs.brown.edu/projects/auctionmark.
- Arulraj et al. [2015] J. Arulraj, A. Pavlo, and S. Dulloor. Let’s talk about storage & recovery methods for non-volatile memory database systems. In SIGMOD, 2015.
- Arulraj et al. [2017] J. Arulraj, M. Perron, and A. Pavlo. Write-behind logging. In VLDB, 2017.
- Beaver et al. [2010] D. Beaver, S. Kumar, H. C. Li, J. Sobel, P. Vajgel, and F. Inc. Finding a needle in haystack: Facebook’s photo storage. In OSDI, 2010.
- Bergstra and Bengio [2012] J. Bergstra and Y. Bengio. Random search for hyper-parameter optimization. Journal of Machine Learning Research, 13(Feb):281–305, 2012.
- Bernstein et al. [1986] P. A. Bernstein, V. Hadzilacos, and N. Goodman. Concurrency Control and Recovery in Database Systems. Addison-Wesley Longman Publishing Co., Inc., Boston, MA, USA, 1986.
- Chen et al. [2014] F. Chen, M. Mesnier, and S. Hahn. A protected block device for persistent memory. In 30th Symposium on Mass Storage Systems and Technologies (MSST), pages 1–12, 2014.
- Condit et al. [2009] J. Condit, E. B. Nightingale, C. Frost, E. Ipek, B. Lee, D. Burger, and D. Coetzee. Better I/O through byte-addressable, persistent memory. In SOSP, pages 133–146, 2009. ISBN 978-1-60558-752-3.
- Corbet [2014] J. Corbet. Supporting filesystems in persistent memory. https://lwn.net/Articles/610174/, 2014.
- Cutress and Tallis [2018] I. Cutress and B. Tallis. Intel launches optane dimms up to 512 gb: Apache pass is here. https://www.anandtech.com/show/12828/intel-launches-optane-dimms-up-to-512gb-apache-pass-is-here, May 2018.
- Debnath et al. [2010] B. Debnath, S. Sengupta, and J. Li. Flashstore: High throughput persistent key-value store. VLDB, pages 1414–1425, 2010.
- DeWitt et al. [1984] D. J. DeWitt, R. H. Katz, F. Olken, L. D. Shapiro, M. R. Stonebraker, and D. Wood. Implementation techniques for main memory database systems. SIGMOD Rec., 14(2):1–8, 1984.
- Difallah et al. [2013] D. E. Difallah, A. Pavlo, C. Curino, and P. Cudré-Mauroux. Oltp-bench: An extensible testbed for benchmarking relational databases. PVLDB, 7(4):277–288, 2013.
- Dulloor et al. [2014] S. R. Dulloor, S. K. Kumar, A. Keshavamurthy, P. Lantz, D. Subbareddy, R. Sankaran, and J. Jackson. System software for persistent memory. In EuroSys, 2014.
- Eisenman et al. [2018] A. Eisenman, D. Gardner, I. AbdelRahman, J. Axboe, S. Dong, K. Hazelwood, C. Petersen, A. Cidon, and S. Katti. Reducing dram footprint with nvm in facebook. In EuroSys, page 42, 2018.
- Franklin [1997] M. Franklin. Concurrency control and recovery. The Computer Science and Engineering Handbook, pages 1058–1077, 1997.
- Harizopoulos et al. [2008] S. Harizopoulos, D. J. Abadi, S. Madden, and M. Stonebraker. OLTP through the looking glass, and what we found there. In SIGMOD, pages 981–992, 2008. ISBN 978-1-60558-102-6.
- Hellerstein et al. [2007] J. M. Hellerstein, M. Stonebraker, and J. R. Hamilton. Architecture of a Database System. Foundations and Trends in Databases, 1(2):141–259, 2007.
- Hsu et al. [2001] W. W. Hsu, A. J. Smith, and H. C. Young. Characteristics of production database workloads and the tpc benchmarks. IBM Systems Journal, 40(3), 2001.
- Ioannidis and Wong [1987] Y. E. Ioannidis and E. Wong. Query optimization by simulated annealing, volume 16. ACM, 1987.
- Jacob et al. [1996] B. L. Jacob, P. M. Chen, S. R. Silverman, and T. N. Mudge. An analytical model for designing memory hierarchies. IEEE Transactions on Computers, 45(10):1180–1194, 1996.
- Kallman et al. [2008] R. Kallman, H. Kimura, J. Natkins, A. Pavlo, A. Rasin, S. Zdonik, E. P. C. Jones, S. Madden, M. Stonebraker, Y. Zhang, J. Hugg, and D. J. Abadi. H-Store: A High-Performance, Distributed Main Memory Transaction Processing System. In VLDB, pages 1496–1499, 2008.
- Kimura [2015] H. Kimura. FOEDUS: OLTP engine for a thousand cores and NVRAM. In SIGMOD, 2015.
- Kirkpatrick et al. [1983] S. Kirkpatrick, C. D. Gelatt, and M. P. Vecchi. Optimization by simulated annealing. science, 220(4598):671–680, 1983.
- Kwon et al. [2017] Y. Kwon, H. Fingler, T. Hunt, S. Peter, E. Witchel, and T. Anderson. Strata: A cross media file system. In SOSP, 2017.
- Lee et al. [2015] C. Lee, D. Sim, J.-Y. Hwang, and S. Cho. F2fs: A new file system for flash storage. In FAST, pages 273–286, 2015.
- Lefurgy et al. [2003] C. Lefurgy, K. Rajamani, F. Rawson, W. Felter, M. Kistler, and T. W. Keller. Energy management for commercial servers. Computer, 36(12), 2003.
- Li et al. [2014] C. Li, P. Shilane, F. Douglis, H. Shim, S. Smaldone, and G. Wallace. Nitro: A capacity-optimized ssd cache for primary storage. In ATC, 2014.
- Ma and et al. [2016] L. Ma and et al. Larger-than-memory data management on modern storage hardware for in-memory oltp database systems. In DaMoN, 2016.
- [39] J. A. Mandelman, R. H. Dennard, G. B. Bronner, J. K. DeBrosse, R. Divakaruni, Y. Li, and C. J. Radens. Challenges and future directions for the scaling of dynamic random-access memory (DRAM). IBM J. Res. Dev., 46(2-3).
- [40] MemSQL. How MemSQL Works. http://docs.memsql.com/4.1/intro/.
- Mohan et al. [1992] C. Mohan, D. Haderle, B. Lindsay, H. Pirahesh, and P. Schwarz. ARIES: a transaction recovery method supporting fine-granularity locking and partial rollbacks using write-ahead logging. ACM TODS, 17(1):94–162, 1992. ISSN 0362-5915.
- Moraru et al. [2013] I. Moraru, D. Andersen, M. Kaminsky, N. Tolia, P. Ranganathan, and N. Binkert. Consistent, durable, and safe memory management for byte-addressable non volatile main memory. In TRIOS, 2013.
- O’Neil et al. [1993] E. J. O’Neil, P. E. O’Neil, and G. Weikum. The lru-k page replacement algorithm for database disk buffering. In SIGMOD, pages 297–306. ACM, 1993.
- Ongaro et al. [2011] D. Ongaro, S. M. Rumble, R. Stutsman, J. Ousterhout, and M. Rosenblum. Fast crash recovery in RAMCloud. In SOSP, 2011.
- Oukid et al. [2014] I. Oukid, D. Booss, W. Lehner, P. Bumbulis, and T. Willhalm. SOFORT: A hybrid SCM-DRAM storage engine for fast data recovery. DaMoN, pages 8:1–8:7, 2014.
- Ousterhout et al. [2015] J. Ousterhout, A. Gopalan, A. Gupta, A. Kejriwal, C. Lee, B. Montazeri, D. Ongaro, S. J. Park, H. Qin, M. Rosenblum, S. Rumble, R. Stutsman, and S. Yang. The ramcloud storage system. ACM Trans. Comput. Syst., 2015.
- Perez and Rose [2010] T. Perez and C. Rose. Non-volatile memory: Emerging technologies and their impact on memory systems. PURCS Technical Report, 2010.
- Ramakrishnan and Gehrke [2003] R. Ramakrishnan and J. Gehrke. Database Management Systems. McGraw-Hill, Inc., New York, NY, USA, 3 edition, 2003. ISBN 0072465638, 9780072465631.
- Raoux et al. [2008] S. Raoux, G. Burr, M. Breitwisch, C. Rettner, Y. Chen, R. Shelby, M. Salinga, D. Krebs, S.-H. Chen, H.-L. Lung, and C. Lam. Phase-change random access memory: A scalable technology. IBM Journal of Research and Development, 52(4.5):465–479, 2008.
- Sikka et al. [2012] V. Sikka, F. Färber, W. Lehner, S. K. Cha, T. Peh, and C. Bornhövd. Efficient transaction processing in SAP HANA database: The end of a column store myth. In SIGMOD, SIGMOD ’12, pages 731–742, 2012.
- Stoica and Ailamaki [2013] R. Stoica and A. Ailamaki. Enabling efficient OS paging for main-memory OLTP databases. In DaMon, 2013.
- Stonebraker [1981] M. Stonebraker. Operating system support for database management. Communications of the ACM, 24(7):412–418, 1981.
- Strukov et al. [2008] D. B. Strukov, G. S. Snider, D. R. Stewart, and R. S. Williams. The missing memristor found. Nature, (7191):80–83, 2008.
- Tang et al. [2015] L. Tang, Q. Huang, W. Lloyd, S. Kumar, and K. Li. Ripq: Advanced photo caching on flash for facebook. In FAST, pages 373–386, 2015.
- The Transaction Processing Council [2007] The Transaction Processing Council. TPC-C Benchmark (Revision 5.9.0). http://www.tpc.org/tpcc/, June 2007.
- van Renen et. al. [2018] A. van Renen et. al. Managing non-volatile memory in database systems. In SIGMOD, 2018.
- Volos et al. [2014] H. Volos, S. Nalli, S. Panneerselvam, V. Varadarajan, P. Saxena, and M. M. Swift. Aerie: Flexible file-system interfaces to storage-class memory. In EuroSys, 2014.
- Xu and Swanson [2016] J. Xu and S. Swanson. Nova: A log-structured file system for hybrid volatile/non-volatile main memories. In FAST, pages 323–338, 2016.
- Zhang et al. [2015] Y. Zhang, J. Yang, A. Memaripour, and S. Swanson. Mojim: A reliable and highly-available non-volatile memory system. In ASPLOS, 2015.
Appendix A NVM Hardware Emulator
The hardware emulator is a dual-socket system equipped with Intel Xeon E5-4620 CPUs (2.6 GHz), each with eight cores and a 20 MB L3 cache. Each processor supports four DDR3 channels with two DIMMs per channel. PMEP reserves half of the memory channels on each processor for emulated NVM while using the rest for regular memory. The emulator’s custom BIOS firmware partitions the physical memory address space into separate address spaces for DRAM and emulated NVM.
NVM technologies have higher read and write latency than DRAM. PMEP emulates the latency for the NVM partition using custom CPU microcode. The microcode estimates the additional cycles that the CPU would have to wait if DRAM is replaced by slower NVM and then stalls the CPU for those cycles. The accuracy of the latency emulation model has been validated by comparing the performance of applications on emulated NVM and slower NUMA memory [Dulloor et al., 2014]. The emulator throttles the write bandwidth by limiting the number of DDR operations performed per microsecond.
The buffer manager uses the filesystem interface exported by the emulator. This allows the buffer manager to use the POSIX filesystem interface to read/write data to files stored on NVM. This interface is implemented by the persistent memory filesystem, a special filesystem optimized for NVM [pmf, ]. Normally, in a block-oriented filesystem, file I/O requires two copies; one involving the block device and another involving the user buffer. The emulator’s optimized filesystem, however, requires only one copy between the file and the user buffers.
Appendix B Additional Related Work
In-memory DBMSs: Prior research has shown that there is significant overhead associated with buffer management in a DBMS. When all the data fits in main memory, the cost of maintaining a buffer pool is nearly one-third of all the CPU cycles used by the DBMS [Harizopoulos et al., 2008]. This is because the buffer manager must keep track of meta-data about pages in the pool to enforce the buffer replacement policy and synchronize concurrent accesses from different threads to the pool. The overhead associated with managing disk-resident data has given rise to a class of new in-memory DBMSs that manage the entire database in main memory and do not contain a buffer pool [DeWitt et al., 1984, MemSQL, , tim, 2007].
In-memory DBMSs provide better throughput and lower latency than disk-based DBMSs on OLTP applications due to this main memory orientation [Kallman et al., 2008]. The fundamental limitation of in-memory DBMSs, however, is that they can deliver this improved performance only when the database is smaller than the amount of DRAM available in the system. If the dataset grows larger than the memory capacity, then the operating system will start to page virtual memory, and main memory accesses will cause page faults [Stonebraker, 1981]. The execution of transactions is stalled until the pages are retrieved from non-volatile storage. The performance of an in-memory DBMS drops by up to 66% when the dataset exceeds the memory capacity, even if the working set fits in memory [Stoica and Ailamaki, 2013].
Larger-than-Memory Data Management: Several techniques have been proposed to improve the performance of in-memory DBMSs while operating on larger-than-memory databases [Ma and et al., 2016]. These techniques exploit the skewed access patterns observed in modern database applications. In these workloads, certain hot data tuples are accessed more frequently than other cold tuples. While handling such workloads, it is advantageous to cache the hot data in memory since it is likely to be modified during this period. But then once the age of particular tuple crosses some threshold, the buffer manager can migrate the cold tuple out to cheaper secondary storage. With this data migration technique, the DBMS can still deliver high performance for transactions that operate on hot in-memory tuples while still being able to access the cold data if needed at a later point in time. This paper generalizes these buffer management techniques to a multi-tier storage hierarchy.