The build-up of pseudobulges in a hierarchical universe
Abstract
We study the cosmological build-up of pseudobulges using the L-Galaxies semi-analytical model for galaxy formation with a new approach for following separately the assembly of classical bulges and pseudobulges. Classical bulges are assumed to be the result of violent processes (i.e., mergers and starbursts), while the formation of pseudobulges is connected to the secular growth of disks. We apply the model to both the Millennium and the Millennium II simulations, in order to study our results across a wide range of stellar masses (). We find that pseudobulges mainly reside in galaxies of () and we recover structural properties of these objects (e.g., sizes and bulge-to-total ratios) that are in good agreement with observational results. Tracing their formation history, we find that pseudobulges assembled in galaxies with a very quiet merger history, as opposed to the host galaxies of classical bulges. Regarding the bulge structure, we find that of the galaxies with a predominant pseudobulge feature a composite structure, hosting both a pseudo and a classical bulge component. The classical component typically constitutes of the total bulge galaxy mass. When looking at the properties of the host galaxies, we find that pseudobulges are hosted by main sequence galaxies, characterized by a stellar population which is generally younger compared to the one of the hosts of classical bulges.
keywords:
galaxies: Pseudobulges - galaxies: secular evolution - methods: numerical1 INTRODUCTION
According to the current picture of galaxy formation and evolution, the collapse of primordial and diffuse gas into condensed structures follows the aggregation of dark matter halos (White and Rees,, 1978; Forcada-Miro and White,, 1997; White and Frenk,, 1991; Birnboim and Dekel,, 2003). During this process, the hot gas cools down and settles into rotationally-supported disks which act as birthplaces for galaxies. At later times, protogalaxies grow and evolve via a combination of ex-situ and in-situ processes which gradually shape their morphology, giving rise to the diverse population of galaxies in the mature universe, characterized by different proportions of bulge and disk components and complex features such as spiral arms and bar structures. While ex-situ mechanisms can be dynamically fast and violent phenomena which take place, for instance, during galaxy mergers, the in-situ processes comprise phenomena such as cooling of gas, internal star formation activity and instabilities in the galactic structure (see Kormendy and Kennicutt, 2004a, ; Kormendy and Ho,, 2013). These processes can be long compared to the dynamical time of the galaxy, in which case they are referred to with the term secular.
It is broadly accepted that elliptical galaxies and classical bulges are formed via galaxy encounters during their hierarchical growth (Kauffmann et al.,, 1993; Baugh et al.,, 1996; van Dokkum,, 2005; Benson et al.,, 2002; Menci et al.,, 2004; Moorthy and Holtzman,, 2006; Eliche-Moral et al.,, 2006; Ryan et al.,, 2008; Carpineti et al.,, 2012; Kormendy and Ho,, 2013). Despite sharing common properties, a slightly different formation scenario has been proposed for each of them. Elliptical structures are expected to be the result of collisions between galaxies with similar baryonic mass, during which any memory of previous structural features, such as bulge morphology or disk component, is lost and the final galaxy is transformed in a pure-bulge (Eliche-Moral et al.,, 2006; Côté et al.,, 1998; Barnes,, 1999). Classical bulges, on the other hand, are formed in galaxy encounters with small satellites where the nuclear region of the central galaxy experiences a significant growth as a consequence of the satellite mass incorporation (Doyon et al.,, 1994; Aguerri et al.,, 2001; Tacconi et al.,, 2002; van Dokkum,, 2005; Hammer et al.,, 2005; Bournaud et al.,, 2005; Dasyra et al.,, 2006, 2007; Hopkins et al., 2009b, ; Rahimi et al.,, 2010). This seems to be a simplified scenario, as pointed out by e.g. Hopkins et al., 2009a ; Ueda et al., (2014), who found that some remnants of a equal-mass galaxy merger can still host a small disk component.
On the other hand, bulge structures developed in isolated galaxies
are thought to follow a different formation pathway than ellipticals and classical bulges (see e.g. Kormendy and Kennicutt, 2004a, ; Athanassoula,, 2005). Within this evolutionary channel, morphological modifications are mostly governed by the self-gravity of the galactic disk: spatially extended and massive disks are susceptible to undergo a wide range of dynamical instabilities, characterized by the formation of non-axisymmetric and/or spiral structures usually referred to as bars or spiral arms, respectively (Kalnajs,, 1972; Ostriker and Peebles,, 1973; Combes and Sanders,, 1981; Toomre,, 1981; Efstathiou et al.,, 1982; Pfenniger and Norman,, 1990; Mo et al.,, 1998; Athanassoula,, 2005; Sellwood,, 2016). In particular, bar instabilities can have an in important role in shaping galaxy morphology by acting on the disk via angular momentum redistribution and gravitational torques (Athanassoula,, 2012). One of the net effects of these complex dynamical processes is the formation of a nuclear structure known as pseudobulge shortly after bar formation, as consequence for instance of the buckling of the nuclear stellar orbits (Pfenniger and Norman,, 1990; Bureau and Freeman,, 1999; Combes,, 2009; Athanassoula,, 2012; Kormendy and Ho,, 2013).
The basic elements of this picture are supported by several studies based on observational data. Doyon et al., (1994); Papovich et al., (2005); Tamburri et al., (2014), for instance, showed that classical bulges are usually characterized by elliptical-like properties, such as high Sersic indexes (), old stellar populations, lack of star-forming activity and stellar kinematics dominated by velocity dispersion. On the other hand, pseudobulges display properties more related to disk-like structures, such as lower Sersic indexes () or ongoing star formation (see e.g. Drory and Fisher,, 2007; Fisher and Drory, 2008a, ; Fisher et al.,, 2009). Nevertheless, deviations from this archetypal behaviour for pseudobulges/classical bulges have been found, for instance, by Ribeiro et al., (2016). To complicate this picture further, some works have argued that bulge formation could not be a consequence of just mergers and bar instabilities (Noguchi,, 1998, 1999; Obreja et al.,, 2013; Laurikainen and Salo,, 2016). In order to shed light on the possible formation mechanisms of pseudobulges, classical bulges and ellipticals new efforts have been pursued from an observational perspective by, e.g., Gadotti, (2009). This work supported the idea of classical bulges and pseudobulges being formed via different evolutionary pathways, which would leave their respective imprint in the bulge structural properties. According to this work, Sersic indexes and bulge-to-total ratios in classical bulges follow an elliptical-like correlation, suggesting a structural similarity between these two classes of objects. However, at the same time, classical bulges appear to be offset in the mass-to-size relation, as to confirm that classical bulges are not just ellipticals surrounded by disks. Finally, Gadotti, (2009) showed that classical- and pseudo-bulges overlap when their host structural parameters (such as bulge or disk scale lengths) are taken into account. These findings suggest that bulge formation is an extremely complex phenomenon, which might be shaped by both mergers and secular processes during the complex cosmological evolution of galaxies (see e.g. Bournaud and Combes,, 2002; Obreja et al.,, 2013; Erwin et al.,, 2015; Laurikainen and Salo,, 2016).
Bulge formation has been extensively studied also via numerical approaches. Noguchi, (1998, 1999), for instance, used simulations of isolated galaxies to introduce the clumpy-origin bulge formation mechanism. This scenario is based on the radial migration and aggregation of several stellar clumpy structures during the high-redshift assembly of galaxy disks. Similar results have been obtained by Dekel et al., (2009) in a theoretical work. Spinoso et al., (2017) analyzed the bar-induced formation of a pseudobulge structure within a Milky Way-like galaxy produced by the ErisBH cosmological zoom-in simulation (Bonoli et al.,, 2016). According to their analysis, a combination of the central black hole feedback at high redshift and the galaxy quiet merger history at lower one could have delayed the growth of the galaxy bulge, producing a disk more prone to bar instabilities at . Nevertheless, all these numerical works could only focus on the analysis of few specific objects, suffering low statistics issues. Semi-analytical models (SAMs) have shown to be an useful tool to shed light to this complicated bulge formation paradigm under a statistical point of view (see e.g. Gargiulo et al.,, 2015; Guo et al.,, 2011; Lacey et al.,, 2016; Lagos et al.,, 2018), despite some intrinsic limitations in modelling galaxy evolution processes. For instance, by using the L-Galaxies SAM, Shankar et al., (2012) could reproduce some observed properties of early type galaxies, such as effective radii or black hole- bulge mass relation. Other recent works used a simple approach to model the bulge growth and were able to naturally obtain the observed fraction of bulge galaxies and the galaxy size - stellar mass relation (Tonini et al.,, 2016; Lagos et al.,, 2018).
In this work, we use an updated version of the L-Galaxies semi-analytical model (Henriques et al.,, 2015) to study the evolution of bulges, following separately classical and pseudo-bulge components. The code is run on both the Millennium and Millennium II merger tress (Springel,, 2005; Boylan-Kolchin et al.,, 2009), enabling us to study a wide range in stellar mass (). The main novelty of our approach is that we differentiate between merger-driven and secularly-driven disk instabilities, linking the former to the growth of classical bulges, and the latter to the formation of bars and pseudobulges. The outline of this work is as follow: In Section 2 we describe the main characteristics of L-Galaxies and Millennium simulations. We present updates in the model that lead to a better description of galaxy morphology, and our approach in following the formation and evolution of bulge structures. In Section 3 we present our results, focusing on the properties of galaxies that host pseudobulges across cosmic time and on the structural properties of the simulated pseudobulges. Finally, in Section 4 we summarize our main findings.
2 L-Galaxies Semi-analytical model
In this section we first briefly describe the L-Galaxies semi-analytical model, from the dark matter simulations to the prescriptions adopted to describe baryonic processes (extensively detailed in Henriques et al., (2015)). We then focus on the modification introduced in this work to better describe galaxy morphology and the pseudobulges build-up.
2.1 The semi-analytical model: Framework
2.1.1 Dark matter simulations
The backbones of L-Galaxies are the catalogues of merger-trees obtained by the Millennium (hereafter MS, Springel,, 2005) and Millennium II (MSII, Boylan-Kolchin et al.,, 2009) -body simulations. The first one follows the cosmological evolution of dark matter (DM) particles () inside a periodic box of 500 on a side, from 127 to the present. The latter can be thought as a high-resolution version of the MS, as it follows the same number of particles with a 125 times higher mass resolution () in a smaller box ( on a side). Both simulations were originally run with , , , , , (Colless et al.,, 2001).
Data from the MS and MSII simulations were stored respectively at 63 and 68 epochs (snapshots), spaced approximately logarithmically in time at and linearly at (where ). DM halos and subhalos were identified within the snapshots by using a friend-of-friend (FOF) group-finder and an extended version of the algorithm (Springel et al.,, 2001). Halo catalogs were built by considering only bound structures with at least 20 particles, which translates into a minimum halo-mass of and for MS and MSII, respectively. Halos and subhalos were finally arranged in merger trees structures, thus allowing to follow the evolutionary path of any DM halo in the simulations. These merger trees are the skeleton of our SAM, but, because of the finite number of outputs of the DM simulations, the time resolution they offer is not enough to properly trace the baryonic physics. Therefore, to accurately follow the galaxy evolution between two consecutive DM snapshots (), the SAM does an internal time discretization between them with approximately of time resolution. These extra temporal subdivisions used by the SAM are called sub-steps.
We want to stress that the accuracy of the results presented in this work at for MS are limited by halo mass resolution issues. In these cases, we will rely in the MSII predictions whose limitation is at .
The latest L-Galaxies version was tuned on a re-scaled versions of MS and MSII simulations (Henriques et al.,, 2015). The re-scaling procedure (Angulo and White,, 2010) allows the two simulations to match the cosmological parameters provided by Planck first-year data (Planck Collaboration et al.,, 2014)) , , , and . After re-scaling, the particle mass corresponds to and for MS and MSII respectively.
2.1.2 Baryonic physics
The starting point of the galaxy evolution model is the infall of baryonic matter onto every newly-resolved DM halo (see e.g. White and Frenk,, 1991). This process is modeled by associating an amount of matter to each halo, proportionally111 (Planck Collaboration et al.,, 2014) to its DM mass . This process is repeated at each snapshot, in order to keep the baryonic fraction of each halo fixed in time to the value . The baryonic component initially assumes the form of a diffuse, spherical, quasi-static, hot atmosphere of pristine (i.e. zero-metallicity) gas, with radius equal to the halo virial radius . A fraction of this atmosphere is then allowed to gradually condensate and migrate towards the DM halo center. In particular, following White and Rees, (1978), the gas cooling rate is determined by the amount of hot gas enclosed within the halo cooling radius (defined as the radius at which
, as in De Lucia et al.,, 2004). This implies the presence of two different cooling regimes: the rapid infall () which leads to the fast condensation of the whole hot atmosphere, and the slower hot phase (), in which only a fraction of the hot gas is allowed to cool down. The cold gas then settles into a disc-like structure by inheriting specific angular momentum from its host DM halo (see Guo et al.,, 2011) and constitutes the mass reservoir which fuels star formation (SF) processes. After each cooling episode, the mass and dynamical time of each galaxy cold-gas disk uniquely define the instantaneous star formation rate (SF), by which galaxies build-up their stellar disk in time. As it is widely accepted, feedback from supernovae (SNe) can have a severe impact on star formation within galactic disks. To model this crucial phenomenon, SNe in L-Galaxies inject energy in the cold-gas disk, helping to re-heat a fraction of it to the hot atmosphere and eventually ejecting a fraction of the hot gas beyond . The reincorporation of these ejecta at later times helps regulating the low- star formation, especially in low-mass satellites galaxies (Henriques et al.,, 2015).
Regarding the bulge component, the galaxies are allowed to develop/grow a dense pack of stars in the nuclear region via mergers and disk instabilities (DI). While the former is a natural consequence of the hierarchical growth of the DM halos, the latter plays a crucial role in galaxies in isolation and closely related with star formation. In the following sections we discuss about these two different channels and in Appendix A we present an improvement in the redshift evolution of the effective radius vs. stellar mass plane for early and latte type galaxies by adding energy dissipation during bulge formation in major mergers.
Finally, in order to prevent the stellar component of massive galaxies to over-grow, the model introduces feedback from central super-massive black holes (BHs) as an additional mechanism to regulate star formation at low redshifts. The so-called radio-mode BH feedback is defined to be proportional to the matter from the galaxy hot atmosphere and the the central BH mass222A better modeling of black hole growth and its spin evolution in L-Galaxies will be presented in Izquierdo-Villalba et al. in prep (see e.g. Croton,, 2006). The hot atmosphere content, in turn, depends indirectly on all the large scale effects acting on it. Among these, the most important for the scope of this work are environmental processes, such as ram pressure or tidal interactions which can completely remove the hot gas atmosphere around satellite galaxies and eventually destroy their stellar and gas components (see details in Guo et al.,, 2011; Henriques et al.,, 2015).

2.2 The build-up of bulges through mergers
Galaxy morphology in L-Galaxies is mainly driven by mergers and disk instabilities. Here we describe how the model treats these processes and the modifications we introduced to better describe the abundance of the different morphological types across a wide range of stellar masses and to follow secular-evolution processes.
2.2.1 Smooth accretion: a new recipe for extreme minor mergers
Galactic encounters are driven by the merger of the parent dark matter haloes. The time-scale of these processes is given by the dynamical friction experienced by the merging galaxies, as presented in Guo et al., (2011). In the standard picture of L-Galaxies , the ratio between the baryonic masses of the two galaxies is used to differentiate between major () and minor () interactions. In the standard version of the model, is set to 0.1. Major mergers are assumed to be able to completely destroy the disks of the two interacting galaxies, leading to a pure spheroidal remnant which suffers a collisional starburst. In minor mergers, instead, the disk of the larger galaxy survives and experiences a burst of star formation, while its bulge incorporates the entire stellar mass of the satellite that survived stripping (as modelled by Guo et al., (2011)).
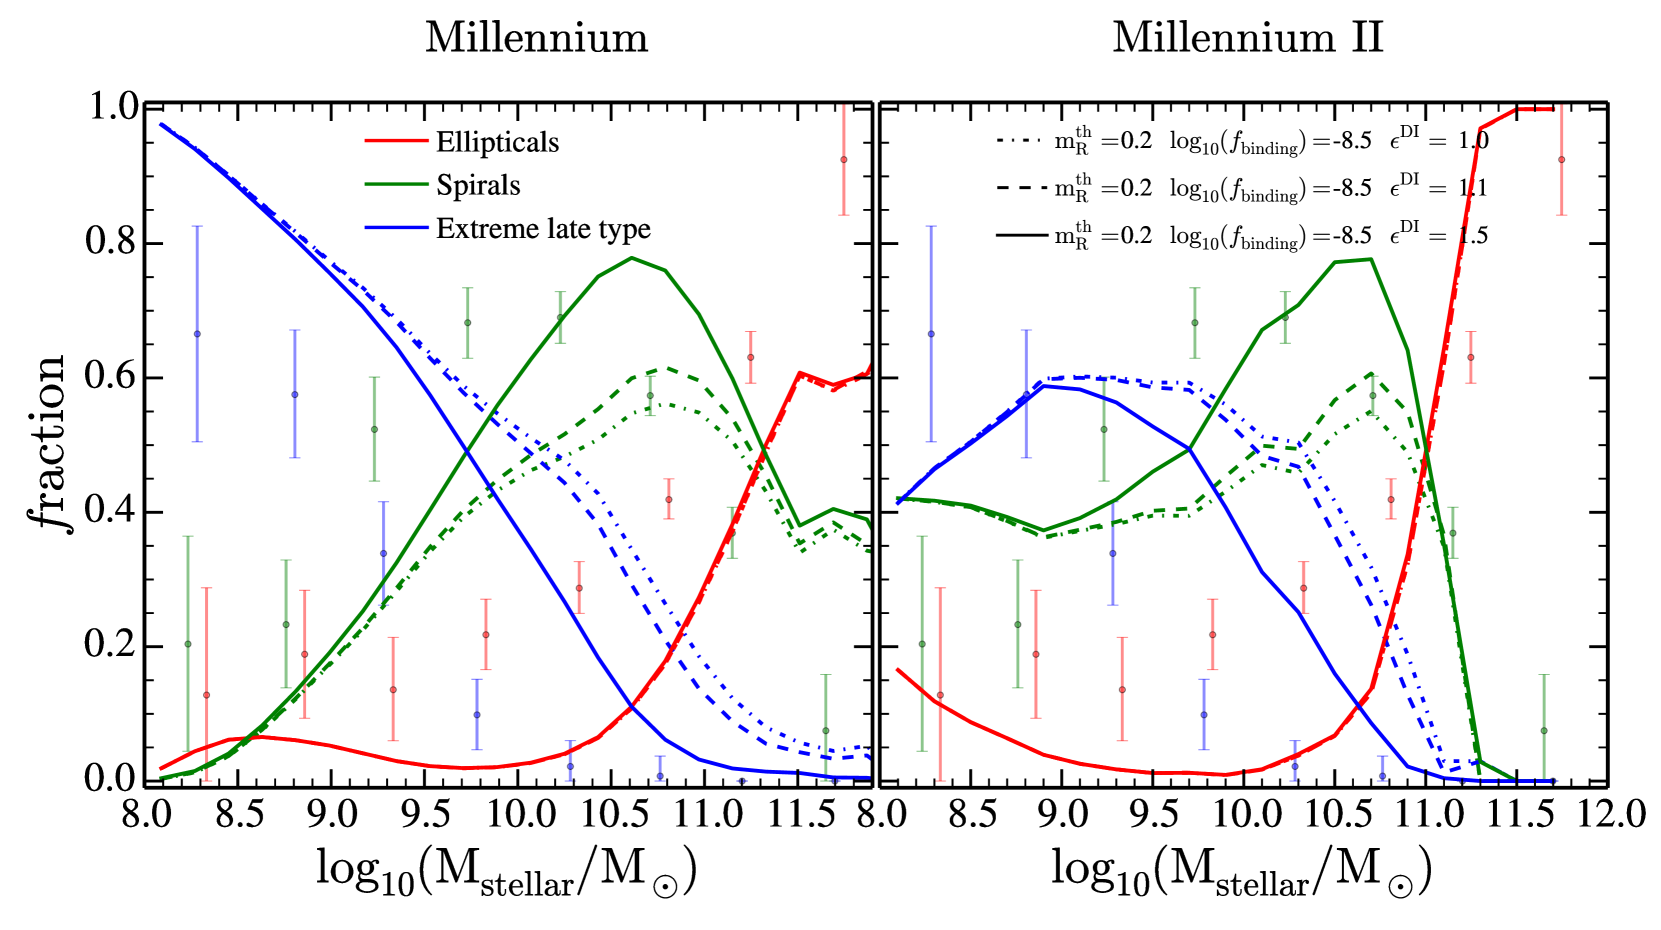
In Fig 1 we show how the standard L-Galaxies model recovers the morphological distribution of galaxies, as a functions of stellar mass, for both the MS (left) and MSII (right) runs. Lines refer to ellipticals (red), spirals (green) and extreme late types (blue), while coloured dots represent a collection of observational data, as in Conselice, (2006)333Conselice, (2006) defined ellipticals as galaxies with a morphological type T within , which would corresponds to bulge-to-total ratios of about (see Mo et al.,, 2010; Simien and de Vaucouleurs,, 1986, for more details). Morphological types definition is somewhat arbitrary (see Lagos et al.,, 2008; Guo et al.,, 2011; Gargiulo et al.,, 2015); in what follows we define extreme late types, spirals and ellipticals as galaxies with bulge-to-total ratios (hereafter ) of, respectively, , and . As we can see, Fig 1 in dash-dotted lines shows that the Henriques et al., (2015) standard version of L-Galaxies (, and ) reproduces the general trend presented in Conselice, (2006) on both MS and MSII. Nevertheless, in both cases the population of (extreme late-type) spiral and elliptical galaxies is (over-) under-predicted in the range (blue, green and red solid lines, respectively). Besides, the MSII does not converge with the MS, showing a large excess with respect to observations in the spiral population at low stellar masses .
After a detailed analysis of the impact that the current treatment of merger events has in the definition of galaxy morphology and its dependence on the resolution of the DM simulation used, we found that an improvement in the morphological distribution of galaxies and a reasonable convergence between MS and MSII can be reached when including the following two modifications: (i) set the threshold between major and minor mergers to the value and (ii) introduce a new approach in the treatment of extreme minor-mergers. The first modification leads to a better convergence between the MS and the MSII in terms of the number density of major merger events (see the details in Appendix B), and helps increasing the fraction of spirals in galaxies below , as can be seen in Fig 1 (dashed lines). The second change has a very strong effect on both the convergence of the number density of minor merger events and on the morphological distribution of small galaxies (i.e, ). In this mass range star formation in the disk can stall, as the cold-gas content of these low-mass galaxies is typically too low to trigger star formation444in L-Galaxies the threshold for star formation is (see Eq.S14 of Henriques et al., (2015)). Note that a more accurate description of star formation might come by linking this process with the molecular gas component instead of the total cold gas (see Lagos et al., (2011)), as also discussed in Henriques et al., (2015). Therefore, the only events leading to morphological changes for galaxies with are mergers. In the MSII, in particular, these small galaxies experience a significant number of extreme minor mergers, as the simulation is able to resolve much smaller structures compared to the MS (the most extreme and numerous encounters are with satellite galaxies of the order of ). If such extreme interactions are treated as normal minor mergers the bulges of these small galaxies grow by incorporating the stellar mass of the satellites, while their disks are unable to increase in mass, as star formation is stalled (and merger-induced bursts are negligible as less than 0.2% of the cold gas mass is transformed into stars). This leads to the large fraction of spirals (and lack of extreme disk), as shown in Fig 1 with dash and dotted lines.
We thus update the model, introducing a new set of prescriptions to treat these extreme minor mergers, to which we refer with the term smooth accretions (see e.g. Abadi et al.,, 2003; Peñarrubia et al.,, 2006; Sales et al.,, 2007; Kazantzidis et al.,, 2008). In those extreme minor mergers, one might expect that the stellar satellite mass might not be able to reach the bulge of the central galaxies, but gets disrupted by the disk of the central galaxy and get incorporated by it.
We make use of the ratio between the binding energies of the merging structures to disentangle between normal minor mergers and smooth accretion episodes. We assume that the interacting (sub-)systems are i) the whole stellar satellite galaxy and ii) the central galaxy stellar disk (gas+stars), we compute the satellite by considering the entire satellite stellar mass, and only the disk mass (gas+stars) for the central galaxy, respectively:
| (1) |
where is the mass-weighted average half-mass radii of the satellite bulge and disk, while is the same quantity for the disk of the central galaxy (as it is composed by both gas and stars). The larger the value of , the closer are the binding energies of the merging galaxies, so the remnant of the satellite galaxy might survive the interaction with the central disk and reach the centre of its massive companion (usual minor merger). On the opposite case, we assume that the central galaxy can easily unbound the satellite stellar system, which will be incorporated in the central galaxy disk (smooth accretion). Following this approach, the best agreement with observational data is obtained by imposing as a threshold value to discriminate between the two scenarios. This low value of corresponds more or less to a cut in satellite stellar mass , as it is shown in Fig 22 of Appendix B. As can be seen in Fig 2, by imposing we obtain a remarkable agreement in the minor merger predictions for both MS and MSII merger trees (see blue solid lines). Concerning the smooth accretion events (blue dotted lines), MSII and MS merger trees display different predictions. In the former, the smooth accretion has 1 dex larger number density than in the latter, being the dominant type of interaction at any redshift.
To summarize:
with and . The results obtained with this new recipe for both MS and MSII are shown with solid lines in Fig 1. Our new prescription leaves the morphology distributions almost unchanged in the case of the MS, while it improves them for the MSII, providing a better agreement between data and model predictions. A detailed analysis showing the morphology evolution with respect to and parameters can be found in Fig 23 of Appendix B.
Finally, as we can see in Fig 1, in spite of the morphological improvements achieved at low stellar masses by changing the merger recipe of L-Galaxies , we can not find a significant improvement in the intermediate population . From this, we can draw a simple conclusion: mergers do not have the dominant role in this range of masses. In the next section we will explore the effects of the other bulge formation channel (disk instabilities) in the galaxy morphology.
2.3 Disk instabilities: the growth of pseudobulges and classical bulges
In addition to mergers, the disk instabilities (DI) channel is an important pathway for bulge growth in L-Galaxies . Within the context of this work, DI refers to the process by which the stellar disk becomes massive enough to be prone to non-axisymmetric instabilities which ultimately lead to the formation of a central ellipsoidal component via the buckling of nuclear stellar orbits (see references in Mo et al.,, 2010). During this process, a possible result is the formation of a bar structure (Kalnajs,, 1972; Ostriker and Peebles,, 1973; Combes and Sanders,, 1981; Efstathiou et al.,, 1982; Pfenniger and Norman,, 1990; Mo et al.,, 1998; Athanassoula,, 2005; Sellwood,, 2016). Galactic bars have a deep impact the morphology of the nuclear parts. On one hand, they can efficiently modify the gas disk structure via gravitational torques able to produce strong nuclear gas inflows which can be transformed into stars inducing the formation of disc-like pseudobulge structure. On the other, shortly after the bar formation the structure can experience a bending mode that thickens it and forms a boxy/peanut pseudobulge (see e.g. Pfenniger and Norman,, 1990; Kormendy and Kennicutt, 2004b, ; Saha,, 2015; Spinoso et al.,, 2017). The L-Galaxies model accounts for galactic DI with a simple analytic stability criterion, based on the Efstathiou et al., (1982) and Mo et al., (1998) 2d simulations:
| (2) |
where is the maximum circular velocity of the host dark matter555We found no significant differences in our results when using the disk circular velocity . This definition is obtained by assuming an Hernquist (Hernquist,, 1990) and NFW (Navarro et al.,, 1996) profile for the bulge and DM halo, respectively., and are the exponential scale-length and stellar mass of the stellar disc respectively and a parameter which determines the importance of the disk self-gravity (set to in the standard version of L-Galaxies ). If this stability criterion is met, an amount
| (3) |
of the disk stellar mass is transferred to the bulge in order to restore the disk (marginal) stability. Despite the limitations of Eq.(2) (see Athanassoula,, 2008), this criterion to follow disc stability has the advantage of being simple and to depend only on global galaxy properties, accessible by the model.
According to Efstathiou et al., (1982); Mo et al., (1998) for a family of exponential-profile stellar disk models. Nevertheless, in order to improve the morphology at intermediate stellar masses and following the approach of other SAMs (Hirschmann et al.,, 2012; Menci et al.,, 2014; Lacey et al.,, 2016; Lagos et al.,, 2018) we have tested the model with different values of DI stability parameter, . The results are presented in Fig 3. As we can see, we found that a slightly higher value (namely ) provides a better agreement with observations in the mass range . The change of parameter value causes galaxies to be more easily prone to instabilities, thus a larger fraction of stars is transferred from the disk to the bulge component, increasing the fraction of spirals and reducing the one of extreme late types in this mass range. Notice that the change of does not have any impact in the elliptical population. In a recent paper, Irodotou et al., (2018) achieved a better improvement of the spiral and elliptical population in L-Galaxies by imposing angular momentum losses during the gas cooling and allowing DI in the galaxy gaseous disk. Nevertheless, the results were not checked in MSII. Here we decide no to use that approach and keep our independent merger/disk instability analysis which lets us reach the convergence between MS and MSII and update/ improve the L-Galaxies standard merger recipe. Besides, we have checked that the increase of the stability parameter has a similar effect in the spiral galaxy population that the one achieved by adding angular momentum losses during the gas cooling.
2.3.1 A discretization effect: Linking different DI events as a single episode
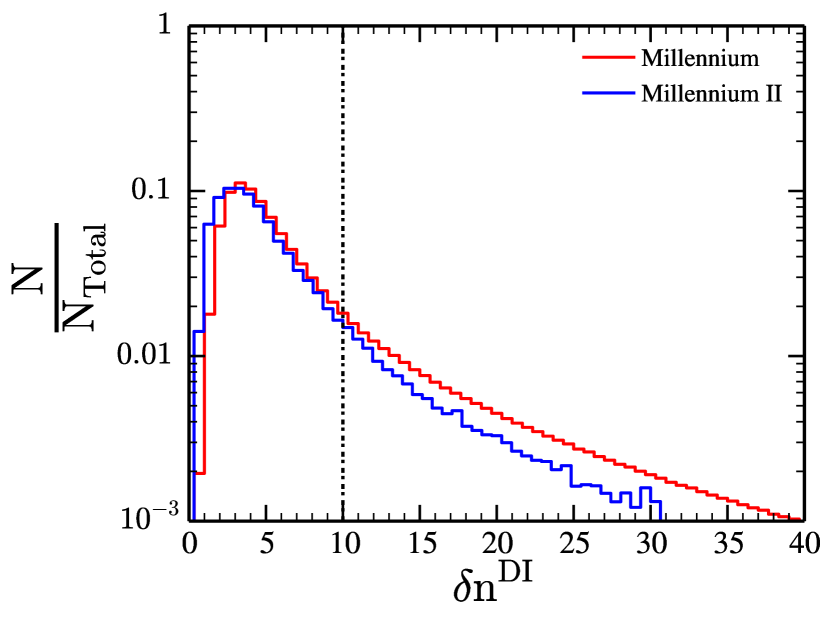
The adopted approach to treat DIs in L-Galaxies (see Section 2.3), is such that galaxy equilibrium is restored by transferring the minimum amount of mass from the disk to the bulge. This means that the disk easily becomes unstable again in the one (or more) of the subsequent sub-step. This generates a series of disk instabilities in a galaxy which are, effectively, all connected. This is especially true in systems in which the cooling rate is high enough to quickly replenish the stellar disk (Porter et al.,, 2014). While two consecutive disk instability events (in two subsequent sub-steps) can be easily assumed to be part of the same event, connecting events which are more spread in time is less straightforward. In order to join separate DI events, thus erasing the discretization effects of the time resolution of the simulation, we start by studying the typical time difference between two no-consecutive DIs in the same galaxy. For this, we define the quantity , defined as the time-difference between two events and normalized by the dynamical time of the galaxy:
| (4) |
where is the lookback time of the current DI, is the lookback time in which the galaxy experienced the last disk instability and is the dynamical time of the stellar disk at the epoch of the last DI. The distributions of for MS (red) and MSII (blue) are presented in Fig 4. As we can see, both distributions present a clear peak at values of , indicating that a large fraction of DI events are separated by few dynamical times, and are likely causally connected. We then assume that DI events which are separated by less then are causally connected. In what follows, we will assume a threshold value of . We have checked that the results presented in this paper have a very weak dependence on the exact value of the threshold for , as long as the peak of the distribution is included in the sample.
2.3.2 From disk instabilities to bulges: merger-induced vs. secular processes
Disk instabilities presented in L-Galaxies have been already used to study spheroidal components (see Shankar et al.,, 2012, 2013). In the model presented here, we re-visit the way DI are treated, by linking DI to the formation of both classical bulges and pseudobulges. Following the history and the physical conditions of the galaxy in which a DI takes place, we are able to distinguish between instabilities that are merger-induced and the ones that are a consequence of the slow, secular evolution of galaxies. Here we describe the details of how to discriminate between different instability events, and how these events lead to the build up of classical bulges and pseudobulges.
On one hand, merger-induced DIs are produced as a consequence of the fast increase of stellar disk mass after the collisional starburst or smooth satellite galaxy accretion. On the other hand, secular DIs result from the slow, but continuous, mass growth of the disk, playing an important role in galaxies evolving in isolation.
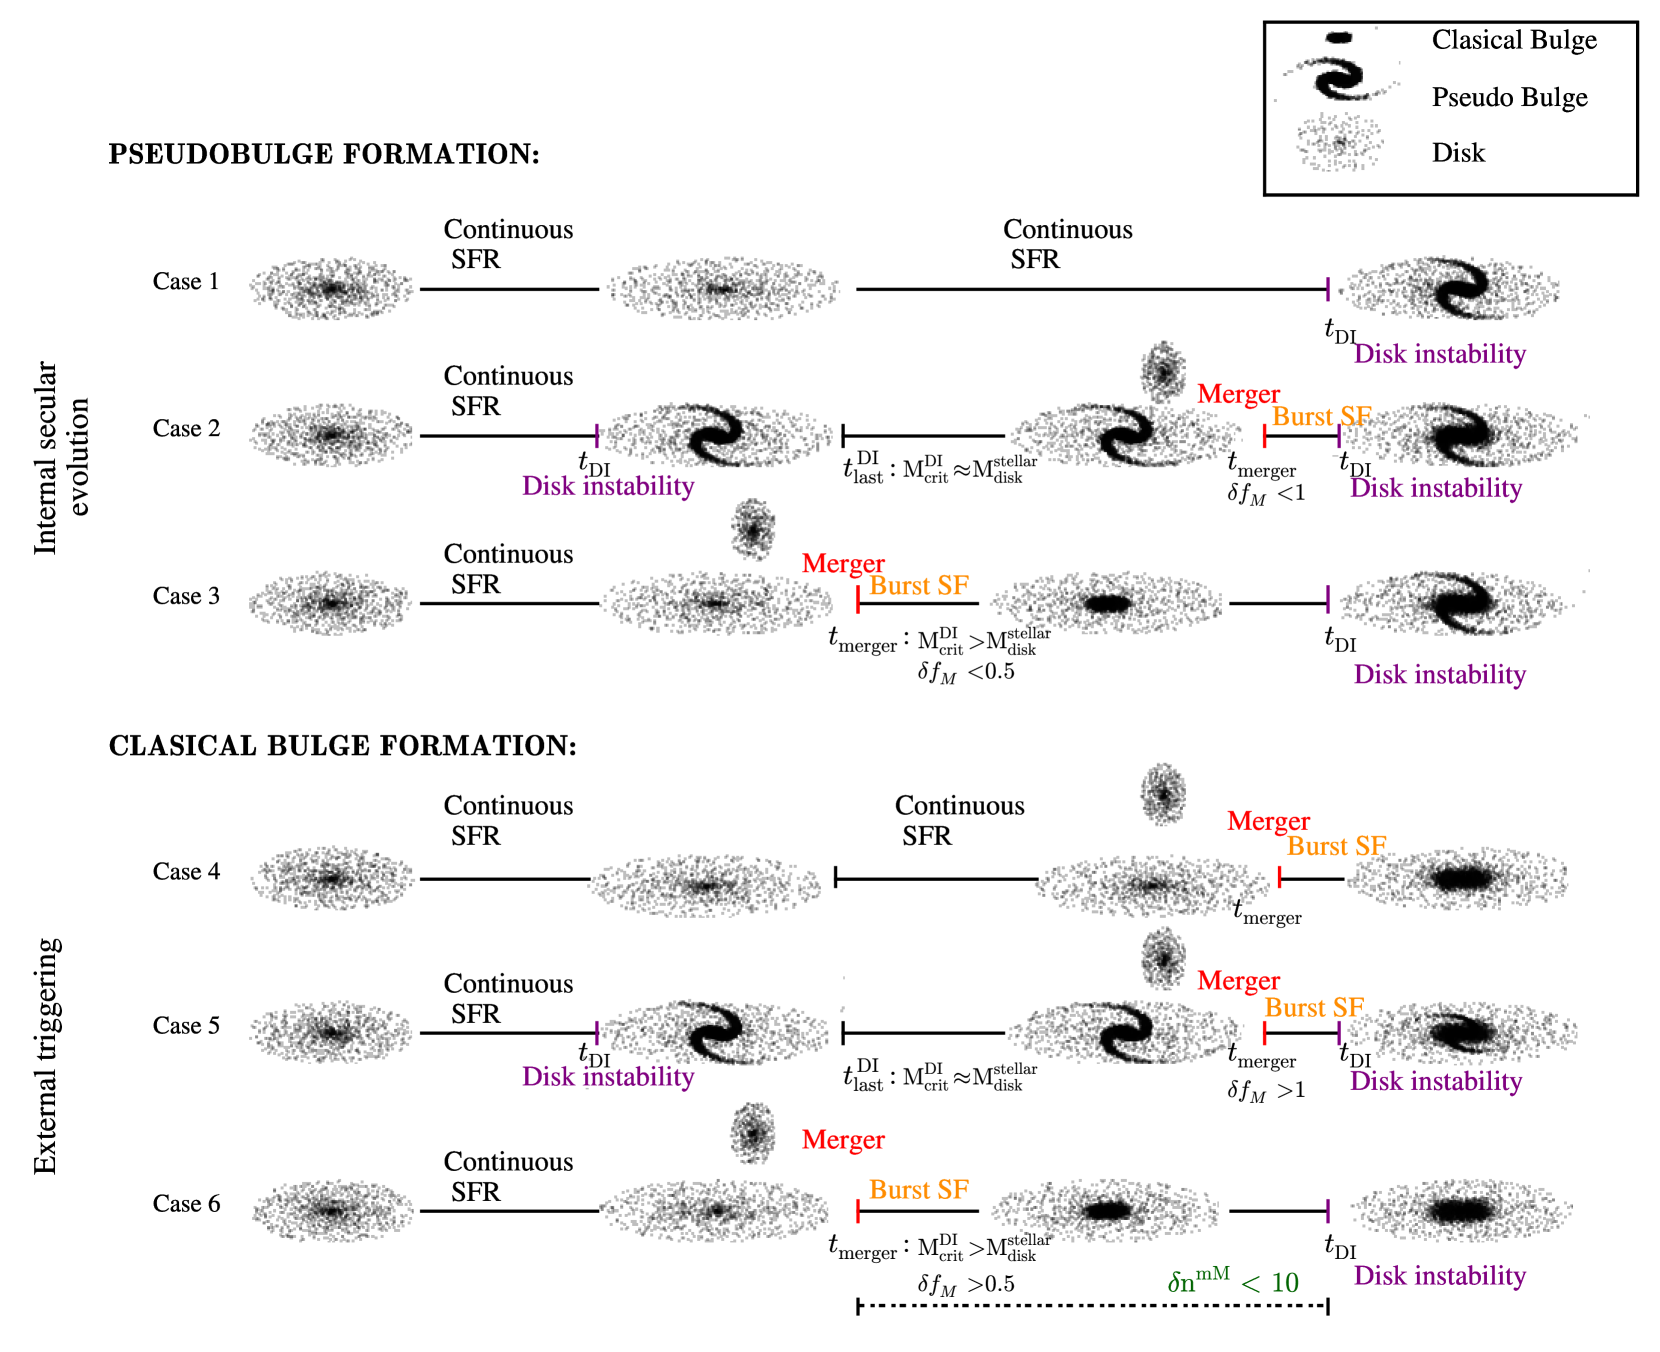
Under the assumption that bars are a consequence of the secular evolution of galaxies (Debattista et al., (2004, 2006); Méndez-Abreu et al., (2010); Kormendy and Ho, (2013); Kim et al., (2016); Moetazedian et al., (2017); Zana et al., 2018a ; Zana et al., 2018b ) and that bars lead to the formation of pseudobulges666Numerical simulations have shown that shortly after the bar formation the structure suffers a bending mode that thickens it and forms the boxy/peanut pseudobulge shape (see Combes et al.,, 1990; Méndez-Abreu et al.,, 2019). Also galactic bars can produce, via gravitational torques, strong nuclear gas inflows which can be transformed into stars inducing the formation of disc-like pseudobulge structure., we link secular DIs to the formation of galactic bars and pseudobulges. Therefore, we assume that the mass removed to the disk during the DI phase (according to Equation 3), is transferred to the pseudobulge, which we treat as a new component of the galaxy. On the other side, merger-induced DI, closely associated with injection of external stars or/and SF burst triggered during the interaction, are assumed to be the ones that lead to the formation of a classical bulge structure. In Fig 5 we present an illustrative scheme of the scenarios that lead to the growth of both the pseudobulge and classical bulge component of the galaxy. Case 1 and Case 6 are the two simplest scenarios, as described above. In the first case, the galaxy experiences continuous star formation until the disk becomes unstable, forms a bar and the stellar component removed from the disk is transferred to the pseudobulge. In Case 6, the galaxy, starting from a stable configuration, experiences a merger (either a minor merger or a smooth accretion as described in Section 2.2.1), which triggers a burst of SF that causes the disk to become unstable, and the stellar component removed from the disk to restore stability is effectively transferred to the classical bulge component.
However, the life of a galaxy can be rather complicated, with continuous mergers and episodes of star formation, that make it more difficult to discriminate between the two scenarios. Naively we could think that a DI which takes place right after a merger is a consequence of it. Nevertheless, this is not necessarily true. In order to quantify the importance of a minor merger or a smooth accretion in triggering a DI event, we are going to study how efficient is the interaction in injecting new stars in a stable (or marginally stable) disk. To check that, we introduce the quantity , defined as follows:
| (5) |
where is a unit step function, whose value depend on the type of interaction: for minor mergers () and for smooth accretion events (), as explained in Section 2.2.1. The first condition refers to events in which the disk is stable () at the time the merger takes place (). In this case, indicates how much the stellar disk grows with respect to how stable the disk is (). If the interaction is a minor merger the entire stellar component of the satellite is transferred to the bulge of the central, and the only new contribution to the disk is given by the burst of SF, . In the case of smooth accretion, the stellar disk of the central galaxy increases its mass not only through the SF burst, but also by incorporating the stellar component of the satellite, as described in Section 2.2.1.
The larger is the , the stronger the impact of the merger on the next DI event. In the upper panels of Fig 6 we present the distribution of for the MS (left panels) and MSII (right panels) for all the events which satisfy the first case of Eq.(5). The values of are shown separately for smooth accretion (blue) and minor merger events (red). The differences in the relative abundance between minor mergers and smooth accretion in MS and MSII is just a consequence of resolution, as already discussed in Section 2.2.1. Except for the differences due to resolution effects, distributions of for both minor merger and smooth accretion peak at low values () for both simulations. This points to the conclusion that most of the interactions have a minimum contribution in the DIs happening after mergers. The small fraction of events characterized by high values, however, can have a considerable impact on a subsequent disk instability.
To differentiate between interactions that are responsible to a DI and the ones that do not, we set the limit to : only the minor mergers/smooth accretions that reduce the galaxy disk stability are assumed to be responsible for the following DIs.
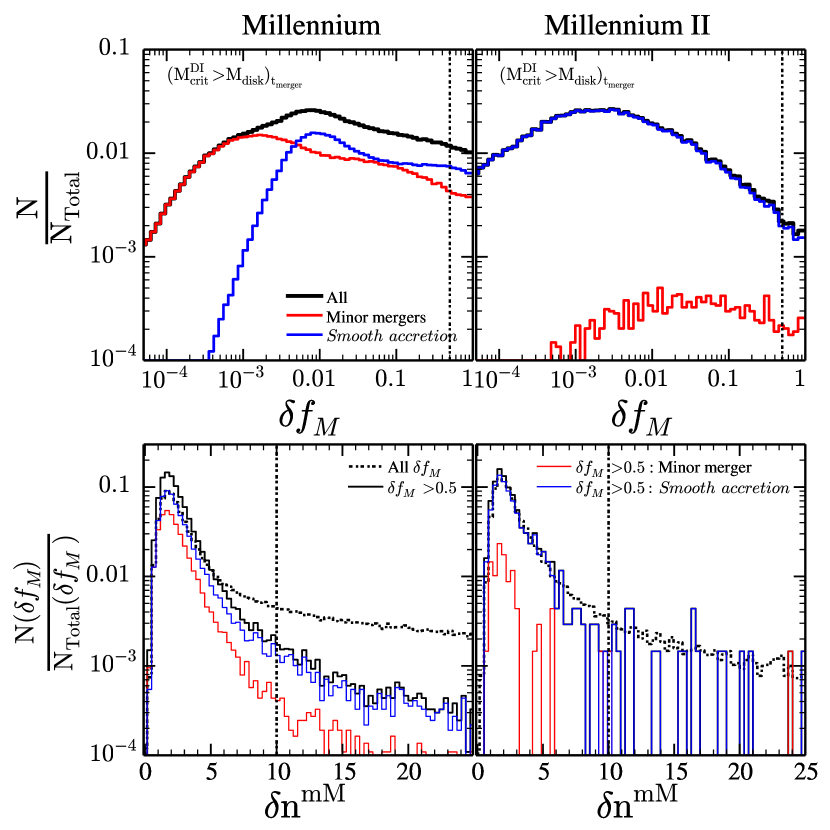
In addition to the condition, we have also imposed that the mergers/smooth accretions have to be causally connected to the subsequent DI, by imposing a maximum time scale that can pass between the two events, defined to be a multiple of the dynamical time of the galaxy stellar disk at the moment of the interaction. To set this value, we analyze the quantity , defined as:
| (6) |
where is the lookback time of the last minor merger or smooth accretion, is the lookback time of the first DI after the galaxy interaction and is the dynamical time of the galaxy stellar disk at the moment of the interaction. The distribution of for both the MS and the MSII are shown in the lower panels of Fig 6. As we can see, the distribution of is more concentrated towards lower values when we consider only events with (solid black lines). Interestingly, the distribution of peaks close to few number of dynamical times () with a very sharp decrease at large . This is a clear signal that the smooth accretion and minor merger are responsible for the triggering of a subsequent instability. Moreover, when we distinguish between minor merger and smooth accretion (red and blue lines respectively), we find that the distribution of for minor mergers is more concentrated towards lower values than the one for smooth accretion events. This suggests that minor mergers are typically able to destabilize the galaxy disk in shorter times scales than smooth accretion.
Based on these results, we set that all instabilities happening within dynamical times from the interaction (), and for which , are merger-induced. These events thus lead to the growth of the classical bulge component (Case 6 in Fig 5). On contrary, all DI events for which or and are assumed to be secular processes which contribute to the formation of a bar and a pseudobulge (Case 3 in Fig 5).
Finally, the second case in Eq.(5) addresses the peculiar case in which a merger event happens in a galaxy characterized by a marginally stable disk after a DI, i.e (with ). In this cases the DI is induced immediately (). However, it is difficult to say if the merger was a necessary phenomena to trigger a DI in the galaxy given that any event producing stars (either internal SF or merger burst) would rise the disk stellar mass over the critical threshold. Despite this cases are not as common as the ones described by the first case in Eq.(5) (less than the of the whole DI merger-induced) we still take into account them by studying the relative importance of the interaction with respect to the continuous star formation happening in the disk in the triggering of the subsequent DI. When , i.e , we assume that the minor merger/smooth accretion dominates the disk growth and the subsequent DI is merger-induced (Case 5 in Fig 5). Otherwise we assume the DI to be of secular origin (Case 2 in Fig 5).
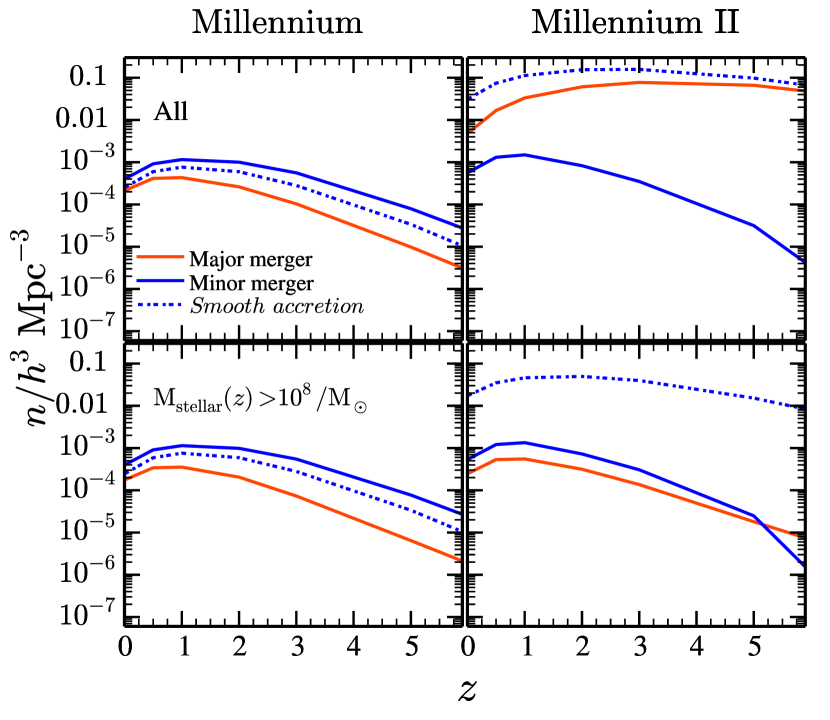
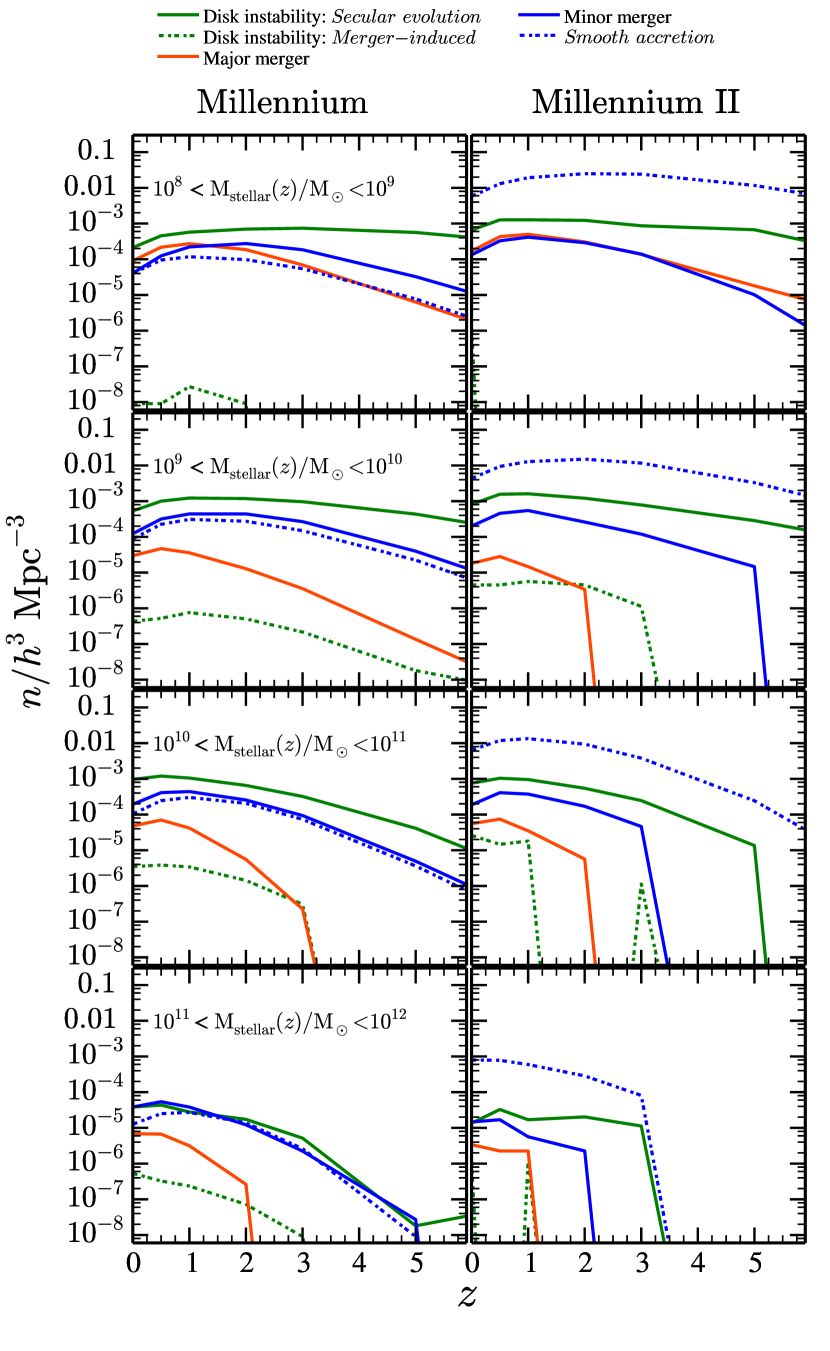
In Fig 7 we present the predicted number density of secular and merger-induced DIs777In both types of DIs, we correct for time-discretization effects using the procedure presented in Section 2.3.1(solid and dashed green lines, respectively) for different stellar mass ranges. Left and right panels are, respectively, the L-Galaxies predictions run on top of MS and MSII merger trees. For completeness, we have added the predictions of major/minor mergers and smooth accretion. As we can see, secular DIs evolution dominates the DI number density, being merger-induced DIs less abundant. Even though Fig 7 shows that DI secular events dominate over mergers in all mass bins, this does not mean that the importance of such events is the same. For instance, galaxies with stellar mass in the range secular DI contributes with to the bulge per event while galaxies with the DI secular events are characterized by of mass transferred (these numbers corresponds to DI events defined as in Section 2.3.1).
About the redshift distribution, secular evolution DIs take place at any redshift and they are the main mechanisms of bulge formation/growth at high-. On contrary, merger-induced DIs occur at with a sharp cut-off towards higher redshifts. Even more, they are rare events at . Besides, we can see that merger-induced DIs can not compete at any redshift with mergers (major/minor) in the classical bulge formation/growth given that their number density is a factor smaller and the amount of mass transferred per event is less than the % of the whole galaxy stellar mass. Nevertheless, these events can complement classical bulge build-up at low redshifts. As can be seen, both MS and MSII predicts similar redshift distributions for the merger-induced DIs and secular DIs, and similar values of number densities, even though the MSII predicts slightly larger number densities of merger-induced DIs, as the number of smooth accretion is much larger than in the MS.
We want to highlight that, in a hierarchical universe, each case presented in Fig 5 does not live in isolation. Due to the complex merger history that a galaxy can experience, the final bulge can be the result of a multiple physical processes, being a composite structure formed by both classical and pseudobulge component (see, Erwin et al.,, 2015; Di Matteo et al.,, 2015; Fragkoudi et al.,, 2017; Blaña Díaz et al.,, 2018). For simplicity, we are going to use the following criteria to define galaxy bulge morphology:
-
•
Pseudobulge: We assume that a galaxy hosts a pseudobulge when the fraction of bulge formed via secular induced DI is at least 2/3. This cut allows us to be confident about the fact that the pseudobulge is the dominant structure in the bulge. Galaxies hosting this type of structures are going to be tagged as pseudobulge galaxies.
-
•
Classical bulge: The fraction of bulge formed via secular induced disk instabilities is smaller than 2/3 of the total bulge mass and its bulge-to-total is . Galaxies with are considered bulgeless galaxies. Galaxies hosting this type of bulges are going to be called classical bulge galaxies.
-
•
Ellipticals: The fraction of bulge formed via secular induced disk instabilities is smaller than 2/3 of the total bulge mass the bulge-to-total ratio is . Galaxies hosting this type of bulges are elliptical galaxies.
3 Results
In this section we present the main findings of this work. We first focus on characterizing the properties of pseudobulges and host galaxies at different cosmic times. We then explore the structural properties of pseudobulges predicted for the local universe and compare with available data.
3.1 Pseudobulges across cosmic time
In Fig 7 we have shown that secular DIs are quite frequent at all cosmic times and for a broad range of stellar masses, although we discussed that the amount of mass transferred to the pseudobulge component is very modest for galaxies with . We thus do not expect a significant pseudobulge component in small galaxies. Using the criteria described at the end of the last section to select pseudobulges, we study the properties of their hosts across cosmic time.

In Fig 8 we present the typical halo and stellar masses of galaxies hosting pseudobulges at different redshifts, for both MS (solid line) and MSII (dashed line). As expected, galaxies hosting pseudobulges are tipically more massive than . In particular, we find that pseudobulges tend to be hosted by galaxies in a relatively small range of stellar masses, with values mildly evolving with time. In the MS the typical host stellar mass grows from at to at . A similar trend is shown also by MSII, even though smaller masses are reached at higher redshifts. Despite this little difference, the MS and MSII simulations agree within confidence level at any redshift. On the halo mass side, pseudobulges are hosted in Milky Way-like halos (i.e ) at in both MS and MSII. Moreover, the typical halo mass evolution seems to be truncated at , where the increasing trend exhibited from at up to at , changes into a decreasing tendency. We interpret this as a consequence of the hierarchical growth of structures: pseudobulge galaxies are less likely to be hosted by very massive halos at low-, as these halos are closely related to major mergers events who deeply impact the host galaxy structure erasing any secular evolution characteristic.
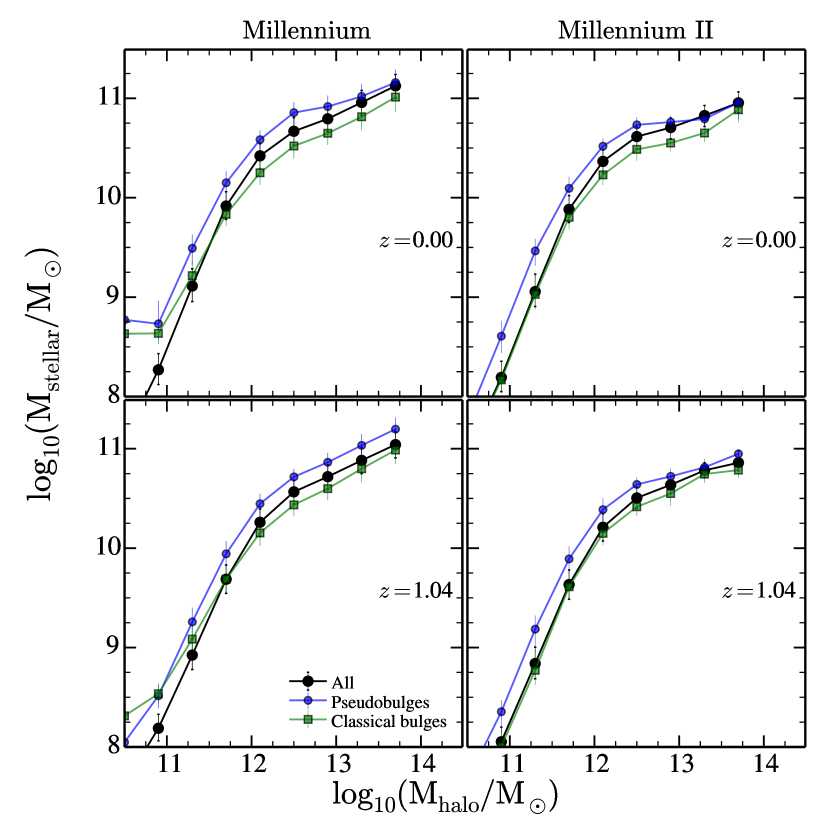
To understand if pseudobulge are hosted in peculiar type of galaxies with respect to the standard population, in Fig 9 we show the plane at different redshifts for MS and MSII (right and left respectively)888We have done the same plot dividing between central and satellite galaxies. No difference with the Fig 9 has been found.. As can be seen in the relation, galaxies which display a dominant pseudobulge structure (blue dots) are systematically above the galaxy median relation (black dots) at any redshift, i.e., at fixed halo mass, pseudobulge structures are hosted by galaxies more massive than the median population. On contrary, when we place the classical bulge galaxies (green dots) on the plane, it is evident that they populate a different region. While for classical bulges lie on the median relation, in the most massive halos () their host galaxies are characterized by systematically smaller stellar masses (notice that the results for the range suffer of low-resolution statistics in the case of the MS). As we will see later in Section 3.2.1, pseudobulges are typically hosted by star forming galaxies, while classical bulges tend to live in more quenched systems, explaining why pseudobulges tend to have higher stellar content than classical bulges, at a fixed halo mass.
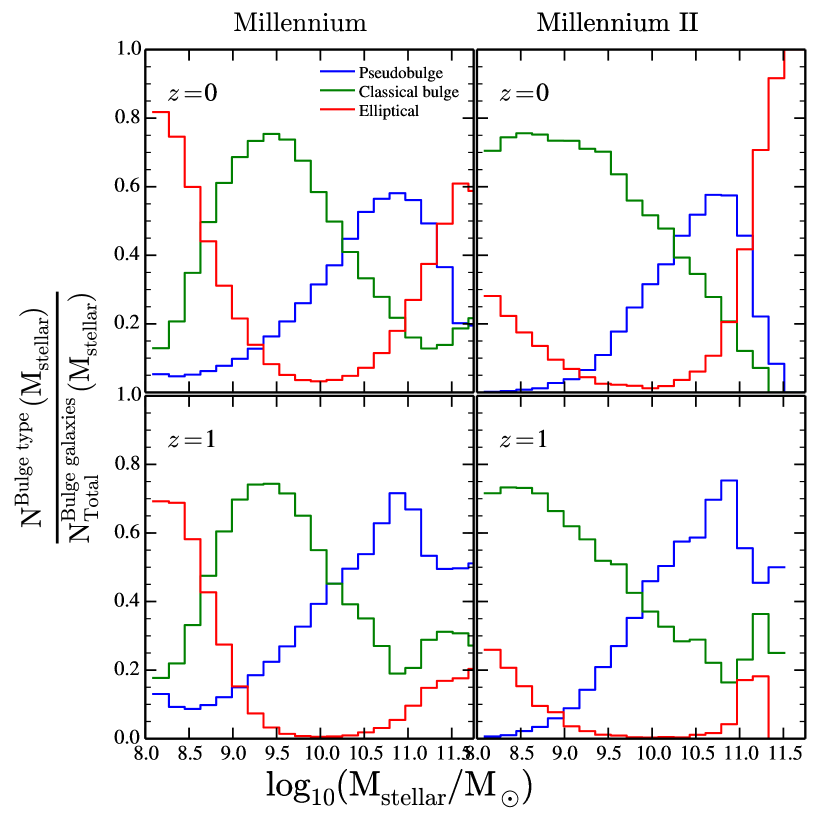
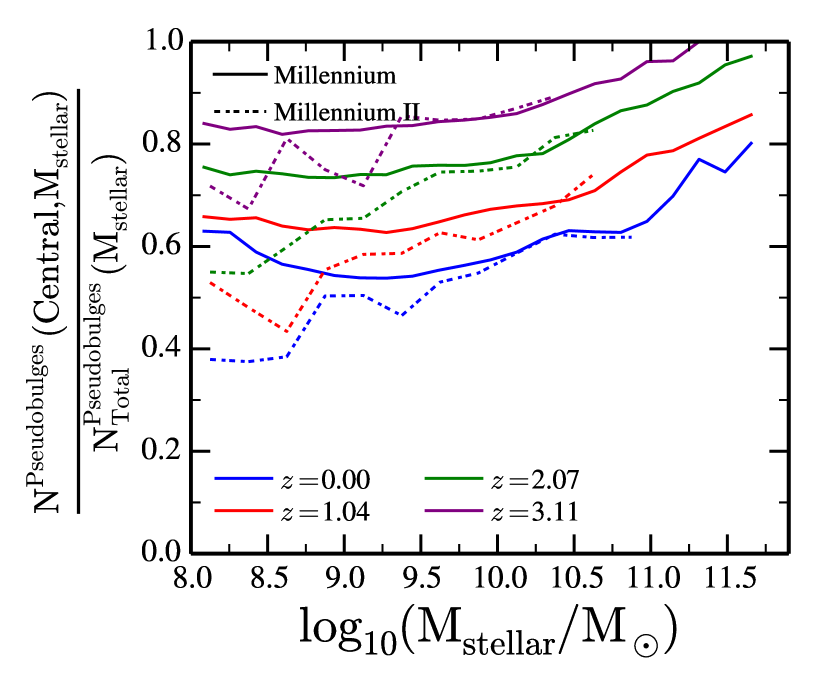
To see the relative importance of different classes of galaxies, in Fig 10 we show the relative contribution of pseudobulges (blue), classical bulges (green) and elliptical (red) galaxies to the total population of galaxies with a bulge (i.e. ), at different stellar masses. Results at and are shown respectively in first and second row. At both MS and MSII show that pseudobulges are the main type of galaxies at large stellar masses (i.e, ) while classical bulges and ellipticals are the main ones for . While at low masses there is little evolution between and , at high masses we find that, by , ellipticals dominate the galaxy population. As previously discussed, this is a result of the hierarchical growth of structures: pseudobulges hosted in the most massive galaxies at high-z are subsequently destroyed by major mergers which turn galaxies into pure bulges (see example of Fig 17). Additional support to this picture can be gained by studying the fraction of pseudobulge galaxies who are centrals of their FoF group, as a function of redshift. Fig 11 shows that of pseudobulges at were centrals (with larger fractions reached for more massive galaxies stellar mass), and the percentage drops to at . This points out that pseudobulge galaxies are less likely to be hosted in the central subhalo of their FOF at low , independently of their stellar mass. This trend is well followed by both MS and MSII at high stellar masses, while at small ones MSII predicts slightly larger fractions of satellite pseudobulges. Note that this difference is consequence of the MS halo mass resolution issues at . Therefore, we rely in the MSII predictions whose limitation is at .
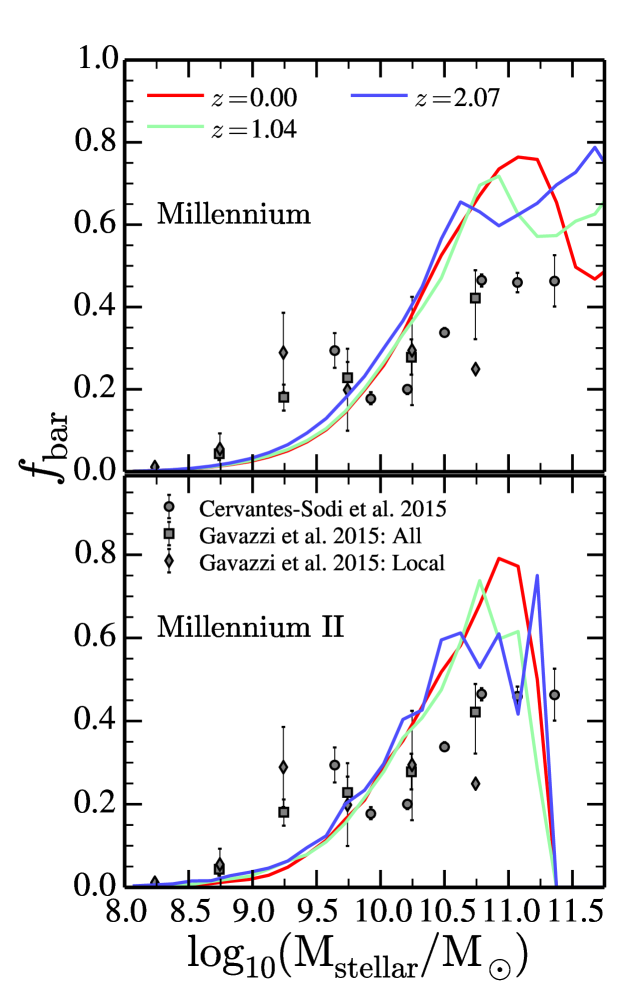
Finally, in Fig 12 we present the bar fraction as a function of redshift and stellar mass for the two simulations. We have defined as the number of galaxies hosting a pseudobulge over the total number of spiral galaxies () in a given bin of mass and redshift. The fraction of pseudobulge in spiral galaxies has a peak at with a sharp cut-off towards low stellar masses. This trend is broadly in agreement with the observational results of Cervantes Sodi et al., (2015) and Gavazzi et al., (2015). The fact that our predictions lie above is reassuring, as we regard our fraction as upper limits, given that a fraction of galaxies that we tag as pseudobulges might not have a clear detectable bar.
3.2 Pseudobulges and their hosts in the local universe
In this last part we analyze the properties of pseudobulge galaxies such as star formation and stellar age (Section 3.2.1), structural properties (Section 3.2.2), redshift of the last major/minor interaction and pseudobulge structure formation (Section 3.2.3).
3.2.1 Star formation in pseudobulge galaxies
In the previous section we have seen that, at fixed host halo mass, pseudobulges tend to live in galaxies more massive than what predicted by the median - relation. Pseudobulge galaxies thus seem to not suffer from the same quenching mechanisms that other galaxies experience (e.g., AGN feedback) and that cause massive galaxies to be inefficient star forming engines. When looking at the star formation properties of local pseudobulges predicted by the model, we find indeed that galaxies hosting a pseudobulge are efficient in producing stars.
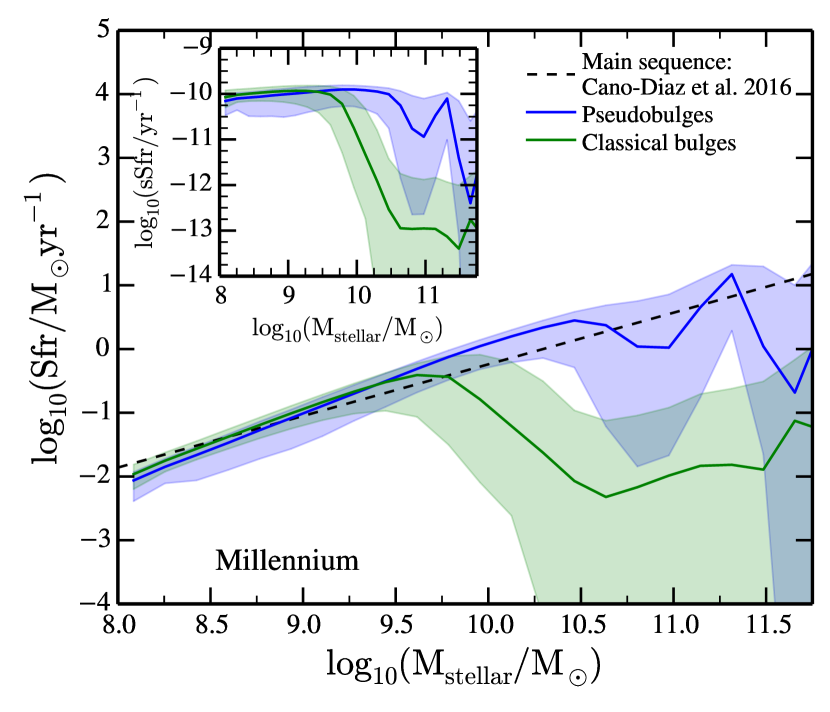
We show this in Fig 13, where pseudobulges and classical bulges predicted by the MS are shown in the Sfr- plane. To guide the reader we have added in dashed black line the main sequence999The main sequence is defined as the relation of actively star-forming galaxies which relates their star formation rate and their stellar mass (Brinchmann et al.,, 2004; Noeske et al.,, 2007; Cano-Díaz et al.,, 2016) of star formation form Cano-Díaz et al., (2016). At the hosts of both classical and pseudobulges follow the main sequence. At higher stellar masses, however (), pseudobulges and classical bulges follow two different trends. While the former population remains on the main sequence and only starts deviating for very massive systems, classical bulges present a clear shift in their relation, falling in the red sequence region with of lower star formation than pseudobulges. In the inset of Fig 13 we show the plane specific star formation rate (sSFR) - . As we can see, the trend is similar to the one.
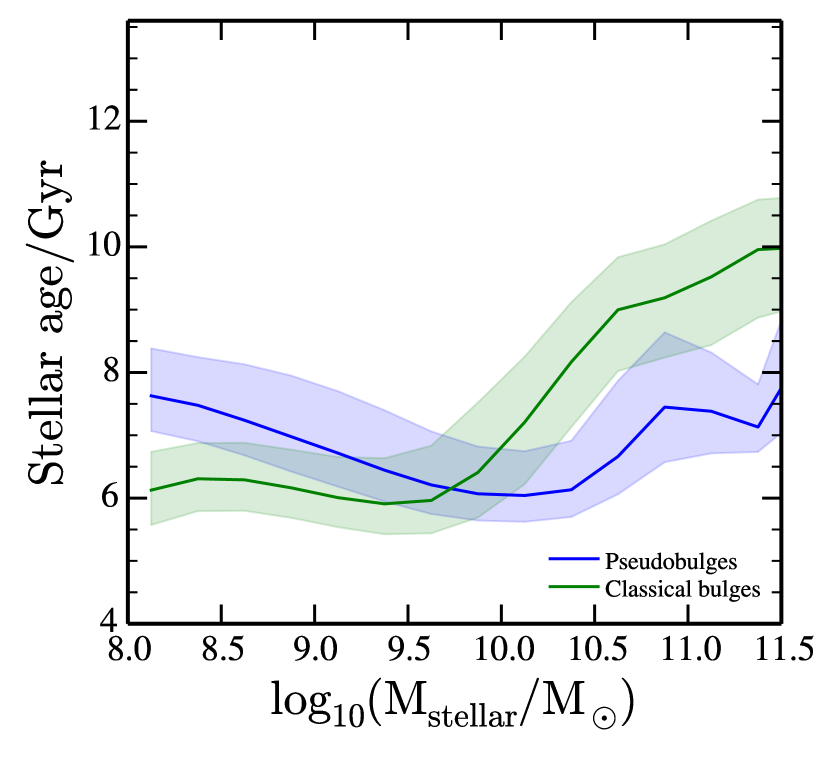
Fig 14 shows instead the mass-weighted age of the stellar population in pseudobulge and classical bulge galaxies. While the typical age of stars in pseudobulge galaxies seems shows a very weak dependence with stellar mass, classical bulges hosted in massive galaxies are significantly older. At low masses (i.e, ), instead, classical bulges are hosted by galaxies with slightly younger average stellar populations. This is due to the different merger history of classical bulges and pseudobulges as we will show in Fig 16. In this mass range, in fact, almost all the classical bulges experienced at least one minor (major) mergers at which rejuvenated the galaxy population via SF burst. On contrary, pseudobulges did not suffered any (major) minor merger and their stellar population only grew via internal star formation. We remark here that also classical bulges in massive galaxies experience mergers at recent times, but, as discussed above, star formation in these galaxies is quenched by AGN feedback and the cold gas fraction in these massive systems is lower. The MSII gives very similar results, do not shown here to avoid redundancy.
3.2.2 Structural properties of pseudobulge galaxies
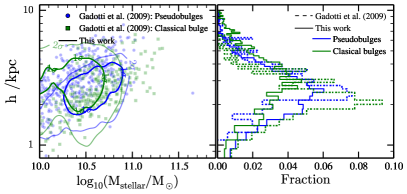
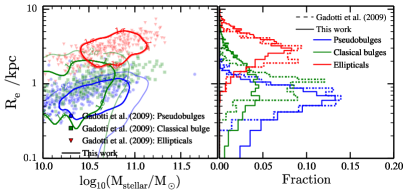
We now move to the analysis of the structural properties of the pseudobulges that our model predicts and compare our predictions with the observational results of Gadotti, (2009). In that work Gadotti studied bulge properties, such as B/T ratios, bulge masses and scale length parameters, for a sample of 963 galaxies with masses and redshift range . The sample was divided in disk galaxies and ellipticals. The former ones were further sub-divided in galaxies hosting a pseudobulge, classical bulge or bulgeless. To compare with the observations, we generated a galaxy sample using the MS which reproduces the exact stellar mass selection of Gadotti, (2009), but with a much larger number of galaxies (about a factor of ten). We could not do the same exercise with the MSII, as the smaller box does not allow to properly sample the most massive galaxies. The definition of pseudobulges, classical bulges and ellipticals is the one used in this work, as presented at the end of subsection 2.3.2.
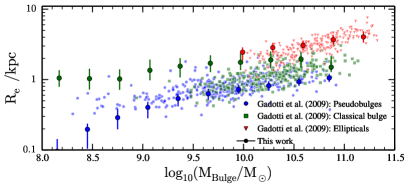
Results for pseudobulge, classical bulge and elliptical galaxies in MS are presented in Fig 15. We show the distribution of disk scale length () as a function of the stellar mass (top left), the distribution of the bulge effective radius () versus stellar mass (top right), the distribution and the effective bulge radius as a function of the bulge mass (bottom left and right, respectively). Overall, the structural parameters and for pseudobulges, classical bulges and elliptical galaxies are reasonably well reproduced by the model. Nevertheless, classical bulges show values which are slightly offset, i.e. disks are larger than the observed one, and the number of massive disks is also larger than observed.
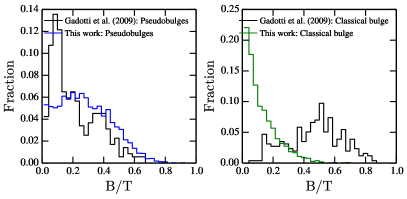
Regarding bulge to total ratios, pseudobulges broadly follow the distribution found by Gadotti, (2009), even though we seem to lack pseudobulges with very small B/T ratios. Other studies, however, found that most pseudobulges are hosted by galaxies with (see Fisher and Drory, 2008b, ; Fisher and Drory,, 2010), which is consistent with our results. On the other hand, the distribution for hosts of classical bulges peaks at with a fast decrease towards large B/T values. Once again, this points towards typically too-massive stellar disks being hosted by galaxies with classical bulges in our model. A population of overly-large disks was already present in the Henriques et al., (2015) version of the model. This could be due to the delayed growth of black holes hosted in classical bulges: as these objects accreted most of their mass at low redshift, their associated AGN feedback has been very modest at high-, allowing for a significant and prolonged growth of the stellar disc. An improved version of the black hole growth model and its impact on galaxy morphology is going to be presented in a following paper (Izquierdo-Villalba et al., in prep).
Finally, the model reproduces well the typical values of found by Gadotti, (2009) as a function of bulge mass for pseudobulges, classical bulges and ellipticals, even though classical bulges lie slightly above the observations. Despite this, we can confirm the Gadotti, (2009) findings: classical bulges appear to be offset in the mass-to-size relation with respect to ellipticals, pointing out to fundamental structural differences, and that they are not simply ellipticals surrounded by disks. Indeed, bulge formation is an extremely complex phenomenon, which is shaped by both mergers and secular processes. As we explore in the next section, while in pseudobulge galaxies the process that dominates galaxy evolution is secular DI and in classical bulges is minor mergers, both population experience the two bulge formation mechanisms during their complex cosmological growth.
3.2.3 Merger history of galaxies
The main assumptions of our model for bar and pseudobulge formation, is that those are linked to the secular growth of disks, while violent events, such are mergers and their consequent starbursts are responsible for the growth of classical bulges. We expect the merger history of galaxies hosting pseudobulges to be different from the one of elliptical and classical bulge hosts. In the reaming of this section we explore the (major/minor) merger history of pseudobulge, classical bulges and ellipticals galaxies and we present some archetypal examples of their merger trees. Finally, we explore the imprints that the galaxy interaction history leaves in the pseudobulge structure.
In the second row of Fig 16 it is presented, per stellar mass bin, the percentage of pseudobulges (blue), classical bulges (green) and ellipticals (red) galaxies that experience at least one major merger (left plot) and from those ones the redshift in which the last major merger took place (right plot). The third row shows the same but for minor mergers. The left panels show the results for the MS and the right ones for the MSII. To guide the reader we have added the stellar mass function of pseudobulges, classical bulges and ellipticals. As we can see, all elliptical galaxies experienced at least one major merger, being the last one at . On contrary, pseudobulges display a much more quiet major merger history. Only 0.5% of them experienced one and only at very high redshift, being this higher for more massive galaxies: from at up to at . The MSII pseudobulges present a similar behaviour: for this simulation, the percentage of pseudobulges which underwent a merger is larger (), because of the larger number of small galaxies resolved, and most of these mergers took place at very high redshifts.
Regarding classical bulges, we can see that the ones hosted by galaxies with follow a similar trend that pseudobulges, i.e a quiet major merger history. On the other hand, at the majority of classical bulge galaxies suffered a recent major merger at . Notice that the drop in percentage presented in MS at is mainly due to resolution. Actually, MSII predicts that the 100% of those galaxies experienced at least one major merger.
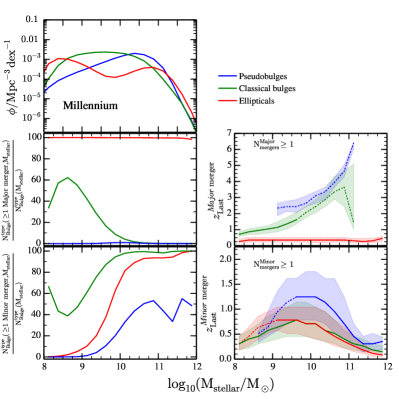
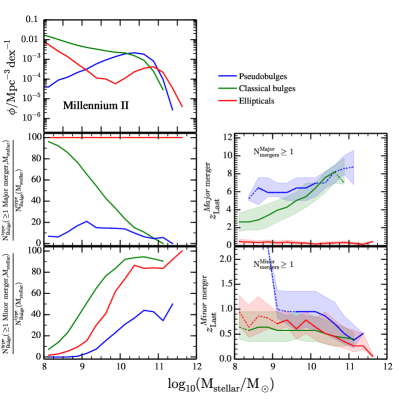
Regarding minor mergers, all classes of bulges display a similar trend: the fraction of galaxies that experienced at least one minor merger increases with stellar mass, although this fraction is never above for pseudobulges. Also, for both the MS and the MSII the typical redshift of the last minor interaction decreases with increasing stellar mass. For classical bulges and ellipticals, however, the typical redshift of the last minor merger is lower than for the pseudobulge population. However, the agreement of classical bulges and ellipticals between MS and MSII decreases when we study galaxies at . While MS predicts a decreasing trend in the redshift distribution, MSII finds a flattening at . Again, this is due to resolution effects which affect the MS in that stellar mass range.
In order to illustrate the different build-up of pseudobulges, in Fig 17 a and b we present two typical examples of pseudobulges mergers trees in in the Millennium simulation. Examples of classical bulges and ellipticals can bee seen in c-d and e-f, respectively. We have selected galaxies with stellar mass , i.e the peak of pseudobulges stellar mass function (see Fig 16). In the plot we represent the stellar and bulge components (empty and filled circles respectively). The size of the circles is proportional to mass. The color of the symbols represents the fraction of bulge mass coming from DI secular evolution. In each merging branch we have added the mass ratio of the merger. Ticks with corresponds to major/minor merger while ticks with refers to smooth accretion. Merging branch without any value means that the galaxy was disrupted by environmental processes before the merger, and its mass added in the Intra-Cluster Medium (most of these galaxies are close to ).
As it was discussed above, pseudobulges have a very quiet merger history. For instance, the first pseudobulge merger tree (example a) just displays one smooth accretion at with . No other interaction takes place in its cosmological evolution. The pseudobulge structure appears after the smooth accretion as a consequence of a DI secular evolution causally disconnected from the satellite interaction. Therefore, the pseudobulge evolved thought internal secular evolution represented by Case 1 and Case 2 in Fig 5. In the case of the second pseudobulge galaxy (example b), its bulge formation history is slightly more complicated, resulting from a combination of Case 4 and Case 1 from in Fig 5. The galaxy developed a small bulge component as a consequence of a minor merger with . After from the merger (at ), an important disk instability took place, blurring the classical bulge structure and resulting in the birth of a prominent pseudobulge.
a)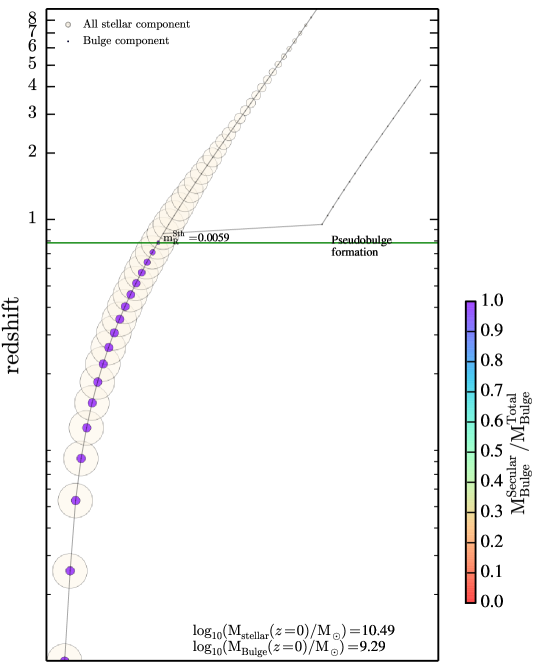 b)
b)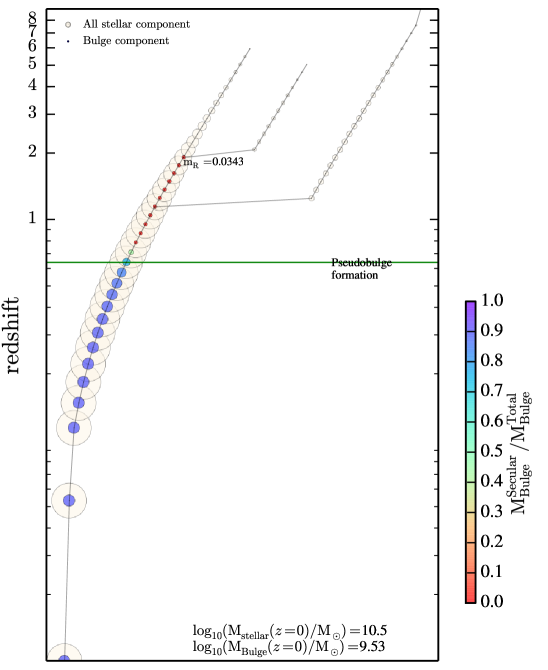 c)
c)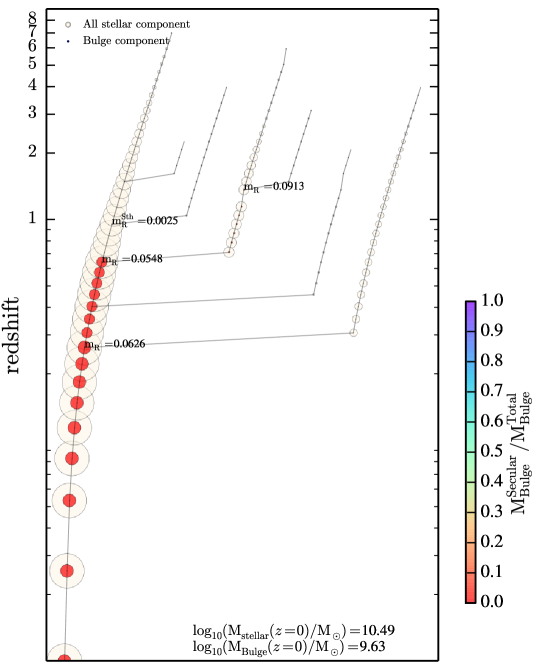 d)
d)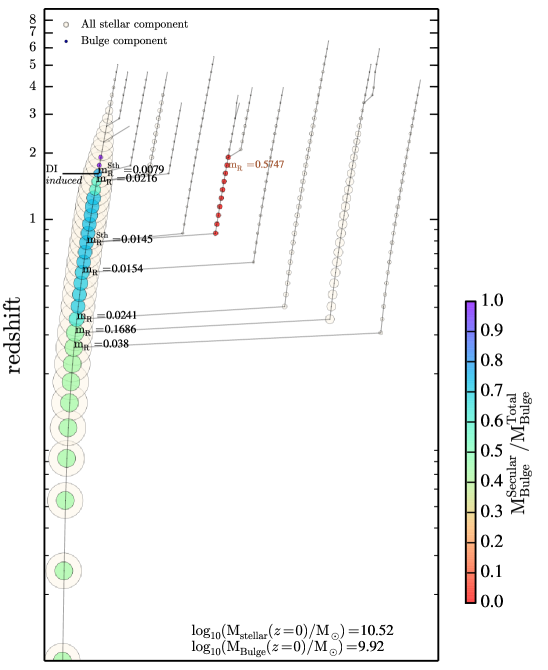 e)
e) f)
f)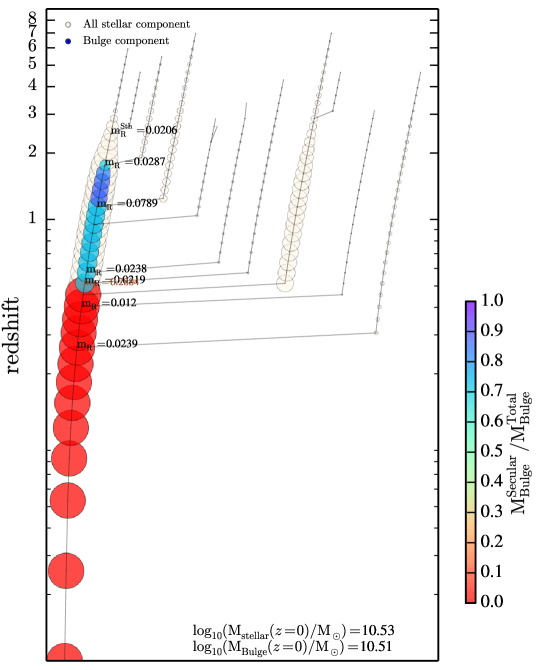
Regarding classical bulges and ellipticals galaxies, we can see that all the merger trees (example c,d,e,f) are much more complicated than in the previous two cases. For instance, in the example c it is presented an archetype of classical bulge build-up (Case 4 Fig 5): the bulge structure was generated by a minor merger at and strengthened by a more recent minor merger (). No signatures or secular evolution in the bulge can be seen. Example d represents another type of classical bulge galaxy evolution. In this case, the bulge structure was not completely build-up by mergers but by a combination of DI and minor mergers. The bulge was born via DI secular evolution at but at a DI merger-induced (Case 5 in Fig 5), consequence of a smooth accretion, triggered the birth of a classical bulge component. The galaxy started to evolve and via secular DIs made the pseudobulge structure grow again. Nevertheless, the constant minor mergers interactions that the galaxy experienced at and led to the growth of a prominent classical bulge, where the pseudobulge component is negligible ( of at ). Finally, examples e and f display some pathways of elliptical galaxy formation. In example e the galaxy started as a classical bulge galaxy, with the bulge component being due to several minor mergers, while in example e the galaxy hosted a prominent pseudobulge at high z. In both cases, however, a major merger took place at , which erased the previous galaxy morphology and formed a pure elliptical galaxy.
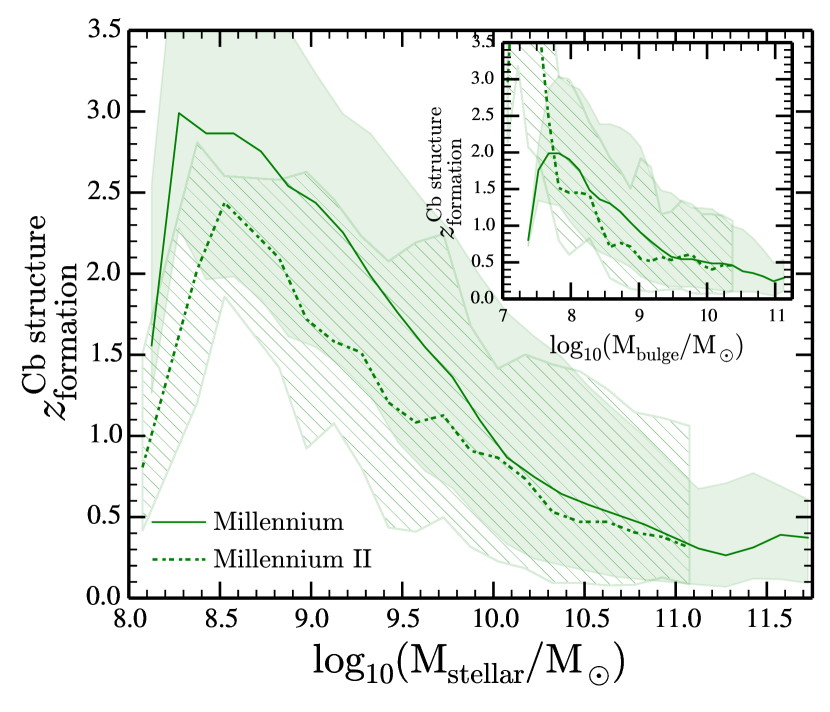
Finally, despite having quiet merger history, pseudobulge galaxies still have some minor/major merger interactions which can provide a classical component to the final bulge. In particular, the 31% and 32.4% of MS and MSII pseudobulge galaxies host a classical component, contributing typically with the 7% of the whole bulge mass. To support the idea of last minor mergers being the main responsible for the strengthening of the classical bulge structure in pseudobulge galaxies at , we define the formation redshift of the classical component (i.e. ) as the moment in which it reached the 70%101010We have checked that the results do not suffer significant changes when we assume a value between 50% - 90% of its final mass at . As shown in the lower panel of Fig 18, the formation time of this component follows the same trend of presented in Fig 16. The last merger is thus responsible for the building (or strengthening) of the classical bulge structure in pseudobulge galaxies.
We highlight that, in the mass range, MSII predicts slightly lower time-formation values than MS. This is because MSII galaxies within this specific mass range are affected 5 times more frequently by merger-induced DIs than MS (taking place at , see Fig 7).
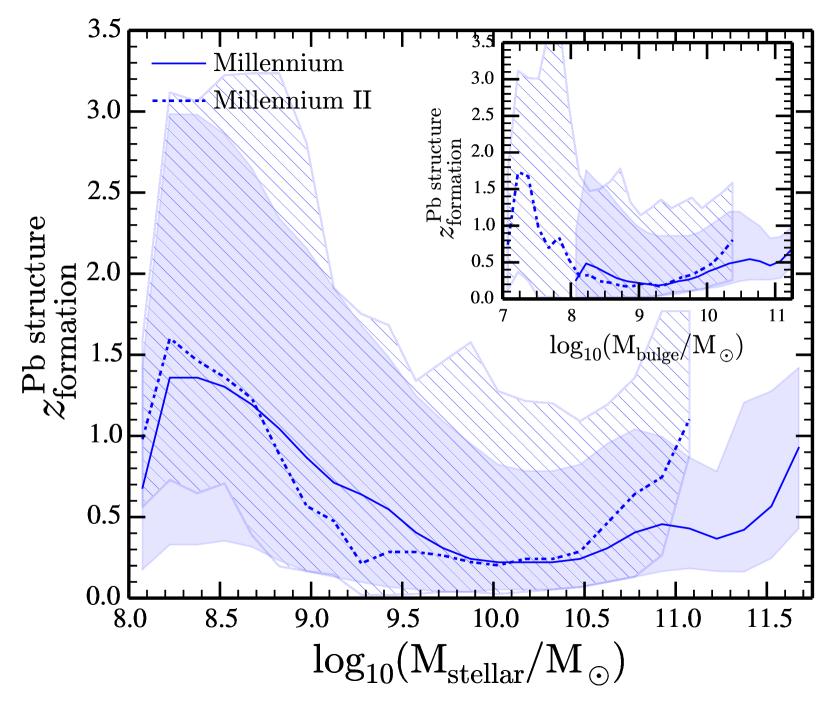
Regarding the pseudobulge structure, in Fig 18 we present the distribution of formation times, , as a function of stellar mass. This value has been defined as the moment in which the pseudobulge component reached the 2/3111111i.e, the moment in which, independently of redshift, the galaxy would be always selected as a pseudobulge galaxy of its total bulge mass. As we can see, while pseudobulge galaxies with formed their pseudobulge structure mainly at , more massive galaxies (i.e, ) formed it in the low- universe, although the scatter is larger. Interestingly, this trend is broken for most massive pseudobulge galaxies () where the rises again up to . We interpret this turn-over as an effect of the star-formation rate damping induced by AGN feedback in these galaxies. As a consequence of feedback, the DIs frequency is severely decreased and pseudobulge formation is suppressed in many massive galaxies at low-z. The sSfr distribution (Fig 13) supported this scenario, by showing a clear drop at . The insert plot in Fig 18 shows the same distribution but for fixed bulge mass. As we can see, the fixed-bulge trend is similar to the previous one: small-bulge galaxies formed their pseudobulge component at higher redshifts with respect to more massive-bulge ones. Our findings of pseudobulge formation at intermediate redshifts are supported by a recent work of Gadotti et al., (2015) who found that the bar in the Virgo galaxy NGC 4371 formed a pseudobulge at (with an uncertainty of ).
4 Summary and conclusions
In this paper we have studied the cosmological build-up of pseudobulges using the last public version of the L-Galaxies semi-analityical model (SAM, Henriques et al.,, 2015). Taking advantage that L-Galaxies can be run on top the merger trees of both the Millennium and the Millennium II N-body simulations, we have been able to study the formation of pseudobulge structures and properties of their hosts across a wide range of stellar masses ().
In order to reach a reasonable convergence between the MS and MSII in terms of distribution of galaxy morphology and number density of merger events across cosmic time, we first had to introduce some small modifications to the parameters that distinguish between major and minor mergers and that set the conditions for disk instability events.
Moreover, to improve the predictions of the MSII for the morphological distribution of low stellar mass systems (), we introduced a new prescription for the interactions in which the binding energy of the satellite galaxy is very small compared to the one of the central galaxy. For these events, which we refer to with the term smooth accretion, we assume that the stellar core of the satellite gets incorporated by the disk of the central galaxy, being unable to reach its nucleus before being disrupted.
Assuming that pseudobulges can only form and grow via secular evolution (e.g., Kormendy and Ho,, 2013), we have modified the treatment of galaxy disk instabilities (DI), distinguishing between two kinds of events: DI secular-induced, which is a consequence of the slow and continuous mass-growth of galaxies, and DI merger-induced, linked to the fast growth of disks during galaxy interactions.
The former are the events which we assume to lead to long-lasting bar structures and the formation/growth of pseudobulges, while merger-induced instabilities contribute, together with mergers, to the growth of classical bulges.
Our SAM predicts that merger-induced instabilities have a number density smaller than the DI secular evolution at all cosmic epochs, and that it is a secondary channel in the growth of classical bulges, being classical-bulge growth during the merger event the primary channel at all redshifts.
On the other hand, secular-induced DIs are the most abundant events at any redshift and stellar masses. However, while in galaxies with these events are able to substantially contribute to the growth of the bulge, by transferring up 10% of the total stellar content to the pseudobulge, in galaxies with DIs can only lead to a small (sub-percent) transfer of mass from the disk to the pseudobulge. As a consequence, predominant pseudobulge structures are typically present in galaxies in the range , at high-, moving to slightly higher values at more recent cosmic times. At , in particular, pseudobulges are hosted by galaxies in a very narrow stellar and halo mass window, and , i.e Milky-Way type galaxies. Moreover, while at high- pseudobulges are the dominant bulge structures in massive galaxies (), they get systematically depleted in such massive systems with decreasing redshift. We interpret this as a consequence of the hierarchical growth of galaxies: pseudobulges are less likely to be hosted by very massive systems at late cosmic times, as the assembly of these galaxies is closely linked to numerous merger events which dramatically modify the dynamics of the galaxy, leading to deep morphological transformations.
When looking at the properties of the hosts, we find that pseudobulges are hosted by actively star forming galaxies (in the main sequence of star formation), and with a relatively young stellar population (mass weighted age , independently on the host stellar mass). Classical bulges, instead, reside in star forming galaxies only if the host mass is below , while more massive systems are quenched, or in the process of quenching, and are characterized by an older stellar population.
Tracing the history of galaxies hosting pseudobulges at , we found that they are characterized by an extremely-quiet merger history. The Millennium and Millennium II simulations predict, respectively, that only and of galaxies with a pseudobulge at experienced a major merger, and this took place at very high redshifts . Also minor mergers are rare in the history of today’s pseudobulge galaxies, with less than 30% of pseudobulges hosts having experienced a minor merger. Because of the minor mergers, however, these galaxies also contain a small classical bulge component ( of the total bulge mass). The two structures are characterized by different formation times: while the pseudobulge was formed at , the classical one did it at , the time in which the last minor merger took place.
Finally, we have created mock samples of local pseudobulges and classical bulges, to compare with the observational results of Gadotti, (2009), who analyzed the properties of pseudobulges in galaxies above . We found that the pseudobulge structural properties predicted by the model are broadly consistent with observations. In particular, we find a good agreement in the effective radii distribution of different classes of bulges. The distribution of bulge-to-total ratios for pseudobulges is also consistent with the results of Gadotti, (2009), while classical bulges are predicted to be in galaxies with disks larger than observed. These results are quite encouraging and give support to our main underlying assumption that pseudobulge structure can form mainly via secular evolution.
Despite the promising results, more investigation is needed to understand bar and pseudobulge formation in a broad cosmological context. Our simple approach is highly complementary to more sophisticated simulations which try to study the complex dynamical evolution of disk galaxies. More synergy among different theoretical approaches and observations are certainly needed to reach a more clear picture on the different mechanisms that lead to formation of different bulge classes.
Acknowledgements
The authors thank Simon White, Dimitri Gadotti and Sergio Contreas for useful discussions and comments. We acknowledge the support from project AYA2015-66211-C2-2 MINECO/FEDER, UE of the Spanish Ministerio de Economia, Industria y Competitividad. DIV particularly thanks the grant Programa Operativo Fondo Social Europeo de Aragón 2014-2020. Construyendo Europa desde Aragón. BMBH (ORCID 0000-0002-1392-489X) acknowledges support from a Zwicky Prize fellowship. YRG acknowledges support of the European Research Council through grant number ERC-StG/716151. This project has received funding from the European Unions Horizon 2020 Research and Innovation Programme under the Marie Sklodowska-Curie grant agreement No 734374.
References
- Abadi et al., (2003) Abadi, M. G., Navarro, J. F., Steinmetz, M., and Eke, V. R. (2003). Simulations of Galaxy Formation in a Cold Dark Matter Universe. II. The Fine Structure of Simulated Galactic Disks. ApJ, 597:21–34.
- Aguerri et al., (2001) Aguerri, J. A. L., Balcells, M., and Peletier, R. F. (2001). Growth of galactic bulges by mergers. I. Dense satellites. A&A, 367:428–442.
- Angulo and White, (2010) Angulo, R. E. and White, S. D. M. (2010). One simulation to fit them all - changing the background parameters of a cosmological N-body simulation. MNRAS, 405:143–154.
- Athanassoula, (2005) Athanassoula, E. (2005). On the nature of bulges in general and of box/peanut bulges in particular: input from N-body simulations. MNRAS, 358:1477–1488.
- Athanassoula, (2008) Athanassoula, E. (2008). Disc instabilities and semi-analytic modelling of galaxy formation. MNRAS, 390:L69–L72.
- Athanassoula, (2012) Athanassoula, E. (2012). Towards understanding the dynamics of the bar/bulge region in our Galaxy. In European Physical Journal Web of Conferences, volume 19 of European Physical Journal Web of Conferences, page 06004.
- Barnes, (1999) Barnes, J. E. (1999). Galaxy Transformation by Merging. In Beckman, J. E. and Mahoney, T. J., editors, The Evolution of Galaxies on Cosmological Timescales, volume 187 of Astronomical Society of the Pacific Conference Series, pages 293–306.
- Baugh et al., (1996) Baugh, C. M., Cole, S., and Frenk, C. S. (1996). Faint galaxy counts as a function of morphological type in a hierarchical merger model. MNRAS, 282:L27–L32.
- Benson et al., (2002) Benson, A. J., Ellis, R. S., and Menanteau, F. (2002). On the continuous formation of field spheroidal galaxies in hierarchical models of structure formation. MNRAS, 336:564–576.
- Birnboim and Dekel, (2003) Birnboim, Y. and Dekel, A. (2003). Virial shocks in galactic haloes? MNRAS, 345:349–364.
- Blaña Díaz et al., (2018) Blaña Díaz, M., Gerhard, O., Wegg, C., Portail, M., Opitsch, M., Saglia, R., Fabricius, M., Erwin, P., and Bender, R. (2018). Sculpting Andromeda - made-to-measure models for M31’s bar and composite bulge: dynamics, stellar and dark matter mass. MNRAS, 481:3210–3243.
- Bonoli et al., (2016) Bonoli, S., Mayer, L., Kazantzidis, S., Madau, P., Bellovary, J., and Governato, F. (2016). Black hole starvation and bulge evolution in a Milky Way-like galaxy. MNRAS, 459:2603–2617.
- Bournaud and Combes, (2002) Bournaud, F. and Combes, F. (2002). Gas accretion on spiral galaxies: Bar formation and renewal. A&A, 392:83–102.
- Bournaud et al., (2005) Bournaud, F., Jog, C. J., and Combes, F. (2005). Galaxy mergers with various mass ratios: Properties of remnants. A&A, 437:69–85.
- Boylan-Kolchin et al., (2009) Boylan-Kolchin, M., Springel, V., White, S. D. M., Jenkins, A., and Lemson, G. (2009). Resolving cosmic structure formation with the Millennium-II Simulation. MNRAS, 398:1150–1164.
- Brinchmann et al., (2004) Brinchmann, J., Charlot, S., White, S. D. M., Tremonti, C., Kauffmann, G., Heckman, T., and Brinkmann, J. (2004). The physical properties of star-forming galaxies in the low-redshift Universe. MNRAS, 351:1151–1179.
- Bureau and Freeman, (1999) Bureau, M. and Freeman, K. C. (1999). The Nature of Boxy/Peanut-Shaped Bulges in Spiral Galaxies. AJ, 118:126–138.
- Cano-Díaz et al., (2016) Cano-Díaz, M., Sánchez, S. F., Zibetti, S., Ascasibar, Y., Bland-Hawthorn, J., Ziegler, B., González Delgado, R. M., Walcher, C. J., García-Benito, R., Mast, D., Mendoza-Pérez, M. A., Falcón-Barroso, J., Galbany, L., Husemann, B., Kehrig, C., Marino, R. A., Sánchez-Blázquez, P., López-Cobá, C., López-Sánchez, Á. R., and Vilchez, J. M. (2016). Spatially Resolved Star Formation Main Sequence of Galaxies in the CALIFA Survey. ApJ, 821:L26.
- Carpineti et al., (2012) Carpineti, A., Kaviraj, S., Darg, D., Lintott, C., Schawinski, K., and Shabala, S. (2012). Spheroidal post-mergers in the local Universe. MNRAS, 420:2139–2146.
- Cervantes Sodi et al., (2015) Cervantes Sodi, B., Li, C., and Park, C. (2015). Dark Matter Halos of Barred Disk Galaxies. ApJ, 807:111.
- Colless et al., (2001) Colless, M., Dalton, G., Maddox, S., Sutherland, W., Norberg, P., Cole, S., Bland-Hawthorn, J., Bridges, T., Cannon, R., Collins, C., Couch, W., Cross, N., Deeley, K., De Propris, R., Driver, S. P., Efstathiou, G., Ellis, R. S., Frenk, C. S., Glazebrook, K., Jackson, C., Lahav, O., Lewis, I., Lumsden, S., Madgwick, D., Peacock, J. A., Peterson, B. A., Price, I., Seaborne, M., and Taylor, K. (2001). The 2dF Galaxy Redshift Survey: spectra and redshifts. MNRAS, 328:1039–1063.
- Combes, (2009) Combes, F. (2009). Secular Evolution and the Assembly of Bulges. In Jogee, S., Marinova, I., Hao, L., and Blanc, G. A., editors, Galaxy Evolution: Emerging Insights and Future Challenges, volume 419 of Astronomical Society of the Pacific Conference Series, page 31.
- Combes et al., (1990) Combes, F., Debbasch, F., Friedli, D., and Pfenniger, D. (1990). Box and peanut shapes generated by stellar bars. A&A, 233:82–95.
- Combes and Sanders, (1981) Combes, F. and Sanders, R. H. (1981). Formation and properties of persisting stellar bars. A&A, 96:164–173.
- Conselice, (2006) Conselice, C. J. (2006). The fundamental properties of galaxies and a new galaxy classification system. MNRAS, 373:1389–1408.
- Côté et al., (1998) Côté, P., Marzke, R. O., and West, M. J. (1998). The Formation of Giant Elliptical Galaxies and Their Globular Cluster Systems. ApJ, 501:554–570.
- Covington et al., (2011) Covington, M. D., Primack, J. R., Porter, L. A., Croton, D. J., Somerville, R. S., and Dekel, A. (2011). The role of dissipation in the scaling relations of cosmological merger remnants. MNRAS, 415:3135–3152.
- Croton, (2006) Croton, D. J. (2006). Evolution in the black hole mass-bulge mass relation: a theoretical perspective. MNRAS, 369:1808–1812.
- Dasyra et al., (2006) Dasyra, K. M., Tacconi, L. J., Davies, R. I., Genzel, R., Lutz, D., Naab, T., Burkert, A., Veilleux, S., and Sanders, D. B. (2006). Dynamical Properties of Ultraluminous Infrared Galaxies. I. Mass Ratio Conditions for ULIRG Activity in Interacting Pairs. ApJ, 638:745–758.
- Dasyra et al., (2007) Dasyra, K. M., Tacconi, L. J., Davies, R. I., Genzel, R., Lutz, D., Peterson, B. M., Veilleux, S., Baker, A. J., Schweitzer, M., and Sturm, E. (2007). Host Dynamics and Origin of Palomar-Green QSOs. ApJ, 657:102–115.
- De Lucia et al., (2004) De Lucia, G., Kauffmann, G., and White, S. D. M. (2004). Chemical enrichment of the intracluster and intergalactic medium in a hierarchical galaxy formation model. MNRAS, 349:1101–1116.
- Debattista et al., (2004) Debattista, V. P., Carollo, C. M., Mayer, L., and Moore, B. (2004). Bulges or Bars from Secular Evolution? ApJ, 604:L93–L96.
- Debattista et al., (2006) Debattista, V. P., Mayer, L., Carollo, C. M., Moore, B., Wadsley, J., and Quinn, T. (2006). The Secular Evolution of Disk Structural Parameters. ApJ, 645:209–227.
- Dekel et al., (2009) Dekel, A., Sari, R., and Ceverino, D. (2009). Formation of Massive Galaxies at High Redshift: Cold Streams, Clumpy Disks, and Compact Spheroids. ApJ, 703:785–801.
- Di Matteo et al., (2015) Di Matteo, P., Gómez, A., Haywood, M., Combes, F., Lehnert, M. D., Ness, M., Snaith, O. N., Katz, D., and Semelin, B. (2015). Why the Milky Way’s bulge is not only a bar formed from a cold thin disk. A&A, 577:A1.
- Doyon et al., (1994) Doyon, R., Wells, M., Wright, G. S., Joseph, R. D., Nadeau, D., and James, P. A. (1994). Stellar velocity dispersion in ARP 220 and NGC 6240: Elliptical galaxies in formation. ApJ, 437:L23–L26.
- Drory and Fisher, (2007) Drory, N. and Fisher, D. B. (2007). A Connection between Bulge Properties and the Bimodality of Galaxies. ApJ, 664:640–649.
- Dutton and Macciò, (2014) Dutton, A. A. and Macciò, A. V. (2014). Cold dark matter haloes in the Planck era: evolution of structural parameters for Einasto and NFW profiles. MNRAS, 441:3359–3374.
- Efstathiou et al., (1982) Efstathiou, G., Lake, G., and Negroponte, J. (1982). The stability and masses of disc galaxies. MNRAS, 199:1069–1088.
- Eliche-Moral et al., (2006) Eliche-Moral, M. C., Balcells, M., Aguerri, J. A. L., and González-García, A. C. (2006). Growth of galactic bulges by mergers. II. Low-density satellites. A&A, 457:91–108.
- Erwin et al., (2015) Erwin, P., Saglia, R. P., Fabricius, M., Thomas, J., Nowak, N., Rusli, S., Bender, R., Vega Beltrán, J. C., and Beckman, J. E. (2015). Composite bulges: the coexistence of classical bulges and discy pseudo-bulges in S0 and spiral galaxies. MNRAS, 446:4039–4077.
- (42) Fisher, D. B. and Drory, N. (2008a). The Structure of Classical Bulges and Pseudobulges: the Link Between Pseudobulges and SÉRSIC Index. AJ, 136:773–839.
- (43) Fisher, D. B. and Drory, N. (2008b). The Structure of Classical Bulges and Pseudobulges: the Link Between Pseudobulges and SÉRSIC Index. AJ, 136:773–839.
- Fisher and Drory, (2010) Fisher, D. B. and Drory, N. (2010). Bulges of Nearby Galaxies with Spitzer: Scaling Relations in Pseudobulges and Classical Bulges. ApJ, 716:942–969.
- Fisher et al., (2009) Fisher, D. B., Drory, N., and Fabricius, M. H. (2009). Bulges of Nearby Galaxies with Spitzer: The Growth of Pseudobulges in Disk Galaxies and its Connection to Outer Disks. ApJ, 697:630–650.
- Forcada-Miro and White, (1997) Forcada-Miro, M. I. and White, S. D. M. (1997). Radiative shocks in galaxy formation. I: Cooling of a primordial plasma with no sources of heating. ArXiv Astrophysics e-prints.
- Fragkoudi et al., (2017) Fragkoudi, F., Di Matteo, P., Haywood, M., Gómez, A., Combes, F., Katz, D., and Semelin, B. (2017). Bars and boxy/peanut bulges in thin and thick discs. I. Morphology and line-of-sight velocities of a fiducial model. A&A, 606:A47.
- Gadotti, (2009) Gadotti, D. A. (2009). Structural properties of pseudo-bulges, classical bulges and elliptical galaxies: a Sloan Digital Sky Survey perspective. MNRAS, 393:1531–1552.
- Gadotti et al., (2015) Gadotti, D. A., Seidel, M. K., Sánchez-Blázquez, P., Falcón-Barroso, J., Husemann, B., Coelho, P., and Pérez, I. (2015). MUSE tells the story of NGC 4371: The dawning of secular evolution. A&A, 584:A90.
- Gargiulo et al., (2015) Gargiulo, I. D., Cora, S. A., Padilla, N. D., Muñoz Arancibia, A. M., Ruiz, A. N., Orsi, A. A., Tecce, T. E., Weidner, C., and Bruzual, G. (2015). Chemoarchaeological downsizing in a hierarchical universe: impact of a top-heavy IGIMF. MNRAS, 446:3820–3841.
- Gavazzi et al., (2015) Gavazzi, G., Consolandi, G., Viscardi, E., Fossati, M., Savorgnan, G., Fumagalli, M., Gutierrez, L., Hernandez Toledo, H., Boselli, A., Giovanelli, R., and Haynes, M. P. (2015). H3: an H imaging survey of HI selected galaxies from ALFALFA . V. The Coma supercluster survey completion. A&A, 576:A16.
- Guo et al., (2011) Guo, Q., White, S., Boylan-Kolchin, M., De Lucia, G., Kauffmann, G., Lemson, G., Li, C., Springel, V., and Weinmann, S. (2011). From dwarf spheroidals to cD galaxies: simulating the galaxy population in a CDM cosmology. MNRAS, 413:101–131.
- Hammer et al., (2005) Hammer, F., Flores, H., Elbaz, D., Zheng, X. Z., Liang, Y. C., and Cesarsky, C. (2005). Did most present-day spirals form during the last 8 Gyr?. A formation history with violent episodes revealed by panchromatic observations. A&A, 430:115–128.
- Hatton et al., (2003) Hatton, S., Devriendt, J. E. G., Ninin, S., Bouchet, F. R., Guiderdoni, B., and Vibert, D. (2003). GALICS- I. A hybrid N-body/semi-analytic model of hierarchical galaxy formation. MNRAS, 343:75–106.
- Henriques et al., (2015) Henriques, B. M. B., White, S. D. M., Thomas, P. A., Angulo, R., Guo, Q., Lemson, G., Springel, V., and Overzier, R. (2015). Galaxy formation in the Planck cosmology - I. Matching the observed evolution of star formation rates, colours and stellar masses. MNRAS, 451:2663–2680.
- Hernquist, (1990) Hernquist, L. (1990). An analytical model for spherical galaxies and bulges. ApJ, 356:359–364.
- Hirschmann et al., (2012) Hirschmann, M., Somerville, R. S., Naab, T., and Burkert, A. (2012). Origin of the antihierarchical growth of black holes. MNRAS, 426:237–257.
- (58) Hopkins, P. F., Cox, T. J., Younger, J. D., and Hernquist, L. (2009a). How do Disks Survive Mergers? ApJ, 691:1168–1201.
- (59) Hopkins, P. F., Somerville, R. S., Cox, T. J., Hernquist, L., Jogee, S., Kereš, D., Ma, C.-P., Robertson, B., and Stewart, K. (2009b). The effects of gas on morphological transformation in mergers: implications for bulge and disc demographics. MNRAS, 397:802–814.
- Irodotou et al., (2018) Irodotou, D., Thomas, P. A., Henriques, B. M., and Sargent, M. T. (2018). Morphological evolution and galactic sizes in the L-Galaxies SA model. ArXiv e-prints.
- Kalnajs, (1972) Kalnajs, A. J. (1972). The Equilibria and Oscillations of a Family of Uniformly Rotating Stellar Disks. ApJ, 175:63.
- Kauffmann et al., (1993) Kauffmann, G., White, S. D. M., and Guiderdoni, B. (1993). The Formation and Evolution of Galaxies Within Merging Dark Matter Haloes. MNRAS, 264:201.
- Kazantzidis et al., (2008) Kazantzidis, S., Bullock, J. S., Zentner, A. R., Kravtsov, A. V., and Moustakas, L. A. (2008). Cold Dark Matter Substructure and Galactic Disks. I. Morphological Signatures of Hierarchical Satellite Accretion. ApJ, 688:254–276.
- Kim et al., (2016) Kim, T., Gadotti, D. A., Athanassoula, E., Bosma, A., Sheth, K., and Lee, M. G. (2016). Evidence of bar-induced secular evolution in the inner regions of stellar discs in galaxies: what shapes disc galaxies? MNRAS, 462:3430–3440.
- Kormendy and Ho, (2013) Kormendy, J. and Ho, L. C. (2013). Coevolution (Or Not) of Supermassive Black Holes and Host Galaxies. ARA&A, 51:511–653.
- (66) Kormendy, J. and Kennicutt, Jr., R. C. (2004a). Secular Evolution and the Formation of Pseudobulges in Disk Galaxies. ARA&A, 42:603–683.
- (67) Kormendy, J. and Kennicutt, Jr., R. C. (2004b). Secular Evolution and the Formation of Pseudobulges in Disk Galaxies. ARA&A, 42:603–683.
- Lacey et al., (2016) Lacey, C. G., Baugh, C. M., Frenk, C. S., Benson, A. J., Bower, R. G., Cole, S., Gonzalez-Perez, V., Helly, J. C., Lagos, C. D. P., and Mitchell, P. D. (2016). A unified multiwavelength model of galaxy formation. MNRAS, 462:3854–3911.
- Lagos et al., (2011) Lagos, C. D. P., Baugh, C. M., Lacey, C. G., Benson, A. J., Kim, H.-S., and Power, C. (2011). Cosmic evolution of the atomic and molecular gas contents of galaxies. MNRAS, 418:1649–1667.
- Lagos et al., (2008) Lagos, C. D. P., Cora, S. A., and Padilla, N. D. (2008). Effects of AGN feedback on CDM galaxies. MNRAS, 388:587–602.
- Lagos et al., (2018) Lagos, C. d. P., Tobar, R. J., Robotham, A. S. G., Obreschkow, D., Mitchell, P. D., Power, C., and Elahi, P. J. (2018). Shark: introducing an open source, free and flexible semi-analytic model of galaxy formation. ArXiv e-prints.
- Lange et al., (2015) Lange, R., Driver, S. P., Robotham, A. S. G., Kelvin, L. S., Graham, A. W., Alpaslan, M., Andrews, S. K., Baldry, I. K., Bamford, S., Bland-Hawthorn, J., Brough, S., Cluver, M. E., Conselice, C. J., Davies, L. J. M., Haeussler, B., Konstantopoulos, I. S., Loveday, J., Moffett, A. J., Norberg, P., Phillipps, S., Taylor, E. N., López-Sánchez, Á. R., and Wilkins, S. M. (2015). Galaxy And Mass Assembly (GAMA): mass-size relations of z 0.1 galaxies subdivided by Sérsic index, colour and morphology. MNRAS, 447:2603–2630.
- Laurikainen and Salo, (2016) Laurikainen, E. and Salo, H. (2016). Observed Properties of Boxy/Peanut/Barlens Bulges. In Laurikainen, E., Peletier, R., and Gadotti, D., editors, Galactic Bulges, volume 418 of Astrophysics and Space Science Library, page 77.
- Menci et al., (2004) Menci, N., Cavaliere, A., Fontana, A., Giallongo, E., Poli, F., and Vittorini, V. (2004). Early Hierarchical Formation of Massive Galaxies Triggered by Interactions. ApJ, 604:12–17.
- Menci et al., (2014) Menci, N., Gatti, M., Fiore, F., and Lamastra, A. (2014). Triggering active galactic nuclei in hierarchical galaxy formation: disk instability vs. interactions. A&A, 569:A37.
- Méndez-Abreu et al., (2019) Méndez-Abreu, J., de Lorenzo-Cáceres, A., Gadotti, D. A., Fragkoudi, F., van de Ven, G., Falcón-Barroso, J., Leaman, R., Pérez, I., Querejeta, M., Sánchez-Blazquez, P., and Seidel, M. (2019). Inner bars also buckle. The MUSE TIMER view of the double-barred galaxy NGC 1291. MNRAS, 482:L118–L122.
- Méndez-Abreu et al., (2010) Méndez-Abreu, J., Sánchez-Janssen, R., and Aguerri, J. A. L. (2010). Which Galaxies Host Bars and Disks? A Study of the Coma Cluster. ApJ, 711:L61–L65.
- Mo et al., (2010) Mo, H., van den Bosch, F. C., and White, S. (2010). Galaxy Formation and Evolution.
- Mo et al., (1998) Mo, H. J., Mao, S., and White, S. D. M. (1998). The formation of galactic discs. MNRAS, 295:319–336.
- Moetazedian et al., (2017) Moetazedian, R., Polyachenko, E. V., Berczik, P., and Just, A. (2017). Effects of galaxy-satellite interactions on bar formation. A&A, 604:A75.
- Moorthy and Holtzman, (2006) Moorthy, B. K. and Holtzman, J. A. (2006). Stellar populations in bulges of spiral galaxies. MNRAS, 371:583–608.
- Naab et al., (2006) Naab, T., Jesseit, R., and Burkert, A. (2006). The influence of gas on the structure of merger remnants. MNRAS, 372:839–852.
- Navarro et al., (1996) Navarro, J. F., Frenk, C. S., and White, S. D. M. (1996). The Structure of Cold Dark Matter Halos. ApJ, 462:563.
- Noeske et al., (2007) Noeske, K. G., Weiner, B. J., Faber, S. M., Papovich, C., Koo, D. C., Somerville, R. S., Bundy, K., Conselice, C. J., Newman, J. A., Schiminovich, D., Le Floc’h, E., Coil, A. L., Rieke, G. H., Lotz, J. M., Primack, J. R., Barmby, P., Cooper, M. C., Davis, M., Ellis, R. S., Fazio, G. G., Guhathakurta, P., Huang, J., Kassin, S. A., Martin, D. C., Phillips, A. C., Rich, R. M., Small, T. A., Willmer, C. N. A., and Wilson, G. (2007). Star Formation in AEGIS Field Galaxies since z=1.1: The Dominance of Gradually Declining Star Formation, and the Main Sequence of Star-forming Galaxies. ApJ, 660:L43–L46.
- Noguchi, (1998) Noguchi, M. (1998). Clumpy star-forming regions as the origin of the peculiar morphology of high-redshift galaxies. Nature, 392:253.
- Noguchi, (1999) Noguchi, M. (1999). Early Evolution of Disk Galaxies: Formation of Bulges in Clumpy Young Galactic Disks. ApJ, 514:77–95.
- Obreja et al., (2013) Obreja, A., Domínguez-Tenreiro, R., Brook, C., Martínez-Serrano, F. J., Doménech-Moral, M., Serna, A., Mollá, M., and Stinson, G. (2013). A Two-phase Scenario for Bulge Assembly in CDM Cosmologies. ApJ, 763:26.
- Ostriker and Peebles, (1973) Ostriker, J. P. and Peebles, P. J. E. (1973). A Numerical Study of the Stability of Flattened Galaxies: or, can Cold Galaxies Survive? ApJ, 186:467–480.
- Papovich et al., (2005) Papovich, C., Dickinson, M., Giavalisco, M., Conselice, C. J., and Ferguson, H. C. (2005). The Assembly of Diversity in the Morphologies and Stellar Populations of High-Redshift Galaxies. ApJ, 631:101–120.
- Peñarrubia et al., (2006) Peñarrubia, J., McConnachie, A., and Babul, A. (2006). On the Formation of Extended Galactic Disks by Tidally Disrupted Dwarf Galaxies. ApJ, 650:L33–L36.
- Pfenniger and Norman, (1990) Pfenniger, D. and Norman, C. (1990). Dissipation in barred galaxies - The growth of bulges and central mass concentrations. ApJ, 363:391–410.
- Planck Collaboration et al., (2014) Planck Collaboration, Ade, P. A. R., Aghanim, N., Armitage-Caplan, C., Arnaud, M., Ashdown, M., Atrio-Barandela, F., Aumont, J., Baccigalupi, C., Banday, A. J., and et al. (2014). Planck 2013 results. XVI. Cosmological parameters. A&A, 571:A16.
- Porter et al., (2014) Porter, L. A., Somerville, R. S., Primack, J. R., and Johansson, P. H. (2014). Understanding the structural scaling relations of early-type galaxies. MNRAS, 444:942–960.
- Rahimi et al., (2010) Rahimi, A., Kawata, D., Brook, C. B., and Gibson, B. K. (2010). Chemodynamical analysis of bulge stars for simulated disc galaxies. MNRAS, 401:1826–1831.
- Ribeiro et al., (2016) Ribeiro, B., Lobo, C., Antón, S., Gomes, J. M., and Papaderos, P. (2016). Red galaxies with pseudo-bulges in the SDSS: closer to disc galaxies or to classical bulges? MNRAS, 456:3899–3914.
- Ryan et al., (2008) Ryan, Jr., R. E., Cohen, S. H., Windhorst, R. A., and Silk, J. (2008). Galaxy Mergers at z gtrsim 1 in the HUDF: Evidence for a Peak in the Major Merger Rate of Massive Galaxies. ApJ, 678:751–757.
- Saha, (2015) Saha, K. (2015). Lost in Secular Evolution: The Case of a Low-mass Classical Bulge. ApJ, 806:L29.
- Sales et al., (2007) Sales, L. V., Navarro, J. F., Abadi, M. G., and Steinmetz, M. (2007). Satellites of simulated galaxies: survival, merging and their relationto the dark and stellar haloes. MNRAS, 379:1464–1474.
- Sellwood, (2016) Sellwood, J. A. (2016). Bar Instability in Disk-Halo Systems. ApJ, 819:92.
- Shankar et al., (2013) Shankar, F., Marulli, F., Bernardi, M., Mei, S., Meert, A., and Vikram, V. (2013). Size evolution of spheroids in a hierarchical Universe. MNRAS, 428:109–128.
- Shankar et al., (2012) Shankar, F., Marulli, F., Mathur, S., Bernardi, M., and Bournaud, F. (2012). Black holes in pseudobulges: demography and models. A&A, 540:A23.
- Shen et al., (2003) Shen, S., Mo, H. J., White, S. D. M., Blanton, M. R., Kauffmann, G., Voges, W., Brinkmann, J., and Csabai, I. (2003). The size distribution of galaxies in the Sloan Digital Sky Survey. MNRAS, 343:978–994.
- Simien and de Vaucouleurs, (1986) Simien, F. and de Vaucouleurs, G. (1986). Systematics of bulge-to-disk ratios. ApJ, 302:564–578.
- Somerville et al., (2008) Somerville, R. S., Hopkins, P. F., Cox, T. J., Robertson, B. E., and Hernquist, L. (2008). A semi-analytic model for the co-evolution of galaxies, black holes and active galactic nuclei. MNRAS, 391:481–506.
- Somerville et al., (2001) Somerville, R. S., Primack, J. R., and Faber, S. M. (2001). The nature of high-redshift galaxies. MNRAS, 320:504–528.
- Spinoso et al., (2017) Spinoso, D., Bonoli, S., Dotti, M., Mayer, L., Madau, P., and Bellovary, J. (2017). Bar-driven evolution and quenching of spiral galaxies in cosmological simulations. MNRAS, 465:3729–3740.
- Springel, (2005) Springel, V. (2005). The cosmological simulation code GADGET-2. MNRAS, 364:1105–1134.
- Springel et al., (2001) Springel, V., White, S. D. M., Tormen, G., and Kauffmann, G. (2001). Populating a cluster of galaxies - I. Results at [formmu2]z=0. MNRAS, 328:726–750.
- Tacconi et al., (2002) Tacconi, L. J., Genzel, R., Lutz, D., Rigopoulou, D., Baker, A. J., Iserlohe, C., and Tecza, M. (2002). Ultraluminous Infrared Galaxies: QSOs in Formation? ApJ, 580:73–87.
- Tamburri et al., (2014) Tamburri, S., Saracco, P., Longhetti, M., Gargiulo, A., Lonoce, I., and Ciocca, F. (2014). The population of early-type galaxies: how it evolves with time and how it differs from passive and late-type galaxies. A&A, 570:A102.
- Tonini et al., (2016) Tonini, C., Mutch, S. J., Croton, D. J., and Wyithe, J. S. B. (2016). The growth of discs and bulges during hierarchical galaxy formation - I. Fast evolution versus secular processes. MNRAS, 459:4109–4129.
- Toomre, (1981) Toomre, A. (1981). What amplifies the spirals. In Fall, S. M. and Lynden-Bell, D., editors, Structure and Evolution of Normal Galaxies, pages 111–136.
- Ueda et al., (2014) Ueda, J., Iono, D., Yun, M. S., Crocker, A. F., Narayanan, D., Komugi, S., Espada, D., Hatsukade, B., Kaneko, H., Matsuda, Y., Tamura, Y., Wilner, D. J., Kawabe, R., and Pan, H.-A. (2014). Cold Molecular Gas in Merger Remnants. I. Formation of Molecular Gas Disks. ApJS, 214:1.
- van der Wel et al., (2014) van der Wel, A., Franx, M., van Dokkum, P. G., Skelton, R. E., Momcheva, I. G., Whitaker, K. E., Brammer, G. B., Bell, E. F., Rix, H.-W., Wuyts, S., Ferguson, H. C., Holden, B. P., Barro, G., Koekemoer, A. M., Chang, Y.-Y., McGrath, E. J., Häussler, B., Dekel, A., Behroozi, P., Fumagalli, M., Leja, J., Lundgren, B. F., Maseda, M. V., Nelson, E. J., Wake, D. A., Patel, S. G., Labbé, I., Faber, S. M., Grogin, N. A., and Kocevski, D. D. (2014). 3D-HST+CANDELS: The Evolution of the Galaxy Size-Mass Distribution since z = 3. ApJ, 788:28.
- van Dokkum, (2005) van Dokkum, P. G. (2005). The Recent and Continuing Assembly of Field Elliptical Galaxies by Red Mergers. AJ, 130:2647–2665.
- White and Frenk, (1991) White, S. D. M. and Frenk, C. S. (1991). Galaxy formation through hierarchical clustering. ApJ, 379:52–79.
- White and Rees, (1978) White, S. D. M. and Rees, M. J. (1978). Core condensation in heavy halos - A two-stage theory for galaxy formation and clustering. MNRAS, 183:341–358.
- (118) Zana, T., Dotti, M., Capelo, P. R., Bonoli, S., Haardt, F., Mayer, L., and Spinoso, D. (2018a). External versus internal triggers of bar formation in cosmological zoom-in simulations. MNRAS, 473:2608–2621.
- (119) Zana, T., Dotti, M., Capelo, P. R., Mayer, L., Haardt, F., Shen, S., and Bonoli, S. (2018b). Bar resilience to flybys in a cosmological framework. MNRAS, 479:5214–5219.
- Zoldan et al., (2018) Zoldan, A., De Lucia, G., Xie, L., Fontanot, F., and Hirschmann, M. (2018). Structural and dynamical properties of galaxies in a hierarchical Universe: sizes and specific angular momenta. MNRAS, 481:1376–1400.
Appendix A Galactic sizes
A.0.1 Disk size
One of the fundamental properties of galaxies is the radial size of their disks, as many evolutionary quantities depend on it (such as the dynamical time of the disk and the galaxy SFR, for instance; for more details see e.g. Henriques et al.,, 2015; Guo et al.,, 2011). To compute the radii of both gaseous and stellar disk components, the model assumes exponential density profiles, so that both can be written as:
| (7) |
| (8) |
where and are the central surface densities of gaseous and stellar disks, respectively, while and are their scale lengths. In particular, the two latter values are given by:
| (9) |
| (10) |
are the total angular momentum values of the gaseous and stellar disk, respectively. It is clear, then, that it is crucial to model the time evolution of the disks angular momentum in order for the model to provide a good description of their radii.
During the evolution of galaxies in the model, both internal and external processes (such as cooling, star formation and SN feedback, or galaxy mergers respectively) induce modifications of the galactic disk’s total angular momentum vector (). Following Guo et al., (2011), the variation of can be written as:
| (11) |
where each of the three components on the right-hand side is the variation of angular momentum induced on the gas disk by a specific process. An analogous relation can be written for the stellar disk angular momentum, under the simplifying assumption that the only process contributing is star formation:
| (12) |
A.0.2 Bulge size after a merger
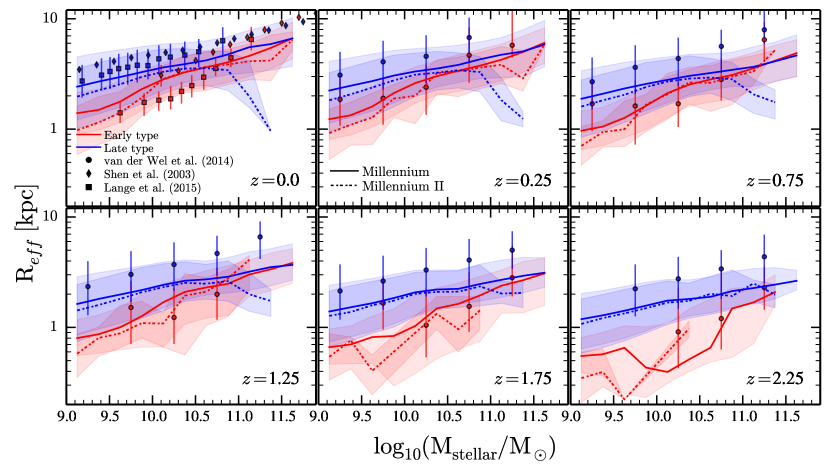
It has been shown that SAMs generate unrealistic bulge sizes if the dissipation of energy during gas rich mergers is not take into account (Naab et al.,, 2006; Shankar et al.,, 2013; Zoldan et al.,, 2018). Here we address this issue, implementing some analytic expressions presented in the literature. Following the standard picture, when a merger takes place the half-mass radii of the new bulge is computed via energy conservation and virial theorem (Covington et al.,, 2011; Guo et al.,, 2011; Porter et al.,, 2014; Tonini et al.,, 2016):
| (13) |
where , , and are, respectively, the total binding energy of the merger remnant, the self-binding energy of the progenitor, the orbital energy and the losses via dissipation by the gas component due to shocks. The latter can be written as:
| (14) |
where is an efficiency parameter set to 2.75 (Covington et al.,, 2011) and , the total merger gas fraction. Therefore, developing Eq.(13) can be computed from:
| (15) |
where quantifies the orbital energy of the system and is a structural parameter. From hereafter, we assume (Guo et al.,, 2011) and (see the discussion in Shankar et al.,, 2013). The values of and are respectively the total mass of the progenitor 1 and 2 involved in the bulge formation/growth after the merger and , its respective half-mass radii.
Following the minor merger formalism described in Section 2.2.1 we assume that and . Since during these processes the gas does not reach the bulge region, we assume no dissipation losses, i.e (see more details in Shankar et al.,, 2013). On the other hand, in major mergers we allow dissipation effects as a consequence of the violent interaction setting and as the total baryonic mass (stellar and gas) of the central and satellite galaxy, respectively. To take into account that throughout this events the central parts of the dark matter halo is expected to behave with similar stellar dynamic, is changed by (see Shankar et al.,, 2013; Lagos et al.,, 2018). Following Lagos et al., (2018) we set . The value of is computed assuming a Navarro-Frenk-White profile (Navarro et al.,, 1996) with a concentration parameter computed using the fit presented in Dutton and Macciò, (2014) for the Planck cosmology.
A.0.3 Bulge size after a DI
The bulge formation during this DI processes has to be modeled as well. The full analysis is described in Guo et al., (2011) but here we will summarize the main characteristics. When the galaxy does not host any bulge, the half mass radius of the newly formed bulge () can be found by solving:
| (16) |
where we had take into account the stellar surface density of Eq.(8) and scale length of Eq.(9). In the case of a pre-existing bulge, the DI bulge is generated as before but assuming that it mergers instantaneously with the old one in the same process explained in Eq.(15) with and and the parameters , to take into account the fact that the inner disc and the pre-existing bulge are concentric and have no relative motion.
In Fig 19 we present the redshift evolution of galaxy sizes for MS and MSII (solid and dashed lines, respectively). The 3D galaxy effective radius () has been computed as the mass weighted average of the bulge () and stellar disc () half-mass radii. To compare with data, we have converted the 3D into 2D projected half-mass radii () by using the conversion factor presented in Shankar et al., (2013). Blue and red lines represents respectively the population of late-type (disk-to-total ratio ) and early-type () galaxies. We have presented the predictions at 6 different redshift and . We compare them with the data available in Shen et al., (2003); van der Wel et al., (2014) and Lange et al., (2015). As we can see, low massive galaxies in both early and late type population follow the observational trend. Nevertheless, for the most massive galaxies we predict slightly smaller radius. Probably, this is the consequence of the fact that we under-predict (overpredict) the elliptical (spiral) population in the most massive stellar mass bins (see Fig 3). In spite of that, we are able to reproduce the redshift evolution of the stellar-size relation with a remarkable agreement with the observations.
Appendix B Convergence in the morphology for Millennium and Millennium II: A matter of major, minor mergers and smooth accretion
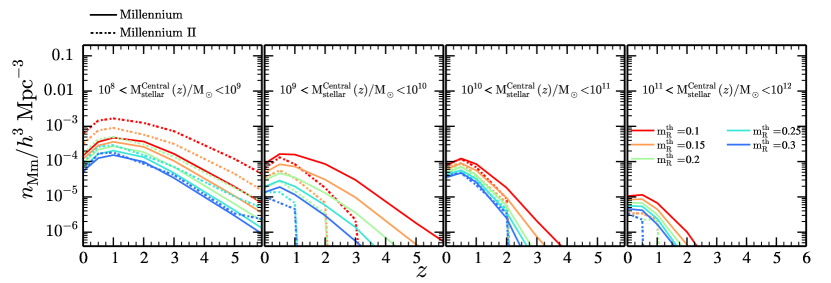
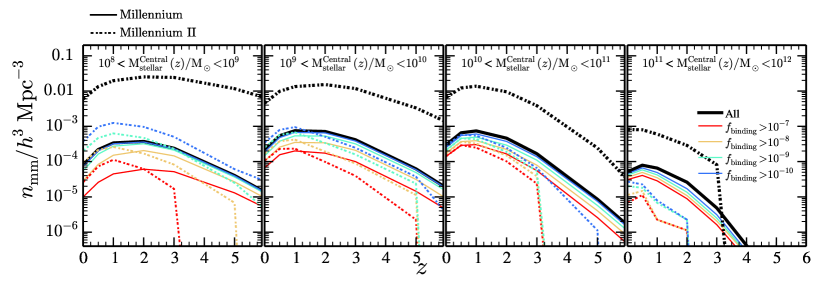
In this appendix we explore the convergence of the galaxy morphology at intermediate and low stellar masses between Millennium and Millennium II. By studying the mergers characteristics we find out that the responsible of the morphological disagreement between MS and MSII is a combination of major mergers and extreme minor mergers lead by small dwarf galaxies ().
In order to investigate the morphology discrepancy between Millennium simulations, we started to explore the major mergers predictions. In Fig 20 upper panel it is presented the redshift evolution of MS and MSII major mergers number density at various values. Each panel correspond to different central galaxy stellar mass at the moment of the merger, . While galaxies with display similar values in MS and MSII at any threshold121212The small disagreement is just due to MSII box size: massive galaxies are rare in a box side, especially at high-., the predictions for galaxies with diverge. At small thresholds () the deviation between MSII and MS is almost one order of magnitude regardless of redshift. Increasing the value () the difference is reduced to a factor 3. Such disagreement can be easily understood by the fact that MSII is able to resolve smaller subhalos around central galaxies. Hence, small galaxies hosted in the friend-of-friend central subhalo experience more frequently mergers with satellites galaxies of comparable baryonic mass. As can be seen in Fig 23 first row the change of has also an impact in the galaxy morphology. The high N-body resolution of MSII combined with low values of (set to 0.1 in the standard model) favors an increase of the elliptical galaxies at small stellar masses and overestimate the spiral population at . Our analysis suggest that an improvement in the convergence of MS and MSII galaxy morphology and in the MSII disk-dominated galaxy population is achieved by imposing large values. From hereafter we decide to use (closer to other thresholds imposed in others SAMs, see Somerville et al., (2001); Hatton et al., (2003); Lacey et al., (2016); Lagos et al., (2018)), based on the number densities presented in Fig 20.
Nevertheless, as can be seen in Fig 23 first row the difference in is not the unique cause of the MS and MSII morphology deviation. It is needed to explore the effect of the other type of galaxy mergers, i.e minor mergers. In Fig 20 lower panel we present, as we did with before, the number density of minor mergers as a function of redshift split in different central galaxy stellar mass. As we can see, the figure shows something expected: L-Galaxies run on top of MSII mergers trees predicts higher than run on the MS ones (see black lines). In particular the differences increases when we decrease the central stellar mass: form at masses up to at masses . To explore the characteristics of the merging satellite galaxies, in Fig 21 it is presented at different redshifts () their typical stellar mass. MS predicts a median merging satellite mass with a small redshift evolution. Besides, more massive galaxies experience minor merger with slightly more massive galaxies. On contrary, MSII predicts smaller merging satellites (dwarf galaxies) with not redshift evolution and dependence with the central galaxy stellar mass. In particular, we have found that these small mergers are the ones that lead the morphological change in galaxies with . Such extreme interactions enlarge the bulges of the small central galaxies by incorporating the whole stellar mass of the satellites while their stellar disks are unable to increase in mass as the cold-gas content is no large enough to reach the critical mass imposed by the SAM to trigger an episode of star formation (, see Eq.S14 of Henriques et al., (2015))131313Note that a more accurate description of star formation might come by linking this process with the molecular gas component instead of the total cold gas (see Lagos et al.,, 2011), as also discussed in Henriques et al., (2015).. Besides, merger induced bursts are not efficient either in this task. According to the merger ratios and the SAM efficiency parameters, less than the % of the total cold gas component is transformed in stars, i.e of new stars is added in the disk. Hence, the combination of the high number density of small interactions, the inefficient star formation and the simple minor merger recipe of L-Galaxies produces the unrealistic bust in the bulge-to-total ratio in the low mass population of MSII, as can be seen in Fig 23. All this points to the needed to update the minor mergers prescription implemented in L-Galaxies , as this appears to be not fully valid for treating interactions with extreme mass-ratios, particularly common in the MSII merger trees. We thus introduced a new set of prescriptions to include smooth accretion as an additional channel for galaxy interactions (see e.g. Abadi et al.,, 2003; Peñarrubia et al.,, 2006; Sales et al.,, 2007; Kazantzidis et al.,, 2008).
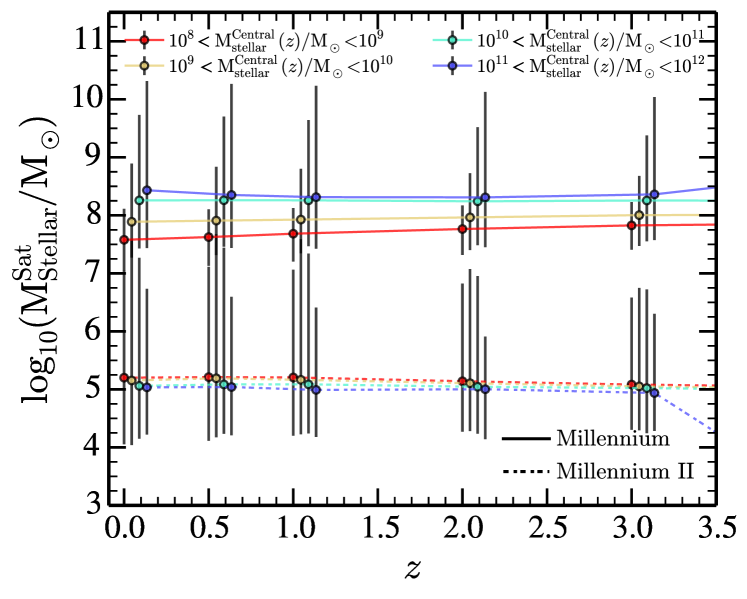
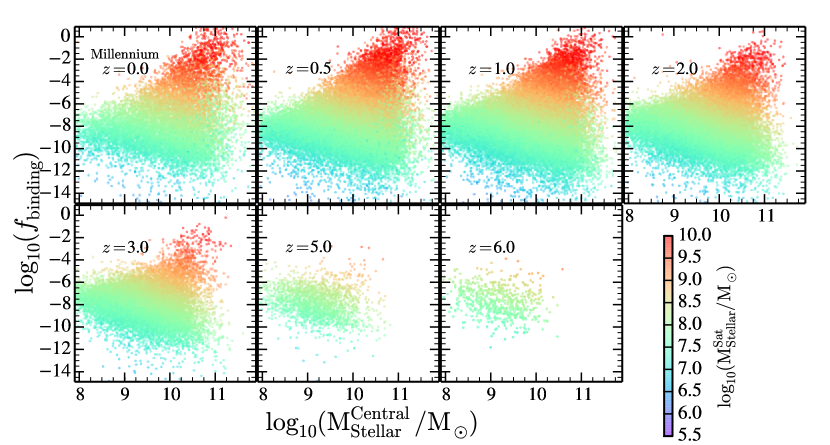
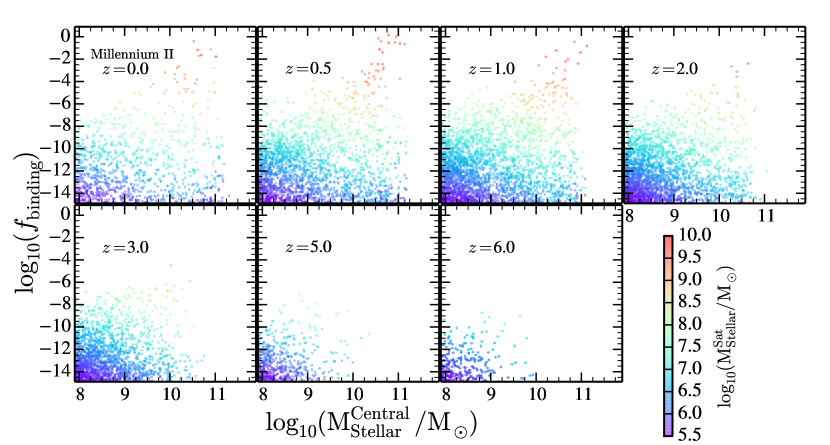
As we said, probably the crude minor merger recipe implemented in L-Galaxies is not completely valid in MSII. Its merger trees allow us to resolve the mergers of dwarf galaxies whose merger interaction may not be completely address with the L-Galaxies standard recipe. In order to improve this scenario, we are going to allow another different minor interaction: smooth accretion (Abadi et al.,, 2003; Peñarrubia et al.,, 2006; Sales et al.,, 2007; Kazantzidis et al.,, 2008). While in minor merges we follow the standard procedure presented L-Galaxies assuming that the whole stellar mass of the satellite galaxy is able to keep bound during the merger episode and reaches the central galaxy bulge, smooth accretions are characterized by a deposit of the whole satellite stellar mass onto the central galaxy stellar disk. This scenario takes place when the stellar system (bulge and disk) of the satellite galaxy does not have the enough energy to keep it together and it is progressively diluted in the central galaxy stellar disk without the possibility of reaching the central galaxy center. We want to emphasize that smooth accretion concept introduced here is not related with the already implemented tidal stripping events before the merger. Smooth accretion goes beyond it and takes into account the redistribution of the satellite stellar mass that would happen during its interaction with the central galaxy disk throughout the galaxy-galaxy collision.
In order to establish in which systems the minor mergers or smooth accretions take place, we are going to study the ratio of the two merging galaxies binding energies, . For the binding energy definition we only consider the interacting systems: for the satellite binding energy, , we only consider its stellar mass while for the central one, , we use the total mass in the disk (gas + stars). Therefore:
| (17) |
where is the mass-weighted average of the half-mass radii of the satellite bulge and the disc components and the same but using the cold and stellar disk of the central galaxy. Large values of means that the two interacting systems have similar binding energy so the satellite galaxy might survive the interaction inside of the central disk and reach the centre of its massive companion. On the contrary, low values of imply the the central galaxy can easily unbound the satellite stellar system inside its disk. In Fig 22 we present the plane at different redshifts for MS and MSII. The color encodes the satellite stellar mass. The figure shows that is span in a wide range of values with a clear stellar mass trend and independence with redshift. On one hand, large are concentrated in the more massive galaxies () as a natural consequence of the fact that they can experience minor interactions with massive galaxies harder to unbound. On the other hand, small central galaxies () display smaller values during their minor interactions. This ones happen with satellites of low stellar mass compared with the central galaxy stellar and gas disk mass (as we will see in the stellar merger ratio of Fig 24).
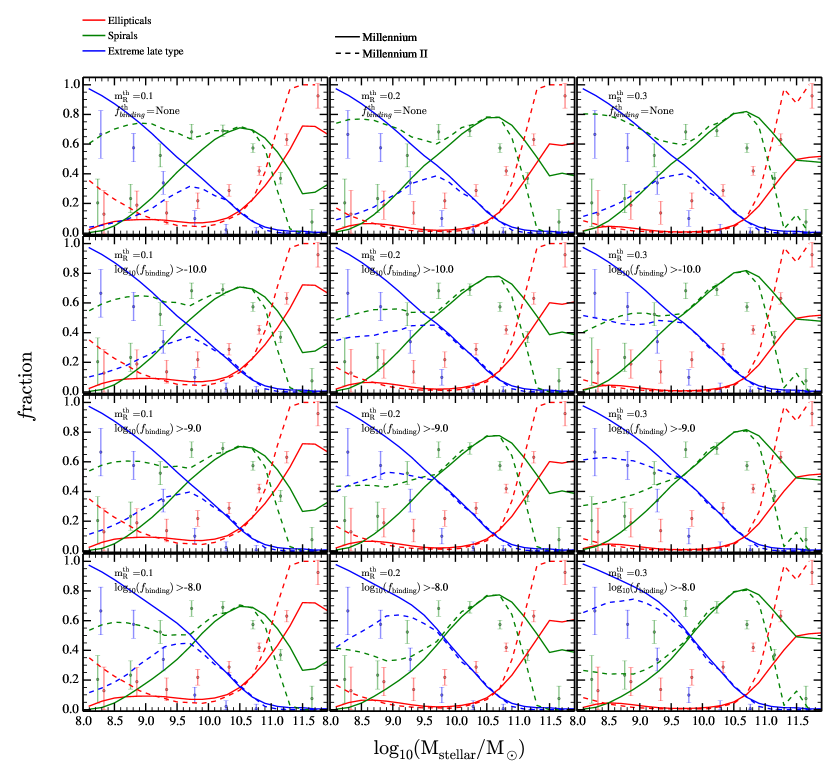
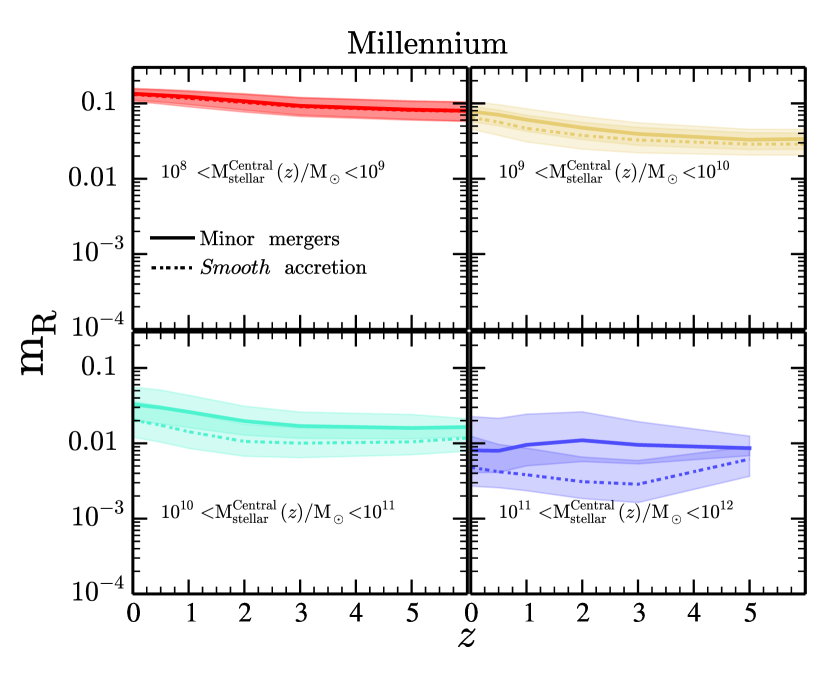
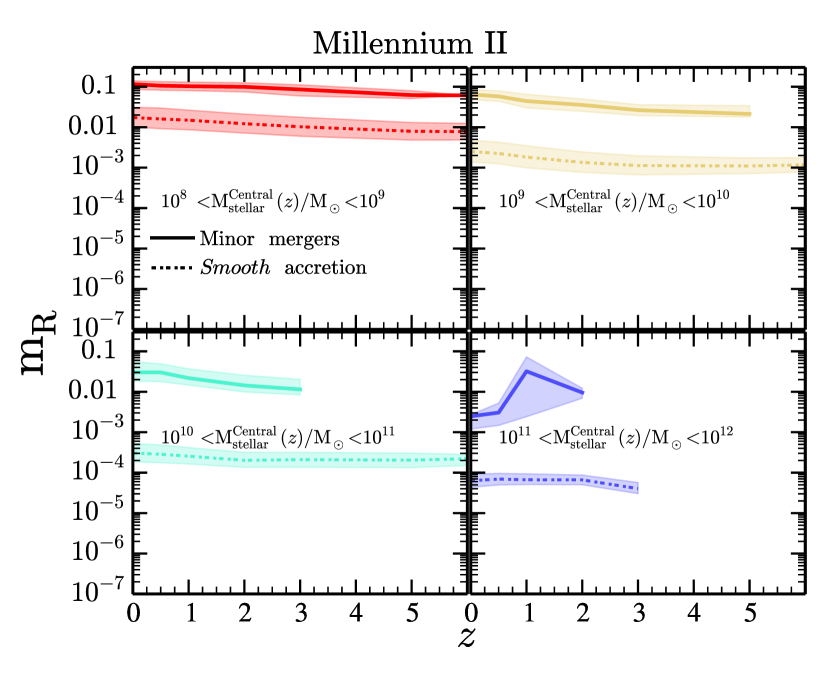
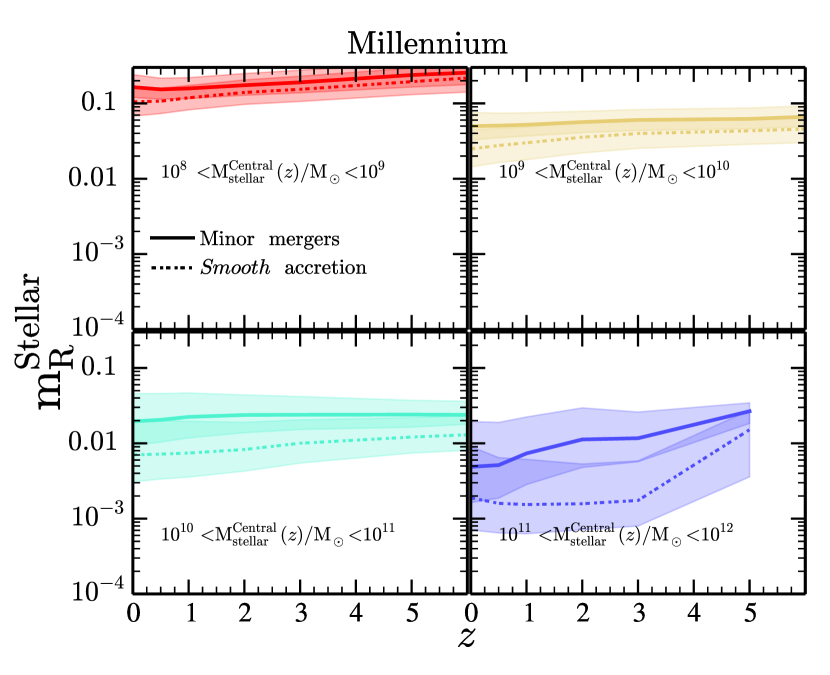
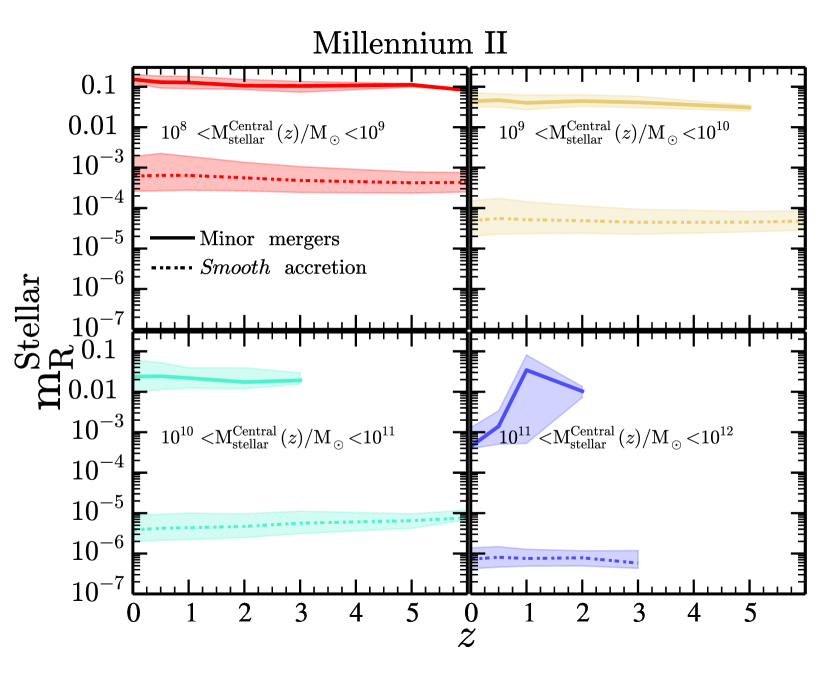
In Fig 20 lower panel it is presented the evolution of when we impose different values to set apart minor mergers from smooth accretion. Different colors correspond to different thresholds in . As we can see, smalls thresholds () have almost a null effect in MS but with dramatic consequences for MSII as they are able to reduce the value of MSII . Among all the possibles values of we find a reasonable convergence at . Naturally, different cuts have also a different repercussion in in the galaxy morphology. In order to study this, in Fig 23 second column we present the morphology at different thresholds, fixing . Other columns display the same but varying too. As we can see, despite values have an improvement in the low mass galaxies it is not enough to make MS and MSII converge. When we impose , the improvement in MSII is remarkable. Notice that different thresholds have a minimum effect in MS. We have found that the best threshold is in binding energy ratios to differentiate between smooth accretion () and minor merger (). Notice, that even though this procedure is a way to make converge the two simulations and make the MSII follow the observational data, one could try to implement others prescriptions like an smooth transition between major-minor merger like Hatton et al., (2003) and Somerville et al., (2008) do or try to implement the fact that during major mergers part of the galactic disc could survive (see Hopkins et al., 2009a and Hopkins et al., 2009b ). Nevertheless, given that our approx works and is the simplest thing we do not implement any of the previous cases but in futures works this topic should be address and take into account.
Finally, we have explore for minor mergers and smooth accretion the typical baryonic and stellar merger ratio, and respectively. Fig 24 presents the results as a function of redshift and central galaxy stellar mass at the moment of the merger, . Regarding the baryonic merger ratio, we can see that both MS and MSII display the increasing trend of value towards lower stellar masses. Interestingly, independently of redshift and central galaxy stellar mass both MS and MSII show that smooth accretion display smaller merger ratios than minor merger, fact that is more evident in the MSII than in the MS (consequence of resolution effects). Concerning , we see a similar behavior to the one. However, in this case the difference between minor mergers and smooth accretion is more extreme. While minor mergers values are between 0.1 - 0.01, smooth accretion ones display values of .