Discovery of the first low-luminosity quasar at
Abstract
We report the discovery of a quasar at , which was selected from the deep multi-band imaging data collected by the Hyper Suprime-Cam (HSC) Subaru Strategic Program survey. This quasar, HSC , has an order of magnitude lower luminosity than do the other known quasars at . The rest-frame ultraviolet absolute magnitude is mag and the bolometric luminosity is erg s-1. Its spectrum in the optical to near-infrared shows strong emission lines, and shows evidence for a fast gas outflow, as the C IV line is blueshifted and there is indication of broad absorption lines. The Mg II-based black hole mass is , thus indicating a moderate mass accretion rate with an Eddington ratio . It is the first quasar with sub-Eddington accretion, besides being the third most distant quasar, known to date. The luminosity and black hole mass are comparable to, or even lower than, those measured for the majority of low- quasars discovered by the Sloan Digital Sky Survey, and thus this quasar likely represents a counterpart to quasars commonly observed in the low- universe.
1 Introduction
Quasars residing in the first billion years of the Universe () have been used as various types of probes into early cosmic history. The progress of cosmic reionization can be estimated from H I absorption imprinted on the rest-frame ultraviolet spectrum of a high- quasar; this absorption is very sensitive to the neutral fraction of the foreground intergalactic medium (IGM; Gunn & Peterson, 1965; Fan et al., 2006a). The luminosity and mass functions of quasars reflect the seeding and growth mechanisms of supermassive black holes (SMBHs), which can be studied through comparison with theoretical models (e.g., Volonteri, 2012; Ferrara et al., 2014; Madau et al., 2014). Measurements of quasar host galaxies and surrounding environments tell us about the earliest mass assembly, possibly happening in the highest density peaks of the underlying dark matter distribution (e.g., Goto et al., 2009; Decarli et al., 2017; Izumi et al., 2018).
Quasars at the highest redshifts are of particular interest, as they have spent only a short time since their formation. The current frontier for high- quasar searches is , where only a few quasars have been found to date. Since radiation from quasars is almost completely absorbed by the IGM at observed wavelengths 9700 Å, and such objects are very rare and faint, one needs wide-field deep imaging in near-infrared (IR) bands or in the -band with red-sensitive CCDs to discover those quasars. The first quasar was discovered by Mortlock et al. (2011) at , from the United Kingdom Infrared Telescope (UKIRT) Infrared Deep Sky Survey (UKIDSS; Lawrence et al., 2007) data. The second one was discovered by Bañados et al. (2018) at , by combining data from the Wide-field Infrared Survey Explorer (Wright et al., 2010), UKIDSS, and the Dark Energy Camera Legacy Survey111 http://legacysurvey.org/decamls. In addition, two quasars, both at , were recently discovered (Wang et al., 2018; Yang et al., 2018) by combining datasets from several wide-field surveys, including the Dark Energy Survey (DES Collaboration, 2005), the Dark Energy Spectroscopic Instrument legacy imaging surveys (Dey et al., 2018), and the Panoramic Survey Telescope & Rapid Response System 1 (Pan-STARRS1; Chambers et al., 2016).
However, the above quasars are all very luminous (if they are not strongly lensed; e.g., Fan et al., 2018; Pacucci & Loeb, 2018), due to the detection limits of the imaging survey observations. These quasars harbor SMBHs with masses of roughly a billion solar masses, shining at close to the Eddington luminosity (however the black hole mass of one of the quasars at has not been measured; Yang et al., 2018). They likely represent the most extreme monsters, which are very rare at all redshifts, especially at . To understand a wider picture of the formation and early evolution of SMBHs, it is crucial to find quasars of more typical luminosity, which would be direct counterparts to low- ordinary quasars.
This letter presents the discovery of a quasar at , HSC (hereafter “”), which has an order of magnitude lower luminosity than do the other known quasars. It harbors a SMBH with a mass of and shining at an Eddington ratio . We describe the target selection and spectroscopic observations in §2. The spectral properties of the quasar are measured and discussed in §3. A summary appears in §4. We adopt the cosmological parameters = 70 km s-1 Mpc-1, = 0.3, and = 0.7. All magnitudes refer to point spread function (PSF) magnitudes in the AB system (Oke & Gunn, 1983), and are corrected for Galactic extinction (Schlegel et al., 1998).
2 Observations
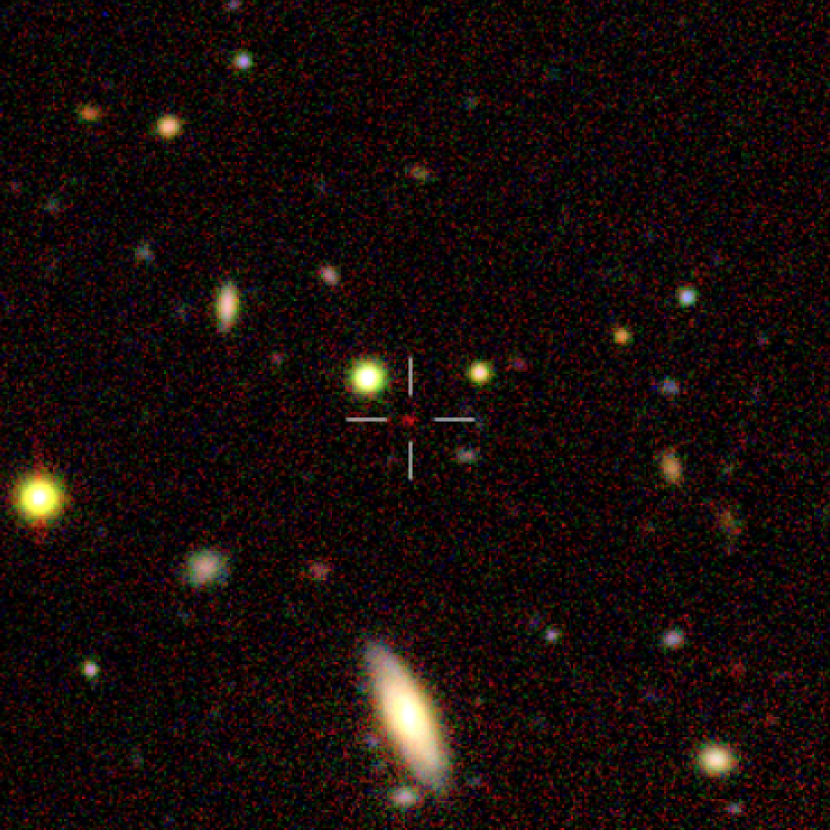
was selected from the Hyper Suprime-Cam (HSC) Subaru Strategic Program (SSP) survey (Aihara et al., 2018a) data, as a part of the “Subaru High- Exploration of Low-Luminosity Quasars (SHELLQs)” project (Matsuoka et al., 2016, 2018a, 2018b, 2018c). The coordinates and brightness are summarized in Table 3. A three-color composite image around the quasar is presented in Figure 1. This source has a full-width-at-half-maximum (FWHM) size of 0″.7 on the -band image, which is consistent with the PSF size estimated at the corresponding image position. We used the methods detailed in Matsuoka et al. (2018b) to select this source as a high- quasar candidate. The probability that this source was a quasar, not a Galactic brown dwarf, was , based on our Bayesian probabilistic algorithm (Matsuoka et al., 2016) and the HSC , , and -band photometry. It is among 30 -band dropout objects in our quasar candidate list; we have so far conducted follow-up observations of roughly half of these candidates, and partly reported the results in the SHELLQs papers mentioned above. The highest- quasar we found and published previously is at (Matsuoka et al., 2018a).
| R.A. | 12h43m53s\@alignment@align.93 |
|---|---|
| Decl. | +01∘00′38″\@alignment@align.5 |
| (mag) | 26\@alignment@align.7 (2) |
| (mag) | 26\@alignment@align.5 (2) |
| (mag) | 26\@alignment@align.7 (2) |
| (mag) | 25\@alignment@align.8 (2) |
| (mag) | 23\@alignment@align.57 0 |
| (mag) | 22\@alignment@align.82 0 |
| (mag) | \@alignment@align |
| (erg s-1) | (1\@alignment@align.4 0 |
We obtained a red-optical spectrum of the candidate using the Faint Object Camera and Spectrograph (FOCAS; Kashikawa et al., 2002) mounted on the Subaru telescope. The observations were carried out on 2018 April 24 as a part of a Subaru intensive program (program ID: S16B-011I). We used FOCAS in the multi-object spectrograph mode with the VPH900 grism and SO58 order-sorting filter. With a slit width of 1″.0, this configuration gave spectral coverage from 0.75 to 1.05 m and resolution . We took 7 10-min exposures with 1″ dithering between exposures along the slit, under photometric skys with the seeing around 0″.6. The data were reduced with IRAF using the dedicated FOCASRED package in the standard manner. The wavelength scale was calibrated with reference to sky emission lines, and the flux calibration was tied to a white dwarf standard star, Feige 34, observed on the same night. The slit loss was corrected for by scaling the spectrum to match the HSC -band magnitude (Table 3).
A near-IR spectrum of the object was obtained with the Gemini Near-InfraRed Spectrograph (GNIRS; Elias et al., 2006) on the Gemini-north telescope. The observations were carried out on 2018 June 25, July 22 and 29 in the queue mode (program ID: GN-2018A-FT-112). We used the cross-dispersed mode with 32 l/mm grating, with the central wavelength set to 1.65 m. The slit width was 1″.0, which gave spectral coverage from 0.85 to 2.5 m and resolution . We took 36 5-min exposures in total, with 3″ dithering between exposures along the slit, under spectroscopic skys with the seeing 0″.5 – 0″.7. The data reduction was performed with IRAF using the Gemini GNIRS package, in the standard manner. The wavelength scale was calibrated with reference to Argon lamp spectra, and the flux calibration and telluric absorption correction were tied to a standard star, HIP 58510, observed right before or after the quasar observations at similar airmass. We scaled the GNIRS spectrum to match the FOCAS spectrum in the overlapping wavelength range.
In addition, we took a -band spectrum of the quasar with the Multi-Object Infrared Camera and Spectrograph (MOIRCS; Ichikawa et al., 2006) on the Subaru telescope. The observations were carried out on 2018 July 8 and 9 (program ID: S18A-061). We used MOIRCS in the multi-object spectrograph mode with the VPH- grism. The slit width was 0″.8, which gave spectral coverage from 1.8 to 2.5 m and resolution . We took 34 4-min exposures in total, with 3″ dithering between exposures along the slit, under spectroscopic skys with the seeing 0″.5 – 0″.8. The data reduction was performed with IRAF using the MCSMDP package, in the standard manner. The wavelength scale was calibrated with reference to sky emission lines, and the flux calibration and telluric absorption correction were tied to a standard star, HIP 69747, observed right after the quasar observations. We scaled the MOIRCS spectrum to match the GNIRS spectrum in the overlapping wavelength range.
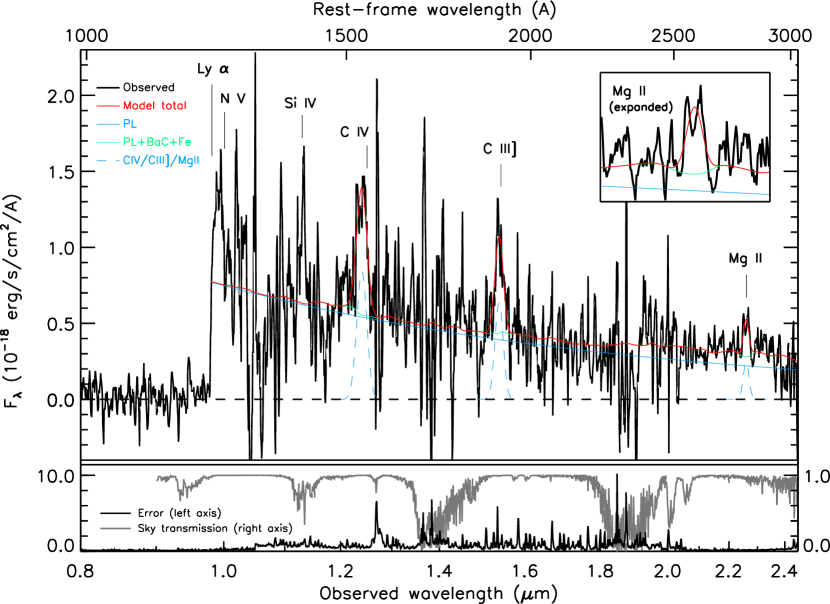
Finally, the FOCAS, GNIRS, and MOIRCS data were merged into a single spectrum, with a wavelength pixel spacing of / = 1500. The associated errors were derived from the sky background spectrum measured for each of the above observations, and were propagated to the final spectrum. Figure 2 presents the merged spectrum and errors, which are used for the measurements described in the following section. While the spectrum may show marginally positive flux in the Gunn & Peterson (1965) trough bluewards of Ly, these are likely due to imperfect sky subtraction, as we see no signal at 0.98 m in the 2d spectrum. The Mg II line appears to have two peaks, but these peaks do not appear consistently among the individual exposures and are likely due to noise.
3 Spectral Measurements
We measured spectral properties of the quasar through model fitting. The model consists of a power-law continuum with a slope (Vanden Berk et al., 2001)444 We also tried fitting with a variable slope and found that this parameter is poorly constrained (), presumably due to degeneracy with the other continuum components and the limited signal-to-noise ratio (S/N) of the present data. , Balmer continuum (De Rosa et al., 2011), Fe II Fe III pseudo-continuum (Vestergaard & Wilkes, 2001; Tsuzuki et al., 2006, modified following Kurk et al. (2007)), and Gaussian profiles to represent the C IV 1549, C III] 1909, and Mg II 2800 emission lines. Each emission line was modeled with a single Gaussian, given the limited S/N of the spectrum. The fitting was performed in the rest-frame wavelength range from = 1450 Å to 3000 Å, which contains the three emission lines listed above555 We did not include in the fitting the spectral region around Si IV 1400, which is affected by the low atmospheric transmission and possibly by broad absorption lines (BALs; see below). . All model components were fitted simultaneously to the data via minimization, which provided the best-fit parameter values and associated errors. The derived best-fit model is presented in Figure 2.
We measured the apparent and absolute magnitudes of the quasar at = 1450 Å from the best-fit power-law continuum. We also measured the continuum luminosity at = 3000 Å from the best-fit model, and converted to the bolometric luminosity assuming a bolometric correction factor BC3000 = 5.15 (Shen et al., 2011). The results are listed in Table 3.
Table 2 summarizes the emission line properties derived from the best-fit Gaussian models. The quasar redshift measured from the Mg II line is . We found that the emission lines from the higher ionization species, C IV in particular, are significantly blueshifted relative to Mg II. We estimated the black hole mass () from the FWHM of Mg II and the continuum luminosity at = 1350 Å, using the calibration presented by Vestergaard & Osmer (2009) 666We could use the continuum luminosity estimated at a wavelength closer to the Mg II line, but given the limited S/N of the present data, the measurement would be affected by the degeneracy of the three (power-law, Balmer, and iron) continuum components. We checked that the estimate doesn’t change significantly when the continuum luminosity at 2100 or 3000 Å is used alternatively, with the corresponding calibration factor from Vestergaard & Osmer (2009).. This yielded , and an Eddington ratio . The systematic uncertainty of the above calibration is estimated to be a factor of a few, which is not included in the and errors presented in this letter.
The Ly strength relative to the above emission lines appears weaker than observed in low- quasars (e.g., Vanden Berk et al., 2001). This is likely due to IGM absorption, including damping wing absorption redwards of Ly , and/or possible BALs. We defer detailed modeling of these absorptions to a future paper, and here measured the Ly N V 1240 flux by simply integrating observed flux excess above the continuum model over Å; the result is listed in Table 2.
| Ly + N V 1240 | C IV 1549 | C III] 1909 | Mg II 2800 | |
|---|---|---|---|---|
| Redshift | 7.07 0.01 | |||
| Velocity offset (km s-1) | 2400 500 | 800 400 | ||
| Flux (erg s-1 cm-2) | (9.6 0.4) 10-17 | (2.1 0.4) 10-16 | (1.6 0.5) 10-16 | (6.2 1.9) 10-17 |
| REW (Å) | 16 1 | 48 10 | 51 15 | 35 11 |
| FWHM (km s-1) | 5500 1300 | 4600 1500 | 3100 900 | |
| () | (3.3 2.0) 108 | |||
| 0.34 0.20 |
Note. — The velocity offsets were measured relative to Mg II 2800. The FWHMs were corrected for the instrumental velocity resolution.
Figure 3 compares the estimated black hole mass and bolometric luminosity of with those of other quasars in the literature. While the other known quasars have and radiate at the rates close to the Eddington limit, has a considerably lower-mass black hole and is shining at a sub-Eddington rate. The luminosity and black hole mass of are comparable to, or even lower than, those measured for the majority of low- quasars in the Sloan Digital Sky Survey (SDSS) Data Release 7 (DR7) catalog (Shen et al., 2011). Thus, this quasar likely represents the first example of an ordinary quasar beyond .
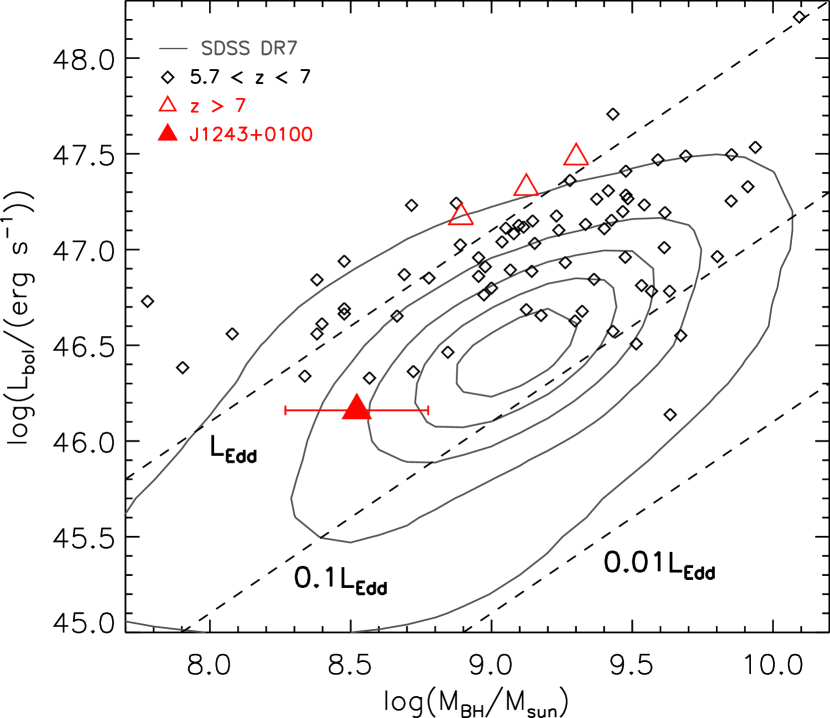
On the other hand, given the limited S/N of the spectrum, the present measurements of and could be biased; for example, noise spikes can affect measurement of the Mg II line width significantly. We added artificial errors to the spectrum, based on the observed noise array, and performed the model fitting for 100 realizations of the generated spectrum. This yielded and (the median values and intervals containing 68% of the realizations), while 5 and 2 % of the realizations gave (, ) and (, ), respectively. Deeper observations than presented here are clearly needed to better characterize this quasar.
has strong emission lines with high equivalent widths, compared to the luminous quasars, which may in part reflect the so-called Baldwin (1977) effect. We found that the rest-frame equivalent widths (REWs) of the emission lines listed in Table 2 are comparable to those of low- counterparts. In particular, the median REWs of 13,000 SDSS DR7 quasars, selected to have continuum luminosities within 0.1 dex of , are 49 Å and 36 Å for C IV and Mg II, respectively. This may indicate that the physical conditions in the broad line regions of quasars are similar from to the relatively nearby universe. In addition, the spectrum of may show signs of BALs bluewards of the Si IV and C IV emission lines. While these features are found at wavelengths relatively free from atmospheric absorption, the limited S/N of the present data prevents us from robustly confirming them. This possible BAL signature and the large blueshift of the C IV emission line may indicate the presence of a fast gas outflow close to the quasar nucleus.
An important application of a high- quasar spectrum is to measure the IGM neutral fraction around the quasar, via the absorption damping wing analysis. One could also estimate the quasar lifetime from an analysis of the quasar proximity effect. However, such measurements require accurate modeling of the spectral shape around Ly , which is hard to do with the limited S/N of the present data. The BAL features, if confirmed to be present, may also complicate such analyses for . But these will be interesting subjects of follow-up studies, with deeper spectroscopy in the optical and near-IR. Finally, future observations of this highest- ordinary quasar with, e.g., the Atacama Large Millimeter/ submillimeter Array and the James Webb Space Telescope will allow us to investigate the gaseous and stellar properties of the host galaxy, which will be a key to understand the relationship between the quasar activity and the host galaxy at an early stage of cosmic history.
4 Summary
This letter is the seventh in a series of publications presenting the results from the SHELLQs project, a search for low-luminosity quasars at based on the deep multi-band imaging data produced by the HSC-SSP survey. We presented the discovery of , a quasar at . It was selected as a quasar candidate from the HSC data, and its optical to near-IR spectrum was obtained with FOCAS and MOIRCS on Subaru, and GNIRS on Gemini. The quasar has an order of magnitude lower luminosity than do other known quasars at . The estimated black hole mass is , and the Eddington ratio is . As such, this quasar may represent the first example of an ordinary quasar beyond . The large blueshift of the C IV emission line and possible BAL features suggest the presence of a fast gas outflow close to the quasar nucleus.
The discovery of demonstrates the power of the HSC-SSP survey to explore SMBHs at , with masses typical of lower- quasars. The quasar was selected from 900 deg2 of the survey (including substantial area with partial survey depths), and we are in the course of follow-up observations of the remaining candidates. We expect to find a few more quasars at by the completion of the survey, which is going to cover 1400 deg2 in the Wide layer. Combined with luminous quasars discovered by other surveys, and also with lower- counterparts of ordinary quasars, those high- low-luminosity quasars will provide a significant insight into the formation and evolution of SMBHs across cosmic history.
References
- Aihara et al. (2018a) Aihara, H., Arimoto, N., Armstrong, R., et al. 2018, PASJ, 70, S4
- Aihara et al. (2018b) Aihara, H., Armstrong, R., Bickerton, S., et al. 2018, PASJ, 70, S8
- Baldwin (1977) Baldwin, J. A. 1977, ApJ, 214, 679
- Bañados et al. (2018) Bañados, E., Venemans, B. P., Mazzucchelli, C., et al. 2018, Nature, 553, 473
- Chambers et al. (2016) Chambers, K. C., Magnier, E. A., Metcalfe, N., et al. 2016, arXiv:1612.05560
- Decarli et al. (2017) Decarli, R., Walter, F., Venemans, B. P., et al. 2017, Nature, 545, 457
- De Rosa et al. (2011) De Rosa, G., Decarli, R., Walter, F., et al. 2011, ApJ, 739, 56
- De Rosa et al. (2014) De Rosa, G., Venemans, B. P., Decarli, R., et al. 2014, ApJ, 790, 145
- Dey et al. (2018) Dey, A., Schlegel, D. J., Lang, D., et al. 2018, arXiv:1804.08657
- Eilers et al. (2018) Eilers, A.-C., Hennawi, J. F., & Davies, F. B. 2018, ApJ, 867, 30
- Elias et al. (2006) Elias, J. H., Joyce, R. R., Liang, M., et al. 2006, Proc. SPIE, 6269, 62694C
- Fan et al. (2006a) Fan, X., Carilli, C. L., & Keating, B. 2006, ARA&A, 44, 415
- Fan et al. (2018) Fan, X., Wang, F., Yang, J., et al. 2018, arXiv:1810.11924
- Ferrara et al. (2014) Ferrara, A., Salvadori, S., Yue, B., & Schleicher, D. 2014, MNRAS, 443, 2410
- Goto et al. (2009) Goto, T., Utsumi, Y., Furusawa, H., Miyazaki, S., & Komiyama, Y. 2009, MNRAS, 400, 843
- Gunn & Peterson (1965) Gunn, J. E., & Peterson, B. A. 1965, ApJ, 142, 1633
- Ichikawa et al. (2006) Ichikawa, T., Suzuki, R., Tokoku, C., et al. 2006, Proc. SPIE, 6269, 626916
- Izumi et al. (2018) Izumi, T., Onoue, M., Shirakata, H., et al. 2018, PASJ, 70, 36
- Jiang et al. (2007) Jiang, L., Fan, X., Vestergaard, M., et al. 2007, AJ, 134, 1150
- Kashikawa et al. (2002) Kashikawa, N., Aoki, K., Asai, R., et al. 2002, PASJ, 54, 819
- Kurk et al. (2007) Kurk, J. D., Walter, F., Fan, X., et al. 2007, ApJ, 669, 32
- Lawrence et al. (2007) Lawrence, A., Warren, S. J., Almaini, O., et al. 2007, MNRAS, 379, 1599
- Lord (1992) Lord, S.D. 1992, NASA Technical Memor. 103957
- Madau et al. (2014) Madau, P., Haardt, F., & Dotti, M. 2014, ApJ, 784, L38
- Matsuoka et al. (2016) Matsuoka, Y., Onoue, M., Kashikawa, N., et al. 2016, ApJ, 828, 26
- Matsuoka et al. (2018a) Matsuoka, Y., Iwasawa, K., Onoue, M., et al. 2018a, ApJS, 237, 5
- Matsuoka et al. (2018b) Matsuoka, Y., Onoue, M., Kashikawa, N., et al. 2018b, PASJ, 70, S35
- Matsuoka et al. (2018c) Matsuoka, Y., Strauss, M. A., Kashikawa, N., et al. 2018c, ApJ, 869, 150
- Mazzucchelli et al. (2017) Mazzucchelli, C., Bañados, E., Venemans, B. P., et al. 2017, ApJ, 849, 91
- Mortlock et al. (2011) Mortlock, D. J., Warren, S. J., Venemans, B. P., et al. 2011, Nature, 474, 616
- Oke & Gunn (1983) Oke, J. B., & Gunn, J. E. 1983, ApJ, 266, 713
- Pacucci & Loeb (2018) Pacucci, F., & Loeb, A. 2018, arXiv:1810.12302
- Schlegel et al. (1998) Schlegel, D. J., Finkbeiner, D. P., & Davis, M. 1998, ApJ, 500, 525
- Shen et al. (2018) Shen, Y., Wu, J., Jiang, L., et al. 2018, arXiv:1809.05584
- Shen et al. (2011) Shen, Y., Richards, G. T., Strauss, M. A., et al. 2011, ApJS, 194, 45
- DES Collaboration (2005) The Dark Energy Survey Collaboration 2005, arXiv:astro-ph/0510346
- Tsuzuki et al. (2006) Tsuzuki, Y., Kawara, K., Yoshii, Y., et al. 2006, ApJ, 650, 57
- Vanden Berk et al. (2001) Vanden Berk, D. E., Richards, G. T., Bauer, A., et al. 2001, AJ, 122, 549
- Venemans et al. (2015) Venemans, B. P., Bañados, E., Decarli, R., et al. 2015, ApJ, 801, L11
- Vestergaard & Osmer (2009) Vestergaard, M., & Osmer, P. S. 2009, ApJ, 699, 800
- Vestergaard & Wilkes (2001) Vestergaard, M., & Wilkes, B. J. 2001, ApJS, 134, 1
- Volonteri (2012) Volonteri, M. 2012, Science, 337, 544
- Wang et al. (2018) Wang, F., Yang, J., Fan, X., et al. 2018, ApJ, 869, L9
- Willott et al. (2010) Willott, C. J., Albert, L., Arzoumanian, D., et al. 2010, AJ, 140, 546
- Wright et al. (2010) Wright, E. L., Eisenhardt, P. R. M., Mainzer, A. K., et al. 2010, AJ, 140, 1868
- Wu et al. (2015) Wu, X.-B., Wang, F., Fan, X., et al. 2015, Nature, 518, 512
- Yang et al. (2018) Yang, J., Wang, F., Fan, X., et al. 2018, arXiv:1811.11915