reception date \Acceptedacceptance date \Publishedpublication date
1National Center for Nuclear Research, ul. Hoża 69, 00-681 Warsaw, Poland
2Astronomical Observatory of the Jagiellonian University, ul. Orla 171, 30-244 Kraków, Poland
3Leiden Observatory, Leiden University, P.O.Box 9513, 2300RA Leiden, The Netherlands
4Center for Theoretical Physics, Polish Academy of Sciences, al. Lotników 32/46, 02-668, Warsaw, Poland
5Division of Astroparticle and Astrophysical Science, Graduate School of Science, Nagoya University, Furo-Cho, Chikusa-ku, Nagoya 464-8602 Japan
infrared: galaxies – infrared: quasars – galaxies: fundamental parameters – galaxies: statistics
Radio-Infrared Correlation for Local Dusty Galaxies and Dusty AGNs from the AKARI All Sky Survey
Abstract
We use the new release of the AKARI Far-Infrared all sky Survey matched with the NVSS radio database to investigate the local () far infrared-radio correlation (FIRC) of different types of extragalactic sources. To obtain the redshift information for the AKARI FIS sources we crossmatch the catalogue with the SDSS DR8. This also allows us to use emission line properties to divide sources into four categories: i) star-forming galaxies (SFGs), ii) composite galaxies (displaying both star-formation and active nucleus components), iii) Seyfert galaxies, and iv) low-ionization nuclear emission-line region (LINER) galaxies. We find that the Seyfert galaxies have the lowest FIR/radio flux ratios and display excess radio emission when compared to the SFGs. We conclude that FIRC can be used to separate SFGs and AGNs only for the most radio-loud objects.
1 Introduction
A tight far infrared-radio correlation (FIRC) for galaxies is a well known phenomenon, which appears to extend from the local Universe (Helou et al. 1985; Condon 1992; Yun et al. 2001; Bell 2003; Mauch & Sadler 2007) up to high redshifts (Garrett 2002; Appleton et al. 2004; Chapman et al. 2005; Kovács et al. 2006; Sajina et al. 2008; Ibar et al. 2008; Sargent et al. 2010; Michałowski et al. 2010; Ivison et al. 2010; Magnelli et al. 2015; Delhaize et al. 2017; Molnár et al. 2018) and for a wide range of galaxy masses and types (Condon & Broderick, 1991). It is attributed to recent star formation processes which produce both far infrared (FIR) and synchrotron radiation. FIR radiation is related to the star-formation process in galaxies through dust particles produced througout the life-cycle of the galaxy, which absorb the ultraviolet radiation emitted by young, massive, hot stars, and re-emit it at longer wavelengths. Location of the FIR radiation peak varies significantly depending on the intensity of the interstellar radiation field (from 150 m in the coolest galaxies to 60 m or shorter in the warmest ones), and it is a good indicator of dust heating in the interstellar medium (e.g. da Cunha et al. 2008). Once the massive stars explode as supernovae, cosmic rays are accelerated in the magnetic field of the galaxy producing synchrotron emission. This emission is characterized by a power-law spectrum, which makes it the dominant component of galaxy spectra in the GHz ( cm) range (Condon et al. 2002; Bressan et al. 2002; Bell 2003; Clemens et al. 2010; Murphy et al. 2011; Mancuso et al. 2017).
FIRC is observed both in star-forming galaxies (SFGs) and in a large fraction of sources with an active galactic nucleus (AGN), and a similar trend is also seen for the mid-IR (MIR)-radio correlation (Donley et al. 2005, Park et al. 2008). Past observations indicated that AGNs display a larger scatter in the FIRC than SFGs (e.g. Condon et al. 1982), which was therefore considered useful in selecting obscured type 2 AGNs with a radio-loud nature, missed by deep X-ray observations (Yun et al. 2001; Condon et al. 2002; Ibar et al. 2008). However, more recent studies show that optically selected AGNs often follow the correlation as tightly as SFGs (Obrić et al. 2006; Mauch & Sadler 2007). In particular, Morić et al. (2010), based on a large cross-correlated sample of the NRAO VLA Sky Survey (NVSS), Infrared Astronomical Satellite (IRAS) and Sloan Digital Sky Survey (SDSS) data, found that most galaxies containing AGNs have FIR/radio flux ratios indistinguishable from those of the SFGs that define the FIRC, with the exception of Seyfert galaxies. The latter show lower FIR/radio flux ratios, albeit still within the scatter of SFGs.
In this work we present a new study of the FIRC based on the newest measurements from the AKARI Far-Infrared All Sky Survey cross-correlated with NVSS. The AKARI data provide better sensitivities than the preceding all-sky infrared mission of the IRAS satellite. While IRAS reached 1 Jy at 100 m, AKARI detections go down to 0.2 Jy in the 90 m passband (Yamamura et al. 2010). In addition, the AKARI All Sky Survey has much larger sky coverage (exceeding 98% of the sky; Nakagawa et al. 2007) than targeted observations provided by Spitzer (Werner et al., 2004) and Herschel Space Observatories, which observed of the whole sky111Based on data products available in the NASA/IPAC Infrared Science Archive; https://irsa.ipac.caltech.edu/Missions/herschel.html..
2 Data
The Far Infrared Surveyor (FIS) instrument onboard the AKARI satellite scanned 94% of the entire sky at least twice in the 16 months of the cryogenic mission phase, which led to the all-sky catalog covering four photometric far-infrared bands centered at 60 m, 90 m, 140 m and 160 m (the N60, WIDE-S, WIDE-L and N160 bands, respectively; Kawada et al. 2007).
The newest version of the AKARI All Sky Survey in the FIR contains sources, out of which (43%) were detected in all four passbands. The point spread function of the AKARI FIR bands is , , and at 60, 90, 140 and 160 m, respectively (Kawada et al. 2007, Doi et al. 2015, Takita et al. 2015). To ensure good quality of photometric measurements for our analysis we chose those objects which have the flux quality indicator FQUAL=3 at 90 m (Yamamura et al., 2010). As mentioned above, the depth of the catalogue at 90 m reaches Jy at the 3 level.
Following Pollo et al. (2010) we selected objects lying in regions of low Galactic emission at 100 m, based on the Schlegel et al. (1998) maps. We restricted our analysis to sources with line-of-sight Galactic emission lower than 5 MJy , which gave us a catalogue of galaxies (6% of the original dataset).
We performed a crossmatch between the AKARI-FIS catalogue and the NVSS radio sample (Condon et al., 1998) within a matching radius (e.g. Pepiak et al. 2014). This step left us with objects available for the FIRC analysis. To obtain redshift information for these sources we further crossmatched the data with the SDSS DR8222https://www.sdss.org/dr12/spectro/galaxy_mpajhu/. We restricted ourselves to the SDSS DR8 as it offers line ratio diagnostics which allow for the exact determination of the nature of the sources (Kauffmann et al. 2003; Kewley et al. 2001, 2006). The crossmatch AKARI-FIS SDSS DR8 NVSS resulted in a sample of objects, all of them with a redshift measurement.

Figure 1 shows the redshift distribution of the final catalogue. The distribution has a primary peak located at with a possible secondary peak emerging at .
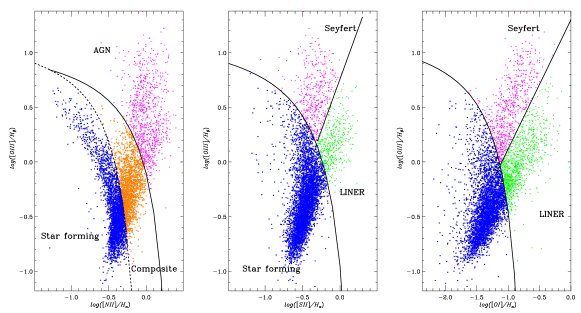
A common diagnostic tool used to distinguish between AGNs and SFGs is the so-called BPT diagram (Baldwin et al., 1981). We present the BPT diagram of our sample in Fig. 2. Following the selection criteria of Kauffmann et al. (2003) and Kewley et al. (2001, 2006) we find that (45%) of our sample are SFGs, (43%) are composite galaxies (containing contributions from both AGN and star formation) and 629 (10%) are AGNs, including 392 Seyfert galaxies and 237 low-ionization nuclear emission-line regions (LINER galaxies). In addition, 40 of the galaxies are classified as Seyferts based on either or diagrams but classified as LINERs based on or diagrams. Moreover, we find 33 galaxies classified as composite based on the diagram, but shifted into the AGN region on either the or diagram. These ambiguous sources are not included in the subsequent analysis.
3 Far Infrared-Radio Correlation of AKARI galaxies
As we have sources with redshifts measured, we compute their absolute far-infrared luminosities as
| (1) |
with [Hz], [Hz], and , where is the flux density measured for each source through a specific AKARI filter, while is the luminosity distance. The equations were derived by comparing the AKARI FIS data with the IRAS all-sky survey. As Takeuchi et al. (2010) reported, the N60 filter sensitivity is lower than that of the wide bands, and therefore it is beneficial to estimate IR luminosity by using only the WIDE-S and WIDE-L bands. We calculate the radio luminosities as:
| (2) |
where is the radio flux as measured by NVSS and is the radio spectral index. We assume following Condon (1992), who reported that SFGs usually have a mean spectral index varying between and with a dispersion of 0.24, and Laing et al. (1983) who measured for galaxies with nuclear activity to be .
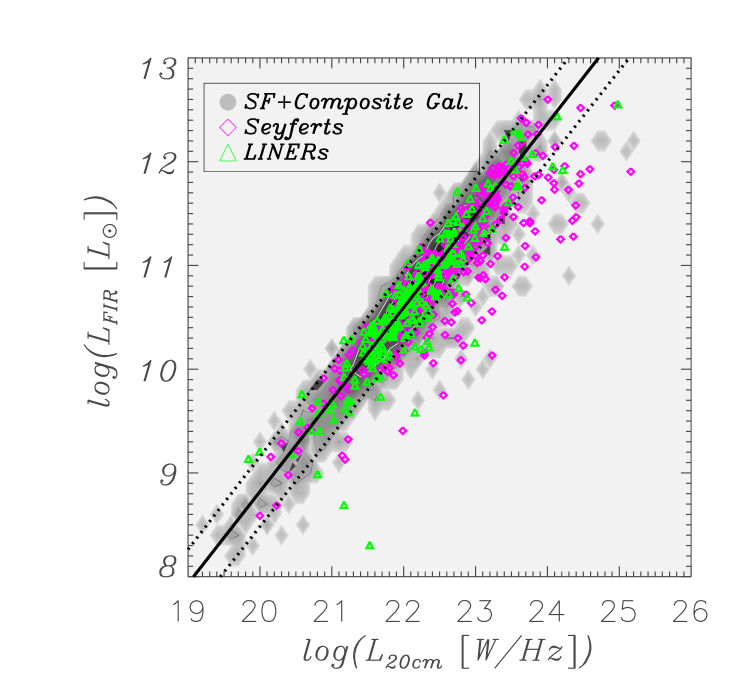
The FIRC for the four main classes of objects: SF, composite, Seyfert and LINER galaxies is shown in Fig. 3 together with the best least-square fit to the data. To obtain the relationship between and we fitted the following model: , where and . We found tight correlation for all the categories of objects, with the best-fit parameters and .
Following Helou et al. (1985) we calculate the ‘’ parameter to quantify the FIRC:
| (3) |
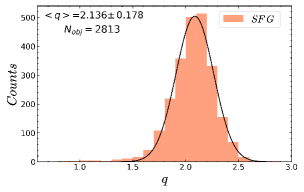
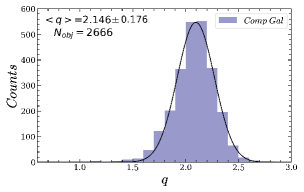
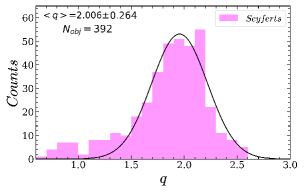
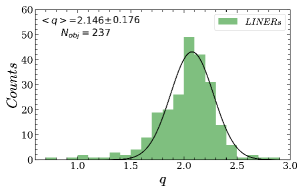
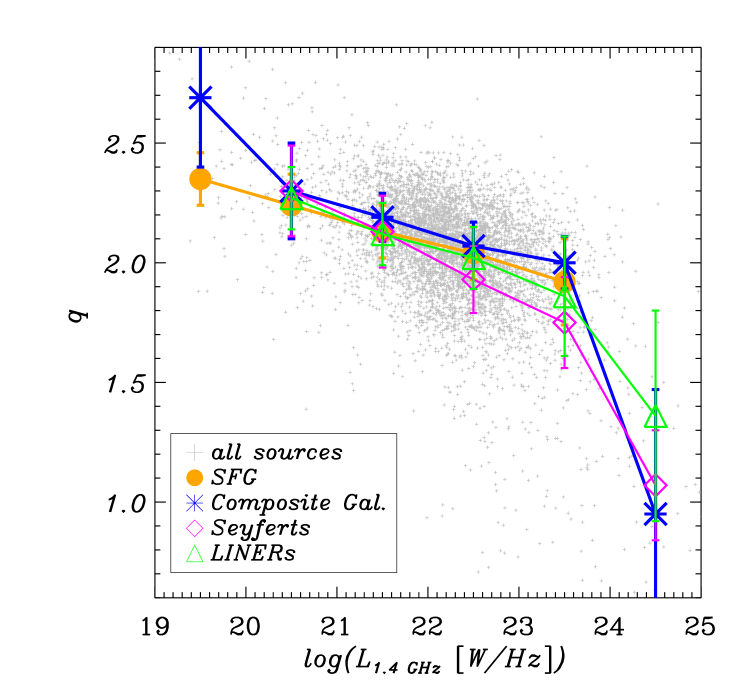
The mean () parameter for the whole AKARI FIS NVSS SDSS DR8 dataset is . We measure for Seyfert galaxies, while for SFGs, composites and LINERs we find (see Table 1). Figure 4 shows the distribution of for all the considered source populations. Distributions of for SF and composite galaxies are very similar, and they have the same means; the latter is true also for LINERs. The distribution for Seyferts, on the other hand, is characterized by a longer tail towards lower values of . SFGs, composites, and to a lesser extent also LINERs, seem to be Gaussian-distributed, while for Seyfert galaxies we observe a clearly skewed distribution. The latter is expected: Seyferts show a larger scatter in when compared with the other considered source populations, with many sources on the high radio-luminosity side. However, similar behaviour is also observed for some sources in the other classes. We set the separation between ‘radio-normal’ and ‘radio-excess’ sources at , corresponding to a 2 deviation from the peak of the distribution for all the objects in our sample. We find 64 Seyfert galaxies (16% of the full Seyfert sample) with radio excess. In contrast, 12 LINERs (5% of the total LINER sample), 38 composite galaxies (1.4% of the full composite galaxy sample) and 37 SFGs (1.3% of the full SFG sample) show radio excess.
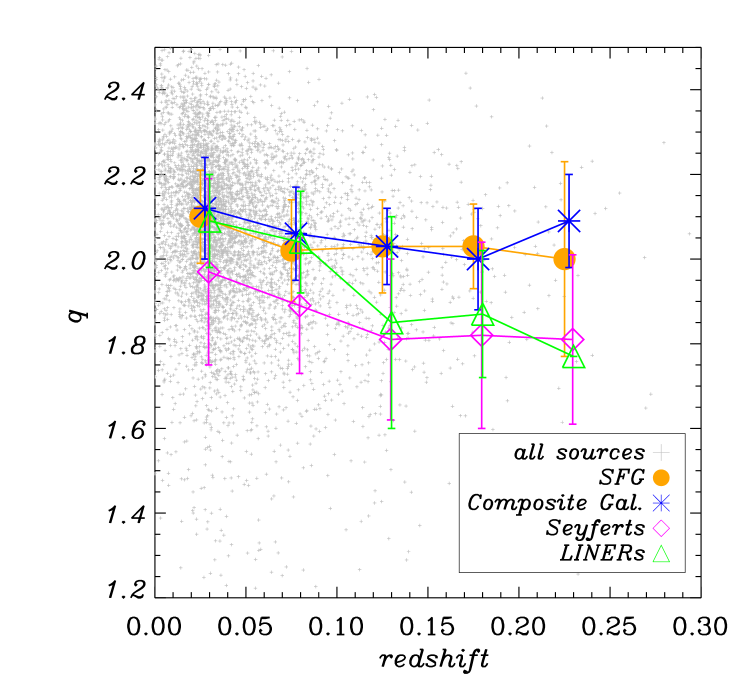
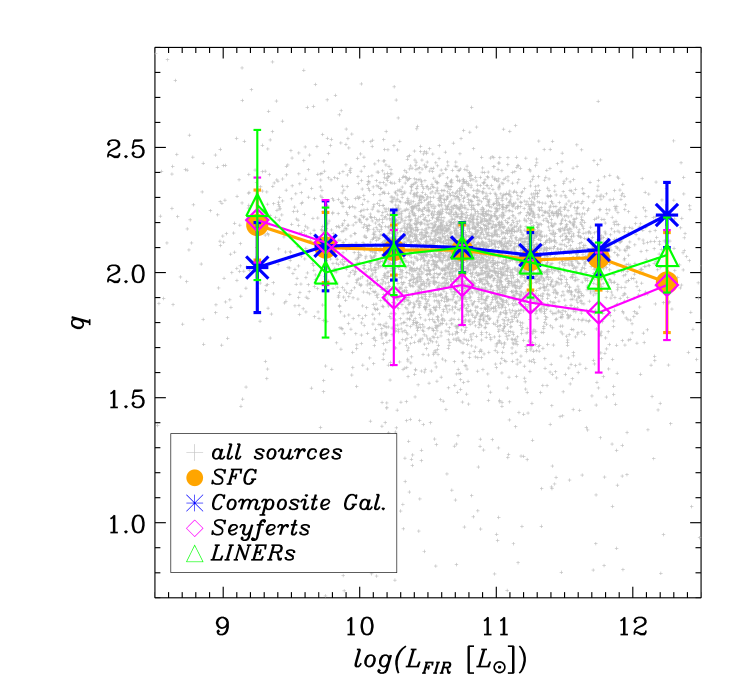
In order to verify the differences between different populations of galaxies we have applied the Kolmogorov-Smirnov (K–S) test. The distribution of for the total sample of composite galaxies is indistinguishable from that for SFGs, with p-value=0.252 of the null-hypothesis being true. However, we find that there is a statistical difference between the total sample of SFGs and the two AGN types (with p-value for SFGs vs. Seyfert galaxies and with p-value=0.010 for SFGs vs. LINERS). We additionally separate our galaxy samples into several redshift and luminosity bins (both and )333In what follows, will be given in units of , while in W/Hz., where we find different results (see Tables 2, 3, 4 and Figues 5, 6, 7). Figure 5 illustrates the dependence of on redshift up to . For all the considered populations, remains roughly constant for the whole considered redshift range, with Seyfert galaxies having consistently lower values of than other types. A weak tendency of to decrease with redshift can be observed for Seyfert galaxies and LINERs, but the scatter of for these populations is too big to draw any firm conclusions. At redshifts the distributions for LINERs, Seyferts and composite galaxies differ from that of the SFGs. At the highest redshifts probed () the samples become indistinguishable, however this redshift range contains few objects (cf. Table 2). As shown in Fig. 6, the average remains constant as a function of the FIR luminosity with a hint of slight upturn of this trend for the highest bin ( ) for composite galaxies, Seyferts and LINERs. K-S test shows, that the distributions of the Seyferts and SFGs splitted into bins start to differ at . In the highest probed bin (i.e. ) these galaxy samples become again indistinguishable, however this effect comes from the small number statistics (cf. Table 3). At the same time, we observe a very clear decrease of the average with increasing radio power for all the considered populations of sources (see Fig. 7). In bins of the K–S test shows that the distributions of SF and Seyfert galaxies are indistinguishable from each other only at the lowest radio luminosities ( ). Again, objects with the highest luminosities ( ) become indistinguishable most probably due to their small number statistics (cf. Table 4). In sum, the distributions of SF and Seyfert galaxies differ for the highest radio ( ) and infrared luminosities ( ). The K–S test also shows that the composite galaxy distribution in the range differs from the SFG sample.
Based on our findings, we conclude that similar processes are behind the value decrease with the increase of the radio power for SFGs and galaxies containing AGNs. Alternatively, this could also mean that the line ratio diagnostics miss-classify obscured AGNs as SFG and that low values reveal the presence of obscured AGNs.
| SFG | Comp. | Seyferts | LINERs | |
|---|---|---|---|---|
| 2813 | 2666 | 392 | 237 | |
| Seyferts | LINERs | Composites | |||||
|---|---|---|---|---|---|---|---|
| p-values | p-values | p-values | |||||
| 0.025 | 2055 | 198 | 1.34e-11 | 184 | 0.069 | 1519 | 0.008 |
| 0.075 | 654 | 128 | 4.701e-5 | 35 | 0.016 | 826 | 3.199e-11 |
| 0.125 | 85 | 44 | 0.0053 | 12 | 0.158 | 233 | 0.0085 |
| 0.175 | 18 | 15 | 0.2809 | 4 | 0.550 | 70 | 0.387 |
| 0.225 | 1 | 7 | 0.2251 | 2 | 0.434 | 18 | 0.461 |
| Seyferts | LINERs | Composites | |||||
|---|---|---|---|---|---|---|---|
| p-values | p-values | p-values | |||||
| 9.25 | 84 | 10 | 0.1355 | 5 | 0.332 | 22 | 0.559 |
| 9.75 | 202 | 17 | 0.531 | 19 | 0.434 | 60 | 0.013 |
| 10.25 | 646 | 59 | 3.92e-6 | 76 | 0.820 | 422 | 0.012 |
| 10.75 | 824 | 116 | 8.564e-8 | 68 | 0.494 | 867 | 0.057 |
| 11.25 | 438 | 102 | 2.548e-10 | 42 | 0.164 | 730 | 0.129 |
| 11.75 | 107 | 438 | 1.008e-6 | 15 | 0.066 | 353 | 0.995 |
| 12.25 | 5 | 13 | 0.905 | 8 | 0.644 | 84 | 0.516 |
| Seyferts | LINERs | Composites | |||||
|---|---|---|---|---|---|---|---|
| p-values | p-values | p-values | |||||
| 19.5 | 28 | 1 | 0.483 | 2 | 0.027 | 2 | 0.303 |
| 20.5 | 145 | 11 | 0.581 | 9 | 0.961 | 44 | 0.045 |
| 21.5 | 923 | 67 | 0.135 | 95 | 0.706 | 615 | 4.865e-08 |
| 22.5 | 1153 | 188 | 3.43e-0.8 | 107 | 0.009 | 1485 | 5.959e-6 |
| 23.5 | 109 | 104 | 0.0005 | 20 | 0.806 | 385 | 0.010 |
| 24.5 | 4 | 19 | 0.3993 | 4 | 0.771 | 13 | 0.769 |
3.1 Comparison with literature
In this section we compare our results with the previously published research focused on similar redshift ranges. Previous such studies of the FIRC were largely based on IRAS observations, with calculated as the monochromatic luminosity at 60 m. Yun et al. (2001) measured the FIRC at and found . The discrepancy between the results obtained in our work and in the study of Yun et al. (2001) can be attributed to the difference in the total infrared luminosity estimator definitions.The estimator used in the work of Yun et al. (2001) corresponds to the integrated luminosities spanning from 42.5 to 122.5 m, while the used in our work corresponds to the 80 – 170 m wavelength range, as shown in Solarz et al. (2016). To quantify this difference we matched the AKARI-FIS SDSS DR8 NVSS catalogue with the IRAS faint source catalogue (FSC; Moshir et al. 1992) and derived the infrared luminosities using IRAS passbands following the Helou et al. (1988) prescription: , where is the luminosity per unit frequency at a frequency , (: the speed of light) and is expressed in . For 3,593 matched sources (within a 15 arcsec matching radius) we find that on average . Therefore, yields , which agrees with the IRAS based derived by Yun et al. (2001).
In the work of Morić et al. (2010) the FIRC was explored at based on a multi-wavelength catalogue combining NVSS, SDSS and IRAS, with the parameter measured for the same four galaxy populations as in our study. In that work an indication of a discrepancy between the value of for Seyferts and for other galaxy classes was first discovered. Morić et al. (2010) derived for Seyferts and for SFG, composite and LINER galaxies. Within uncertainty ranges, these measurements are in good agreement with our results.
4 Summary
In this work we investigated the correlation of radio and far infrared emission from star-forming galaxies, composite galaxies, Seyferts and LINERs. To this aim we used the FIR data obtained by the AKARI-FIS satellite covering the whole sky, cross-correlated with radio fluxes given by the NVSS. We identified AGNs based on the BPT diagram diagnostics making use of the SDSS DR8 data release as the spectroscopic resource.
We found that while the composite galaxy population is statistically indistinguishable from that of SFGs based on the FIRC only, Seyfert galaxies have a different distribution of the parameter quantifying this correlation. The difference between Seyferts and SFGs is statistically significant for sources with radio and infrared luminosities in ranges and . At the same time, the low- region () is populated mainly by Seyfert galaxies exhibiting radio excess. Furthermore, Seyfert galaxies display bigger scatter in the FIRC than LINERs. These results are in agreement with the work of Morić et al. (2010), who first reported that the SFGs and galaxies hosting AGNs can be distinguished based on their position on the FIRC but only for the most radio-luminous sources.
This work is based on observations with AKARI, a JAXA project with the participation of ESA. Special thanks to Romain Thomas for the Photon (Thomas, R., 2018) software and Mark Taylor for the TOPCAT (Taylor, 2005) software. A.S. was supported by the National Science Centre grant UMO-2015/16/S/ST9/00438. A.Pępiak was supported by the National Science Centre grant UMO-2014/13/N/ST9/00078. This work was supported by the Grants-in-Aid for Scientific Research JSPS/MEXT KAKENHI No. 17H01110.
References
- Appleton et al. (2004) Appleton, P. N., Fadda, D. T., Marleau, F. R., et al. 2004, ApJS, 154, 147
- Baldwin et al. (1981) Baldwin, J. A., Phillips, M. M., & Terlevich, R. 1981, PASP, 93, 5
- Bell (2003) Bell, E. F. 2003, ApJ, 586, 794
- Bressan et al. (2002) Bressan, A., Silva, L., & Granato, G. L. 2002, A&A, 392, 377
- Chapman et al. (2005) Chapman, S. C., Blain, A. W., Smail, I., & Ivison, R. J. 2005, ApJ, 622, 772
- Clemens et al. (2010) Clemens, M. S., Scaife, A., Vega, O., & Bressan, A. 2010, MNRAS, 405, 887
- Condon (1992) Condon, J. J. 1992, ARA&A, 30, 575
- Condon & Broderick (1991) Condon, J. J. & Broderick, J. J. 1991, AJ, 102, 1663
- Condon et al. (1982) Condon, J. J., Condon, M. A., Gisler, G., & Puschell, J. J. 1982, ApJ, 252, 102
- Condon et al. (2002) Condon, J. J., Cotton, W. D., & Broderick, J. J. 2002, AJ, 124, 675
- Condon et al. (1998) Condon, J. J., Cotton, W. D., Greisen, E. W., et al. 1998, AJ, 115, 1693
- da Cunha et al. (2008) da Cunha, E., Charlot, S., & Elbaz, D. 2008, MNRAS, 388, 1595
- Delhaize et al. (2017) Delhaize, J., Smolčić, V., Delvecchio, I., et al. 2017, A&A, 602, A4
- Doi et al. (2015) Doi, Y., Takita, S., Ootsubo, T., et al. 2015, PASJ, 67, 50
- Donley et al. (2005) Donley, J. L., Rieke, G. H., Rigby, J. R., & Pérez-González, P. G. 2005, ApJ, 634, 169
- Garrett (2002) Garrett, M. A. 2002, A&A, 384, L19
- Helou et al. (1988) Helou, G., Khan, I. R., Malek, L., & Boehmer, L. 1988, ApJS, 68, 151
- Helou et al. (1985) Helou, G., Soifer, B. T., & Rowan-Robinson, M. 1985, ApJ, 298, L7
- Ibar et al. (2008) Ibar, E., Cirasuolo, M., Ivison, R., et al. 2008, MNRAS, 386, 953
- Ivison et al. (2010) Ivison, R. J., Magnelli, B., Ibar, E., et al. 2010, A&A, 518, L31
- Kauffmann et al. (2003) Kauffmann, G., Heckman, T. M., Tremonti, C., et al. 2003, MNRAS, 346, 1055
- Kawada et al. (2007) Kawada, M., Baba, H., Barthel, P. D., et al. 2007, PASJ, 59, S389
- Kewley et al. (2001) Kewley, L. J., Dopita, M. A., Sutherland, R. S., Heisler, C. A., & Trevena, J. 2001, ApJ, 556, 121
- Kewley et al. (2006) Kewley, L. J., Groves, B., Kauffmann, G., & Heckman, T. 2006, MNRAS, 372, 961
- Kovács et al. (2006) Kovács, A., Chapman, S. C., Dowell, C. D., et al. 2006, ApJ, 650, 592
- Laing et al. (1983) Laing, R. A., Riley, J. M., & Longair, M. S. 1983, MNRAS, 204, 151
- Magnelli et al. (2015) Magnelli, B., Ivison, R. J., Lutz, D., et al. 2015, A&A, 573, A45
- Mancuso et al. (2017) Mancuso, C., Lapi, A., Prandoni, I., et al. 2017, ApJ, 842, 95
- Mauch & Sadler (2007) Mauch, T. & Sadler, E. M. 2007, MNRAS, 375, 931
- Michałowski et al. (2010) Michałowski, M. J., Murphy, E. J., Hjorth, J., et al. 2010, A&A, 522, A15
- Molnár et al. (2018) Molnár, D. C., Sargent, M. T., Delhaize, J., et al. 2018, MNRAS, 475, 827
- Morić et al. (2010) Morić, I., Smolčić, V., Kimball, A., et al. 2010, ApJ, 724, 779
- Moshir et al. (1992) Moshir, M., Kopman, G., & Conrow, T. A. O. 1992, IRAS Faint Source Survey, Explanatory supplement version 2
- Murphy et al. (2011) Murphy, E. J., Condon, J. J., Schinnerer, E., et al. 2011, ApJ, 737, 67
- Nakagawa et al. (2007) Nakagawa, T., Enya, K., Hirabayashi, M., et al. 2007, PASJ, 59, S377
- Obrić et al. (2006) Obrić, M., Ivezić, Ž., Best, P. N., et al. 2006, MNRAS, 370, 1677
- Park et al. (2008) Park, S. Q., Barmby, P., Fazio, G. G., et al. 2008, ApJ, 678, 744
- Pepiak et al. (2014) Pepiak, A., Pollo, A., Takeuchi, T., Solarz, A., & Jurusik, W. 2014, Planetary and Space Science, 100, 12 , cosmic Dust VI
- Pollo et al. (2010) Pollo, A., Rybka, P., & Takeuchi, T. T. 2010, A&A, 514, A3
- Sajina et al. (2008) Sajina, A., Yan, L., Lutz, D., et al. 2008, ApJ, 683, 659
- Sargent et al. (2010) Sargent, M. T., Schinnerer, E., Murphy, E., et al. 2010, ApJ, 714, L190
- Schlegel et al. (1998) Schlegel, D. J., Finkbeiner, D. P., & Davis, M. 1998, ApJ, 500, 525
- Solarz et al. (2016) Solarz, A., Takeuchi, T. T., & Pollo, A. 2016, A&A, 592, A155
- Takeuchi et al. (2010) Takeuchi, T. T., Buat, V., Heinis, S., et al. 2010, A&A, 514, A4
- Takita et al. (2015) Takita, S., Doi, Y., Ootsubo, T., et al. 2015, PASJ, 67, 51
- Taylor (2005) Taylor, M. B. 2005, in Astronomical Society of the Pacific Conference Series, Vol. 347, Astronomical Data Analysis Software and Systems XIV, ed. P. Shopbell, M. Britton, & R. Ebert, 29
- Thomas, R. (2018) Thomas, R. 2018, Photon 0.2.0, 10.5281/zenodo.1343619
- Werner et al. (2004) Werner, M. W., Roellig, T. L., Low, F. J., et al. 2004, ApJS, 154, 1
- Yamamura et al. (2010) Yamamura, I., Makiuti, S., Ikeda, N., et al. 2010, VizieR Online Data Catalog, 2298
- Yun et al. (2001) Yun, M. S., Reddy, N. A., & Condon, J. J. 2001, ApJ, 554, 803