Sunyaev–Zel’dovich profile fitting with joint AMI-Planck analysis
Abstract
We develop a Bayesian method of analysing Sunyaev-Zel’dovich measurements of galaxy clusters obtained from the Arcminute Microkelvin Imager (AMI) radio interferometer system and from the Planck satellite, using a joint likelihood function for the data from both instruments. Our method is applicable to any combination of Planck data with interferometric data from one or more arrays. We apply the analysis to simulated clusters and find that when the cluster pressure profile is known a-priori, the joint dataset provides precise and accurate constraints on the cluster parameters, removing the need for external information to reduce the parameter degeneracy. When the pressure profile deviates from that assumed for the fit, the constraints become biased. Allowing the pressure profile shape parameters to vary in the analysis allows an unbiased recovery of the integrated cluster signal and produces constraints on some shape parameters, depending on the angular size of the cluster. When applied to real data from Planck-detected cluster PSZ2 G063.80+11.42, our method resolves the discrepancy between the AMI and Planck -estimates and usefully constrains the gas pressure profile shape parameters at intermediate and large radii.
keywords:
methods: data analysis – galaxies: clusters: general – galaxies: clusters: individual: PSZ2 G063.80+11.42 – galaxies: clusters: intracluster medium – cosmology: observations.1 Introduction
With the advent of large Sunyaev-Zel’dovich (SZ) effect surveys carried out by instruments such as Planck (Planck Collaboration et al., 2016), the Atacama Cosmology Telescope (Hilton et al., 2018), and the South Pole Telescope (Bleem et al., 2015), SZ observations have the potential to become a powerful tool for constraining, for example, cosmological properties via cluster number counts. Numerical simulations show a tight, low-scatter correlation between the SZ observable, the Compton- parameter and cluster mass (e.g. da Silva et al. 2004, Nagai 2006), but recent attempts to use SZ cluster number counts for cosmological analysis have produced results in tension with other, more mature methods such as the Cosmic Microwave Background (CMB) primary anisotropies (Planck Collaboration et al., 2016). One issue is the uncertain mass-observable calibration, although another issue is the modelling of the observable itself.
Perrott et al. (2015) (hereafter P15) compared properties of 99 galaxy clusters observed in SZ with Planck and the Arcminute Microkelvin Imager (AMI) radio interferometer system. They showed that the discrepancies between the cluster parameters as constrained by AMI and Planck could be explained by the cluster gas pressure profile deviating from the profile assumed for analysis. The AMI observations were shown to be particularly sensitive to this effect when attempting to constrain the total integrated Compton- parameter due to missing angular scales. It was noted in P15 that the combination of the two instruments would be powerful for investigating the gas pressure profiles of the clusters due to the complementary angular scales measured. In this paper we explore this idea further by developing a joint Bayesian analysis pipeline which combines the data from the two instruments. We note that this pipeline could also be used with other interferometric data, for example from the Atacama Large Millimeter/submillimeter Array (ALMA) which has recently been used for SZ analysis (e.g. Kitayama et al. 2016) and in the future for the Square Kilometre Array (SKA), which will be able to observe the SZ effect in its highest frequency band (Grainge et al., 2015). The pipeline would also be easily extended to include data from other single-dish instruments such as NIKA(2) (e.g. Adam et al. 2014). This work joins a growing body of analysis combining SZ data from different instruments, sensitive to different angular scales. Recent work such as Sayers et al. (2016), Ruppin et al. (2017), and Di Mascolo et al. (2019) all combine Planck Modified Internal Linear Combination Algorithm (MILCA; Planck Collaboration et al. 2016) -maps with SZ data from other instruments to jointly fit the gas pressure profile, while Romero et al. (2018) use a Planck-derived prior on the integrated Compton- parameter; however to our knowledge this is the first time that Planck frequency maps (rather than -maps) have been jointly analysed with other SZ data.
The paper is arranged as follows. In Section 2 we describe the telescopes and data used in our analysis and in Section 3 we describe our analysis method. In Section 4 we describe our cluster model. In Sections 5 and 6 we verify our method using simulated clusters and in Section 7 we apply the method to a test case using real data. We anticipate further work in Section 8 and conclude in Section 9.
2 Planck and AMI telescopes
2.1 Planck satellite
The combination of the Planck satellite’s low-frequency and high-frequency instruments (LFI and HFI) provides nine frequency channels in the range 37 GHz – 857 GHz. The HFI, used for cluster analysis, has angular resolutions of , , and arcminutes at , , and GHz and arcminutes at each of , , and GHz. The Planck frequency bands correspond to two decrements, the null, and three increments in the SZ spectrum, making it particularly effective at the blind identification of galaxy clusters despite its relatively low angular resolution. See e.g. Planck Collaboration et al. 2016 for further details.
2.2 AMI
AMI (Zwart et al., 2008) is a dual-array interferometer designed for SZ studies, which is situated near Cambridge, UK. AMI consists of two arrays: the Small Array (SA), optimised for viewing arcminute-scale features, having an angular resolution of 3 arcmin and sensitivity to structures up to 10 arcmin in scale; and the Large Array (LA), with angular resolution of 30 arcsec, which is insensitive to SA angular scales and is used to characterise and subtract confusing radio-sources. Both arrays operate over the same frequency band with a central frequency of 15.5 GHz and a bandwidth of 5 GHz; in P15 this was divided into 6 channels but after a recent correlator upgrade the band is now divided into 4096 channels (Hickish et al., 2018), and binned down to 8 channels for analysis after radio-frequency-interference excision and calibration. The simulated data in this paper have the properties of the new correlator.
3 Joint likelihood analysis
3.1 Bayesian parameter estimation
For a model, and a data vector, , we can obtain the probability distributions of model parameters (also known as input or sampling parameters) conditioned on and using Bayes’ theorem:
| (1) |
where is the posterior distribution of the model parameter set, is the likelihood function for the data, is the prior probability distribution for the model parameter set, and is the Bayesian evidence of the data given a model . In this paper we will be interested in the posterior distributions of the sampling parameters rather than the evidence, which would be used for model comparison. We use the nested sampling algorithm MultiNest (Feroz et al., 2009) to calculate our posteriors.
3.2 Model parameters
The model parameters can be split into two subsets (which are assumed to be independent of one another): cluster parameters and radio-source or ‘nuisance’ parameters . The cluster model parameters are relevant to both AMI and Planck data, and are detailed with their associated priors in Section 4. are relevant only for AMI data, since they are used to model the radio-source contamination of the SZ cluster signal recorded by the SA, based on values measured with the LA. More information on the prior distributions used for can be found in Section 4.3 of P15.
3.3 Joint likelihood function
If one has an AMI dataset and a Planck dataset , then the joint likelihood function for the data is given by
| (2) |
In this analysis we treat and as being independent (see Section 5.3 for justification), and since the Planck predicted data only rely on the cluster parameters we can write
| (3) |
3.3.1 AMI likelihood function
The AMI likelihood calculation is detailed in Feroz et al. (2009) (herafter F09). Briefly, the AMI likelihood function is given by
| (4) |
Here is a measure of the goodness-of-fit between the real and modelled data and can be expressed as
| (5) |
In this expression are the data observed by AMI at frequency , and are the predicted data generated by the model at the same frequency. is the theoretical covariance matrix for the AMI likelihood, which includes primordial CMB and source confusion noise as described in Hobson and Maisinger (2002) and F09 (Section 5.3). Source confusion noise allows for the remaining radio-sources with flux densities below the flux limit that the LA can subtract down to. The instrumental noise is estimated from the scatter of the visibility measurements within an observation. Referring back to equation 4, is a normalisation constant given by where is the length of (i.e. the combined vector of data from all frequencies).
3.3.2 Planck likelihood function
To calculate the Planck likelihood, we use a version of the PowellSnakes (PwS; Carvalho et al. 2009 and Carvalho et al. 2012) Bayesian detection algorithm designed for detecting galaxy clusters in Planck data, adapted to operate on a previously determined position rather than to conduct a blind search. PwS treats the data observed by Planck as a superposition of background sky emission (including foreground emission and primordial CMB) , instrumental noise , and signal from the (cluster) source . The model for the predicted data vector is thus
| (6) |
PwS works with patches of sky sufficiently small such that it can be assumed the noise contributions are statistically homogeneous. In this limit it is more convenient to work in Fourier space, as the Fourier modes are uncorrelated. It also assumes that the noise contributions are Gaussian, which is very accurate in the case of instrumental noise and the primordial CMB but may be more questionable for Galactic emission – the deviations from Gaussianity of are discussed in Section 4.3 of Carvalho et al. 2012. Since PwS is a detection algorithm, it calculates the ratio of the likelihood of detecting a cluster parameterised by and the likelihood of the data with no cluster signal () = 0). Thus the log-likelihood ratio of the Fourier transformed quantities is
| (7) |
where tildes denote the Fourier transform of a quantity, and is the covariance matrix of the data in Fourier space.
3.3.3 Joint likelihood analysis hyperparameters
Ideally when making a joint inference from two different datasets, likelihood hyperparameters would be used (see Lahav et al. 2000, Hobson et al. 2002, and Ma and Berndsen 2014) so that the relative weighting of the two likelihoods is treated in a Bayesian way. This allows meaningful results to be extracted when the datasets are not in good agreement, which could be due to, for example, systematic bias or an incorrect model. However the log-ratio given by equation 7 is not a probability density due to the fact that it is missing a normalisation factor proportional to . These hyperparameters affect the normalisation factor of the likelihood (it becomes a function of them), thus the PwS algorithm is incompatible with their use as it does not include the normalisation term in the likelihood calculations (a more detailed explanation is given in Chapter 8 of Javid 2019). We therefore do not include likelihood hyperparameters in our analysis. This should not be problematic when applying our method unless the data have been incorrectly analysed or the cluster model used is not flexible enough to describe both of the datasets.
4 Cluster model
Since AMI and Planck observe the SZ effect caused by the electron gas in clusters (see e.g. Birkinshaw 1999), both telescopes measure signals proportional to the Comptonisation parameter ,
| (8) |
where is the Boltzmann constant, is the rest mass of an electron, is the speed of light, and is the Thomson scattering cross-section. and are respectively the electron temperature and number density in the intra-cluster medium, as a function of radius from the centre of the cluster (), and the integral is over the line of sight. If an ideal gas equation of state is assumed for the electron gas then in terms of the electron pressure , the Comptonisation parameter is given by
| (9) |
The cluster model considered here is used to calculate a ‘map’ of by evaluating equation 9 at different points on the plane of the sky. It assumes a spherically symmetric, generalised-Navarro-Frenk-White (GNFW, Nagai et al. 2007) profile to model the electron pressure
| (10) |
is an overall pressure normalisation factor and is a characteristic radius.
The parameters , and describe the slope of the pressure profile at , and respectively. Our model parameterises a cluster in terms of observational (rather than physical) quantities: , the characteristic angular scale corresponding to ( where is angular diameter distance) and , the total integrated Comptonisation parameter of the cluster, given by
| (11) |
where is the gamma function.
Our model therefore has input parameters , where and are the cluster centre offsets from the designated central sky coordinate.
A set of ‘universal’ pressure profile (UPP) GNFW shape parameter values were derived in Arnaud et al. (2010) as the best fit to a sample of clusters from REXCESS (observed with XMM-Newton, Böhringer et al. 2007). These are = (0.3081, 1.0510, 5.4905, 1.177) and are often used as a fixed standard cluster profile. In this analysis we will not restrict our model profiles to the UPP case.
The GNFW profile extends to infinity; in practice some cut-off radius for the -map must therefore be defined when implementing this model. A frequent choice, used for example in the analysis of Planck data, is to cut off at . For the case of the UPP, this implies that a spherical integral to gives , or a cylindrical integral gives (with the line-of-sight integral extending to infinity within a radius of on the sky). In the case of arbitrary values of , this fraction can change significantly; plus in the general case is not necessarily known so a different cut-off radius must be defined which we denote . We choose to define for an arbitrary profile by the radius at which (found via a numerical root-finder) by analogy with the UPP. For some profiles which fall off more slowly with radius this becomes prohibitively large and we therefore impose a maximum radius of . We have verified that in these cases the Comptonization parameter integrated over the line-of-sight at is % of the value at the centre, i.e. we are not cutting off substantial cluster signal in the outskirts.
We then translate the -map to signal on the sky at each frequency using the non-relativistic approximation (Zeldovich and Sunyaev, 1969). Recently it has been shown that relativistic corrections may be significant for high-temperature clusters at Planck frequencies (e.g. Remazeilles et al. 2019); we note that relativistic effects reduce the Planck SZ signal, so if corrections were applied the effect would be to increase the discrepancy between AMI and Planck parameter constraints shown in P15.
4.1 Priors
In P15 we used a position prior based on the Planck position and error, and a joint ellisoidal prior on and based on the population of clusters detected by Planck. Here we assign wide, non-informative, independent priors to , , and (see Table 1), to explore how much the combination of the two datasets can constrain the parameters.
In the standard Planck analysis and for the AMI data analysed in P15, the GNFW shape parameter values were fixed to the UPP values. In this analysis we will both simulate and analyse clusters with non-UPP profiles and explore the constraints on and produced by our joint dataset. The priors used for and vary throughout our analysis (Table 1); they are either fixed at some specific value (delta function priors) or allowed to vary uniformly (uniform priors on a bounded domain).
| Parameter | Prior distribution(s) |
|---|---|
| or | |
| or | |
5 Cluster simulations
For all simulations the map of a single cluster is generated with ten distinct noise realisations as follows. Firstly, ten CMB realisations are created by sampling primordial CMB noise from an empirical power-law distribution (Hinshaw et al., 2013) and distributing at random positions on the sky. For each instrument, we add further realisations of the relevant sources of noise, as follows.
5.1 Planck cluster simulations
We construct a Planck all-sky foreground and thermal noise map by adding one noise realisation to the CO, FIRB, free-free, spinning dust, synchrotron and thermal dust emission maps simulated using the Planck sky model, all taken from the Planck Legacy Archive111https://pla.esac.esa.int/#home using the FFP8 release. We note that we do not include point sources since as of this data release they were not separated into strong and weak point source maps, and for cluster analysis on real data the strong point sources would be masked. We also choose not to add the thermal and kinetic SZ emission maps as we wish to see how much information can be extracted from the data in an ideal situation of a single, isolated cluster.
We then randomly select ten patch centres on the sky, with the constraint that the patch centres are above (to satisfy AMI’s observing limits) and that all of the 20∘ square patch is outside of the Planck 20% Galactic plane mask (in which 20% of the sky is masked). We cut patches from the all-sky foreground noise map at these coordinates and add the resulting patch maps to the CMB and cluster maps to produce the final Planck simulations. Each patch map therefore contains different thermal noise, foreground emission and CMB but the same cluster.
5.2 AMI cluster simulations
The AMI simulations are constructed by adding the cluster and CMB maps to confusion noise realisations, created using the 10C source counts given in AMI Consortium et al. (2011) up to a maximum flux density of 360 Jy (i.e. assuming sources above a typical AMI-LA noise limit of 90 Jy/beam have been detected and removed). A ten-hour mock AMI-SA observation is performed at the ten patch centres used for the Planck simulations, using the in-house package Profile (see e.g. Grainge et al. 2002). Instrumental noise is also added to the mock observations, giving a total noise level of 120 Jy/beam on the map.
Similarly to the Planck simulations, each AMI simulation contains different thermal noise, confusion noise and CMB and the same cluster. Each AMI simulation corresponds directly to a Planck simulation which has the same observing centre and CMB realisation.
5.3 Testing the independence of the AMI and Planck datasets
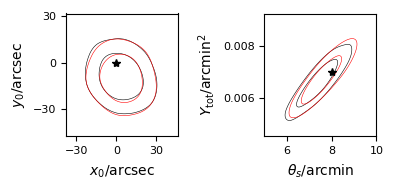
In Section 3.3 we made the assumption that and are not correlated with each other, so that the likelihoods for the two datasets can be separated. The instrumental noises associated with each telescope can safely be assumed to be independent. Due to the telescopes operating at different angular scales and frequencies, the confusion noise present in AMI data and foreground emission present in Planck data are assumed to be independent of one another. A similar argument can be applied for primordial CMB noise, nevertheless we carried out a simple test to see if this is the case. For a given set of cluster parameters, we ran the joint analysis on Planck and AMI datasets which had different CMB realisations to one another. We found that the resultant parameter constraints were not significantly different to the results obtained using AMI and Planck data which had the same CMB realisations as one another (Figure 1). We thus concluded that the covariance between the datasets introduced by the common CMB background was negligible.
6 Cluster simulation results
In the following we apply the joint analysis to clusters simulated as described in Section 5, and compare results with analyses which use (the same) AMI or Planck data alone.
We consider simulations generated using three different sets of profile shape parameters: the UPP, the parameters fitted to a stacked Planck dataset in Planck Collaboration et al. (2013) (‘Planck Intermediate Profile’, PIP), and the parameters fitted to the cluster RXC J2319.6-7313 in Arnaud et al. (2010) which are the most different in the sample to the UPP (‘REXCESS Extreme Profile’, REP). These values are listed in Table 2. We consider a ‘low’ and a ‘high’ signal-to-noise ratio (SNR) cluster, which correspond to input values of and respectively. We note that ‘low’ and ‘high’ SNR are in relation to the Planck simulations rather than the AMI simulations, where they are both well detected. We then analyse the ten different noise realisations for each cluster using the priors given in Table 1 and plot the resulting posterior distributions using GetDist222http://getdist.readthedocs.io/en/latest/..
| / arcmin2 | / arcmin | |||||
|---|---|---|---|---|---|---|
| UPP | low SNR | 0.001 | 2 | 0.3081 | 1.0510 | 5.4905 |
| high SNR | 0.007 | 8 | ||||
| PIP | low SNR | 0.001 | 2 | 0.31 | 1.33 | 4.13 |
| high SNR | 0.007 | 8 | ||||
| REP | low SNR | 0.001 | 2 | 0.065 | 0.33 | 5.49 |
| high SNR | 0.007 | 8 |
6.1 Analysis with fixed profile parameters
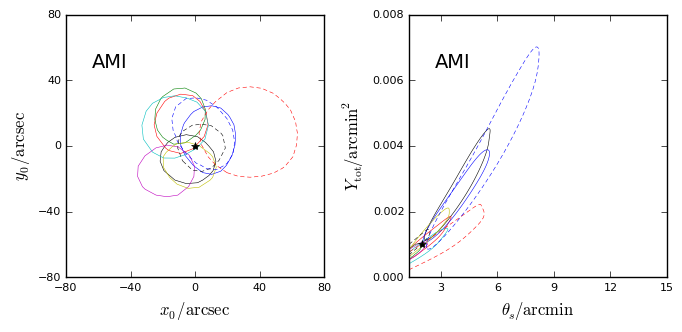
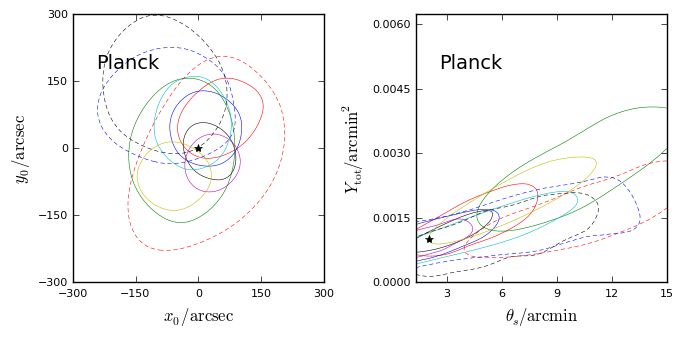
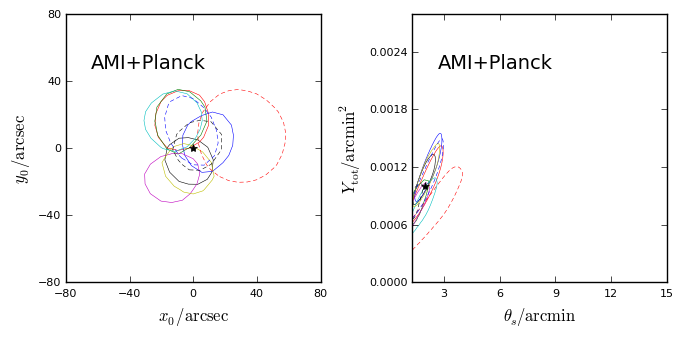
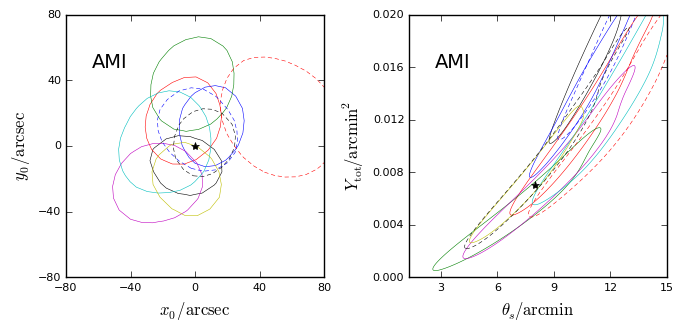
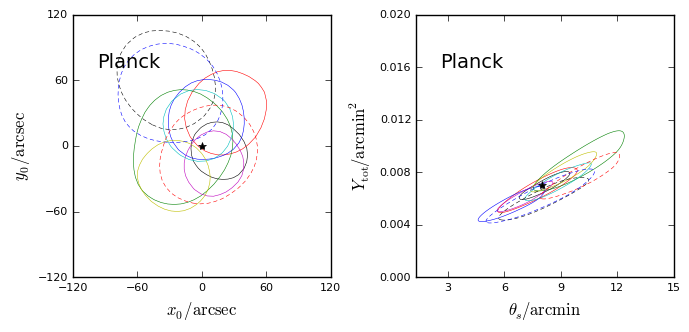
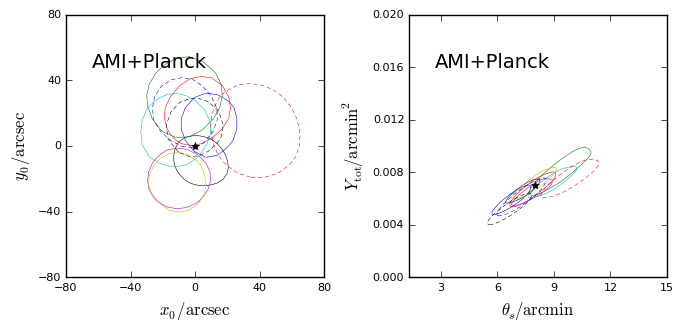
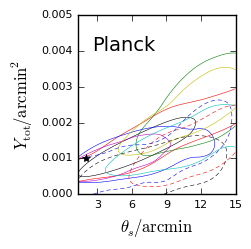
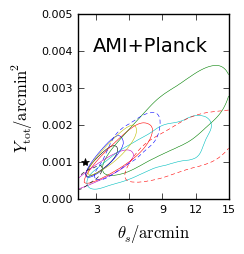
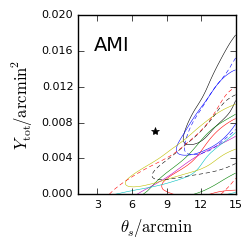
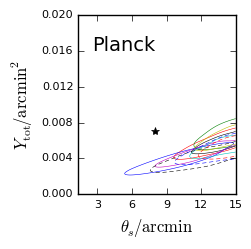
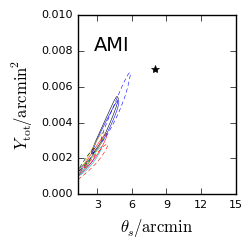
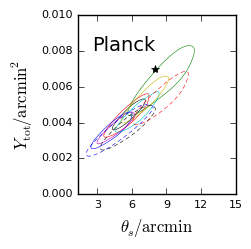
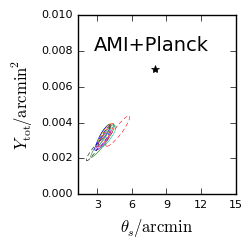
We firstly analyse the high- and low-SNR UPP simulations using fixed to the correct, input values. Figs. 2 and 3 show the results of the simulation sets using AMI data only, Planck data only, and the two datasets combined. Each two-dimensional marginalised posterior distribution plot shows the 68% confidence contours for the 10 different noise realisations, with the input values marked with black stars.
In the case of the positional parameters, it is clear that the higher angular resolution of the AMI data means that it drives the posterior inferences, although the addition of the Planck data does improve the constraints slightly in the high-SNR case. This result is consistent for all following analyses, and we do not consider the and constraints any further.
Both AMI and Planck constraints are degenerate in the / plane and previous results based on AMI and Planck data have relied on ancillary data to reduce this degeneracy. For AMI, a correlated prior in and based on a simulated population of clusters injected into and recovered from Planck data was used (see P15). For Planck, a prior on has been used to ‘slice’ the / posterior constraint based on either an X-ray measurement or a mass-observable scaling relationship (see, e.g. Planck Collaboration et al. 2016), both relying on the assumption of the ‘universal’ . The combination of AMI and Planck data removes the need for these ancillary priors and produces a much tighter constraint on both and since the degeneracy directions are different. This is most striking in the case of the low SNR cluster, but is also evident in the case of the high SNR cluster.
 |
 |
 |
 |
 |
 |
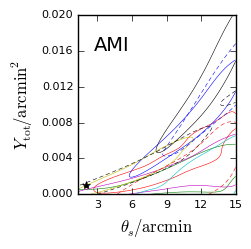
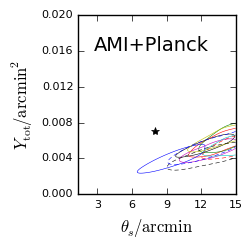
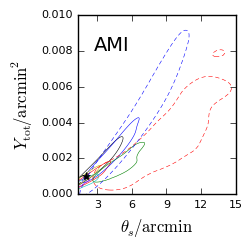
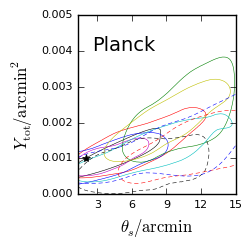
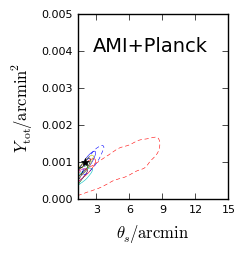
We next analyse the PIP and REP simulations keeping fixed to the UPP values in the analysis, i.e. we now have a mismatch between the cluster profiles used to produce and analyse the simulations. The two-dimensional posterior constraints on and in this case are shown in Figs. 4 and 5. In the case of the PIP simulations, all of the constraints are offset from the true position; although the direction of the offset is mostly in so that the one-dimensional marginal constraint on is not too badly offset it is clear that any method to reduce the degeneracy by slicing the posterior will be problematic. In the case of the REP simulations, the low-SNR cluster constraints are not too badly affected by the profile mismatch; this is because the change is to the inner part of the profile which is not well-resolved by either instrument. The high-SNR constraints however are significantly biased both in the two-dimensional plane and in the one-dimensional plane.
 |
 |
 |
 |
 |
 |
 |
 |
 |
 |
 |
 |
6.2 Variable shape parameter analysis
We next consider the same set of simulations described in Section 6, but now allowing the GNFW shape parameters and to vary in the analysis. We assign the uniform priors stated in Table 1 to and .
Figs. 6 and 7 show two-dimensional posterior constraints for a selection of parameter pairs for the UPP low- and high-SNR cluster simulations respectively. The two sets of simulations share some common features, as follows. The constraints on are mostly driven by the Planck data, since the lower-resolution Planck data are most suited to measuring the total cluster signal while the interferometric AMI data relies on extrapolations to larger angular scales than are measured; the joint constraints are generally tighter than the Planck-only constraints and appear unbiased. There is a large degeneracy between and which is inherent to the GNFW model, since decreasing makes the cluster amplitude fall off more slowly with radius which can also be achieved by increasing .
In the case of the low SNR cluster, the joint analysis successfully constrains and puts an upper limit on and a lower limit on . is fairly unconstrained since it affects the profile on the scale of = 2 arcmin which is not well-resolved by either instrument.
In the case of the high SNR cluster, can be constrained by AMI alone. The joint analysis places a lower limit on but is unconstrained due to the / degeneracy.
We do not show all of the constraints produced for the PIP and REP simulations as they are qualitatively similar, with the following exceptions. Since is lower for the PIP it effectively makes the cluster much more extended. The significance of the high SNR AMI detection becomes much lower and with and allowed to vary all of the parameters are essentially unconstrained, so the joint constraints become driven by the Planck data. is well-constrained; a lower limit can be put on and an upper limit on , while is unconstrained. In the low SNR case, only is well-constrained since although the cluster is more extended it is also much less bright so there is not enough signal-to-noise to constrain and . We show the joint constraints for this case in Fig. 8 as a ‘worst-case’ scenario.
In the high SNR, REP case, is very tightly constrained and is better-constrained by the AMI data alone. This is because the lower value of the profile causes it to fall off more sharply with radius, putting more signal on AMI scales. In the low SNR, REP case we obtain tight constraints on and , a tight upper limit on and a lower limit on . We show the joint constraints for this case in Fig. 8 as a ‘best-case’ scenario. We note that for the REP analysis we are fixing to the incorrect, UPP value; we also varied and while fixing to the correct, REP value which had little impact on the parameter constraints.
 |
 |
 |
 |
 |
 |
 |
 |
Overall we conclude that where nothing is known a-priori about the pressure profile of the cluster (other than that it follows a GNFW shape), we can use the combination of AMI and Planck data to successfully constrain ; often constrain ; and sometimes put limits on and depending on how well-resolved the cluster is (which depends both on and on and ).
7 Application of joint analysis to real cluster data
As a test case, we apply the joint analysis to PSZ2 G063.80+11.42 (; ) from the P15 sample. The cluster is well-detected by both Planck (PwS signal-to-noise-ratio = 6.5) and AMI (Bayesian detection significance = 3.8) and there is a significant offset between the AMI and Planck posterior constraints on and . The AMI radio-source environment is relatively clean. We reobserved the cluster with AMI to benefit from the improved performance of the new correlator, and use the DX11d data release with strong point sources masked (Planck Collaboration, priv. comm.) for the Planck data.
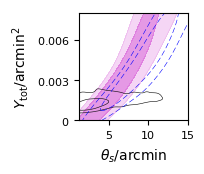
We firstly run the AMI and Planck analyses separately using the priors given in Table 1 (assigning delta priors to the GNFW shape parameters at UPP values), to confirm the discrepancy. For comparison we also ran the AMI analysis with the P15 priors; these three sets of posterior chains are shown in Fig. 9. We note that the tighter positional constraint in the latter case is due to a degeneracy with a radio source flux near one edge of the cluster; when the wider positional prior is used the source flux is allowed to increase, broadening the cluster decrement and shifting the position of the cluster. This has little effect on the / constraint. We see that the discrepancy is confirmed with the newer AMI data (and the AMI Bayesian detection significance increases to 6.0); the Planck / constraint lies significantly above that produced by AMI.
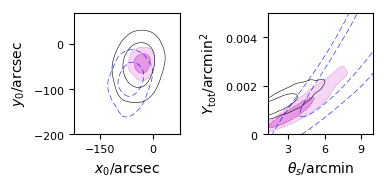
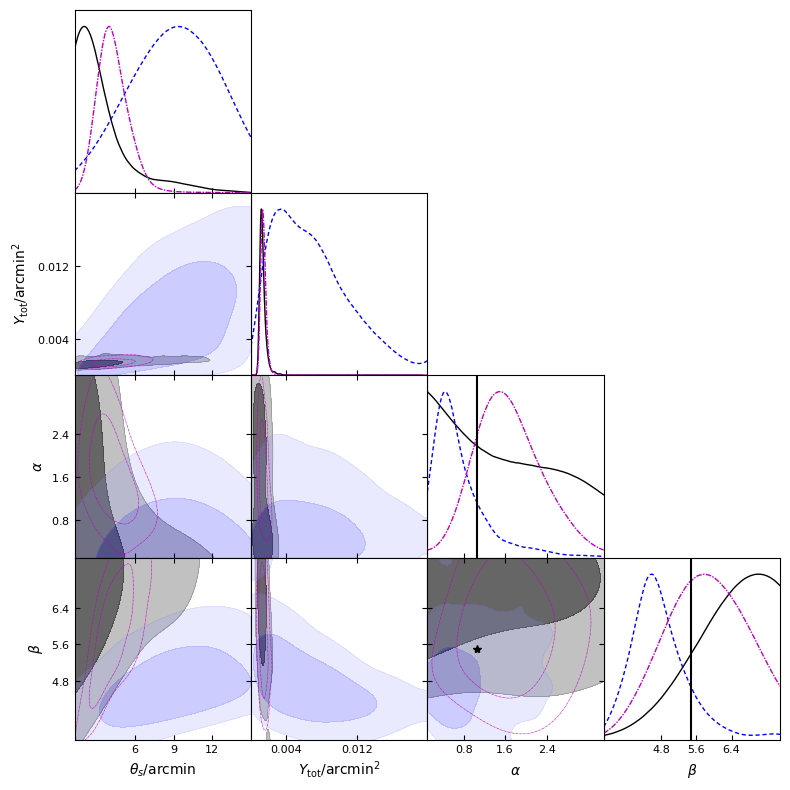
We now analyse the PSZ2 G063.80+11.42 data while allowing and to vary. Figure 10 shows the resulting posterior distributions for the AMI-only, Planck-only and joint analysis methods. Similarly to the simulations, we see that is well constrained by the joint analysis and the constraint is completely driven by the Planck data. The addition of AMI data improves the constraint on from an upper limit to a true constraint, and both and are constrained, although not tightly. The one-dimensional parameter constraints are summarized in Table 3; agrees with the UPP value, while a higher value of is favoured but only at the level. We perform one further analysis on the AMI data, fixing to the fitted value from the joint analysis, and leaving fixed to the UPP value. The posterior constraints on and in this case are shown in comparison with the AMI-only UPP analysis and the Planck analysis varying and ; it can be seen that the AMI posterior shifts in the correct direction to overlap with Planck, confirming that this value of gives better agreement between the two instruments (Fig. 10, upper right-hand corner). No X-ray observations of this cluster are available to compare X-ray-derived constraints on the profile parameters; for our future AMI-Planck sample (see Section 8) comparison with X-ray-derived parameters will be informative and complementary across a different range of angular scales.
| AMI-only | Planck-only | AMI-Planck | |
|---|---|---|---|
| / arcsec | |||
| / arcsec | |||
| / ( arcmin2) | |||
| / arcmin | |||
8 Future work
Along with the sample of 99 clusters from P15, clusters which were previously excluded from the AMI sample due to difficult radio source environments are currently being reobserved with the new correlator; the superior dynamic range of the new instrument allows us to cope better with these environments and successfully extract cluster parameters. We will analyse all AMI detections with the joint pipeline, giving us a large cluster sample to probe deviations from the UPP and consider the impact this may have on the Planck cluster number counts.
We note that Javid et al. (2019) found that realistic radio source environments could bias the recovery of cluster parameters from AMI data. This issue and its effect on the recovery of the pressure profile parameters will be investigated in conjunction with the analysis of the larger AMI-Planck sample.
With the larger sample we will be able to compare our SZ-derived profile parameters to X-ray-derived parameters. This will allow us to test for any systematic differences and combine information across a broader range of angular scales.
Our pipeline is also simply extensible to the use of any physical model which uses a GNFW profile for the gas pressure, e.g. the models proposed in Olamaie et al. (2012), Javid et al. (2018) and Javid et al. (2019). We also plan to implement a non-parametric model such as that proposed in Olamaie et al. (2018).
9 Conclusions
-
1.
We have developed a joint likelihood function for SZ data obtained from the Planck satellite and the Arcminute Microkelvin Imager (AMI) radio interferometer system, in order to compare inferences obtained using it with those from the individual likelihoods. The method could apply to any combination of Planck and interferometric data from one or more telescopes.
-
2.
We generated simulations of clusters using an observational model similar to the one used in Perrott et al. (2015), using gas pressure profile shape parameter values taken from either the UPP (Arnaud et al. 2010, ‘universal’ pressure profile) or two other realistic variations. We considered both a smaller angular size, fainter cluster and a larger angular size, brighter cluster. From looking at the resulting posterior distributions we found the following:
-
•
When simulating and analysing the clusters using the model with UPP parameters the joint analysis greatly reduced the degeneracy in - shown in the individual AMI and Planck analyses, due to the different degeneracy directions for the individual datasets. The improvement on the parameter constraints for the joint analysis is particularly prominent in the small angular size cases. Thus when the profile shape of a cluster is known a-priori, the combination of the two datasets provides accurate, precise constraints on the cluster parameters with no need for external information to reduce the - degeneracy.
-
•
When simulated clusters created using non-UPP profiles are analysed with the profile shape assumed to be UPP, the - constraints are biased away from the true value. This occurs in the individual AMI and Planck datasets and is particularly problematic in the joint analysis, where a tight, significantly biased constraint is produced.
-
•
When allowing the shape parameters to vary in the Bayesian analysis, we generally found that for all the clusters was well-constrained and unbiased; Planck drove the constraint and the joint analyses improved the constraint slightly.
-
•
Furthermore dependent on how well resolved the clusters are, the shape parameter can often be constrained. Due to the strong - degeneracy these parameters are more difficult to constrain and it is usually only possible to place limits on them.
-
•
-
3.
Finally, we applied the joint analysis to real data for the cluster PSZ2 G063.80+11.42 which is part of the sample of 99 clusters considered in P15. We confirmed the discrepancy in and estimates when using updated AMI data and resolved it by allowing and to vary. Using the joint analysis we could constrain and well and place loose constraints on and , finding that a slightly higher value of than the UPP value was preferred, while the constraint on was consistent with the UPP value.
-
4.
We plan to apply our method to all the 99 clusters of the P15 sample, plus clusters currently being reobserved by AMI, to investigate deviations from the UPP and possible impact on the Planck cluster number counts. We also plan to extend our method to incorporate different physical and non-parametric cluster models.
Acknowledgements
We thank the staff of the Mullard Radio Astronomy Observatory for their invaluable assistance in the commissioning and operation of AMI, which is supported by Cambridge and Oxford Universities. This work is based on observations obtained with Planck (http://www.esa.int/Planck), an ESA science mission with instruments and contributions directly funded by ESA Member States, NASA, and Canada. This work was performed using the Darwin Supercomputer of the University of Cambridge High Performance Computing (HPC) Service (http://www.hpc.cam.ac.uk/), provided by Dell Inc. using Strategic Research Infrastructure Funding from the Higher Education Funding Council for England and funding from the Science and Technology Facilities Council. The authors would like to thank Stuart Rankin from HPC and Greg Willatt and David Titterington from Cavendish Astrophysics for computing assistance. KJ and PJE acknowledge Science and Technology Facilities Council studentships. YCP acknowledges support from a Trinity College JRF and Rutherford Discovery Fellowship.
References
- Adam et al. (2015) Adam, R., and 39 colleagues 2015. Pressure distribution of the high-redshift cluster of galaxies CL J1226.9+3332 with NIKA. Astronomy and Astrophysics 576, A12.
- Adam et al. (2016) Adam, R., and 44 colleagues 2016. High angular resolution Sunyaev-Zel’dovich observations of MACS J1423.8+2404 with NIKA: Multiwavelength analysis. Astronomy and Astrophysics 586, A122.
- Adam et al. (2014) Adam, R., and 37 colleagues 2014. First observation of the thermal Sunyaev-Zel’dovich effect with kinetic inductance detectors. Astronomy and Astrophysics 569, A66.
- Allen et al. (2008) Allen, S. W., Rapetti, D. A., Schmidt, R. W., Ebeling, H., Morris, R. G., Fabian, A. C. 2008. Improved constraints on dark energy from Chandra X-ray observations of the largest relaxed galaxy clusters. Monthly Notices of the Royal Astronomical Society 383, 879.
- AMI Consortium et al. (2012) AMI Consortium, and 18 colleagues 2012. Parametrization effects in the analysis of AMI Sunyaev-Zel’dovich observations. Monthly Notices of the Royal Astronomical Society 421, 1136.
- Arnaud et al. (2010) Arnaud, M., Pratt, G. W., Piffaretti, R., Böhringer, H., Croston, J. H., Pointecouteau, E. 2010. The universal galaxy cluster pressure profile from a representative sample of nearby systems (REXCESS) and the YSZ - M500 relation. Astronomy and Astrophysics 517, A92.
- Birkinshaw (1999) Birkinshaw, M. 1999. The Sunyaev-Zel’dovich effect. Physics Reports 310, 97.
- Bleem et al. (2015) Bleem, L. E., and 73 colleagues 2015. Galaxy Clusters Discovered via the Sunyaev-Zel’dovich Effect in the 2500-Square-Degree SPT-SZ Survey. The Astrophysical Journal Supplement Series 216, 27.
- Böhringer et al. (2007) Böhringer, H., and 33 colleagues 2007. The representative XMM-Newton cluster structure survey (REXCESS) of an X-ray luminosity selected galaxy cluster sample. Astronomy and Astrophysics 469, 363.
- Carvalho et al. (2009) Carvalho, P., Rocha, G., Hobson, M. P. 2009. A fast Bayesian approach to discrete object detection in astronomical data sets - PowellSnakes I. Monthly Notices of the Royal Astronomical Society 393, 681.
- Carvalho et al. (2012) Carvalho, P., Rocha, G., Hobson, M. P., Lasenby, A. 2012. PowellSnakes II: a fast Bayesian approach to discrete object detection in multi-frequency astronomical data sets. Monthly Notices of the Royal Astronomical Society 427, 1384.
- Chevallier and Polarski (2001) Chevallier, M., Polarski, D. 2001. Accelerating Universes with Scaling Dark Matter. International Journal of Modern Physics D 10, 213.
- Czakon et al. (2015) Czakon, N. G., and 13 colleagues 2015. Galaxy Cluster Scaling Relations between Bolocam Sunyaev-Zel’dovich Effect and Chandra X-Ray Measurements. The Astrophysical Journal 806, 18.
- da Silva et al. (2004) da Silva, A. C., Kay, S. T., Liddle, A. R., Thomas, P. A. 2004. Hydrodynamical simulations of the Sunyaev-Zel’dovich effect: cluster scaling relations and X-ray properties. Monthly Notices of the Royal Astronomical Society 348, 1401.
- AMI Consortium et al. (2011) AMI Consortium, and 18 colleagues 2011. 10C survey of radio sources at 15.7 GHz - II. First results. Monthly Notices of the Royal Astronomical Society 415, 2708.
- Di Mascolo et al. (2019) Di Mascolo, L., Churazov, E., Mroczkowski, T. 2019. A joint ALMA-Bolocam-Planck SZ study of the pressure distribution in RX J1347.5-1145. Monthly Notices of the Royal Astronomical Society 487, 4037.
- Dutton and Macciò (2014) Dutton, A. A., Macciò, A. V. 2014. Cold dark matter haloes in the Planck era: evolution of structural parameters for Einasto and NFW profiles. Monthly Notices of the Royal Astronomical Society 441, 3359.
- Hasler et al. (2012) Hasler, N., and 21 colleagues 2012. Joint Analysis of X-Ray and Sunyaev-Zel’dovich Observations of Galaxy Clusters Using an Analytic Model of the Intracluster Medium. The Astrophysical Journal 748, 113.
- Herranz et al. (2002) Herranz, D., and 6 colleagues 2002. Filtering techniques for the detection of Sunyaev-Zel’dovich clusters <br/> in multifrequency maps. Monthly Notices of the Royal Astronomical Society 336, 1057.
- Einasto (1965) Einasto, J. 1965. On the Construction of a Composite Model for the Galaxy and on the Determination of the System of Galactic Parameters. Trudy Astrofizicheskogo Instituta Alma-Ata 5, 87.
- Ettori et al. (2009) Ettori, S., and 7 colleagues 2009. The cluster gas mass fraction as a cosmological probe: a revised study. Astronomy and Astrophysics 501, 61.
- Feroz et al. (2009) Feroz, F., Hobson, M. P., Bridges, M. 2009. MULTINEST: an efficient and robust Bayesian inference tool for cosmology and particle physics. Monthly Notices of the Royal Astronomical Society 398, 1601.
- Feroz et al. (2009) Feroz, F., Hobson, M. P., Zwart, J. T. L., Saunders, R. D. E., Grainge, K. J. B. 2009. Bayesian modelling of clusters of galaxies from multifrequency-pointed Sunyaev-Zel’dovich observations. Monthly Notices of the Royal Astronomical Society 398, 2049.
- Grainge et al. (2002) Grainge, K., and 6 colleagues 2002. Measuring the Hubble constant from Ryle Telescope and X-ray observations, with application to Abell 1413. Monthly Notices of the Royal Astronomical Society 333, 318.
- Grainge et al. (2015) Grainge, K., and 7 colleagues 2015. The SKA and Galaxy Cluster Science with the Sunyaev-Zel’dovich Effect. Advancing Astrophysics with the Square Kilometre Array (AASKA14) 170.
- Hickish et al. (2018) Hickish, J., and 20 colleagues 2018. A digital correlator upgrade for the Arcminute MicroKelvin Imager. Monthly Notices of the Royal Astronomical Society 475, 5677, DOI:https://doi.org/10.1093/mnras/sty074.
- Hilton et al. (2018) Hilton, M., and 43 colleagues 2018. The Atacama Cosmology Telescope: The Two-season ACTPol Sunyaev-Zel’dovich Effect Selected Cluster Catalog. The Astrophysical Journal Supplement Series 235, 20.
- Hinshaw et al. (2013) Hinshaw, G., and 20 colleagues 2013. Nine-year Wilkinson Microwave Anisotropy Probe (WMAP) Observations: Cosmological Parameter Results. The Astrophysical Journal Supplement Series 208, 19.
- Hobson et al. (2002) Hobson, M. P., Bridle, S. L., Lahav, O. 2002. Combining cosmological data sets: hyperparameters and Bayesian evidence. Monthly Notices of the Royal Astronomical Society 335, 377.
- Hobson and Maisinger (2002) Hobson, M. P., Maisinger, K. 2002. Maximum-likelihood estimation of the cosmic microwave background power spectrum from interferometer observations. Monthly Notices of the Royal Astronomical Society 334, 569.
- Javid (2019) Javid K. 2019. Physical modelling of galaxy clusters and Bayesian inference in astrophysics (Doctoral thesis). University of Cambridge, DOI:https://doi.org/10.17863/CAM.40616.
- Javid et al. (2018) Javid, K., Perrott, Y. C., Hobson, M. P., Olamaie, M., Rumsey, C., Saunders, R. D. E. 2018. Comparison of physical and observational galaxy cluster modelling. arXiv e-prints arXiv:1805.01968, DOI:https://doi.org/10.17863/CAM.38865.
- Javid et al. (2019) Javid, K., Perrott, Y. C., Rumsey, C., Saunders, R. D. E. 2019. Physical modelling of galaxy cluster Sunyaev-Zel’dovich data using Einasto dark matter profiles. Monthly Notices of the Royal Astronomical Society 489, 3135, DOI:https://doi.org/10.1093/mnras/stz2341.
- Javid et al. (2019) Javid, K., and 7 colleagues 2019. Physical modelling of galaxy clusters detected by the Planck satellite. Monthly Notices of the Royal Astronomical Society 483, 3529, DOI:https://doi.org/10.1093/mnras/sty3115.
- Kitayama et al. (2016) Kitayama, T., and 14 colleagues 2016. The Sunyaev-Zel’dovich effect at 5": RX J1347.5-1145 imaged by ALMA. Publications of the Astronomical Society of Japan 68, 88.
- Korngut et al. (2011) Korngut, P. M., and 8 colleagues 2011. MUSTANG High Angular Resolution Sunyaev-Zel’dovich Effect Imaging of Substructure in Four Galaxy Clusters. The Astrophysical Journal 734, 10.
- Lahav et al. (2000) Lahav, O., Bridle, S. L., Hobson, M. P., Lasenby, A. N., Sodré, L. 2000. Bayesian ‘hyper-parameters’ approach to joint estimation: the Hubble constant from CMB measurements. Monthly Notices of the Royal Astronomical Society 315, L45.
- LaRoque et al. (2006) LaRoque, S. J., and 6 colleagues 2006. X-Ray and Sunyaev-Zel’dovich Effect Measurements of the Gas Mass Fraction in Galaxy Clusters. The Astrophysical Journal 652, 917.
- Ma and Berndsen (2014) Ma, Y.-Z., Berndsen, A. 2014. How to combine correlated data sets-A Bayesian hyperparameter matrix method. Astronomy and Computing 5, 45.
- Mantz et al. (2008) Mantz, A., Allen, S. W., Ebeling, H., Rapetti, D. 2008. New constraints on dark energy from the observed growth of the most X-ray luminous galaxy clusters. Monthly Notices of the Royal Astronomical Society 387, 1179.
- Mantz et al. (2010) Mantz, A., Allen, S. W., Rapetti, D., Ebeling, H. 2010. The observed growth of massive galaxy clusters - I. Statistical methods and cosmological constraints. Monthly Notices of the Royal Astronomical Society 406, 1759.
- Marriage et al. (2011) Marriage, T. A., and 68 colleagues 2011. The Atacama Cosmology Telescope: Extragalactic Sources at 148 GHz in the 2008 Survey. The Astrophysical Journal 731, 100.
- Marriage et al. (2011) Marriage, T. A., and 70 colleagues 2011. The Atacama Cosmology Telescope: Sunyaev-Zel’dovich-Selected Galaxy Clusters at 148 GHz in the 2008 Survey. The Astrophysical Journal 737, 61.
- Melin et al. (2006) Melin, J.-B., Bartlett, J. G., Delabrouille, J. 2006. Catalog extraction in SZ cluster surveys: a matched filter approach. Astronomy and Astrophysics 459, 341.
- Monfardini et al. (2014) Monfardini, A., and 34 colleagues 2014. Latest NIKA Results and the NIKA-2 Project. Journal of Low Temperature Physics 176, 787.
- Muchovej et al. (2011) Muchovej, S., and 15 colleagues 2011. Cosmological Constraints from a 31 GHz Sky Survey with the Sunyaev-Zel’dovich Array. The Astrophysical Journal 732, 28.
- Nagai (2006) Nagai, D. 2006. The Impact of Galaxy Formation on the Sunyaev-Zel’dovich Effect of Galaxy Clusters. The Astrophysical Journal 650, 538.
- Nagai et al. (2007) Nagai, D., Kravtsov, A. V., Vikhlinin, A. 2007. Effects of Galaxy Formation on Thermodynamics of the Intracluster Medium. The Astrophysical Journal 668, 1.
- Navarro et al. (1995) Navarro, J. F., Frenk, C. S., White, S. D. M. 1995. Simulations of X-ray clusters. Monthly Notices of the Royal Astronomical Society 275, 720.
- Olamaie et al. (2012) Olamaie, M., Hobson, M. P., Grainge, K. J. B. 2012. A simple parametric model for spherical galaxy clusters. Monthly Notices of the Royal Astronomical Society 423, 1534.
- Olamaie et al. (2013) Olamaie, M., Hobson, M. P., Grainge, K. J. B. 2013. Mass and pressure constraints on galaxy clusters from interferometric Sunyaev-Zel’dovich observations. Monthly Notices of the Royal Astronomical Society 430, 1344.
- Olamaie et al. (2018) Olamaie, M., and 7 colleagues 2018. Free-form modelling of galaxy clusters: a Bayesian and data-driven approach. Monthly Notices of the Royal Astronomical Society 481, 3853.
- Perrott et al. (2015) Perrott, Y. C., and 41 colleagues 2015. Comparison of Sunyaev-Zel’dovich measurements from Planck and from the Arcminute Microkelvin Imager for 99 galaxy clusters. Astronomy and Astrophysics 580, A95.
- Planck Collaboration et al. (2015) Planck Collaboration, and 277 colleagues 2015. Planck 2013 results. XXXII. The updated Planck catalogue of Sunyaev-Zeldovich sources. Astronomy and Astrophysics 581, A14.
- Planck Collaboration et al. (2014) Planck Collaboration, and 275 colleagues 2014. Planck 2013 results. XXIX. The Planck catalogue of Sunyaev-Zeldovich sources. Astronomy and Astrophysics 571, A29.
- Planck Collaboration et al. (2013) Planck Collaboration, and 217 colleagues 2013. Planck intermediate results. V. Pressure profiles of galaxy clusters from the Sunyaev-Zeldovich effect. Astronomy and Astrophysics 550, A131.
- Planck Collaboration et al. (2016) Planck Collaboration, and 201 colleagues 2016. Planck 2015 results. XXII. A map of the thermal Sunyaev-Zeldovich effect. Astronomy and Astrophysics 594, A22.
- Planck Collaboration et al. (2016) Planck Collaboration, and 235 colleagues 2016. Planck 2015 results. XXIV. Cosmology from Sunyaev-Zeldovich cluster counts. Astronomy and Astrophysics 594, A24.
- Planck Collaboration et al. (2016) Planck Collaboration, and 259 colleagues 2016. Planck 2015 results. XXVII. The second Planck catalogue of Sunyaev-Zeldovich sources. Astronomy and Astrophysics 594, A27.
- Remazeilles et al. (2019) Remazeilles M., Bolliet B., Rotti A., Chluba J. 2019. Can we neglect relativistic temperature corrections in the Planck thermal SZ analysis? MNRAS, 483, 3459.
- Romero et al. (2015) Romero, C. E., and 13 colleagues 2015. Galaxy Cluster Pressure Profiles, as Determined by Sunyaev-Zeldovich Effect Observations with MUSTANG and Bolocam. I. Joint Analysis Technique. The Astrophysical Journal 807, 121.
- Romero et al. (2018) Romero, C., and 39 colleagues 2018. A multi-instrument non-parametric reconstruction of the electron pressure profile in the galaxy cluster CLJ1226.9+3332. Astronomy and Astrophysics 612, A39.
- Ruppin et al. (2017) Ruppin, F., and 40 colleagues 2017. Non-parametric deprojection of NIKA SZ observations: Pressure distribution in the Planck-discovered cluster PSZ1 G045.85+57.71. Astronomy and Astrophysics 597, A110.
- Ruppin et al. (2018) Ruppin, F., and 39 colleagues 2018. First Sunyaev-Zel’dovich mapping with the NIKA2 camera: Implication of cluster substructures for the pressure profile and mass estimate. Astronomy and Astrophysics 615, A112.
- Sayers et al. (2013) Sayers, J., and 16 colleagues 2013. Sunyaev-Zel’dovich-measured Pressure Profiles from the Bolocam X-Ray/SZ Galaxy Cluster Sample. The Astrophysical Journal 768, 177.
- Sayers et al. (2016) Sayers, J., and 9 colleagues 2016. A Comparison and Joint Analysis of Sunyaev-Zel’dovich Effect Measurements from Planck and Bolocam for a Set of 47 Massive Galaxy Clusters. The Astrophysical Journal 832, 26.
- Sehgal et al. (2011) Sehgal, N., and 68 colleagues 2011. The Atacama Cosmology Telescope: Cosmology from Galaxy Clusters Detected via the Sunyaev-Zel’dovich Effect. The Astrophysical Journal 732, 44.
- Staniszewski et al. (2009) Staniszewski, Z., and 43 colleagues 2009. Galaxy Clusters Discovered with a Sunyaev-Zel’dovich Effect Survey. The Astrophysical Journal 701, 32.
- The Planck Collaboration (2006) The Planck Collaboration 2006. The Scientific Programme of Planck. arXiv e-prints astro-ph/0604069.
- Vikhlinin et al. (2009) Vikhlinin, A., and 10 colleagues 2009. Chandra Cluster Cosmology Project III: Cosmological Parameter Constraints. The Astrophysical Journal 692, 1060.
- Williamson et al. (2011) Williamson, R., and 74 colleagues 2011. A Sunyaev-Zel’dovich-selected Sample of the Most Massive Galaxy Clusters in the 2500 deg2 South Pole Telescope Survey. The Astrophysical Journal 738, 139.
- Zeldovich and Sunyaev (1969) Zeldovich, Y. B., Sunyaev, R. A. 1969. The Interaction of Matter and Radiation in a Hot-Model Universe. Astrophysics and Space Science 4, 301.
- Zwart et al. (2008) Zwart, J. T. L., and 60 colleagues 2008. The Arcminute Microkelvin Imager. Monthly Notices of the Royal Astronomical Society 391, 1545.
- Adam et al. (2017) Adam, R., and 49 colleagues 2017. Mapping the kinetic Sunyaev-Zel’dovich effect toward MACS J0717.5+3745 with NIKA. Astronomy and Astrophysics 598, A115.