Thermal conductivity and coordination number of compressed dust aggregates
Abstract
Understanding the heat transfer mechanism within dust aggregates is of great importance for many subjects in planetary science. We calculated the coordination number and the thermal conductivity through the solid network of compressed dust aggregates. We found a simple relationship between the coordination number and the filling factor and revealed that the thermal conductivity through the solid network of aggregates is represented by a power-law function of the filling factor and the coordination number.
keywords:
Asteroids , Comets , Regoliths1 Introduction
Understanding the thermal conductivity of dust aggregates and powdered media is important in numerous scientific and engineering fields. In the context of planetary sciences, for example, the thermal evolution of planetesimals is affected by the thermal conductivity of dust aggregates because they were formed from micron-sized grains in the solar nebula (e.g., Henke et al., 2013; Sirono, 2017). The near-surface temperature distribution of comets and asteroids also depends on the thermal conductivity of surface grains called regolith (e.g., Blum et al., 2017; Okada et al., 2017). Moreover, the radial motion of dust aggregates in a protoplanetary disk is induced by photophoresis, and the efficiency of this process is controlled by the thermal conductivity (e.g., Wurm and Haack, 2009; Loesche and Wurm, 2012).
The thermal conductivity of dust aggregates depends on many physical parameters, and there are many experimental and numerical studies on the thermal conductivity of dust aggregates. The thermal conductivity of porous aggregates under a vacuum condition is given by two terms: the thermal conductivity through the solid network and the thermal conductivity owing to radiative transfer . It is usually thought that the coordination number of monomer grains (i.e., the average number of contacts per grain) influences the thermal conductivity through the solid network (e.g., Gusarov et al., 2003; Sirono, 2014). Sakatani et al. (2016) revealed that is dependent on the contact radius between monomers normalized by the monomer radius as well. The thermal conductivity owing to radiative transfer is affected by the temperature of dust aggregates and the mean free path of photons (e.g., Gundlach and Blum, 2012; Arakawa et al., 2017), and the mean free path of photons depends on the monomer radius , the filling factor , and optical properties of dust aggregates.
Arakawa et al. (2017) revealed that the thermal conductivity through the solid network is proportional to the square of the filling factor for highly porous aggregates with filling factors below . The coordination number hardly changes with changing of for highly porous aggregates and the effect of on would be invisible. In contrast, for compressed aggregates with filling factors above , the coordination number could be dependent on the filling factor and the effect of the coordination number on the thermal conductivity is expected to be observed.
In this study, we calculate the coordination number and the thermal conductivity through the solid network for compressed dust aggregates with filling factors in a wide range of . These snapshot data of compressed dust aggregates are prepared in the same way as Kataoka et al. (2013). We examine filling factor dependences of the coordination number and the thermal conductivity through the solid network , and we derive empirical formulae of and . Then we confirm the validity of the results by comparison with the experimental data of Sakatani et al. (2017). Our findings are expected to be competent tools for many fields of study related to dust aggregates and powdered media.
2 Methods
We perform three-dimensional numerical calculations of dust aggregates using the model described by Arakawa et al. (2017). Here we briefly summarize our numerical methods.
2.1 Arrangement of monomer grains
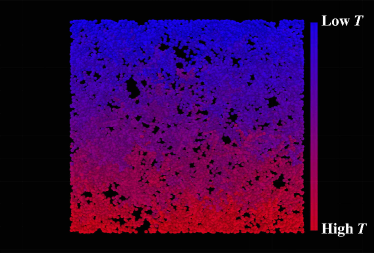
The arrangement of monomer grains depends on the coagulation history of the aggregates. At the initial stage of coagulation of dust aggregates in protoplanetary disks, both experimental (e.g., Wurm and Blum, 1998) and theoretical (e.g., Kempf et al., 1999) studies have shown that hit-and-stick collisions without compression lead to the formation of highly porous aggregates with the fractal dimension close to two, which is called ballistic cluster-cluster aggregation (BCCA; Meakin, 1991). In this study, we prepare snapshots of the compressed BCCA aggregates comprised of spherical monomer grains using three-dimensional numerical simulations of static compression as Kataoka et al. (2013). Figure 1 is an example snapshot of a compressed dust aggregate.
2.2 Temperature structure of the dust aggregate
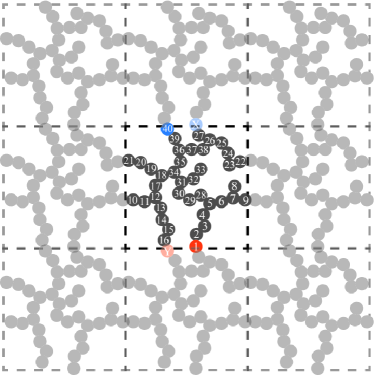
In order to calculate the thermal conductivity through the solid network of an aggregate , we determine the temperature of each monomer grain in a cubic periodic boundary (Sirono, 2014; Arakawa et al., 2017). We calculate the temperature of each grain using the method of Arakawa et al. (2017). Here, we consider one-directional heat flow from the lower boundary plane to the upper boundary plane (see Fig. 2). There are three choices regarding the pair of the lower and the upper planes, and we calculate from three directions.
We define as the monomer radius and as the volume of each cubic space. The location of the -th grain satisfies , , and for , where is the number of grains in the periodic boundary (see Fig. 2). The grains located in are on the lower boundary, and the grains located in are on the upper boundary. When the -th grain is located on the lower (upper) boundary, we add a new grain on the upper (lower) boundary. The location of the new grain is for the case when the -th grain is located on the lower boundary and for the case when the -th grain is located on the upper boundary. We set the temperature of grains located on the lower and the upper boundary as and , respectively.
Heat flows through the monomer-monomer contacts, and for the case of the steady state, the equation of heat balance at the internal -th grain is given by
| (1) |
where is the heat flow from the -th grain to the -th grain. The heat flow from the -th grain to the -th grain is given by
| (2) |
where is the heat conductance at the contact of two grains and and are the temperatures of the -th and -th grains. We consider the contacts not only inside the periodic boundary but also on the side boundaries. The heat conductance at the contact of two grains is (Cooper et al., 1969)
| (3) |
where is the material thermal conductivity and is the contact radius of monomer grains. The contact radius depends on the monomer radius and the material parameters (see, e.g., Wada et al., 2007);
| (4) |
where , , and are the surface energy, the Poisson’s ratio, and Young’s modulus of monomer grains, respectively. The temperature structure of the aggregate in the cubic periodic boundary can be calculated by solving the Eq. (1) simultaneously for all monomer grains, except lower and upper boundary grains, as shown in Fig. 1.
2.3 Thermal conductivity through the solid network
Once the temperature structure is obtained, we calculate the total heat flow at the upper boundary , where we take the sum of contacts between the upper boundary -th grain and internal -th grain (for the case of Fig. 2, ). The total heat flow at the upper boundary can be rewritten using the thermal conductivity through the solid network as
| (5) |
We discuss as a function of the filling factor in this study, and rewrite using as
| (6) |
Therefore we obtain as a function of as follows:
| (7) | |||||
where is a dimensionless function of .
3 Numerical Results
We carried out 10 runs of numerical simulations of static compression with different initial shape of the BCCA aggregate. Then we took 20 snapshot data for each run of compression simulation. The filling factors of compressed dust aggregates range from to with logarithmic steps of and from to with logarithmic steps of . We investigate the filling factor dependence of and from 10 snapshot data for each obtained from different runs of compression simulations.
3.1 Coordination number
The coordination number (i.e., the average number of contacts per grain) increases as an aggregate is compressed. The initial coordination number of an uncompressed BCCA aggregate is approximately , so we define as the deviation of the coordination number from the initial condition;
| (8) |
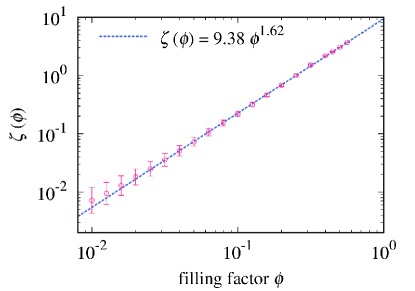
Figure 3 shows the deviation of the coordination number from the initial condition as a function of the filling factor . The magenta circles represent the geometric mean of 10 snapshots from different runs with vertical error bars of twice the standard error. We found that a power-law function well fits the filling factor dependence of at least in the range of , and the best-fit curve given by the weighted least-squares method is (blue dashed curve),
| (9) |
Therefore the coordination number is given by,
| (10) |
The coordination number and the filling factor are the key parameters not only for the thermal conductivity but also for the outcome of the collision between dust aggregates (e.g., Wada et al., 2011; Seizinger and Kley, 2013). Bouncing collisions of dust aggregates within a protoplanetary disk might prevent dust aggregates from growing into planetesimals via direct aggregation (Zsom et al., 2010). The results from numerical simulations of aggregate collisions indicate that dust aggregates can stick to each other only when the coordination number is (Wada et al., 2011), or a filling factor of might be the condition for collisional growth (Seizinger and Kley, 2013).
3.2 Thermal conductivity
Previous studies (e.g., Sakatani et al., 2017) predicted that thermal conductivity depends on both the filling factor and the coordination number . For highly porous aggregates, however, is approximately two and behaves as a constant, hence would only depend on for highly porous aggregates. Arakawa et al. (2017) revealed that is approximately proportional to the square of for highly porous aggregates with filling factors below . In this study, we calculate the dimensionless function of the thermal conductivity for both loose (i.e., ) and close (i.e., ) dust aggregates.
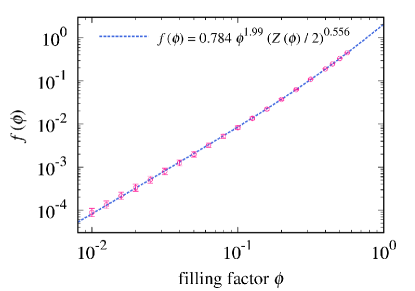
Figure 4 shows the dimensionless function as a function of the filling factor . The magenta circles represent the geometric mean of 30 calculation results of the temperature structure from 3 directions and 10 different runs, with vertical error bars of twice the standard error. Here we assume that is given by the power-law function of and , and the best-fit curve given by the weighted least-squares method is (blue dashed curve),
| (11) |
For highly porous dust aggregates with filling factors in the range from to , Arakawa et al. (2017) obtained a relationship between and as . Our novel formula of approximately coincides with the result of Arakawa et al. (2017) for highly porous aggregates, and we numerically reveal the effect of the coordination number on the dimensionless function of the thermal conductivity using highly compressed aggregates.
4 Comparison with experimental data
4.1 Comparison with Sakatani et al. (2017)
The thermal conductivity of dust aggregates in a vacuum is the sum of and , and the contributions of and are distinguishable by measuring the temperature dependence of the total thermal conductivity (e.g., Sakatani et al., 2016, 2017). Sakatani et al. (2017) obtained the filling factor dependence of for dust aggregates composed of micron-sized glass grains. Therefore, by comparison with the experimental data of Sakatani et al. (2017), we can verify our model (Fig. 5). The blue dashed curve is the calculated thermal conductivity from Eqs. (7) and (11), and the magenta circles represents the experimental data of dust aggregates (Sakatani et al., 2017).
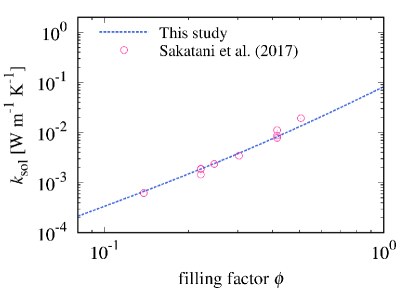
When we consider the dust aggregates of micron-sized monomers, the contact radius between monomers is given by Eq. (4). The material properties of glass grains are listed as follows: the surface energy , the Poisson’s ratio , and Young’s modulus (Seizinger and Kley, 2013). The monomer radius used in Sakatani et al. (2017) is . The material thermal conductivity depends on the temperature, and at a temperature of , the material thermal conductivity is (Sakatani et al., 2017). Figure 5 shows that our empirical model of reproduces the experimental results with a relative difference of 30% or less for a wide range of filling factors.
4.2 Comparison with Krause et al. (2011)
The thermal conductivity of porous dust aggregates composed of micron-sized glass grains is obtained by Krause et al. (2011), using a combination of laboratory experiments and numerical simulations. Krause et al. (2011) reported the filling factor dependence of the thermal conductivity of dust aggregates as Sakatani et al. (2017), although Krause et al. (2011) did not resolve the contributions of the thermal conductivity through the solid network and the thermal conductivity owing to radiative transfer . For dust aggregates composed of micron-sized monomers, however, we can calculate using the Rossland diffusion approximation (e.g., Arakawa et al., 2017), and we can also calculate by using Eqs. (7) and (11). Therefore, by comparison with the experimental data of Krause et al. (2011), we can test the validity of our novel models for both and .
The thermal conductivity through the solid network is calculated from Eqs. (7) and (11). In the experiments by Krause et al. (2011), each sample was heated by the laser beam, and the temperature of dust aggregates temporally changes during their thermal conductivity measurements. Krause et al. (2011) reported that the surface temperature of heated dust samples varied from to . Therefore we take into account the temperature dependence of the contact radius and the material thermal conductivity . We consider the temperature dependence of the material thermal conductivity and the surface energy . Gundlach and Blum (2012) assumed that and increase with temperature as follows:
| (12) |
and
| (13) |
with , , and . We apply these temperature dependences of and to the calculation of . The monomer radius used in Krause et al. (2011) is , and we assume the Poisson’s ratio and Young’s modulus (Seizinger and Kley, 2013) as constant values for the calculation of the contact radius .
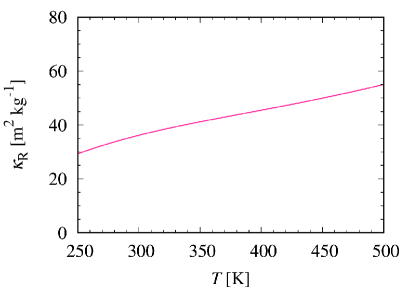
We also calculate the thermal conductivity owing to radiative transfer . The thermal conductivity owing to radiative transfer is proportional to the mean free path of photons . In addition, when the monomer radius is smaller than the thermal emission wavelength, is inversely proportional to the Rossland mean opacity . Therefore we calculate the Rossland mean opacity of glass grains whose radius is and we obtain the temperature-dependent (see A).
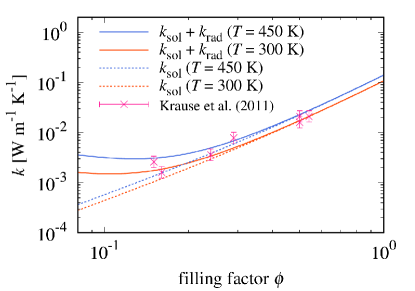
Figure 6 shows the filling factor dependence of the thermal conductivity through of dust aggregates composed of glass grains. The solid curves are the sum of the thermal conductivity through the solid network and the thermal conductivity owing to radiative transfer, , whereas the dashed curves represent the thermal conductivity through the solid network . The blue curves correspond to the thermal conductivity at , and the red curves correspond to the thermal conductivity at . By comparison with experimental data of Krause et al. (2011, magenta crosses) and our numerical result of (blue and orange solid curves), we found that our novel model well reproduces the experimental results for a wide range of filling factors. In addition, the experimental results can only be explained when we take into consideration the effect of radiative transfer when we consider highly porous aggregates (see the experimental data of in Fig. 6). This conclusion about the contribution of is qualitatively consistent with the claim of Gundlach and Blum (2012). We also stress that our model has no free parameter to fit the numerical calculations to the experimental results.
5 Discussion
5.1 Contributions of and
As shown in Fig. 6, the contribution of becomes important when the filling factor of dust aggregates becomes lower, whereas the contribution of is much important when the filling factor is higher. Here we define the transition filling factor by solving the equation . Assuming for simplicity, we obtain the following relation:
| (14) |
For the case of glass grains with and , the transition filling factor is given by . The transition filling factor is a strong function of because of the strong temperature dependence of ; when the temperature is , then the transition filling factor is for dust aggregates composed of micron-sized glass grains. This fact implies that the thermal conductivity through the solid network might be the dominant term for the heat conduction within cold small bodies, such as comets and trans-Neptunian objects.
5.2 Estimation of monomer properties
As seen above, both and depend on the chemical composition and the monomer radius of dust aggregates, because , , and are strongly dependent on these monomer properties. Therefore, it is possible to give some constraints on the chemical composition and the monomer radius of small bodies by measuring the thermal conductivity of the surface regolith of small bodies. Determining these fundamental properties is of course exceedingly important for understanding the collisional growth process of the planetesimal formation (e.g., Blum and Wurm, 2008; Arakawa and Nakamoto, 2016; Musiolik et al., 2016). For the case of comets, the thermal inertia of comets 9P/Tempel 1 and 67P/Churyumov-Gerasimenko are observed by the Deep Impact mission and the Rosetta mission (e.g. Davidsson et al., 2013; Spohn et al., 2015; Marshall et al., 2018). The thermal inertia is given by , where is the specific heat. Then we can evaluate the when and are known from observations, and the product is a parameter directly related to the chemical composition and the monomer radius. We will discuss the nature of the building block of comets by using thermal conductivity calculations.
5.3 Pebble-pile hypothesis
In this study, we consider the heat conduction within homogeneous dust aggregates. However, several studies (e.g., Blum et al., 2017; Wahlberg Jansson et al., 2017) proposed that comets were formed via collapse of gravitationally bound clouds of millimeter- to centimeter-sized compactified dust aggregates so-called pebbles, and pebble clouds might collapse into porous pebble-pile bodies. For pebble-pile bodies comprised of millimeter- to centimeter-sized pebbles, the thermal conductivity owing to radiative transfer would be the dominant term for the heat conduction due to the large mean free path of photons inside the voids between pebbles (Gundlach and Blum, 2012). We will address the issue of “pebble-pile hypothesis” in future.
6 Conclusion
In this study, we conducted numerical simulations to determine the filling factor dependence of the thermal conductivity of compressed dust aggregates. The initial arrangements of aggregates are given by BCCA and numerical simulations of static compression are done in a cubic periodic boundary. We found a simple relationship between the coordination number and the filling factor , . This relationship is practical in a wide range of filling factors. It is also revealed that the thermal conductivity through the solid network is given by a power-law function of the filling factor and the coordination number as . Although what these indices come from is still unclear, this empirical formula well explains the experimental data of the thermal conductivity measured by Sakatani et al. (2017). In addition, when we consider the contributions of both the thermal conductivity through the solid network and the thermal conductivity owing to radiative transfer, our novel model can reproduce the experimental results of Krause et al. (2011) without any free parameters to fit the numerical calculations to the experimental results.
By using our novel relations, we can determine the thermal conductivity of dust aggregates from a given set of physical parameters. Conversely, we can also constrain the physical parameters of a specific sample by measuring the thermal conductivity. Therefore, our findings are expected to be competent tools for many fields of study related to dust aggregates and powdered media.
Acknowledgements
We thank Sin-iti Sirono and Masaki Takemoto for fruitful discussions. S.A. acknowledges Kazumasa Ohno for providing the extinction cross section of amorphous grains. This work is supported by JSPS KAKENHI Grant (JP18K03721). S.A. is supported by the Grant-in-Aid for JSPS Research Fellow (JP17J06861). N.S. is partly supported by JSPS Grant-in-Aid for Scientific Research on Innovative Areas (JP17H06459) and JSPS Core-to-Core Program “International Network of Planetary Sciences”.
Appendix A Thermal conductivity owing to radiative transfer
In this study, we consider the thermal conductivity owing to radiative transfer within fluffy aggregates composed of micron-sized grains. The thermal conductivity owing to radiative transfer is given by (e.g., Merrill, 1969)
| (15) |
where is the Stefan-Boltzmann constant. We calculated the mean free path of photons in fluffy aggregates of micron-sized grains as follows:
| (16) |
where is the Rossland mean opacity and is the material density. We also note that when the wavelength of the thermal radiation is shorter than the monomer radius and monomer grains are considered as opaque, we can apply the geometrical optics approximation for the evaluation of (e.g., Schotte, 1960).
The wavelength-averaged mean free path of photons is given by a mean opacity averaged over all wavelengths called the Rossland mean opacity :
| (17) |
where is the frequency of photons, is the wavelength-dependent extinction opacity, and is the Planck function. The frequency can be rewritten as , where is the speed of light and is the wavelength. We integrated Eq. (17) from to . The Planck function is given by,
| (18) |
where is the Planck constant and is the Boltzmann constant, respectively. With the assumption of spherical homogeneous particles, the extinction cross section and opacity are given by the Mie theory (Mie, 1908; Bohren and Huffman, 1983):
| (19) |
and
| (20) |
where is called the size parameter, and and are the Lorenz-Mie coefficients. Then we can calculate the Lorenz-Mie coefficients from the size parameter and the wavelength-dependent complex refractive index from the size parameter and the wavelength-dependent complex refractive index (see, e.g., Bohren and Huffman, 1983, for details). We took the wavelength-dependent complex refractive index of amorphous grains from Kitzmann and Heng (2018). The calculated Rossland mean opacity of glass grains is shown in Fig. 7.
References
- Arakawa and Nakamoto (2016) Arakawa, S., Nakamoto, T., 2016. Rocky Planetesimal Formation via Fluffy Aggregates of Nanograins. ApJ 832, L19. doi:10.3847/2041-8205/832/2/L19.
- Arakawa et al. (2017) Arakawa, S., Tanaka, H., Kataoka, A., Nakamoto, T., 2017. Thermal conductivity of porous aggregates. A&A 608, L7. doi:10.1051/0004-6361/201732182.
- Blum et al. (2017) Blum, J., Gundlach, B., Krause, M., Fulle, M., Johansen, A., Agarwal, J., von Borstel, I., Shi, X., Hu, X., Bentley, M.S., Capaccioni, F., Colangeli, L., Della Corte, V., Fougere, N., Green, S.F., Ivanovski, S., Mannel, T., Merouane, S., Migliorini, A., Rotundi, A., Schmied, R., Snodgrass, C., 2017. Evidence for the formation of comet 67P/Churyumov-Gerasimenko through gravitational collapse of a bound clump of pebbles. MNRAS 469, S755–S773. doi:10.1093/mnras/stx2741.
- Blum and Wurm (2008) Blum, J., Wurm, G., 2008. The Growth Mechanisms of Macroscopic Bodies in Protoplanetary Disks. ARA&A 46, 21–56. doi:10.1146/annurev.astro.46.060407.145152.
- Bohren and Huffman (1983) Bohren, C.F., Huffman, D.R., 1983. Absorption and scattering of light by small particles. Wiley science series, Wiley, New York, NY.
- Cooper et al. (1969) Cooper, M.G., Mikic, B.B., Yovanovich, M.M., 1969. Thermal contact conductance. International Journal of heat and mass transfer 12, 279–300. doi:10.1016/0017-9310(69)90011-8.
- Davidsson et al. (2013) Davidsson, B.J.R., Gutiérrez, P.J., Groussin, O., A’Hearn, M.F., Farnham, T., Feaga, L.M., Kelley, M.S., Klaasen, K.P., Merlin, F., Protopapa, S., Rickman, H., Sunshine, J.M., Thomas, P.C., 2013. Thermal inertia and surface roughness of Comet 9P/Tempel 1. Icarus 224, 154–171. doi:10.1016/j.icarus.2013.02.008.
- Gundlach and Blum (2012) Gundlach, B., Blum, J., 2012. Outgassing of icy bodies in the Solar System - II: Heat transport in dry, porous surface dust layers. Icarus 219, 618–629. doi:10.1016/j.icarus.2012.03.013.
- Gusarov et al. (2003) Gusarov, A.V., Laoui, T., Froyen, L., Titov, V.I., 2003. Contact thermal conductivity of a powder bed in selective laser sintering. International Journal of Heat and Mass Transfer 46, 1103–1109. doi:10.1016/S0017-9310(02)00370-8.
- Henke et al. (2013) Henke, S., Gail, H.P., Trieloff, M., Schwarz, W.H., 2013. Thermal evolution model for the H chondrite asteroid-instantaneous formation versus protracted accretion. Icarus 226, 212–228. doi:10.1016/j.icarus.2013.05.034.
- Kataoka et al. (2013) Kataoka, A., Tanaka, H., Okuzumi, S., Wada, K., 2013. Static compression of porous dust aggregates. A&A 554, A4. doi:10.1051/0004-6361/201321325.
- Kempf et al. (1999) Kempf, S., Pfalzner, S., Henning, T.K., 1999. N-Particle-Simulations of Dust Growth. I. Growth Driven by Brownian Motion. Icarus 141, 388–398. doi:10.1006/icar.1999.6171.
- Kitzmann and Heng (2018) Kitzmann, D., Heng, K., 2018. Optical properties of potential condensates in exoplanetary atmospheres. MNRAS 475, 94–107. doi:10.1093/mnras/stx3141.
- Krause et al. (2011) Krause, M., Blum, J., Skorov, Y.V., Trieloff, M., 2011. Thermal conductivity measurements of porous dust aggregates: I. Technique, model and first results. Icarus 214, 286–296. doi:10.1016/j.icarus.2011.04.024.
- Loesche and Wurm (2012) Loesche, C., Wurm, G., 2012. Thermal and photophoretic properties of dust mantled chondrules and sorting in the solar nebula. A&A 545, A36. doi:10.1051/0004-6361/201218989.
- Marshall et al. (2018) Marshall, D., Groussin, O., Vincent, J.B., Brouet, Y., Kappel, D., Arnold, G., Capria, M.T., Filacchione, G., Hartogh, P., Hofstadter, M., Ip, W.H., Jorda, L., Kührt, E., Lellouch, E., Mottola, S., Rezac, L., Rodrigo, R., Rodionov, S., Schloerb, P., Thomas, N., 2018. Thermal inertia and roughness of the nucleus of comet 67P/Churyumov–Gerasimenko from MIRO and VIRTIS observations. A&A 616, A122. doi:10.1051/0004-6361/201833104.
- Meakin (1991) Meakin, P., 1991. Fractal aggregates in geophysics. Reviews of Geophysics 29, 317–354. doi:10.1029/91RG00688.
- Merrill (1969) Merrill, R.B., 1969. Thermal conduction through an evacuated idealized powder over the temperature range 100 to 500 K. NASA Technical Note D-5063.
- Mie (1908) Mie, G., 1908. Beiträge zur Optik trüber Medien, speziell kolloidaler Metallösungen. Annalen der Physik 330, 377–445. doi:10.1002/andp.19083300302.
- Musiolik et al. (2016) Musiolik, G., Teiser, J., Jankowski, T., Wurm, G., 2016. Ice Grain Collisions in Comparison: CO2, H2O, and Their Mixtures. ApJ 827, 63. doi:10.3847/0004-637X/827/1/63.
- Okada et al. (2017) Okada, T., Fukuhara, T., Tanaka, S., Taguchi, M., Imamura, T., Arai, T., Senshu, H., Ogawa, Y., Demura, H., Kitazato, K., Nakamura, R., Kouyama, T., Sekiguchi, T., Hasegawa, S., Matsunaga, T., Wada, T., Takita, J., Sakatani, N., Horikawa, Y., Endo, K., Helbert, J., Müller, T.G., Hagermann, A., 2017. Thermal Infrared Imaging Experiments of C-Type Asteroid 162173 Ryugu on Hayabusa2. Space Sci. Rev. 208, 255–286. doi:10.1007/s11214-016-0286-8.
- Sakatani et al. (2017) Sakatani, N., Ogawa, K., Iijima, Y.i., Arakawa, M., Honda, R., Tanaka, S., 2017. Thermal conductivity model for powdered materials under vacuum based on experimental studies. AIP Advances 7, 015310. doi:10.1063/1.4975153.
- Sakatani et al. (2016) Sakatani, N., Ogawa, K., Iijima, Y.i., Arakawa, M., Tanaka, S., 2016. Compressional stress effect on thermal conductivity of powdered materials: Measurements and their implication to lunar regolith. Icarus 267, 1–11. doi:10.1016/j.icarus.2015.12.012.
- Schotte (1960) Schotte, W., 1960. Thermal conductivity of packed beds. AIChE Journal 6, 63–67. doi:10.1002/aic.690060113.
- Seizinger and Kley (2013) Seizinger, A., Kley, W., 2013. Bouncing behavior of microscopic dust aggregates. A&A 551, A65. doi:10.1051/0004-6361/201220946.
- Sirono (2014) Sirono, S.i., 2014. Numerical simulation of heat conduction in a random ballistic deposited grain aggregate. Meteoritics and Planetary Science 49, 109–116. doi:10.1111/maps.12245.
- Sirono (2017) Sirono, S.i., 2017. Heating of Porous Icy Dust Aggregates. ApJ 842, 11. doi:10.3847/1538-4357/aa7389.
- Spohn et al. (2015) Spohn, T., Knollenberg, J., Ball, A.J., Banaszkiewicz, M., Benkhoff, J., Grott, M., Grygorczuk, J., Hüttig, C., Hagermann, A., Kargl, G., Kaufmann, E., Kömle, N., Kührt, E., Kossacki, K.J., Marczewski, W., Pelivan, I., Schrödter, R., Seiferlin, K., 2015. Thermal and mechanical properties of the near-surface layers of comet 67P/Churyumov-Gerasimenko. Science 349. doi:10.1126/science.aab0464.
- Wada et al. (2007) Wada, K., Tanaka, H., Suyama, T., Kimura, H., Yamamoto, T., 2007. Numerical Simulation of Dust Aggregate Collisions. I. Compression and Disruption of Two-Dimensional Aggregates. ApJ 661, 320–333. doi:10.1086/514332.
- Wada et al. (2011) Wada, K., Tanaka, H., Suyama, T., Kimura, H., Yamamoto, T., 2011. The Rebound Condition of Dust Aggregates Revealed by Numerical Simulation of Their Collisions. ApJ 737, 36. doi:10.1088/0004-637X/737/1/36.
- Wahlberg Jansson et al. (2017) Wahlberg Jansson, K., Johansen, A., Bukhari Syed, M., Blum, J., 2017. The Role of Pebble Fragmentation in Planetesimal Formation. II. Numerical Simulations. ApJ 835, 109. doi:10.3847/1538-4357/835/1/109.
- Wurm and Blum (1998) Wurm, G., Blum, J., 1998. Experiments on Preplanetary Dust Aggregation. Icarus 132, 125–136. doi:10.1006/icar.1998.5891.
- Wurm and Haack (2009) Wurm, G., Haack, H., 2009. Outward transport of CAIs during FU-Orionis events. Meteoritics and Planetary Science 44, 689–699. doi:10.1111/j.1945-5100.2009.tb00763.x.
- Zsom et al. (2010) Zsom, A., Ormel, C.W., Güttler, C., Blum, J., Dullemond, C.P., 2010. The outcome of protoplanetary dust growth: pebbles, boulders, or planetesimals? II. Introducing the bouncing barrier. A&A 513, A57. doi:10.1051/0004-6361/200912976.