The galaxy – halo connection in low mass halos
Abstract
Properties of galaxies vary systematically with the mass of their parent dark matter halos. This basic galaxy – halo connection shows a fair amount of scatter whose origin is not fully understood. Here, we study how differences in the halo assembly history affect central galaxies in low mass ( ) halos at with the help of the MassiveFIRE suite of cosmological simulations. In contrast to previous works that tie galaxy properties to halo concentration and halo formation redshift, we focus on halo growth rate as a measure of assembly history. We find that, at fixed halo mass, faster growing halos tend to have lower stellar masses and higher SFRs per unit stellar mass but similar overall SFRs. We provide a simple explanation for these findings with the help of an analytic model that captures approximately the behavior of our hydrodynamical simulations. Specifically, among halos of a given current mass, quickly growing halos have lower stellar masses (and thus higher sSFRs) because they were less massive and had comparably lower cold gas masses and SFRs in the past than slowly growing halos. By combining these findings with estimates for the scatter of the halo growth rate, we show that variations in growth rate at fixed halo mass may largely explain the scatter of the stellar mass – halo mass relation. In contrast, halo growth variations likely play only a minor role in the scatter of the star forming sequence in low mass galaxies.
1 Introduction
The evolution of galaxies is tied to the evolution of the dark matter halos in which they reside (White & Rees, 1978). Empirical models developed over the past decade successfully utilize this galaxy – halo connection by linking galaxy properties and the masses of dark matter halos. For instance, sub-halo abundance matching (Kravtsov et al., 2004; Behroozi et al., 2013) and halo occupation distribution models (Peacock & Smith, 2000; Kravtsov et al., 2004), which parametrize galaxy properties by halo mass alone, correctly predict the clustering of galaxies of different masses and luminosities. However, mass is only one of many properties of dark matter halos, although arguably the most fundamental. In fact, at fixed halo mass, halo clustering has been shown to depend on halo properties related to the halo assembly such as halo formation time (Gao et al., 2005), halo concentration (Wechsler et al., 2006), or sub-halo fraction (Zhu et al., 2006). This result, known as assembly bias, raises the question of whether or not galaxy properties also depend on the detailed assembly histories of halos of a given mass.
Semi-analytic models (e.g., Croton et al. 2007), semi-empirical models (e.g., Moster et al. 2018), and hydrodynamical simulations (e.g., Faucher-Giguère et al. 2011; Feldmann & Mayer 2015; Feldmann et al. 2016, 2017; Chaves-Montero et al. 2016; Matthee et al. 2017) predict that stellar masses and specific star formation rates (sSFRs) of galaxies are correlated with the growth histories of their halos. Observationally, the situation is less clear, with some studies claiming detection (Wang et al., 2013; Tinker et al., 2017) while others do not (e.g., Blanton & Berlind 2007; Lin et al. 2016).
Ignoring this ‘galaxy assembly bias’ may systematically affect the modeling of the galaxy – halo connection (Zentner et al., 2014). Furthermore, galaxy assembly bias is potentially an important contributor to the observed scatter in galaxy scaling relations such as the stellar mass – halo mass relation (SHMR; e.g., Matthee et al. 2017) or the SFR – stellar mass relation (e.g., Rodríguez-Puebla et al. 2016). Hence, deciphering the physical origin of galaxy assembly bias is a critical part of understanding the galaxy – halo connection (Wechsler & Tinker, 2018). Empirical and semi-empirical models that link galactic growth and halo growth by construction (e.g., Hearin & Watson 2013; Mutch et al. 2013; Moster et al. 2018) have been instrumental in quantifying the impact of assembly bias, but have shed little light on the actual physics.
In principle, hydrodynamical simulations of galaxy formation are well suited to study galaxy assembly bias as they incorporate the relevant physical processes without explicitly assuming a galaxy–halo connection. However, previous approaches either suffered from small sample sizes (e.g., Feldmann & Mayer 2015; Romano-Díaz et al. 2017) or focused on galaxies in moderately massive halos ( ) in large cosmological volumes (e.g., Chaves-Montero et al. 2016; Matthee et al. 2017). Consequently, the importance of the halo growth history for low mass galaxies remains to be fully explored.
Fortunately, with the recent advent of large suites of zoom-in galaxy formation simulations it is now feasible to obtain large samples of well-resolved low mass galaxies. In this Letter we use the simulation suite MassiveFIRE (Feldmann et al., 2016, 2017), which is part of the Feedback in Realistic Environments (FIRE) project111see http://fire.northwestern.edu (Hopkins et al., 2014), to study the impact of the halo growth history on stellar masses and SFRs per unit stellar mass (sSFRs) of low mass, central galaxies at . In order to explore the underlying physical mechanisms, we supplement our hydrodynamical simulations with a simple analytical model that captures the basic behavior of the galaxies in the simulations.
This Letter is organized as follows. We describe our simulation suite and sample selection in section 2. In section 3, we explore whether or not stellar masses and sSFRs of the galaxies in our sample depend on halo growth rate. We introduce a simple analytic model to discuss our findings in section 4. We explain why halo growth rates affect galaxy masses and sSFRs in section 5 and present our main conclusions in section 6.
2 Methodology and Sample
The cosmological, hydrodynamical simulations presented in this Letter are part of the MassiveFIRE suite and are described in detail in Feldmann et al. (2016, 2017). In brief, we simulate the formation and growth of galaxies and dark matter halos down to in 18 distinct zoom-in regions in a (144 comoving Mpc)3 box. Baryonic (star and gas) and high-resolution dark matter particle masses are and , respectively. At this resolution, stellar masses, stellar mass profiles, and average SFRs are approximately converged (Hopkins et al., 2014, 2018; Ma et al., 2018). Gravitational softening lengths are 21 pc for star particles and 143 pc for dark matter. Softening is adaptive for gas particles with a minimum of 9 pc. We created initial conditions with MUSIC (Hahn & Abel, 2011) with , , , , and km s-1 Mpc-1 (Hinshaw et al., 2013). All simulations were run with the gravity-hydrodynamics code GIZMO in Pressure-energy Smoothed Particle Hydrodynamics (P-SPH) mode and use the original FIRE physics module222The recent update of the FIRE module (FIRE-2) does not significantly affect the stellar masses and SFRs of FIRE galaxies in halos (Hopkins et al., 2018)., which includes star formation in gravitationally bound gas clouds, stellar feedback (kinetic and radiative energy and momentum injections, as well as stellar mass loss) from supernova and young stars, chemical enrichment and transport, and gas heating and cooling, see Hopkins et al. (2014) for details.
Feldmann et al. (2016, 2017) analyzed the properties of massive ( ) central galaxies in MassiveFIRE. The present study targets the thousands of low mass central galaxies and their halos scattered throughout the zoom-in regions. Specifically, we select all isolated (i.e., non sub-) halos at with masses in the range that are not significantly polluted (less than 1% by mass) by lower resolution dark matter particles with the help of the AMIGA Halo Finder (AHF, Gill et al. 2004). Throughout this Letter, halo mass refers to the total mass within a virialized overdensity (Bryan & Norman, 1998). With the help of AHF, we trace the mass growth history of the most massive progenitor of each selected halo using 35 snapshots between and . We subsequently obtain the detailed halo growth histories for 1543 low mass, central galaxies. As a consequence of the zoom-in approach, many selected halos reside in the large-scale vicinity of a more massive halo, and halo growth histories of halos in low density environments are potentially underrepresented. To mitigate any arising bias, we explicitly control for the halo growth rate and minimize the use of growth-rate-averaged galaxy properties. Furthermore, we exclude central galaxies that were satellites at any time prior to (‘splashback’ galaxies).
The instantaneous growth rate of halos is often highly variable due to mergers, fly-bys, or a temporary tidal truncation. To arrive at a robust estimate of the halo growth rate, we adopt a strategy similar to the one described by Feldmann et al. (2016), i.e. we fit the assembly history of each given halo with a smooth, parametrized function. Different from Feldmann et al. (2016), we model the growth rate of individual halos as . Here, , is the linear growth factor normalized to 1 for z = 0, and is the average growth rate of halos of mass at redshift following van den Bosch et al. (2014). Adopting the average growth prescription by Neistein et al. (2006) results in minor quantitative, but no qualitative, changes of our results. The parameters and allow us to model different growth histories, including those with declining halo masses at late times. We compute and for all halos in our sample by fitting their growth histories to the parametrized form above via non-linear least squares over the redshift range. Throughout this Letter, denotes the growth rate of a halo relative to the average growth rate of halos of the same mass.
Halo concentrations at a redshift are taken from the halo catalogs generated by AHF. The half-mass (5%-mass) redshift corresponds to the first time that a halo assembled 50% (5%) of its maximum mass at .
Galaxy properties (stellar masses, cold gas masses, SFRs, and sSFRs) are obtained from all particles that lie within 10% of the virial radius of a given halo at . Contributions from identified satellite galaxies are excluded. Cold gas refers to gas with K. SFRs are averaged over the past dynamical time of the halo (450 Myr at independent of halo mass), which is somewhat longer (shorter) than the time scales probed by rest-frame ultra-violet (far infrared) light, e.g., Calzetti (2013). The SHMRs and SFR – stellar mass relations of dwarf galaxies in MassiveFIRE are consistent with previous FIRE literature (Sparre et al., 2017; Fitts et al., 2017; Ma et al., 2018).
3 Do galaxy properties depend on the halo growth rate?
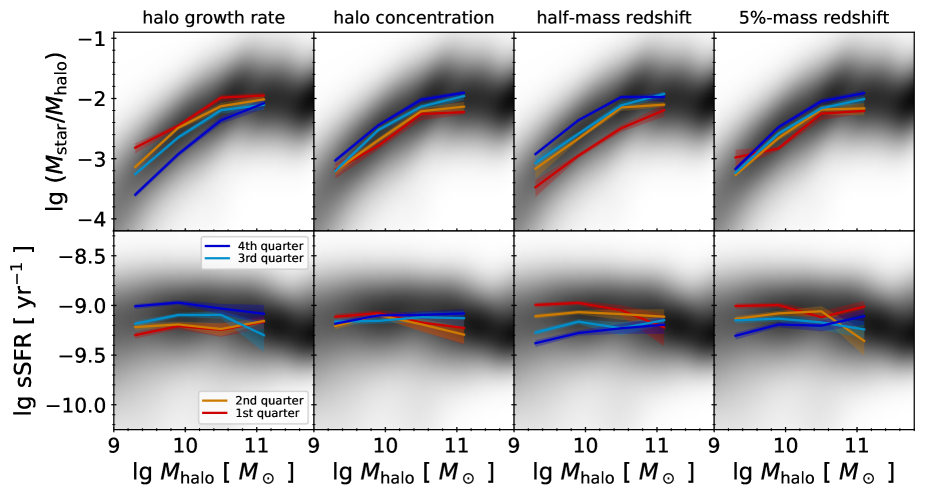 |
In order to address this question properly, we need to disentangle the effects of halo growth rate and halo mass. In Fig. 1 we show basic properties of low mass, central galaxies, their stellar mass fractions and sSFRs, as a function of halo mass. In agreement with previous estimates, stellar mass fractions increase with halo mass while sSFRs are approximately independent of halo mass (e.g., Behroozi et al. 2013). We then split our sample into four equal-sized bins for each of the following halo properties: halo growth rate, halo concentration, half-mass redshift and 5%-mass redshift. The colored lines in Fig. 1 show stellar mass fractions and sSFRs as function of halo mass in each of the four bins and for each of the halo properties.
Fig. 1 shows that, at fixed halo mass, halo growth rate correlates with the stellar masses and sSFRs of galaxies. Halos that grow faster at harbor galaxies with lower stellar masses and higher sSFRs at . Furthermore, at fixed halo mass, more concentrated halos and halos with earlier formation time tend to contain galaxies with higher stellar masses and lower sSFRs. However, these latter trends are not always as strong as the scalings with halo growth rate. Given that gas cooling and stellar feedback affect the density profile of halos, we expect a stronger dependence on concentration if the (observationally inaccessible) concentration of the same halos in dark-matter-only simulations is used as a predicting variable (Fitts et al., 2017). While Fig. 1 only shows results for , the trends are qualitatively similar for any . Hence, at fixed halo mass, halo growth rate appears to be a fundamental predictor of stellar mass and sSFRs, arguably even more so than halo concentration and halo formation redshift. We stress that our findings apply only to low mass halos and may not hold for galaxies in slowly-cooling, massive ( ) halos.
4 Quantifying and modeling the role of the halo growth rate
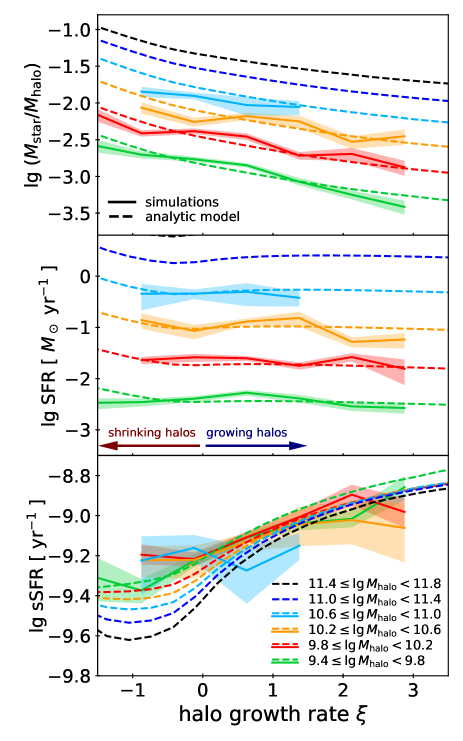 |
As argued in the previous section, stellar masses and sSFRs vary with halo growth rate in a systematic and monotonic way. Fig. 2 sheds additional light on this result. Here, we show stellar mass fractions, SFRs, and sSFRs for the galaxies in our sample as a function of halo growth rate. Interestingly, while stellar masses depend on both halo growth rate and mass, SFRs are essentially independent of halo growth rate at fixed halo mass. In contrast, sSFRs scale with halo growth rate but only weakly with halo mass over the range.
We fit stellar mass, SFR, and sSFR as functions of halo accretion rate and halo (or stellar) mass with the help of the publicly available VGAM R package (Yee, 2015). In order to deal properly with galaxies with zero star formation, we use zero-inflated negative binomials as family functions when fitting count-based SFRs and sSFRs (Feldmann, 2017). The average SFRs and sSFRs reported below exclude non-star forming galaxies corresponding to the zero-inflated component. For consistency, we also use negative binomials as family functions when fitting stellar masses (interpreted as count data using the number of stellar particles in the galaxy).
Average stellar masses, SFRs, and sSFRs of low mass, central galaxies show the following scaling behavior:
The scaling of the average sSFRs with halo growth rate is somewhat shallower than expected from the scaling exponents for average stellar masses and SFRs at fixed halo mass. Positive correlations between (past-averaged) SFRs and current stellar masses as well as the considerable overall scatter, result in a reduced correlation for the sSFR.
In order to explore the origin of the dependence of stellar masses and sSFRs on halo growth rate, we make use of a simple analytic model (Feldmann in prep). It is a one-zone model with two free parameter functions, each potentially depending on halo mass and cosmic time but not explicitly on any other halo or galaxy property. The first free parameter is the cold gas depletion time , which specifies how quickly the galaxy converts cold gas into stars (). The second parameter, , is the amount of cold baryons (stars and cold gas) in the galaxy relative to the amount of baryons in the halo (). Stellar masses of low mass galaxies are predominantly build by in-situ star formation (e.g., Behroozi et al. 2013; Anglés-Alcázar et al. 2017), and, hence, we will ignore galaxy mergers in the following, simplified discussion.
Combining the two previous equations, we arrive at an ordinary differential equation for the stellar mass: , where is the gas return fraction in the instantaneous recycling approximation. For a given halo growth history, , the parameters and can be interpreted as functions of only time and the differential equation above can be solved analytically to obtain and . This simple model predicts stellar mass and SFR histories for any halo history provided that the functions and are known.
We adopt simple parametrized forms for and and determine the parameters from a maximum a posteriori estimation with non-informative priors based on our galaxy sample. This calibration constrains how and depend on halo mass and cosmic time. Importantly, the model does not introduce an explicit dependence on halo growth rate. Our model calibration results in cold gas depletion times of about 1 Gyr at , only weakly dependent on halo mass, but moderately increasing with decreasing redshift, in qualitative agreement with observations (Genzel et al., 2015). The cold baryon fraction varies with halo mass (but is assumed to be redshift independent), peaking at of the universal baryon fraction in halos.
Dashed lines in Fig. 2 show the model predictions with and calibrated as described above. The simple model matches the results of our hydrodynamical simulations quite well. In particular, it shows that sSFRs of low mass, central galaxies correlate with the growth rate of their halos, while stellar masses anti-correlate with halo growth rate, and SFRs scale primarily with halo mass but not with halo growth rate.
5 Why do galaxy properties depend on halo growth rate?
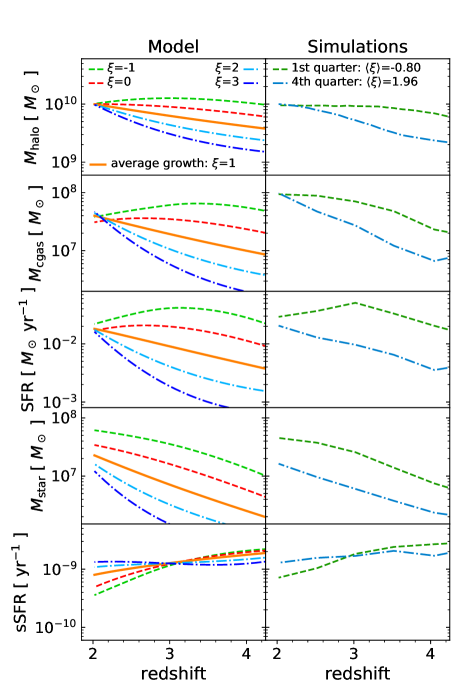 |
Fig. 3 offers a straightforward explanation for the results presented in this Letter. Halos that grow more quickly near were naturally less massive at earlier times than halos that grow more slowly near . At , less massive halos contain less cold gas. The scaling is super-linear at low halo masses due to efficient gas ejections via stellar feedback (e.g., Muratov et al. 2015; Anglés-Alcázar et al. 2017) and decreased gas accretion resulting from photo-ionization suppression (e.g., Okamoto et al. 2008; Faucher-Giguère et al. 2011; Fitts et al. 2017). Lower cold gas masses at earlier times imply lower SFRs in the past. Hence, the stellar mass (the integral of the SFR) near tends to be lower in more quickly growing halos. Consequently, sSFRs at will be higher for halos that grow more quickly near , and they will be lower in more slowly growing halos.
Our results provide a physical explanation for the ansatz of conditional abundance matching (CAM) models which assume that, at a given halo mass, sSFRs of galaxies depend on halo growth history (Hearin & Watson, 2013). Given the findings presented in section 3, we propose that CAMs also explore the use of halo growth rate as an alternative measure of halo growth history in addition to halo concentration and formation time.
The SFR at is only weakly dependent on halo growth rate in halos of the same mass. The explanation is rather simple in the context of our model. Halos with the same mass at have (by virtue of our model) also the same mass of cold baryons and the same cold gas depletion time. As cold gas, and not stars, makes up most of the cold baryons in low mass galaxies, halos of the same mass have similar cold gas masses and, hence, SFRs. In contrast, the cold gas-to-stellar mass ratio, , varies with halo growth rate. Specifically, at fixed halo mass, more quickly growing halos will have a larger than more slowly growing halos.
For low and negative halo growth rates the picture becomes slightly more complex. On the one hand, the much lower in halos with very low growth rates results in lower cold gas masses and SFRs. On the other hand, galaxies in shrinking halos can have cold baryon masses that are much larger than those of growing halos, even at fixed halo mass, because a reduction in halo mass (via e.g., tidal stripping) does not necessarily result in a similar reduction in cold baryonic mass. Hence, the model predicts that galaxies in shrinking halos have larger absolute cold gas masses and SFRs than galaxies in growing halos of the same final mass, see Fig. 2.
6 Conclusions
The dependence of stellar masses and sSFRs on halo growth rate may contribute to the observed scatter in galaxy scaling relations. For instance, Rodríguez-Puebla et al. (2016) suggested that the scatter in SFR at fixed stellar mass could be explained this way. Observations constrain this scatter to be 0.2-0.4 dex over a large range of masses and redshifts (e.g., Schreiber et al. 2015).
Given the scalings presented in section 4, we expect that SFRs change by dex per unit change of at fixed stellar mass. We measured the scatter of the halo growth rate both in our sample (at ) and in collisionless, cosmological volume simulations (at and ) finding for halos in the mass range. Hence, it appears that variations in halo growth rate cannot account for more than dex of scatter in the star forming sequence. In fact, in our simulations, much of the scatter of the star forming sequence arises from galaxy related processes that operate on time-scales that are shorter than the dynamical time of the halo, such as fluctuations of the gas accretion rate onto galaxies and frequent, but short-lived, bursts of star formation (Sparre et al., 2017; Feldmann et al., 2017; Faucher-Giguère, 2018).
Combining with the scaling of the average stellar mass with , see section 4, we predict dex of scatter in stellar mass at fixed halo mass. This predicted scatter matches approximately the scatter in our sample at ( dex at and dex at ). The overall amount of scatter and its increase with decreasing halo mass in dwarf galaxy halos is consistent with results of previous hydrodynamical simulations (Wang et al., 2015; Pillepich et al., 2018; Wechsler & Tinker, 2018). Empirically, the scatter evolves only weakly with redshift (Behroozi et al., 2018), reaching dex in moderately massive to very massive halos at (from to galaxy clusters, e.g., Zu & Mandelbaum 2015; Kravtsov et al. 2018). Variations in the halo growth histories may thus explain a large fraction of the scatter in stellar mass at fixed halo mass in low mass, central galaxies.
References
- (1)
- Anglés-Alcázar et al. (2017) Anglés-Alcázar, D., Faucher-Giguère, C.-A., Kereš, D., et al. 2017, Mon. Not. R. Astron. Soc., 470, 4698, doi: 10.1093/mnras/stx1517
- Behroozi et al. (2018) Behroozi, P., Wechsler, R., Hearin, A., & Conroy, C. 2018, 000. https://arxiv.org/abs/1806.07893
- Behroozi et al. (2013) Behroozi, P. S., Wechsler, R. H., & Conroy, C. 2013, Astrophys. J., 770, 57, doi: 10.1088/0004-637X/770/1/57
- Blanton & Berlind (2007) Blanton, M. R., & Berlind, A. A. 2007, Astrophys. J., 664, 791, doi: 10.1086/512478
- Bryan & Norman (1998) Bryan, G. L., & Norman, M. L. 1998, Astrophys. J., 495, 80, doi: 10.1086/305262
- Calzetti (2013) Calzetti, D. 2013, in Secul. Evol. Galaxies, ed. J. Falcon-Barroso & J. H. Knapen (Cambridge University Press), 419. http://arxiv.org/abs/1208.2997
- Chaves-Montero et al. (2016) Chaves-Montero, J., Angulo, R. E., Schaye, J., et al. 2016, Mon. Not. R. Astron. Soc., 460, 3100, doi: 10.1093/mnras/stw1225
- Croton et al. (2007) Croton, D. J., Gao, L., & White, S. D. M. 2007, Mon. Not. R. Astron. Soc., 374, 1303, doi: 10.1111/j.1365-2966.2006.11230.x
- Faucher-Giguère (2018) Faucher-Giguère, C.-A. 2018, Mon. Not. R. Astron. Soc., 473, 3717, doi: 10.1093/mnras/stx2595
- Faucher-Giguère et al. (2011) Faucher-Giguère, C.-A., Kereš, D., & Ma, C.-P. 2011, Mon. Not. R. Astron. Soc., 417, 2982, doi: 10.1111/j.1365-2966.2011.19457.x
- Feldmann (2017) Feldmann, R. 2017, Mon. Not. R. Astron. Soc. Lett., 470, L59, doi: 10.1093/mnrasl/slx073
- Feldmann et al. (2016) Feldmann, R., Hopkins, P. F., Quataert, E., Faucher-Giguère, C.-A., & Kereš, D. 2016, Mon. Not. R. Astron. Soc. Lett., 458, L14, doi: 10.1093/mnrasl/slw014
- Feldmann & Mayer (2015) Feldmann, R., & Mayer, L. 2015, Mon. Not. R. Astron. Soc., 446, 1939, doi: 10.1093/mnras/stu2207
- Feldmann et al. (2017) Feldmann, R., Quataert, E., Hopkins, P. F., Faucher-Giguère, C.-A., & Kereš, D. 2017, Mon. Not. R. Astron. Soc., 470, 1050, doi: 10.1093/mnras/stx1120
- Fitts et al. (2017) Fitts, A., Boylan-Kolchin, M., Elbert, O. D., et al. 2017, Mon. Not. R. Astron. Soc., 471, 3547, doi: 10.1093/mnras/stx1757
- Gao et al. (2005) Gao, L., Springel, V., & White, S. D. M. 2005, Mon. Not. R. Astron. Soc. Lett., 363, 66, doi: 10.1111/j.1745-3933.2005.00084.x
- Genzel et al. (2015) Genzel, R., Tacconi, L. J., Lutz, D., et al. 2015, Astrophys. J., 800, 20, doi: 10.1088/0004-637X/800/1/20
- Gill et al. (2004) Gill, S. P. D., Knebe, A., & Gibson, B. K. 2004, Mon. Not. R. Astron. Soc., 351, 399, doi: 10.1111/j.1365-2966.2004.07786.x
- Hahn & Abel (2011) Hahn, O., & Abel, T. 2011, Mon. Not. R. Astron. Soc., 415, 2101, doi: 10.1111/j.1365-2966.2011.18820.x
- Hearin & Watson (2013) Hearin, a. P., & Watson, D. F. 2013, Mon. Not. R. Astron. Soc., 435, 1313, doi: 10.1093/mnras/stt1374
- Hinshaw et al. (2013) Hinshaw, G., Larson, D., Komatsu, E., et al. 2013, Astrophys. J. Suppl. Ser., 208, 19, doi: 10.1088/0067-0049/208/2/19
- Hopkins et al. (2014) Hopkins, P. F., Kere, D., Onorbe, J., et al. 2014, Mon. Not. R. Astron. Soc., 445, 581, doi: 10.1093/mnras/stu1738
- Hopkins et al. (2018) Hopkins, P. F., Wetzel, A., Kereš, D., et al. 2018, Mon. Not. R. Astron. Soc., 480, 800, doi: 10.1093/mnras/sty1690
- Kravtsov et al. (2004) Kravtsov, A. V., Berlind, A. A., Wechsler, R. H., et al. 2004, Astrophys. J., 609, 35, doi: 10.1086/420959
- Kravtsov et al. (2018) Kravtsov, A. V., Vikhlinin, A. A., & Meshcheryakov, A. V. 2018, Astron. Lett., 44, 8, doi: 10.1134/S1063773717120015
- Lin et al. (2016) Lin, Y.-T., Mandelbaum, R., Huang, Y.-H., et al. 2016, Astrophys. J., 819, 119, doi: 10.3847/0004-637X/819/2/119
- Ma et al. (2018) Ma, X., Hopkins, P. F., Garrison-Kimmel, S., et al. 2018, Mon. Not. R. Astron. Soc., 478, 1694, doi: 10.1093/mnras/sty1024
- Matthee et al. (2017) Matthee, J., Schaye, J., Crain, R. A., et al. 2017, Mon. Not. R. Astron. Soc., 465, 2381, doi: 10.1093/mnras/stw2884
- Moster et al. (2018) Moster, B. P., Naab, T., & White, S. D. M. 2018, Mon. Not. R. Astron. Soc., 477, 1822, doi: 10.1093/mnras/sty655
- Muratov et al. (2015) Muratov, A. L., Kereš, D., Faucher-Giguère, C.-A., et al. 2015, Mon. Not. R. Astron. Soc., 454, 2691, doi: 10.1093/mnras/stv2126
- Mutch et al. (2013) Mutch, S. J., Croton, D. J., & Poole, G. B. 2013, Mon. Not. R. Astron. Soc., 435, 2445, doi: 10.1093/mnras/stt1453
- Neistein et al. (2006) Neistein, E., van den Bosch, F. C., & Dekel, A. 2006, Mon. Not. R. Astron. Soc., 372, 933, doi: 10.1111/j.1365-2966.2006.10918.x
- Okamoto et al. (2008) Okamoto, T., Gao, L., & Theuns, T. 2008, Mon. Not. R. Astron. Soc., 390, 10, doi: 10.1111/j.1365-2966.2008.13830.x
- Peacock & Smith (2000) Peacock, J. A., & Smith, R. E. 2000, Mon. Not. R. Astron. Soc., 318, 1144, doi: 10.1046/j.1365-8711.2000.03779.x
- Pillepich et al. (2018) Pillepich, A., Springel, V., Nelson, D., et al. 2018, Mon. Not. R. Astron. Soc., 473, 4077, doi: 10.1093/mnras/stx2656
- Rodríguez-Puebla et al. (2016) Rodríguez-Puebla, A., Primack, J. R., Behroozi, P., & Faber, S. M. 2016, Mon. Not. R. Astron. Soc., 455, 2592, doi: 10.1093/mnras/stv2513
- Romano-Díaz et al. (2017) Romano-Díaz, E., Garaldi, E., Borzyszkowski, M., & Porciani, C. 2017, Mon. Not. R. Astron. Soc., 469, 1809, doi: 10.1093/mnras/stx878
- Schreiber et al. (2015) Schreiber, C., Pannella, M., Elbaz, D., et al. 2015, Astron. Astrophys., 575, A74, doi: 10.1051/0004-6361/201425017
- Sparre et al. (2017) Sparre, M., Hayward, C. C., Feldmann, R., et al. 2017, Mon. Not. R. Astron. Soc., 466, 88, doi: 10.1093/mnras/stw3011
- Tinker et al. (2017) Tinker, J. L., Wetzel, A. R., Conroy, C., & Mao, Y.-Y. 2017, Mon. Not. R. Astron. Soc., 472, 2504, doi: 10.1093/mnras/stx2066
- van den Bosch et al. (2014) van den Bosch, F. C., Jiang, F., Hearin, A., et al. 2014, Mon. Not. R. Astron. Soc., 445, 1713, doi: 10.1093/mnras/stu1872
- Wang et al. (2015) Wang, L., Dutton, A. A., Stinson, G. S., et al. 2015, Mon. Not. R. Astron. Soc., 454, 83, doi: 10.1093/mnras/stv1937
- Wang et al. (2013) Wang, L., Weinmann, S. M., De Lucia, G., & Yang, X. 2013, Mon. Not. R. Astron. Soc., 433, 515, doi: 10.1093/mnras/stt743
- Wechsler & Tinker (2018) Wechsler, R. H., & Tinker, J. L. 2018, Annu. Rev. Astron. Astrophys., 56, 435, doi: 10.1146/annurev-astro-081817-051756
- Wechsler et al. (2006) Wechsler, R. H., Zentner, A. R., Bullock, J. S., Kravtsov, A. V., & Allgood, B. 2006, Astrophys. J., 652, 71, doi: 10.1086/507120
- White & Rees (1978) White, S. D. M., & Rees, M. J. 1978, Mon. Not. R. Astron. Soc., 183, 341, doi: 10.1016/j.foodchem.2010.01.035
- Yee (2015) Yee, T. W. 2015, Vector Generalized Linear and Additive Models, Springer Series in Statistics (New York, NY: Springer New York), doi: 10.1007/978-1-4939-2818-7. http://link.springer.com/10.1007/978-1-4939-2818-7
- Zentner et al. (2014) Zentner, a. R., Hearin, a. P., & van den Bosch, F. C. 2014, Mon. Not. R. Astron. Soc., 443, 3044, doi: 10.1093/mnras/stu1383
- Zhu et al. (2006) Zhu, G., Zheng, Z., Lin, W. P., et al. 2006, Astrophys. J., 639, L5, doi: 10.1086/501501
- Zu & Mandelbaum (2015) Zu, Y., & Mandelbaum, R. 2015, Mon. Not. R. Astron. Soc., 454, 1161, doi: 10.1093/mnras/stv2062