DNP-NMR of surface hydrogen on silicon microparticles
Abstract
Dynamic nuclear polarization (DNP) enhanced nuclear magnetic resonance (NMR) offers a promising route to studying local atomic environments at the surface of both crystalline and amorphous materials. We take advantage of unpaired electrons due to defects close to the surface of the silicon microparticles to hyperpolarize adjacent 1H nuclei. At 3.3 T and 4.2 K, we observe the presence of two proton peaks, each with a linewidth on the order of 5 kHz. Echo experiments indicate a homogeneous linewidth of Hz for both peaks, indicative of a sparse distribution of protons in both environments. The downfield peak at 10 ppm lies within the typical chemical shift range for proton NMR, and was found to be relatively stable over repeated measurements. The upfield peak was found to vary in position between -19 and -37 ppm, well outside the range of typical proton NMR shifts, and indicative of a high-degree of chemical shielding. The upfield peak was also found to vary significantly in intensity across different experimental runs, suggesting a weakly-bound species. These results suggest that the hydrogen is located in two distinct microscopic environments on the surface of these Si particles.
keywords:
NMR, DNP, nuclear magnetic resonance, dynamic nuclear polarization, silicon particles, surface1 Introduction
Studying surfaces with nuclear magnetic resonance (NMR) has been a goal of the magnetic resonance community for many years because it can reveal the atomic environments of crystalline or amorphous materials. However, the lack of sensitivity makes this notoriously difficult. Dynamic nuclear polarization (DNP) can dramatically enhance the NMR signal and has recently been shown to enable surface-NMR. DNP of surfaces very often involves wetting of the surface of the particles using exogenous radicals dissolved in a solvent. The radicals are used as the source for DNP enhancement of either the surface of the particles via cross polarization (CP)[1] from 1H nuclei in the solvent to the surface heteronuclei, or directly to the bulk heteronuclei. [2, 3, 4, 5, 6, 7, 8, 9, 10, 11, 12, 13, 14, 15, 16, 17] These techniques are most commonly combined with magic angle spinning (MAS) at 100 K for higher resolution solid-state NMR spectra.
Several groups have also used endogenous paramagnetic centers inside the studied material as the DNP enhancement source.[18, 19, 20, 21, 22, 23, 24, 25, 26] With this technique, defects that are intrinsic to the microparticles, or metals, are used as a source of enhancement, thus not altering the surface with solvents or exogenous radicals - potentially avoiding surface degradation or adding nuclei to the sample. Though limited to a smaller range of material systems, this type of DNP has been explored with NV-centers in diamonds,[22, 23, 24, 25] as well as in battery materials,[20] other doped crystalline materials,[19] biological samples, [27] and in silicon particles.[21, 26, 28, 29, 18, 30]
Silicon nano- and microparticles attract much interest in the scientific community because of their bio-compatibility and their varied potential uses. For example, they can be used for biomedical magnetic resonance imaging, for batteries, photovoltaics and other uses. [29, 31, 28, 32, 33, 34, 35, 36] However, these particles are prone to degrade via exposure to air and humidity. Water molecules are known to chemisorb onto the surface of silicon, resulting in oxidized surface layer consisting of Si-H and Si-OH groups, through dissociation of water molecules at the sites of dangling bonds [37, 38, 39, 40] This oxidation can result in degradation of the silicon surface and affect the electronic and material properties. [41, 42, 43] It is therefore important to develop tools to study surface structure and chemistry in these systems.
Silicon particles are known to contain localized unpaired electrons at the interface between the silicon and the silicon-oxide layers.[44, 45, 46, 30, 47, 48, 49] At room temperature these Si−H and Si−OH species are able to move around the surface to adjacent unoccupied dangling bonds, if any. These systems also exhibit a significant degree of heterogeneity based on the conditions under which the host materials were grown, the methods by which the powders were prepared and sorted, and the storage conditions. For example the density of dangling bond defects at the Si/SiO2 interface can vary by over 2 orders of magnitude, significantly changing the efficiency of DNP experiments.[47, 48, 49] The presence of other dopants and defects can also result in DNP variations. [28] This can be a challenge in using DNP-NMR for materials characterization.
Here, we study the surface of silicon microparticles by detecting 1H nuclei adjacent to the surface defects. [50, 51, 52, 53, 54, 55, 56, 57, 58, 59, 60, 61] At 3.3 T and 4.2 K, we observe the presence of two proton peaks each with a linewidth on the order of 5 kHz, indicating two distinct microscopic surface environments. We characterize the NMR lineshapes, the DNP spectra and the characteristic relaxation times of the observed spectra. MW frequency modulation was found to result in a large increase in DNP enhancement for both peaks.
2 Results and Discussion
The DNP experiments were performed at a field of 3.3 T, corresponding to an electron Larmor frequency of 94 GHz and a 1H Larmor frequency of 142 MHz. The setup was equipped with a Janis continuous-flow NMR cryostat, enabling experiments at 4.2K. The NMR pulses and detection were controlled with a Bruker Avance AQX spectrometer. The MW irradiation was produced via a previously described millimeter wave source. [30, 62]
Powdered silicon particles (nominally 1-5µm poly crystalline silicon) were bought from Alfa Aesar, and were used as is. The powder was stored for many years in the original packaging, under ambient conditions before use. Several samples were made from the same batch, listed A-D. Sample A was cooled down to 4 K twice for two sets of experiments, listed as A1 and A2. A2 was measured 17 days after sample A1. For each sample, the powder was tightly packed into a glass capillary and flame sealed to prevent further contact with ambient humidity, but air and ambient humidity were not removed before sealing.
The 1H signal was collected via solid echo detection, [63] [64] with a /2=0.5 µs excitation (approximately 500 kHz RF power) and an echo delay of =200 µs. The echo time was used to minimize contributions from the probe background. No change was observed in the line-widths of the DNP-enhanced peaks using echo times of 30 s and 200 s (see Supporting Information). Two step phase cycling was used to subtract the free induction decay signal from the second /2 pulse. All experiments employed only 2 scans, unless otherwise noted. All experiments began with a train of pulses used to saturate the 1H nuclei. In all cases the MW irradiation was turned off during NMR signal acquisition.
2.1 NMR Lineshapes
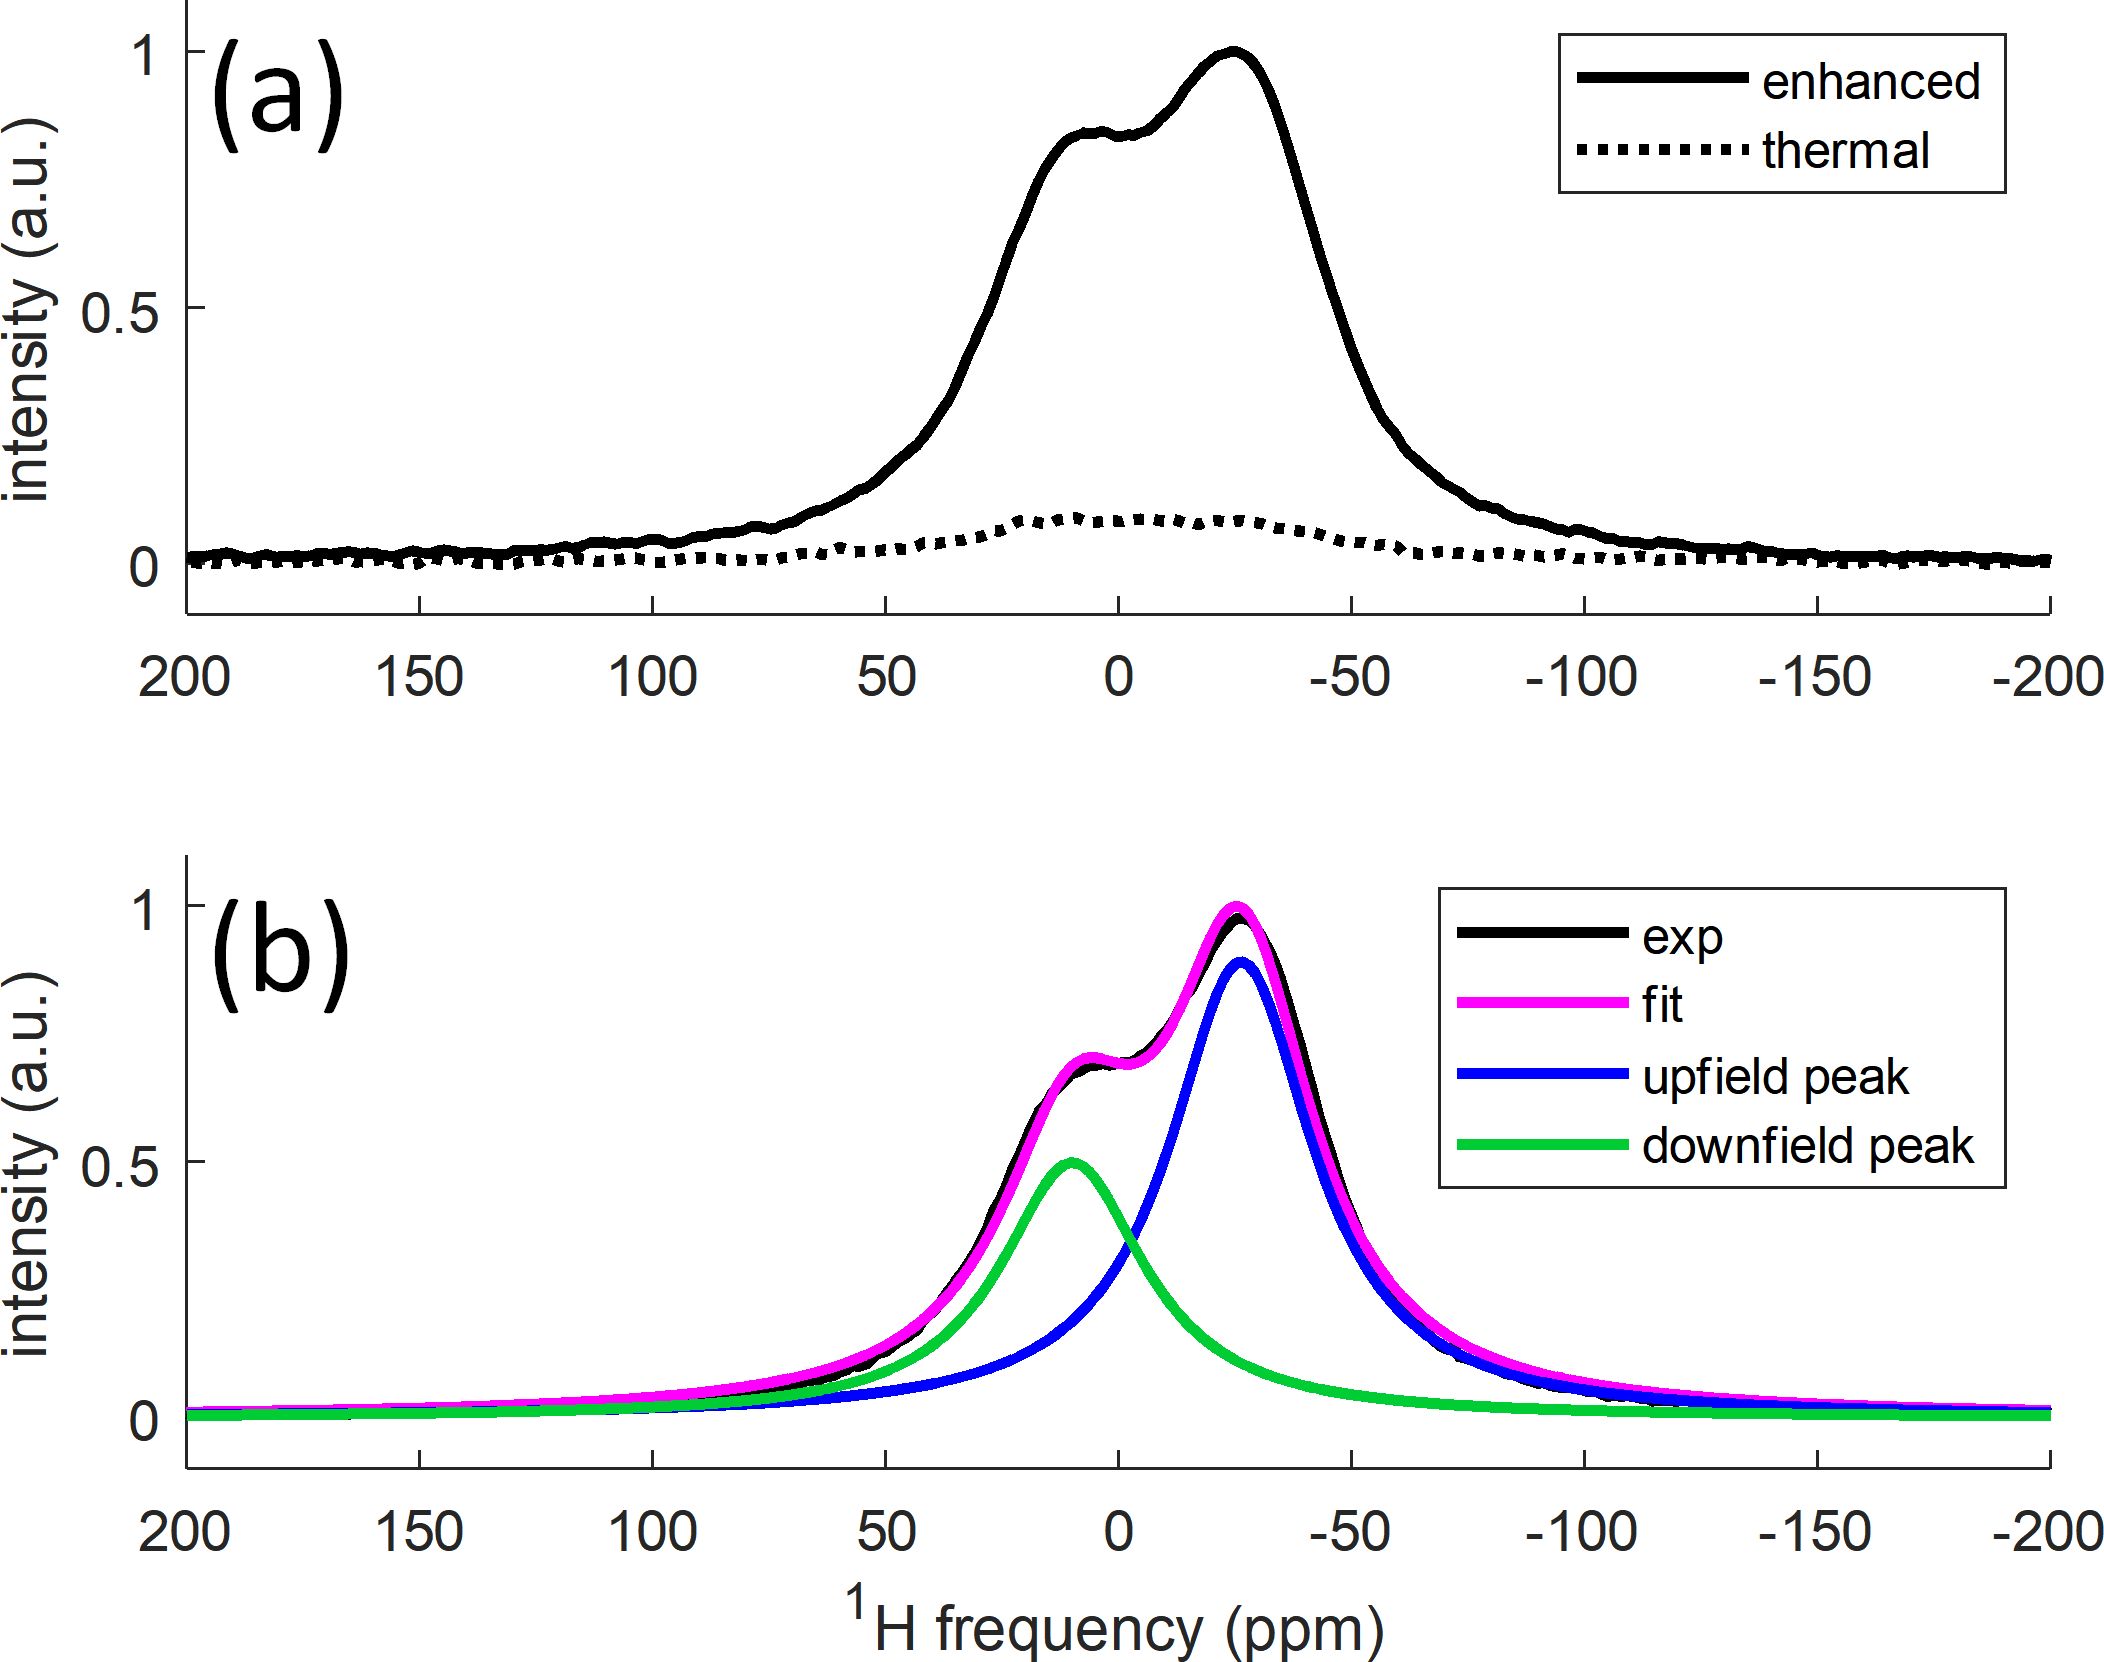
Figure 1a, shows the thermal (no microwave irradiation) and hyperpolarized 1H spectrum, obtained with microwave (MW) irradiation at the maximum of the DNP spectrum for 120 s, on Sample A1. At this MW frequency, the enhancement of the 1H nuclei is about 15, though it depends on the MW frequency, the MW irradiation time, the sample, and which NMR peak is considered. In this work, we define the enhancement as the ratio of the integrated intensity of each resonance, with and without MW irradiation.
Two peaks are observed in the spectrum, an “upfield peak” at -27 ppm and a “downfield peak” at 10 ppm. (Upfield means lower ppm values and downfield means higher ppm values). The referencing of the spectrum was performed in a separate experiment where we measured the Si powder and a D2O sample (containing residual H2O) at the same time. This experiment was used to assign the downfield peak to be at 10 ppm. Figure 1b shows that the two lines can be fit using Lorenztian functions, with identical full widths at half of the maximum peak intensity (FWHM) of 5.4 kHz. The frequency of the downfield peak falls within the standard chemical shift range for 1H nuclei (and fits with -OH protons), whereas the upfield peak is highly shifted to negative ppm values.
In principle, this large shift may be a paramagnetic shifts (such as Fermi-contact, pseudocontact or Knight Shift) due to interactions of the defect unpaired electrons with the 1H nuclei that make up the upfield peak, or due to bulk magnetic susceptibility (BMS) effects. [65, 66, 67, 68] Paramagnetic shifts are expected to be temperature dependent due to the interaction with the average electron polarization. To test for paramagnetic contributions to the shift, we measured NMR spectra from the sample as a function of temperature in the range between 4 K and 40 K, and observed that the separation between the peaks did not change with temperature in this range, ruling out such a paramagnetic contribution (see Supporting Information). Paramagnetic and BMS shifts are also orientation dependent, and would cause severe line broadening in powdered samples, which was not observed.
The observed shift may also be due to increased shielding of the 1H nuclei contributing to the upfield peak. Metal hydride systems (M-H, where M is a metal), have been known to have 1H chemical shifts in the range of 0 to -25 ppm, or even lower, due to large spin-orbit couplings or ring-currents within the d-orbitals of the heavy metal and transition metal atoms. [69] Negative 1H chemical shifts are also expected in organic molecules where ring currents cause strong shielding of the 1H nuclei.[70] While we do not understand the origin of the shifted peak, we speculate that it results from impurities at the surface that produce such a shielded environment.
Note that in previous experiments on the same powder only a single resonance was observed, with a FWHM of 6.2 kHz.[30] In that work, however, after wetting the same with 20:80 H2O:D2O, the NMR line it had an additional shoulder indicating the appearance of a second upfield resonance. The separation between the two resonances was found to be 34 ppm, similar to the separation we see in this work.
2.2 Intensity Variations
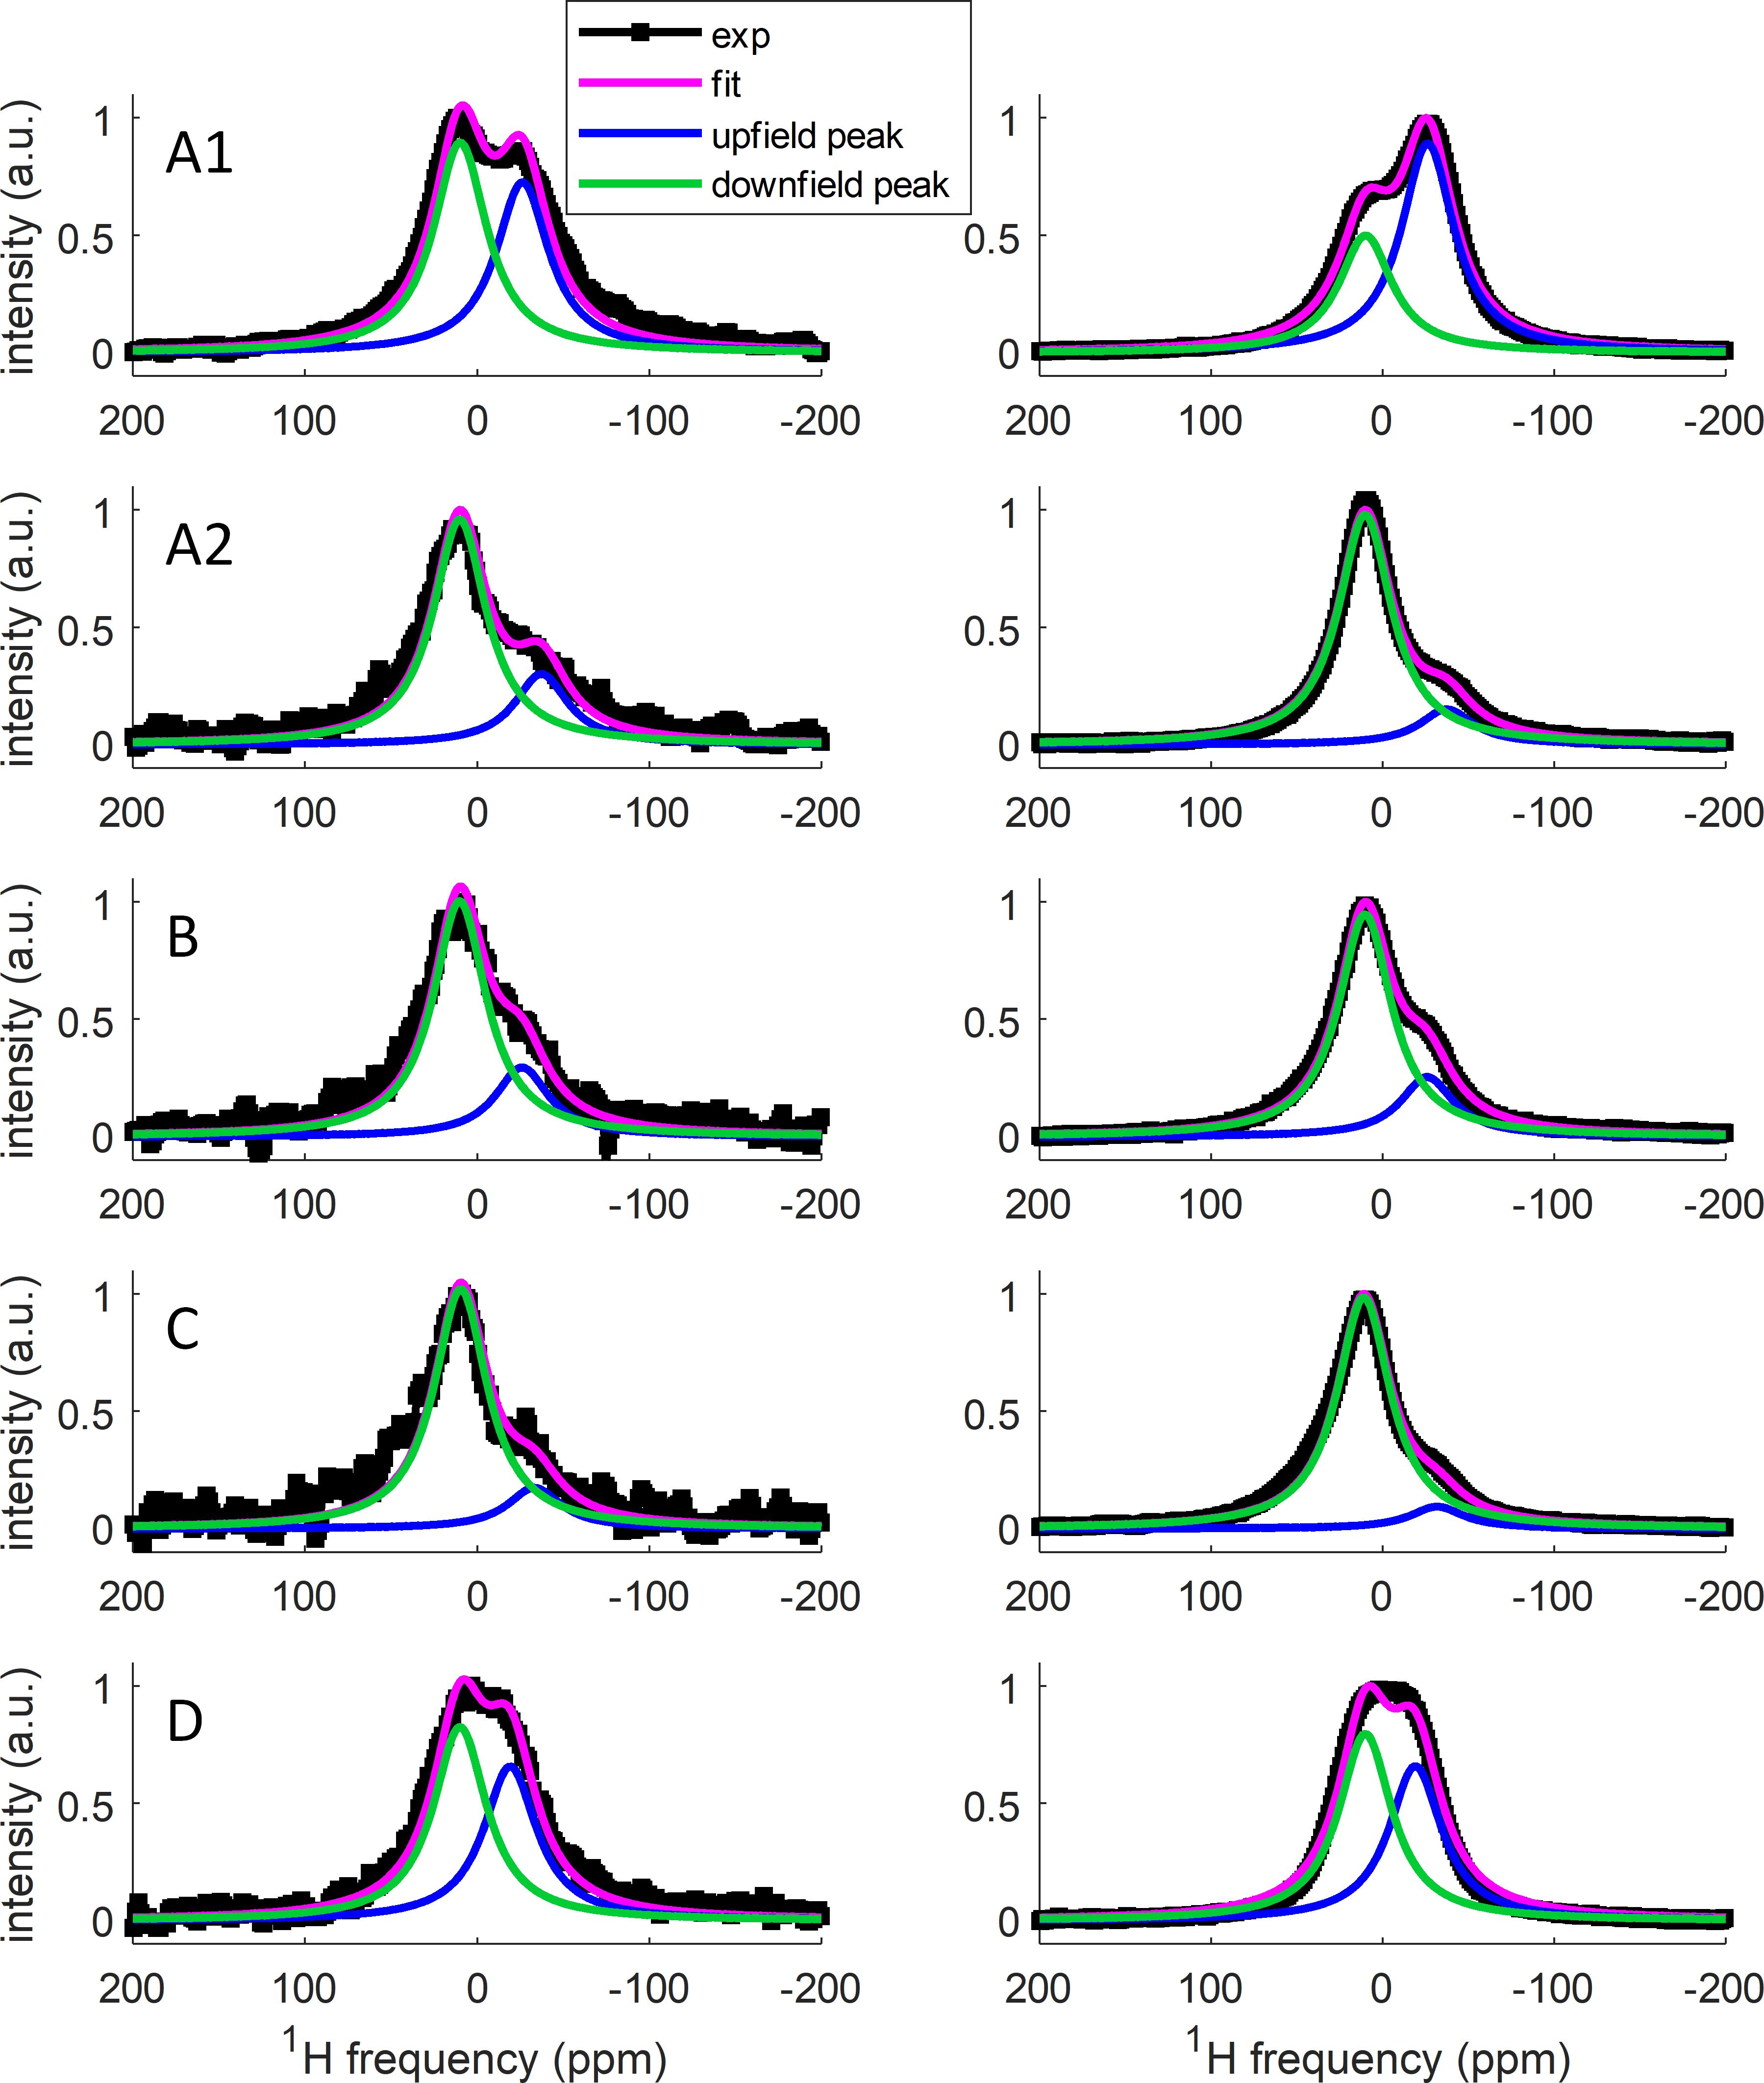
In figure 2 we plot the thermal (MW-off) and hyperpolarized (MW-on) 1H spectra for all the samples measured. The 1H spectra were again fit to two Lorentzian lines as described above. More details on the fitting can be found in the Materials and Methods Section. The intensity of the downfield peak was observed to be fairly consistent across all measurements, whereas the intensity of the upfield peak varied across different experiments. The linewidth of both peaks was found to remain the same across all the experiments. The reason for the change in intensity is not clear, but suggests that the protons making up the upfield peak may be less tightly bound to the surface, resulting in a varying number of protons measured at the upfield site. The variations could also result from differences in the rate at which the system is cooled down from room temperature to 4 K.
In addition to changes in intensity, the separation between the two peaks was observed to vary between 29 ppm and 47 ppm in different experiments, potentially due to changes to the shielding experienced. Small variations were observed in the absolute frequencies of the two peaks in different experiments - likely due to slight variations in the sample positioning in the coil. The homogeneity of the magnet used in the DNP experiment is on the order of 1 ppm as there are no room temperature shims in the bore. All shifts/assignments have thus been rounded to the nearest integer ppm values. As mentioned above the referencing of the spectra was performed in a different experiment. Since the downfield peak was observed to be relatively stable, we have assumed that this peak is at 10 ppm in all the experiments. The separation between the peaks was then used to assign the shift for the upfield peak.
2.3 Linewidth
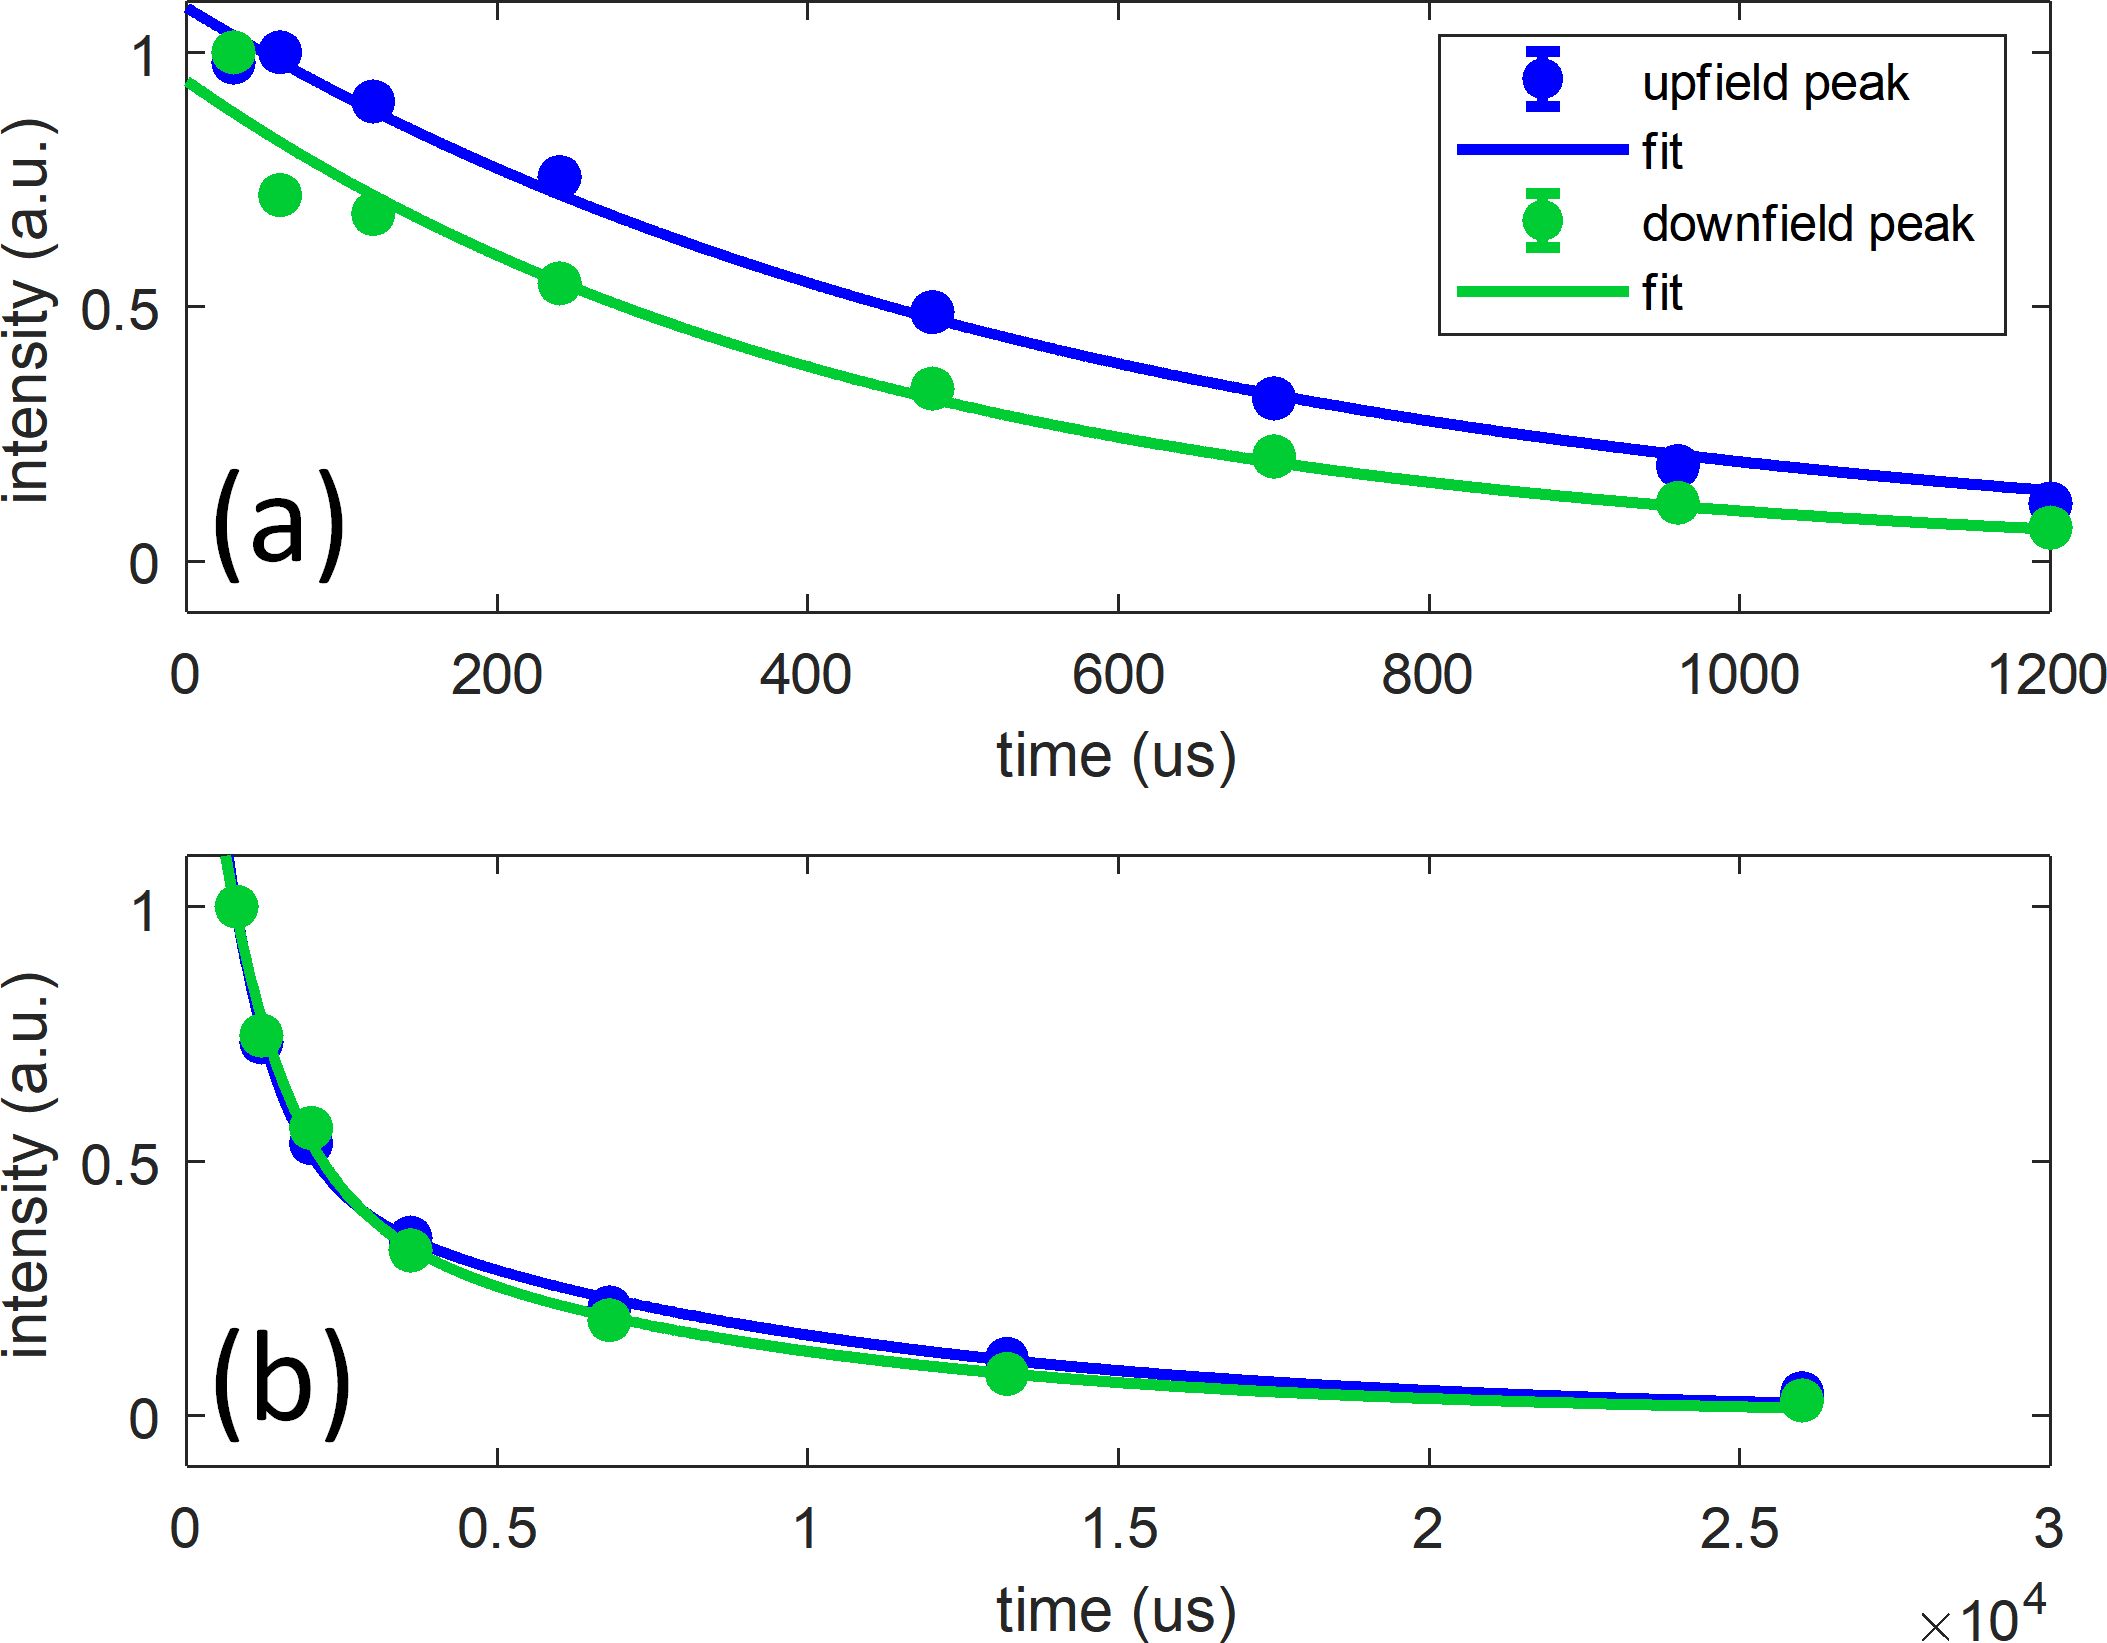
The 5.4 kHz FWHM of each resonance is very narrow for 1H nuclei under solid static conditions. We investigated the cause of this linewidth by measuring the T2 of the lines in Sample A1 using both solid-echo and CPMG decay experiment. The solid echo refocuses dipolar interactions to lowest order as well as static magnetic field inhomogeneities, while the CPMG refocuses only the static field inhomogeneities. The CPMG sequence used an echo time of 200 µs and pulse lengths of /2=0.5 µs and =1 µs.
The solid echo decay was fit using a single exponential and the CPMG decay was fit using a double-exponential, with the short timescale about three times more dominant than the long timescale (see Figure 3). The long CPMG timescale is likely what is known as a “CPMG tail”and is related to pulse imperfections[71] and thus we will not consider it further. The decay times are given in Table 1.
| T2 (solid echo) (ms) | T2 (CPMG) (ms) | |
|---|---|---|
| A1, upfield peak | 0.6±0.1 | short: 0.7±0.5 (75%±35%) long: 8.6±5.3 (25%±15%) |
| A1, downlfield peak | 0.4±0.2 | short: 1.0±0.9 (71%±29%) long: 7.5±7.7 (29%±29%) |
The intrinsic linewidth for a Lorentzian peak corresponding to a decay time T2 is , so a T2 of 0.5-1 ms corresponds to a width of 150-300 Hz, an order of magnitude lower than the observed linewidths. This suggests that the observed linewidths are dominated by inhomogeneous broadening. A dipolar coupling of 150 Hz correspond to a 1H-1H distance of 70 nm. Alternatively, the homogeneous linewidth (determined by T2) could be due to the electron T, if the nuclear spins are isolated. The electron spin T1e for dangling-bond defects in silicon has been measured to be 0.04-40 ms depending on the sample oxidation at X-Band, which overlaps with the timescale of the observed nuclear spin T2 in this work.[72] Note that T2 of Sample C was also measured and proved to the very similar to Sample A1 (data not shown).
2.4 DNP Spectrum
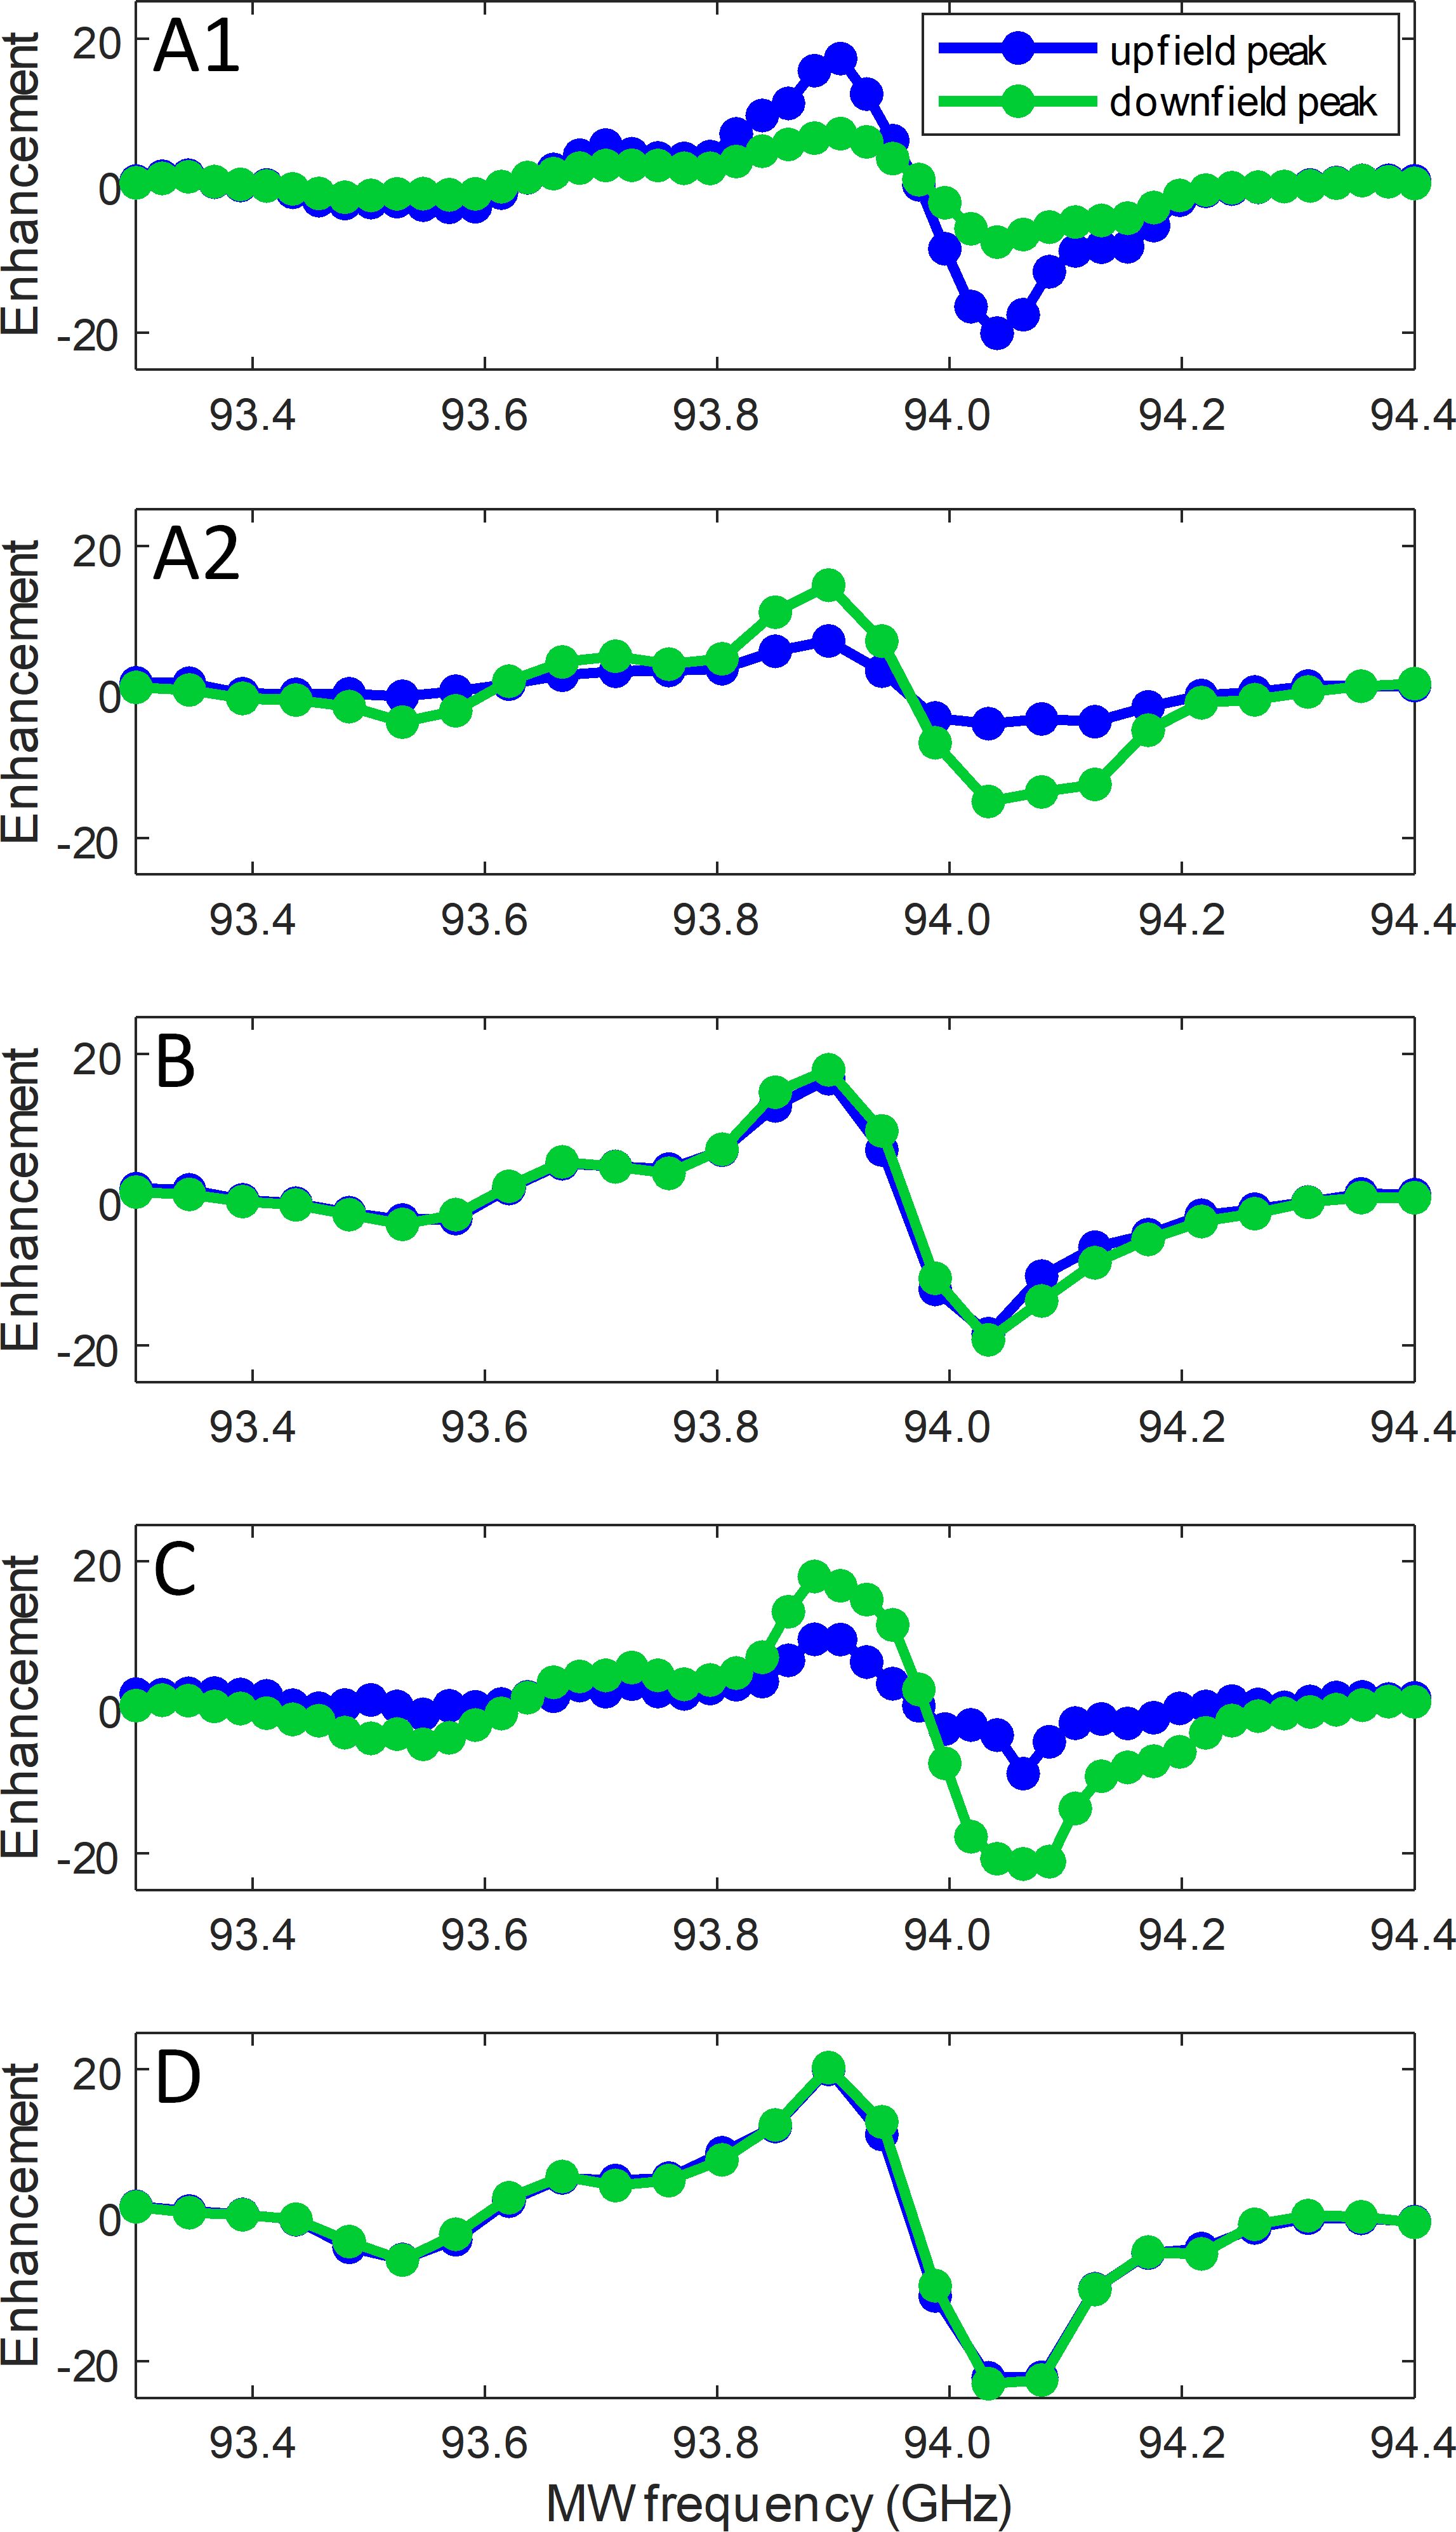
We studied the enhancement of both 1H peaks as a function of MW frequency (i.e. the DNP spectrum) as shown in Figure 4. The DNP spectrum was measured by setting the MW frequency and irradiation length and varying the MW frequency with each subsequent experiment. The irradiation length was set to 120 s, as a compromise between larger enhancements and longer experimental times.
The DNP spectra for the upfield peak and the downfield peak have the same shape, but their relative enhancements vary for the different samples. For example, in Sample A1 the upfield peak is more enhanced than the downfield peak, but in Sample A2 it is the other way around. The enhancement of the downfield peak was observed to vary between samples much less than the enhancement of the upfield peak. However, we do not see an obvious correlation between the relative intensities or separation between the upfield peak and the downfield peaks and the DNP enhancements.
The shape of the DNP spectrum is determined by both the DNP mechanism as well as the electron paramagnetic resonance (EPR) line of the electrons driving the enhancement.[73, 74] The solid effect (SE) enhancement appears when irradiating electron-nuclear double quantum and zero quantum transitions appearing at . This means that the SE DNP shape is expected to be broader than the EPR line, because it extends out past the edge of the line by on either side. [75] The cross effect (CE), on the other hand, relies on pairs of electrons separated by frequency such that: . [74] [76] If these two electrons have different polarizations due to MW irradiation, they will enhance the nuclei. [74] In this case, the enhancement from these electrons mainly appears within the EPR line, but can also extend out past the edge of the line by on either side in the case of the indirect CE (due to the effect of electron spectra diffusion). [74] The identical DNP shapes here likely means that electrons with similar g-anisotropy and EPR lines are the source of DNP enhancement for both types of 1H nuclei, and that the DNP mechanism is the same for both 1H nuclei.
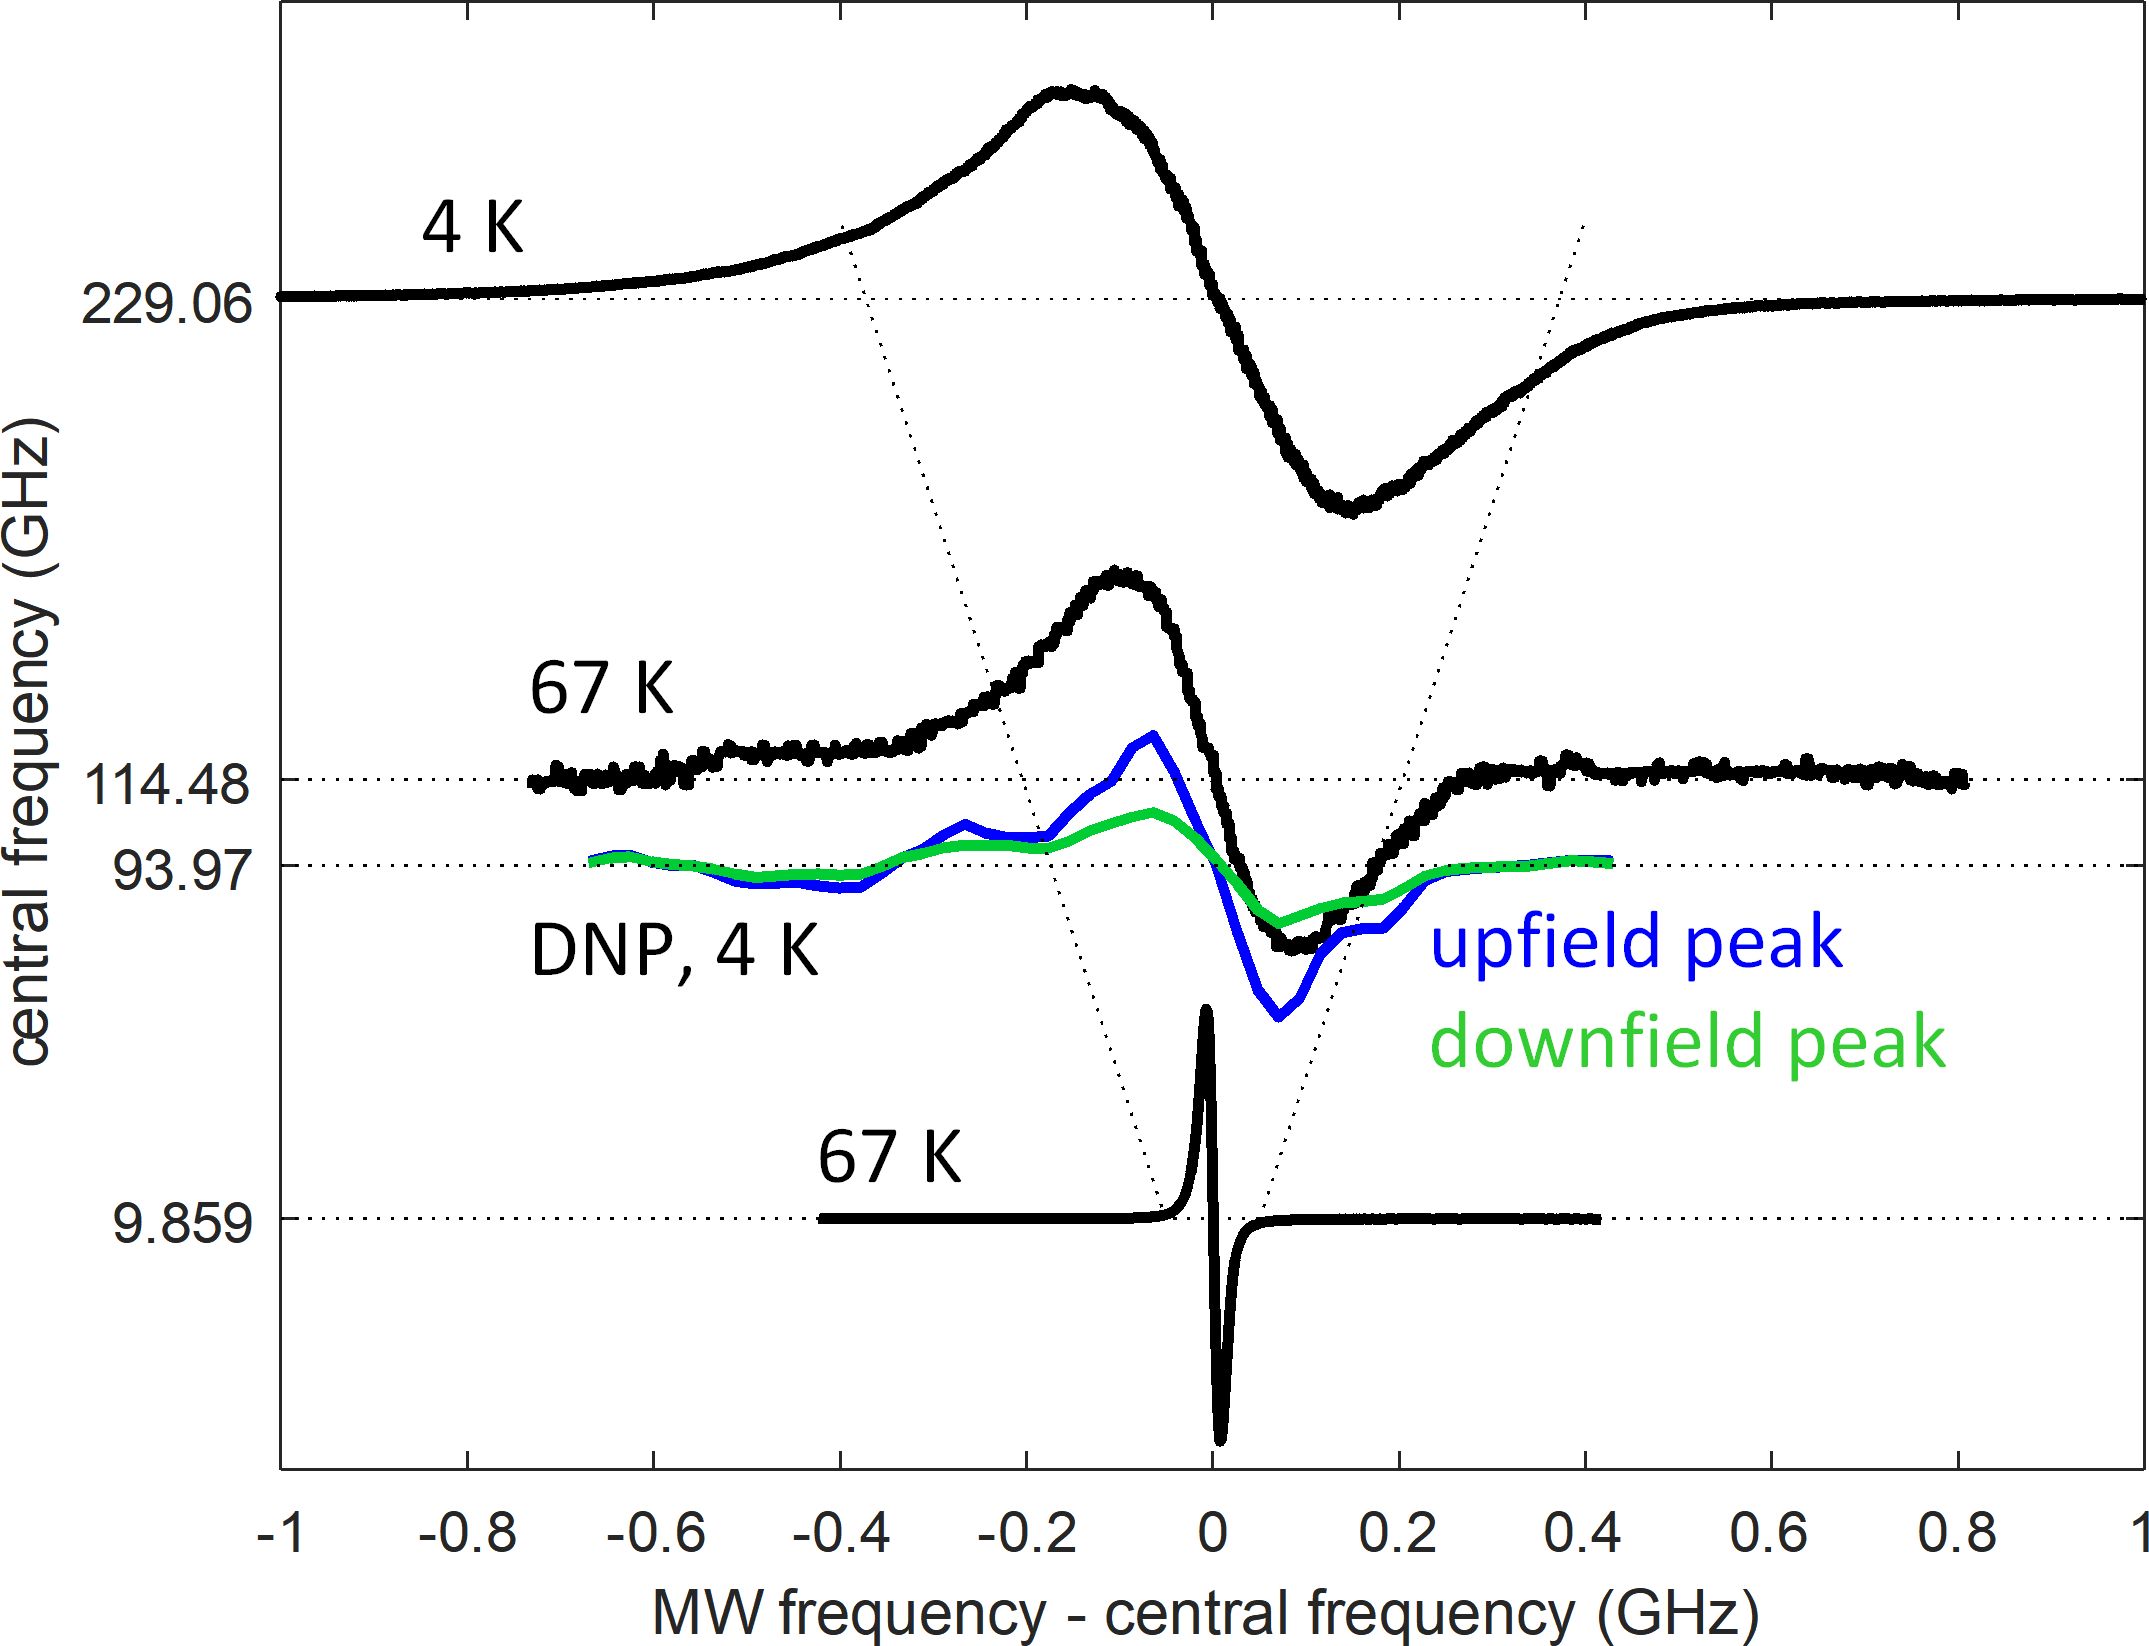
The EPR line of the silicon particles was measured at 9 GHz, 115 GHz and 230 GHz, and can be seen in Figure 5. The X-Band spectrum was measured on a commercial Bruker EMX spectrometer. The high field spectra were measured by a high frequency EPR spectrometer at University of Southern California.[77] In the experiments, the HF microwave power and the magnetic field modulation strengths were adjusted carefully to perform EPR measurements in the linear regime where the saturation effect is negligible.[78]
Figure 5 shows the EPR spectra observed at the three different frequencies, as well as the DNP spectrum for sample A1. Only a single EPR line with g2 is observed in all cases. The width of the EPR line is clearly seen to scale with field (as shown by the dotted lines), indicating that it is dominated by inhomogeneous broadening. The EPR spectra shown were measured at either 4 K or 67 K. No variation in the EPR lineshape was observed with temperature (see Supporting Information). Note also that these spectra are similar to the EPR lineshapes published by Cassidy et al. and Guy et al., measured at X-Band and W-Band, respectively, for the same particles. [21, 30]
The observed width of the EPR line is approximately 600 MHz at 115 GHz, suggesting an inhomogeneous linewidth of 490 MHz at 94 GHz. Figure 5 show that most of the observed DNP enhancement falls within the width of the EPR line (between -170 MHz and 140 MHz), but that there is still enhancement outside (<-170 GHz and >140 GHz). Considering this, we assign the DNP enhancement features to a combination of the CE-DNP mechanism and the SE-DNP mechanism. [73, 74] The CE mechanism (direct or indirect) [74] is possible because silicon particles are known to have a typical surface electron concentration of 1012 cm-2 or higher,[47, 48, 49] which corresponds to electron-electron dipolar interactions of 50 KHz on average. There are also small features around -420 MHz in Figure 5 which may be due to higher order DNP effects. [79]
It should be noted that the above DNP spectra were recorded using a 120 s MW irradiation, which is shorter than the characteristic build-up time for the DNP experiment. We measured both the spin-lattice relation time T1n and the build up time Tbu for both peaks for samples A1 and C. The nuclear spin-lattice relaxation time, T1n, was measured using a saturation recovery experiment, beginning with a train of saturation pulses, and then a delay which varied to allow the nuclear polarization to recover. The DNP buildup, Tbu, was measured in the exact same manner, but with MW irradiation applied during the recovery delay period.
The data were fit to a stretched exponential function, which represents a distribution of relaxation times or polarization buildup times (see Supporting Information). A stretching coefficient () was used in all cases. All the the characteristic build up times lie in the range of 300-400 s, as can be seen in Table 2. Thus the enhancements at 120 s MW irradiation are likely to reflect the steady-state enhancements at longer times. There is greater uncertainty in the values of T1n due to the low signal to noise ratio in the thermal experiments. We observed that Tbu<T1n in all cases, as expected.
| T1n (s) | Tbu(s) | Enhancement | |
|---|---|---|---|
| A1, upfield peak | 48695 | 369.743.5 | 15.6 |
| A1, downlfield peak | 913.4405.9 | 305.737.2 | 6.5 |
| C, upfield peak | 18311618 | 305.2105.1 | 7.0 |
| C, downfield peak | 638.6201.7 | 401.727.3 | 14.6 |
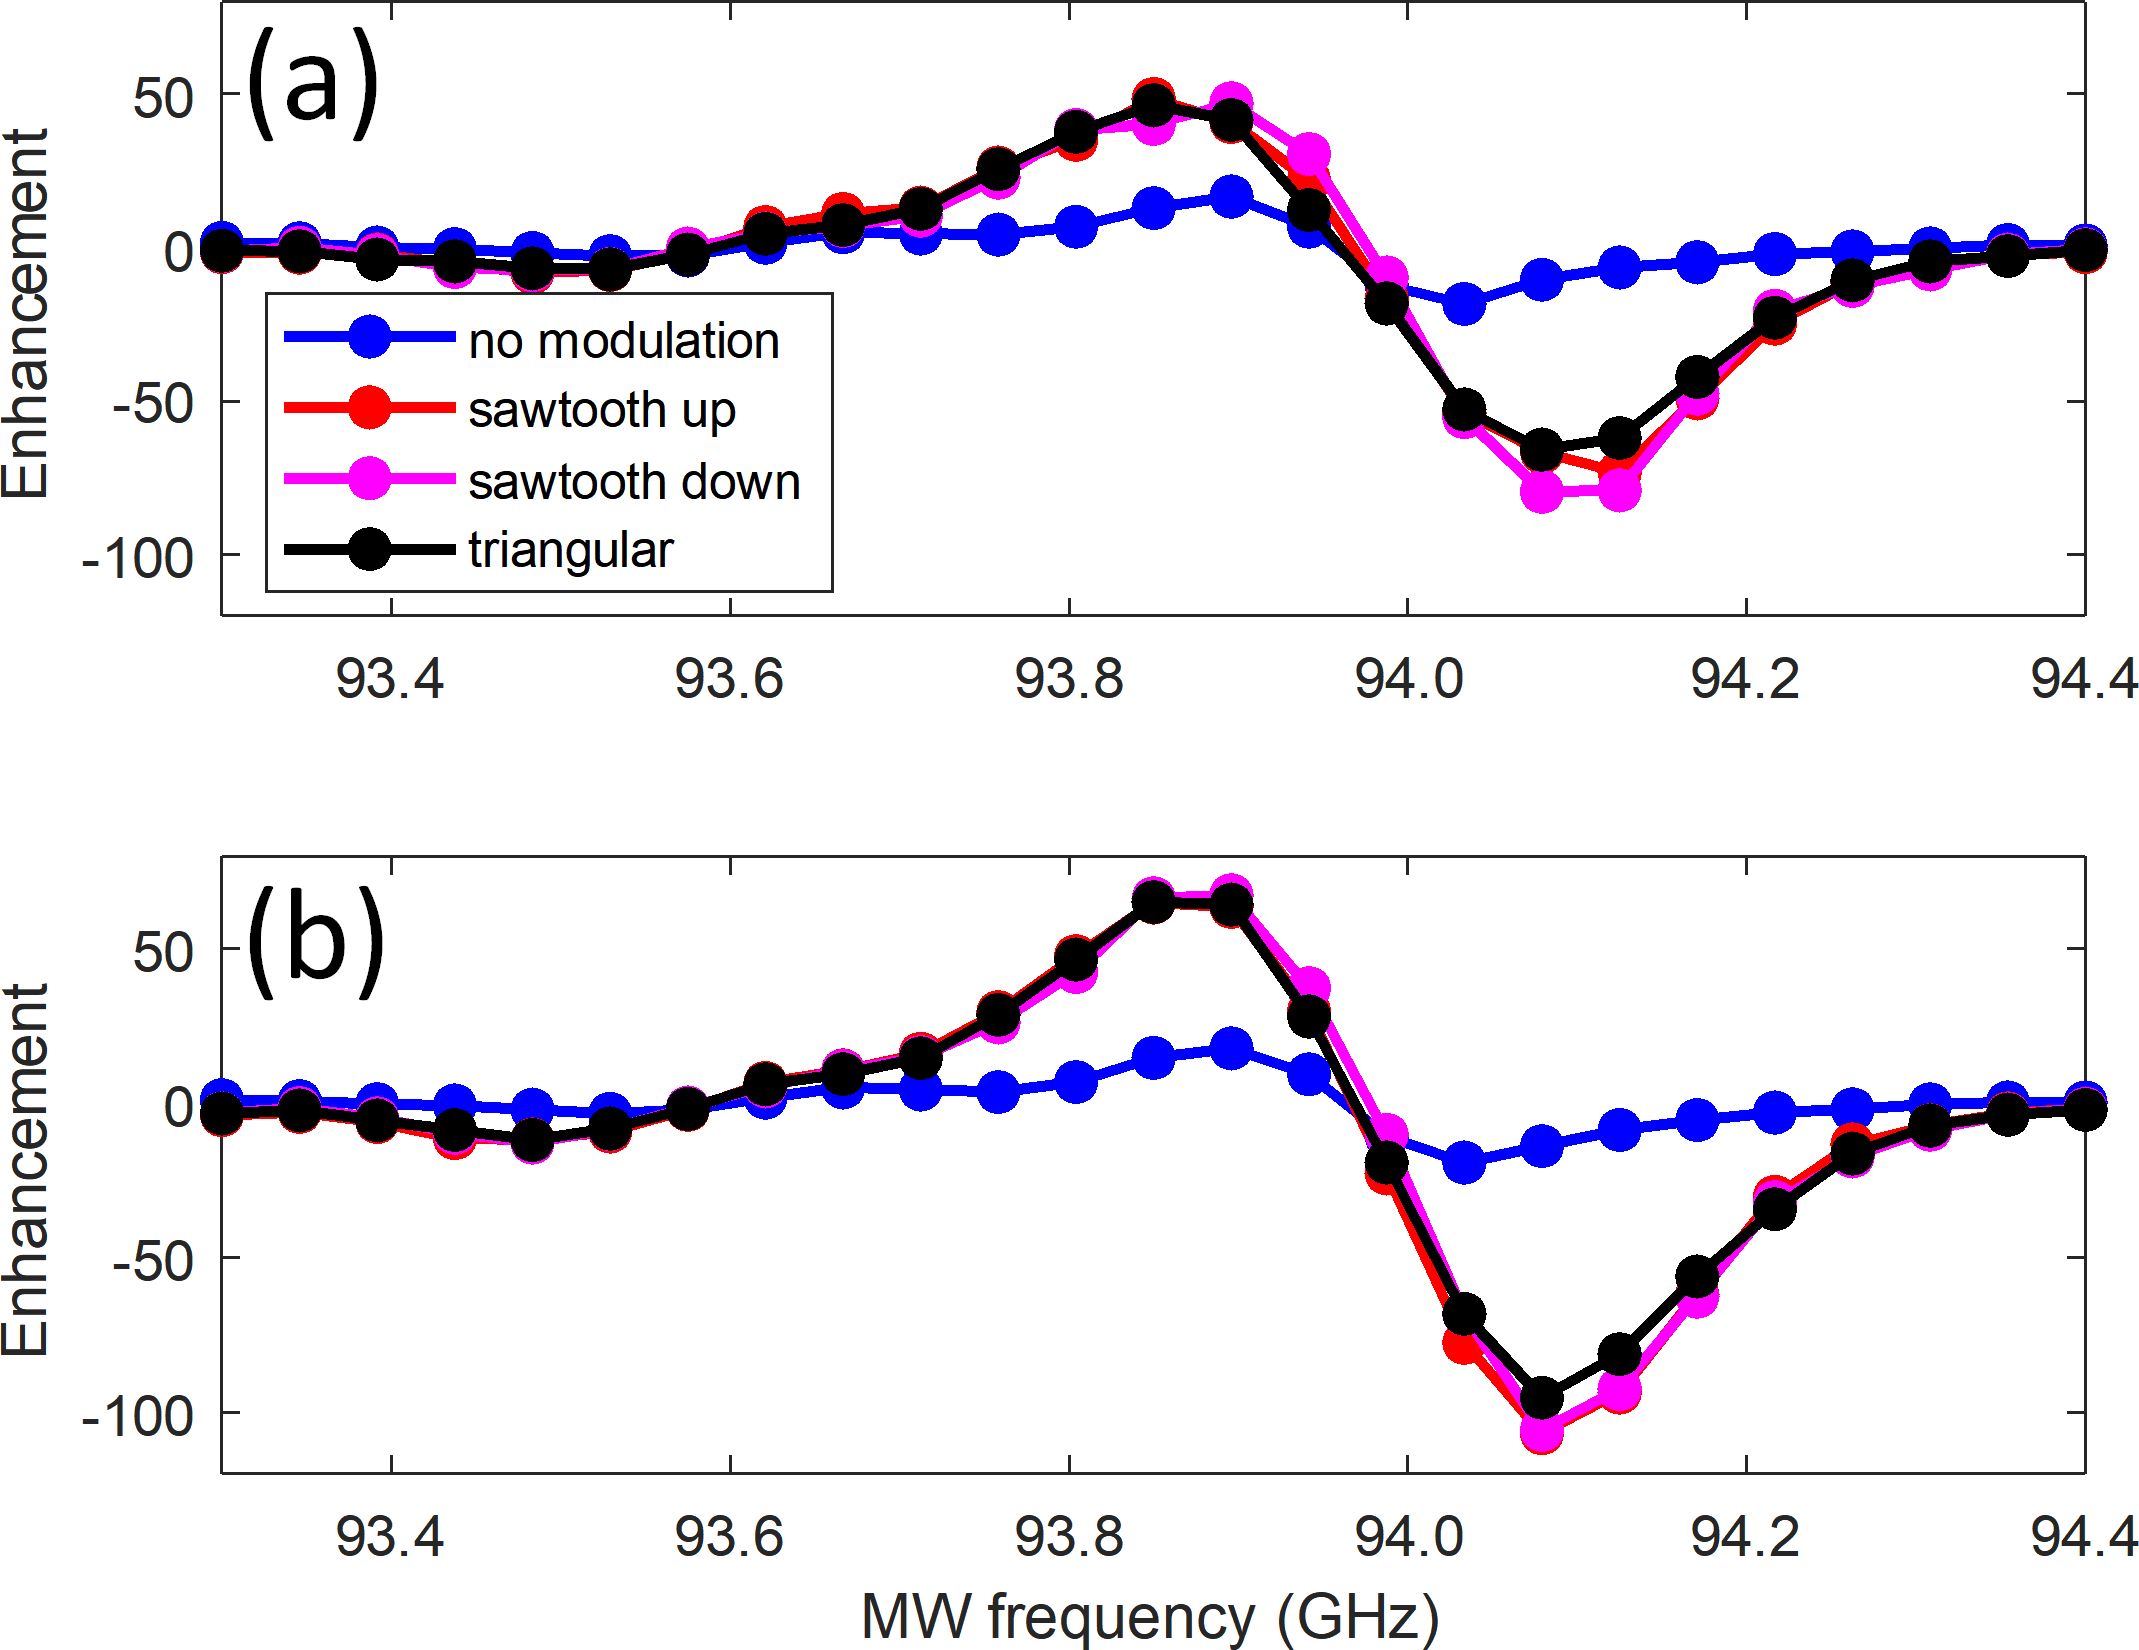
We also explored the role of frequency modulation of the MW irradiation on Sample B, where the upfield peak was much smaller than the downfield peak. The frequency of the modulation was 10 kHz, and the amplitude was 70 MHz (±70 MHz around the central frequency) in all cases. The frequency of the modulation refers to how many times per second the frequency range was swept. The amplitude of the modulation refers to the range of MW frequencies that was swept around the central frequency. Three types of frequency modulation were used: sawtooth up, sawtooth down and symmetrical triangular modulation. For DNP spectra the enhancement is plotted at each central frequency.
The frequency modulation results are plotted in Figure 6, with the upfield peak in panel (a) and the downfield peak in panel (b). All forms of modulation resulted in significantly increased enhancement of both the upfield and the downfield peaks, compared to no modulation, as previously shown. [30] [80] [81]
The upfield peak showed a lower enhancement in the negative part of the DNP spectrum ( 94.1 GHz) when triangular modulation was applied, relative to the single-directional sawtooth sweeps. This may be because the frequency of the triangular modulation is effectively twice that of sawtooth modulation (see Supporting Information), because it has been shown but that when the modulation frequency is much faster than the electron spin-lattice relaxation time T1e a decrease in enhancement can be expected. [30] However, it is a small effect, and not clear why the upfield peak is affected more than the downfield peak.
2.5 High-field DNP
To learn more about the proton spectrum we measured the 1H NMR spectrum on a 600 MHz Bruker Avance III DNP spectrometer, with 8 kHz magic angle spinning (MAS) at a temperature of 100K. Experiments with MW irradiation were conducted with a collector current of 110 mA, with irradiation at 395.287 GHz. 1H presaturation was done for all experiments with a train of 200 pulses of 2.6 µs with a 1 ms delay between each pulse.
The 1H signal was collected with a 16 step background suppression, with a /2=2.6 µs excitation and a composite pulse for background suppression. [82] Sixteen scans were acquired, with a 60 s recycle delay between every transient.
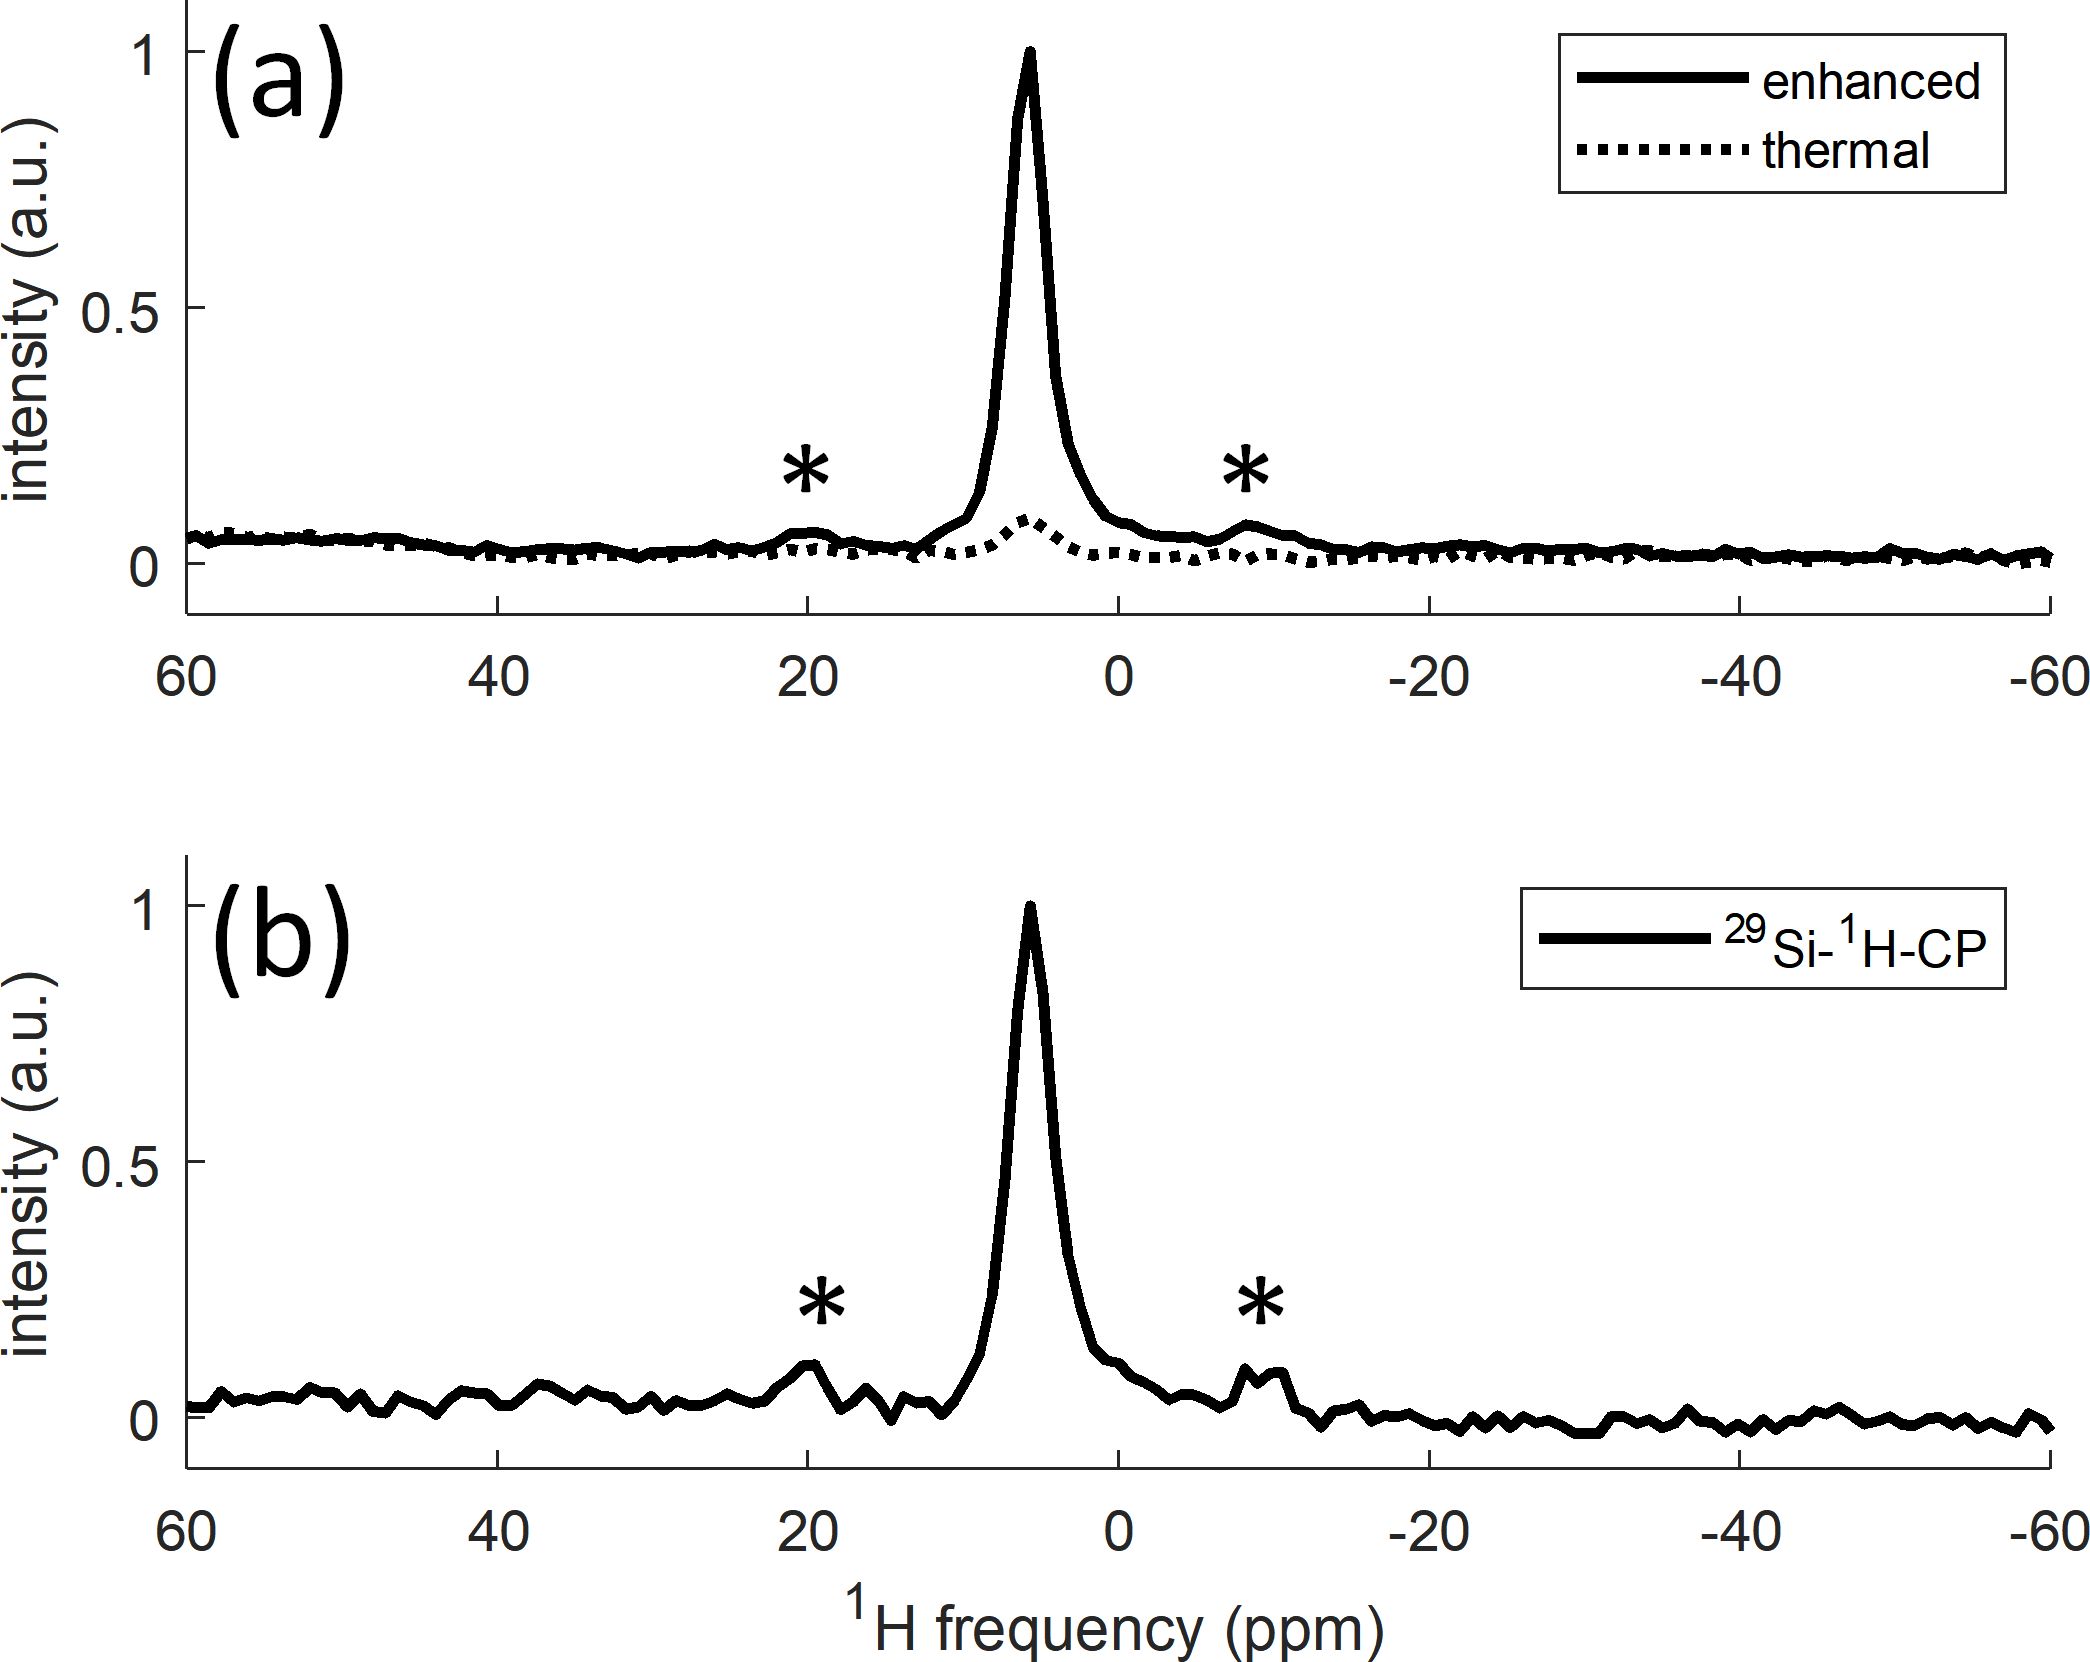
At the higher field, only a single narrow resonance is detected at 5.7 ppm, with a FWHM of 1.7 kHz. The line measured at 600 MHz appears at 5.7 ppm, which is closer to the 10 ppm line observed at 3.3 T. The spectra were referenced to 1H adamantane. The linewidth of the peak measured with MAS at 600 MHz is close to 2 kHz, however, the spinning sidebands indicate that the static linewidth is likely closer to 5 kHz, which is a similar linewidth to that measured at 142 MHz. In Figure 7a we compare the DNP enhanced signal to the thermal signal, showing the enhancement of 11.3.
In Figure 7b we show the 1H spectrum detected via inverse cross polarization (CP) from 29Si to 1H with MW irradiation (directly enhancing the 29Si). This spectrum is identical in shape to the spectrum with direct 1H detection, indicating that the 1H nuclei in the narrow line, which are on the surface of the particles, are dipolar coupled with 29Si nuclei. The cross polarization experiments from 29Si to 1H with MAS (29Si-1H-CPMAS) [1] were conducted with MW irradiation of 60 s such that the 29Si nuclei were directly enhanced. A contact time of 2 ms, and a spin-locking strength of 96 kHz were used for the CP. A /2=3 µs pulsed was used for 29Si excitation and 1024 scans were acquired.
Note, that a static spectrum was attempted but only 16 scans were acquired, and this was not enough to detect signal. This could be because the T1n was longer under static conditions, and the delay between scans was not sufficient.
3 Conclusions
In this work, we show DNP enhancement of 1H nuclei on the surface of silicon microparticles using only endogenous defect unpaired electrons as polarization sources. Using static DNP, we are able to get enhancements of up to 55 without the need for additional radicals or solvents. We see two 1H resonances, separated by a large shifts ranging from 29 to 47 ppm whose origin is unclear. The two types of 1H nuclei have homogeneous linewidths on the order of 150-200 Hz, indicating they are relatively sparse. The intensity of the "upfield peak" is highly variable, while the intensity of the "the downfield peak" is much more stable. Despite very similar relaxation times (T1n and T2) and linewidths, the two resonances are enhanced to different degrees. These results suggest that there are two distinct microscopic environments on the surface of the Si particles where the protons reside.
4 Materials and Methods
For more information about how the DNP spectrometer, as well as experimental details of the DNP spectra, T2, T1n and Tbu curves see the main text.
4.1 Sample preparation:
All samples were prepared from the same batch of silicon particles from Alfa Aesar, and were used as is, as described in the main text. Samples A1, A2, B and D were cooled gradually to 4 K over the course of several hours. However, sample C was directly inserted into a cryostat that was already at 4 K.
4.2 Variable temperature experiments:
The 1H Si powder spectrum was measured as a function of temperature from 40 K to 4.2 K, and the 1H spectrum of residual H2O in D2O was measured from 50 K to 4.2 K. At each temperature the 1H spectrum was collected via the same solid echo detection described above.
4.2.1 X-Band cw-EPR lines:
X-Band continuous-wave (cw) electron paramagnetic resonance (EPR) line was measured on a Bruker EMX spectrometer. The MW frequency was set to 9.834 GHz, with power set to 0.128 mW. Frequency modulation of 100 kHz was used, with an amplitude of 1.5 G. A range of 200 G was swept, centered around 3520 G, with a resolution of 512 points.
4.3 High field cw-EPR lines:
Continuous-wave (cw) electron paramagnetic resonance (EPR) lines were measured at 115 GHz and 230 GHz.
-
1.
At 115 GHz: The MW frequency was set to 115 GHz, with power set to 200 µW. Frequency modulation of 20 kHz was used, with an amplitude of 0.02 mT. Temperatures between 67 K and 250 K were recorded.
-
2.
At 230 GHz: The MW frequency was set to 230 GHz, with power set to 50 µW. Frequency modulation of 20 kHz was used, with an amplitude of 0.02 mT. Temperatures between 4 K and 20 K were recorded.
4.4 Data processing:
The 1H signal was fit to two Lorentzian lines. In all cases the peaks were fit with a linewidth of 5.4 kHz, which is the width that give the best fit for Sample A1. The frequencies of the peaks were determined for each sample separately using the highest signal to noise ratio (SNR) spectrum within the set of data (recorded in one day and during one cool-down). The frequencies extracted from this fit were then used to fit all other data in the set, using the pre-determined widths, only allowing the amplitude to vary. For the DNP spectra, a different phase correction was applied at each MW frequency, in order to ensure the correct phasing of the spectra.
For the variable temperature experiments, the spectra were fit either with two Lorentzian lineshapes or one Lorentzian lineshape, for the Si powder or the H2O, respectively. The linewidths were kept constant and determined by the lineshape at 4.2 K, while the frequency and amplitude of the lines were allowed to vary in order to fit the data as a function of temperature.
In some cases, when the NMR intensity is low, a broad 1H resonance is observed, which we attribute to probe background signal. The amplitude of the background is minimized by using an echo delay of =200 µs, and can be neglected during line fitting.
The spectra were referenced to tetramethylsilane (TMS) at 0 ppm, using a secondary reference of residual H2O in D2O at 4.9 ppm, also measured at 4 K. This resulted in the “downfield peak” appearing at 10 ppm.
The T1n and Tbu curves were fitted with a stretched-exponential function:
| (1) |
| (2) |
where T1n is the relaxation time, Tbu is the enhancement buildup time and is the scaling factor that determines the shape of the curve. The scaling factor was constrained to 0.8 to facilitate comparison between the timescales. This value was determined empirically by fitting all the curves and then choosing a value of that results in good fits for all curves.
The T2 curves were fitted with a single-exponential or a double-exponential function:
| (3) |
Where T and T are the long and short timescale respectively, and and are their amplitudes. Only a single term in Equation 3 was used for single-exponential fitting.
4.5 Scanning Electron Microscope:
The scanning electron microscope (SEM) image in the Supporting Information was taken on a FEI (Thermo Fisher Scientific) Scios2 LoVac dual beam FEG/FIB SEM, using a T1 detector, an acceleration voltage of 5kV, a current of 0.8 nA and a magnification of 2500 x. The silicon particles were mounted to a specimen stage using double-sided tape.
Acknowledgements:
This research was funded in part by the US National Science Foundation under Grant Nos. CHE-1410504 (CR), DMR-1508661 (S.T.) and CHE-1611134) (S.T.), the Nottingham University Engineering and Physical Sciences Partnered Access Fund and a Dartmouth College Global Exploratory and Development Grant. The Nottingham DNP MAS NMR Facility is funded by Grants EP/R042853/1 and EP/L022524/1. We would like to thank Dr. Maxime J. Guinel for his help with the SEM experiments.
References
- [1] J. Schaefer, E. Stejskal, Carbon-13 nuclear magnetic resonance of polymers spinning at the magic angle, Journal of the American Chemical Society 98 (4) (1976) 1031–1032.
- [2] T. Kobayashi, F. A. Perras, T. W. Goh, T. L. Metz, W. Huang, M. Pruski, Dnp-enhanced ultrawideline solid-state nmr spectroscopy: Studies of platinum in metal–organic frameworks, The journal of physical chemistry letters 7 (13) (2016) 2322–2327.
- [3] T. Kobayashi, F. A. Perras, I. I. Slowing, A. D. Sadow, M. Pruski, Dynamic nuclear polarization solid-state nmr in heterogeneous catalysis research, ACS Catalysis.
- [4] O. Lafon, M. Rosay, F. Aussenac, X. Lu, J. Trébosc, O. Cristini, C. Kinowski, N. Touati, H. Vezin, J. Amoureux, Beyond the silica surface by direct silicon-29 dynamic nuclear polarization, Angewandte Chemie International Edition 50 (36) (2011) 8367–8370.
- [5] O. Lafon, A. S. L. Thankamony, T. Kobayashi, D. Carnevale, V. Vitzthum, I. I. Slowing, K. Kandel, H. Vezin, J.-P. Amoureux, G. Bodenhausen, Mesoporous silica nanoparticles loaded with surfactant: low temperature magic angle spinning 13c and 29si nmr enhanced by dynamic nuclear polarization, The Journal of Physical Chemistry C.
- [6] O. Lafon, A. S. L. Thankamony, M. Rosay, F. Aussenac, X. Lu, J. Trébosc, V. Bout-Roumazeilles, H. Vezin, J.-P. Amoureux, Indirect and direct 29si dynamic nuclear polarization of dispersed nanoparticles, Chemical Communications 49 (28) (2013) 2864–2866.
- [7] D. Lee, N. T. Duong, O. Lafon, G. De Paëpe, Primostrato solid-state nmr enhanced by dynamic nuclear polarization: Pentacoordinated al3+ ions are only located at the surface of hydrated -alumina, The Journal of Physical Chemistry C 118 (43) (2014) 25065–25076.
- [8] A. Lesage, M. Lelli, D. Gajan, M. A. Caporini, V. Vitzthum, P. Miéville, J. Alauzun, A. Roussey, C. Thieuleux, A. Mehdi, Surface enhanced nmr spectroscopy by dynamic nuclear polarization, J. Am. Chem. Soc 132 (44) (2010) 15459–15461.
- [9] A. Lund, M.-F. Hsieh, T.-A. Siaw, S.-I. Han, Direct dynamic nuclear polarization targeting catalytically active 27al sites, Physical Chemistry Chemical Physics 17 (38) (2015) 25449–25454.
- [10] F. A. Perras, U. Chaudhary, I. I. Slowing, M. Pruski, Probing surface hydrogen bonding and dynamics by natural abundance, multidimensional, 17o dnp-nmr spectroscopy, The Journal of Physical Chemistry C.
- [11] F. A. Perras, T. Kobayashi, M. Pruski, Natural abundance 17o dnp two-dimensional and surface-enhanced nmr spectroscopy, J. Am. Chem. Soc 137 (26) (2015) 8336–8339.
- [12] F. A. Perras, T. Kobayashi, M. Pruski, Presto polarization transfer to quadrupolar nuclei: implications for dynamic nuclear polarization, Physical Chemistry Chemical Physics 17 (35) (2015) 22616–22622.
- [13] F. A. Perras, J. D. Padmos, R. L. Johnson, L.-L. Wang, T. J. Schwartz, T. Kobayashi, J. H. Horton, J. A. Dumesic, B. H. Shanks, D. D. Johnson, Characterizing substrate-surface interactions on alumina-supported metal catalysts by dynamic nuclear polarization-enhanced double-resonance nmr spectroscopy, Journal of the American Chemical Society 139 (7) (2017) 2702–2709.
- [14] A. J. Rossini, A. Zagdoun, F. Hegner, M. Schwarzwälder, D. Gajan, C. Copéret, A. Lesage, L. Emsley, Dynamic nuclear polarization nmr spectroscopy of microcrystalline solids, Journal of the American Chemical Society 134 (40) (2012) 16899–16908.
- [15] A. J. Rossini, A. Zagdoun, M. Lelli, J. Canivet, S. Aguado, O. Ouari, P. Tordo, M. Rosay, W. E. Maas, C. Copéret, Dynamic nuclear polarization enhanced solid-state nmr spectroscopy of functionalized metal-organic frameworks, Angewandte Chemie 124 (1) (2012) 127–131.
- [16] A. J. Rossini, A. Zagdoun, M. Lelli, D. Gajan, F. Rascón, M. Rosay, W. E. Maas, C. Copéret, A. Lesage, L. Emsley, One hundred fold overall sensitivity enhancements for silicon-29 nmr spectroscopy of surfaces by dynamic nuclear polarization with cpmg acquisition, Chemical Science 3 (1) (2012) 108–115.
- [17] A. J. Rossini, A. Zagdoun, M. Lelli, A. Lesage, C. Copéret, L. Emsley, Dynamic nuclear polarization surface enhanced nmr spectroscopy, Accounts of chemical research 46 (9) (2013) 1942–1951.
- [18] A. Dementyev, D. Cory, C. Ramanathan, Dynamic nuclear polarization in silicon microparticles, Physical review letters 100 (12) (2008) 127601.
- [19] B. Corzilius, V. K. Michaelis, S. A. Penzel, E. Ravera, A. A. Smith, C. Luchinat, R. G. Griffin, Dynamic nuclear polarization of 1h, 13c, and 59co in a tris (ethylenediamine) cobalt (iii) crystalline lattice doped with cr (iii), Journal of the American Chemical Society 136 (33) (2014) 11716–11727.
- [20] T. Chakrabrty, N. Goldin, A. Feintuch, L. Houben, M. Leskes, Paramagnetic metal ion dopants as polarization agents for dnp nmr spectroscopy in inorganic solids, ChemPhysChem.
- [21] M. Cassidy, C. Ramanathan, D. Cory, J. Ager, C. M. Marcus, Radical-free dynamic nuclear polarization using electronic defects in silicon, Physical Review B 87 (16) (2013) 161306.
- [22] C. O. Bretschneider, Ü. Akbey, F. Aussenac, G. L. Olsen, A. Feintuch, H. Oschkinat, L. Frydman, On the potential of dynamic nuclear polarization enhanced diamonds in solid-state and dissolution 13c nmr spectroscopy, ChemPhysChem 17 (17) (2016) 2691–2701.
- [23] L. B. Casabianca, A. I. Shames, A. M. Panich, O. Shenderova, L. Frydman, Factors affecting dnp nmr in polycrystalline diamond samples, The Journal of Physical Chemistry C 115 (39) (2011) 19041–19048.
- [24] G. Kwiatkowski, F. Jähnig, J. Steinhauser, P. Wespi, M. Ernst, S. Kozerke, Direct hyperpolarization of micro- and nanodiamonds for bioimaging applications - considerations on particle size, functionalization and polarization loss, Journal of Magnetic Resonance 286 (2018) 42–51.
- [25] E. Rej, T. Gaebel, D. E. Waddington, D. J. Reilly, Hyperpolarized nanodiamond surfaces, Journal of the American Chemical Society 139 (1) (2016) 193–199.
- [26] G. Kwiatkowski, Y. Polyhach, F. Jähnig, T. Shiroka, F. H. Starsich, M. Ernst, S. Kozerke, Exploiting endogenous surface defects for dynamic nuclear polarization of silicon micro-and nanoparticles, The Journal of Physical Chemistry C 122 (44) (2018) 25668–25680.
- [27] P. Wenk, M. Kaushik, D. Richter, M. Vogel, B. Suess, B. Corzilius, Dynamic nuclear polarization of nucleic acid with endogenously bound manganese, Journal of biomolecular NMR 63 (1) (2015) 97–109.
- [28] J. W. Aptekar, M. C. Cassidy, A. C. Johnson, R. A. Barton, M. Lee, A. C. Ogier, C. Vo, M. N. Anahtar, Y. Ren, S. N. Bhatia, Silicon nanoparticles as hyperpolarized magnetic resonance imaging agents, ACS nano 3 (12) (2009) 4003–4008.
- [29] M. Cassidy, H. Chan, B. Ross, P. Bhattacharya, C. M. Marcus, In vivo magnetic resonance imaging of hyperpolarized silicon particles, Nature nanotechnology 8 (5) (2013) 363.
- [30] M. L. Guy, K. J. van Schooten, L. Zhu, C. Ramanathan, Chemisorption of water on the surface of silicon microparticles measured by dynamic nuclear polarization enhanced nmr, The Journal of Physical Chemistry C 121 (5) (2017) 2748–2754.
- [31] N. Whiting, J. Hu, P. Constantinou, N. Z. Millward, J. Bankson, D. Gorenstein, A. Sood, D. Carson, P. Bhattacharya, Developing hyperpolarized silicon particles for advanced biomedical imaging applications, in: Medical Imaging 2015: Biomedical Applications in Molecular, Structural, and Functional Imaging, Vol. 9417, International Society for Optics and Photonics, 2015, p. 941702.
- [32] M. C. Beard, K. P. Knutsen, P. Yu, J. M. Luther, Q. Song, W. K. Metzger, R. J. Ellingson, A. J. Nozik, Multiple exciton generation in colloidal silicon nanocrystals, Nano letters 7 (8) (2007) 2506–2512.
- [33] C.-Y. Liu, Z. C. Holman, U. R. Kortshagen, Hybrid solar cells from p3ht and silicon nanocrystals, Nano letters 9 (1) (2008) 449–452.
- [34] R. J. Walters, G. I. Bourianoff, H. A. Atwater, Field-effect electroluminescence in silicon nanocrystals, Nature materials 4 (2) (2005) 143.
- [35] Y.-M. Lin, K. C. Klavetter, P. R. Abel, N. C. Davy, J. L. Snider, A. Heller, C. B. Mullins, High performance silicon nanoparticle anode in fluoroethylene carbonate-based electrolyte for li-ion batteries, Chemical communications 48 (58) (2012) 7268–7270.
- [36] F. Erogbogbo, K.-T. Yong, I. Roy, R. Hu, W.-C. Law, W. Zhao, H. Ding, F. Wu, R. Kumar, M. T. Swihart, In vivo targeted cancer imaging, sentinel lymph node mapping and multi-channel imaging with biocompatible silicon nanocrystals, ACS nano 5 (1) (2010) 413–423.
- [37] J. Schaefer, J. Anderson, G. Lapeyre, Water adsorption on cleaved silicon surfaces, Journal of Vacuum Science & Technology A: Vacuum, Surfaces, and Films 3 (3) (1985) 1443–1447.
- [38] S. Ciraci, H. Wagner, Dissociation of water molecules on si surfaces, Physical Review B 27 (8) (1983) 5180.
- [39] D. Haneman, Surfaces of silicon, Reports on Progress in Physics 50 (8) (1987) 1045.
- [40] H. Neergaard Waltenburg, J. Yates, Surface chemistry of silicon, Chemical reviews 95 (5) (1995) 1589–1673.
- [41] A. C. R. Grayson, R. S. Shawgo, A. M. Johnson, N. T. Flynn, Y. Li, M. J. Cima, R. Langer, A biomems review: Mems technology for physiologically integrated devices, Proceedings of the IEEE 92 (1) (2004) 6–21.
- [42] C. Iliescu, H. Taylor, M. Avram, J. Miao, S. Franssila, A practical guide for the fabrication of microfluidic devices using glass and silicon, Biomicrofluidics 6 (1) (2012) 016505.
- [43] Z. Saleh, G. Nogay, E. Ozkol, G. Yilmaz, M. Sagban, M. Gunes, R. Turan, Atmospheric aging and light-induced degradation of amorphous and nanostructured silicon using photoconductivity and electron spin resonance, Canadian Journal of Physics 92 (7/8) (2014) 713–717.
- [44] M. Rohrmüller, W. Schmidt, U. Gerstmann, Electron paramagnetic resonance calculations for hydrogenated si surfaces, Physical Review B 95 (12) (2017) 125310.
- [45] M. Stutzmann, D. K. Biegelsen, Microscopic nature of coordination defects in amorphous silicon, Physical Review B 40 (14) (1989) 9834.
- [46] O. Astakhov, R. Carius, Y. Petrusenko, V. Borysenko, D. Barankov, F. Finger, The relationship between hydrogen and paramagnetic defects in thin film silicon irradiated with 2 mev electrons, Journal of Physics: Condensed Matter 24 (30) (2012) 305801.
- [47] L. Zhu, K. J. van Schooten, M. L. Guy, C. Ramanathan, Optical dependence of electrically detected magnetic resonance in lightly doped si:p devices, Physical Review Applied 7 (6) (2017) 064028.
- [48] P. Lenahan, J. Conley Jr, What can electron paramagnetic resonance tell us about the si/sio2 system?, Journal of Vacuum Science & Technology B: Microelectronics and Nanometer Structures Processing, Measurement, and Phenomena 16 (4) (1998) 2134–2153.
- [49] D. Herve, J. Leray, R. Devine, Comparative study of radiation-induced electrical and spin active defects in buried sio2 layers, Journal of applied physics 72 (8) (1992) 3634–3640.
- [50] W. Carlos, P. Taylor, Hydrogen-associated disorder modes in amorphous si:h films, Physical Review Letters 45 (5) (1980) 358.
- [51] J. A. Reimer, R. W. Vaughan, J. Knights, Proton magnetic resonance spectra of plasma-deposited amorphous si h films, Physical Review Letters 44 (3) (1980) 193.
- [52] J. A. Reimer, R. W. Vaughan, J. C. Knights, Proton nmr studies of annealed plasma-deposited amorphous si:h films, Solid State Communications 37 (2) (1981) 161–164.
- [53] W. Carlos, P. Taylor, 1h nmr in a-si, Physical Review B 26 (1982) 3605–3616.
- [54] N. Zumbulyadis, Hydrogen-silicon nuclear spin correlations in -si:h: a two-dimensional nmr study, Physical Review B 33 (9) (1986) 6495.
- [55] J. Baum, K. Gleason, A. Pines, A. N. Garroway, J. Reimer, Multiple-quantum nmr study of clustering in hydrogenated amorphous silicon, Physical review letters 56 (13) (1986) 1377.
- [56] K. K. Gleason, M. A. Petrich, J. A. Reimer, Hydrogen microstructure in amorphous hydrogenated silicon, Physical Review B 36 (6) (1987) 3259.
- [57] Y. Wu, J. T. Stephen, D. Han, J. Rutland, R. Crandall, A. Mahan, New hydrogen distribution in a-si:h: An nmr study, Physical review letters 77 (10) (1996) 2049.
- [58] J. Baugh, D. Han, A. Kleinhammes, Y. Wu, Magnetic susceptibility and microstructure of hydrogenated amorphous silicon measured by nuclear magnetic resonance on a single thin film, Applied Physics Letters 78 (4) (2001) 466–468.
- [59] J. A. Reimer, R. W. Vaughan, J. C. Knights, Proton spin-lattice relaxation in plasma-deposited amorphous silicon-hydrogen films, Physical Review B 23 (6) (1981) 2567.
- [60] D. Lee, M. Kaushik, R. Coustel, Y. Chenavier, M. Chanal, M. Bardet, L. Dubois, H. Okuno, N. Rochat, F. Duclairoir, Solid-state nmr and dft combined for the surface study of functionalized silicon nanoparticles, Chemistry-A European Journal 21 (45) (2015) 16047–16058.
- [61] D.-Q. Yang, J.-N. Gillet, M. Meunier, E. Sacher, Room temperature oxidation kinetics of si nanoparticles in air, determined by x-ray photoelectron spectroscopy, Journal of Applied Physics 97 (2) (2005) 024303.
- [62] M. L. Guy, L. Zhu, C. Ramanathan, Design and characterization of a w-band system for modulated dnp experiments, Journal of Magnetic Resonance 261 (2015) 11–18.
- [63] C. P. Slichter, Principles of magnetic resonance, Vol. 1, Springer Science & Business Media, 2013.
- [64] M. H. Levitt, Spin dynamics: basics of nuclear magnetic resonance, John Wiley & Sons, 2001.
- [65] C. P. Grey, N. Dupré, Nmr studies of cathode materials for lithium-ion rechargeable batteries, Chemical Reviews 104 (10) (2004) 4493–4512.
- [66] R. S. Drago, J. I. Zink, R. M. Richman, W. Perry, Theory of isotropic shifts in the nmr of paramagnetic materials: Part i, Journal of Chemical Education 51 (6) (1974) 371.
- [67] R. S. Drago, J. I. Zink, R. M. Richman, W. Perry, Theory of isotropic shifts in the nmr of paramagnetic materials: Part ii, Journal of Chemical Education 51 (7) (1974) 464.
- [68] A. J. Pell, G. Pintacuda, C. P. Grey, Paramagnetic nmr in solution and the solid state, Progress in Nuclear Magnetic Resonance Spectroscopy.
- [69] P. Hrobárik, V. Hrobáriková, F. Meier, M. Repiský, S. Komorovský, M. Kaupp, Relativistic four-component dft calculations of 1h nmr chemical shifts in transition-metal hydride complexes: unusual high-field shifts beyond the buckingham–stephens model, The Journal of Physical Chemistry A 115 (22) (2011) 5654–5659.
- [70] R. H. Mitchell, Measuring aromaticity by nmr, Chemical reviews 101 (5) (2001) 1301–1316.
- [71] M. B. Franzoni, P. R. Levstein, J. Raya, J. Hirschinger, Hole burning in polycrystalline c60: An answer to the long pseudocoherent tails, Physical Review B 78 (11) (2008) 115407.
- [72] P. Gumann, O. Patange, C. Ramanathan, H. Haas, O. Moussa, M. Thewalt, H. Riemann, N. Abrosimov, P. Becker, H.-J. Pohl, Inductive measurement of optically hyperpolarized phosphorous donor nuclei in an isotopically enriched silicon-28 crystal, Physical review letters 113 (26) (2014) 267604.
- [73] D. Shimon, Y. Hovav, A. Feintuch, D. Goldfarb, S. Vega, Dynamic nuclear polarization in the solid state: a transition between the cross effect and the solid effect, Physical Chemistry Chemical Physics 14 (16) (2012) 5729–5743.
- [74] Y. Hovav, D. Shimon, I. Kaminker, A. Feintuch, D. Goldfarb, S. Vega, Effects of the electron polarization on dynamic nuclear polarization in solids, Physical Chemistry Chemical Physics 17 (8) (2015) 6053–6065.
- [75] Y. Hovav, A. Feintuch, S. Vega, Theoretical aspects of dynamic nuclear polarization in the solid state–the solid effect, Journal of Magnetic Resonance 207 (2) (2010) 176–189.
- [76] Y. Hovav, A. Feintuch, S. Vega, Theoretical aspects of dynamic nuclear polarization in the solid state–the cross effect, Journal of Magnetic Resonance 214 (2012) 29–41.
- [77] F. H. Cho, V. Stepanov, S. Takahashi, A high-frequency electron paramagnetic resonance spectrometer for multi-dimensional, multi-frequency, and multi-phase pulsed measurements, Review of Scientific Instruments 85 (7) (2014) 075110.
- [78] Z. Peng, T. Biktagirov, F. Cho, U. Gerstmann, S. Takahashi, Investigation of near-surface defects of nanodiamonds by high-frequency epr and dft calculation, The Journal of Chemical Physics 150 (13) (2019) 134702.
- [79] D. Shimon, Y. Hovav, I. Kaminker, A. Feintuch, D. Goldfarb, S. Vega, Simultaneous dnp enhancements of 1 h and 13 c nuclei: theory and experiments, Physical Chemistry Chemical Physics 17 (17) (2015) 11868–11883.
- [80] Y. Hovav, A. Feintuch, S. Vega, D. Goldfarb, Dynamic nuclear polarization using frequency modulation at 3.34 t, Journal of Magnetic Resonance 238 (2014) 94–105.
- [81] I. Kaminker, S. Han, Amplification of dynamic nuclear polarization at 200 ghz by arbitrary pulse shaping of the electron spin saturation profile, The journal of physical chemistry letters.
- [82] S. Odedra, S. Wimperis, Improved background suppression in 1h mas nmr using composite pulses, Journal of Magnetic Resonance 221 (2012) 41–50.