Large Volcanic Event on Io Inferred from Jovian Sodium Nebula Brightening
Abstract
1 Introduction
Io’s volcanism was first hinted at by a fortuitous observation in the 3 – 5 m region of the infrared (Witteborn et al., 1979), though it was not understood as such until after Voyager 1 observations confirmed the presence of plumes (Morabito et al., 1979; Sinton, 1980). This volcanism helped to place in context earlier fortuitous observations of Io’s ionosphere (Kliore et al., 1975), a sodium cloud near Io (Brown & Chaffee, 1974), and ionized sulfur emission near Jupiter (Kupo et al., 1976): Io has an atmosphere which ultimately derives its source from volcanic activity and supplies Jupiter’s magnetosphere with a substantial amount of material (1 ton s-1, e.g., McGrath et al., 2004; Schneider & Bagenal, 2007). As discussed in these references, material that is ionized forms the Io plasma torus (IPT), which encircles Jupiter near Io’s orbital radius. It is the bright line of singly ionized sulfur at [S II] 6731 Å which led to the initial detection of the IPT and has enabled it to be imaged by ground-based coronagraphs with apertures as small as 30 cm (Nozawa et al., 2004). Interaction between the IPT and Io’s atmosphere via processes such as sputtering, charge exchanging and dissociative recombination, result in the energetic ejection of neutral material. Although a minor component of the material that is released, sodium has such bright doublet emission at 5890 Å and 5896 Å, that it has been imaged by ground-based coronagraphs with apertures as small as 10 cm (e.g., Mendillo et al., 1990, 2004; Yoneda et al., 2009, 2010, 2014, 2015).
Mendillo et al. (2004) used of order one wide-field (6∘) sodium cloud image per year between 1990 and 1998 and a literature search of available Io infrared measurements to suggest there was a general correlation between the sodium nebula brightness and Io’s disk-averaged infrared brightness (their Figure 2). Long-lived volcanic hot spots, particularly Loki Pathera and Tiermes Pathera, were identified as the primary causes of this correlation (their Figure 1). Subsequent work by de Kleer, de Pater, & Yoneda (2016) used 3-years of higher cadence sodium cloud images (up to one per day) and much higher spatial resolution IR monitoring and failed to confirm this correlation. Rather, de Kleer, de Pater, & Yoneda (2016) suggested some, but not all, bright transient IR events traceable to individual volcanic eruptions may trigger sodium cloud brightening. Loki Pathera and Tiermes Pathera are lava lakes, which are not known to produce high eruptive plumes (e.g., Rathbun & Spencer, 2006; de Pater et al., 2017). Rather, explosive events produced by volcanoes such as Pele, Tvashtar and Pillan (e.g., Jessup & Spencer, 2012) would seem more likely to result in the ejection of material, though it is not clear if plume material from these eruptions can be ejected directly beyond Io’s atmosphere or if sublimation of the large ejecta blankets observed around these volcanoes is responsible for increase in ejection rates. Finally, Johnson et al. (1995) have suggested that SO2 geysers may create “stealth plumes,” undetected by methods that monitor Io surface or near-surface properties, since they would not have strong infrared or dust signals. Regardless of the precise physical mechanism operating, Io’s volcanic nature is ultimately responsible for the release of gas into Jupiter’s magnetosphere. Therefore, for the purposes of this work, we will call such a release of gas a volcanic event.
Using a spectroscopic study that lasted an entire Jovian opposition, Brown & Bouchez (1997) showed that when there was a large increase in sodium emission in the inner Jovian magnetosphere, the IPT also became brighter and shifted to the east. The sodium peak brightness was seen before the IPT peak brightness. Brown & Bouchez (1997) attributed this behavior to an eruption of a volcanic plume on Io and the resulting radial and antisunward diffusion of material through the Jovian magnetosphere.
Yoneda et al. (2010) used the Nozawa et al. (2004) [S II] IPT observations and contemporaneously recorded small-aperture coronagraphic sodium nebula images to establish a correlation between IPT brightness and sodium nebula brightness in the same sense as that found by Brown & Bouchez (1997). Extreme ultraviolet (EUV) observations of the IPT have also shown evidence of correlation with indicators of volcanic ejection of material from Io (Krüger et al., 2003; Steffl et al., 2006; Yoneda et al., 2015; Kimura et al., 2018).
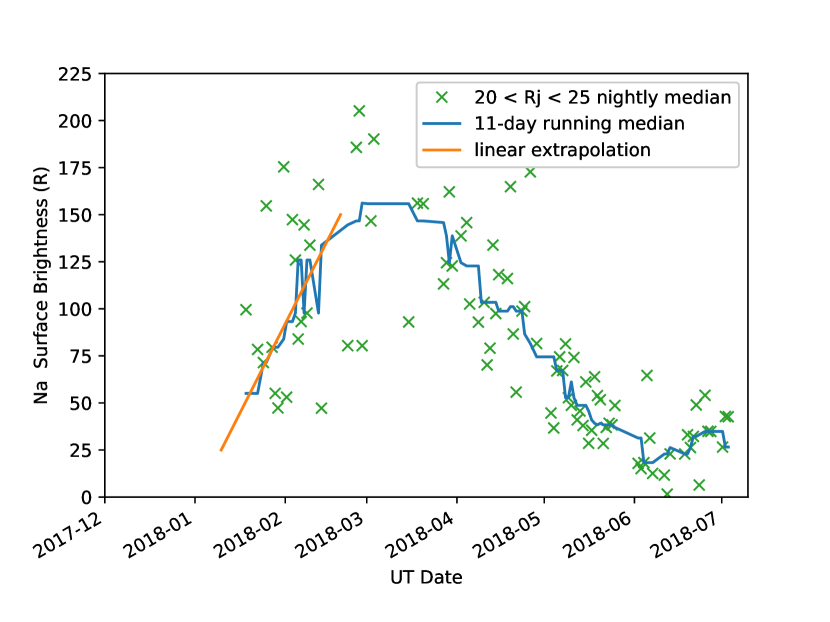
Motivated by the success of the small-aperture ground-based coronagraphic observations of the IPT and Jovian sodium nebula by Nozawa et al. (2004), Mendillo et al. (2004), and the numerous open scientific questions in inner Jovian magnetospheric studies, we created the Io Input/Output facility (IoIO). escribed in more detail in §2, In §4 – §5 and Figure 2, we show that IoIO detected a substantial increase in the amount of sodium within 50 Jovian radii () of Jupiter starting in the mid December 2017 – early January 2018 timeframe. In §6, we suggest this was caused by a volcanic event on Io.
2 Observations
The Io Input/Output facility (IoIO) consists of a 35 cm Celestron telescope feeding a custom-built coronagraph, a boresight-mounted 80 mm guide telescope and an Astro-Physics 1100 GTO German equatorial mount. IoIO is located at the San Pedro Valley Observatory, a hosting site situated in a dark location 100 km east of Tucson, Arizona, USA. The coronagraph imaging system is telecentric: A Kodak Wratten ND3 gelatin neutral density filter cut 1.5 mm wide is placed at the focal plain of the Celestron telescope so that Jupiter is attenuated rather than occulted, allowing for astrometric and photometric calibrations. The diverging light from the f/11 beam then passes through one of the five filters listed in Table 1 The filters are hard metal oxide coated to maximize durability and minimize central wavelength (CWL) temperature drift (0.1 Å C-1). The narrow-band Fabry-Pérot type filters, fabricated by Custom Scientific, have a very flat-topped profile with 90% peak efficiency. The sodium on-band filter was constructed such that both the Na D lines are transmitted with 1% change in efficiency over the entire FOV and nighttime temperature range expected at our hosting site. After the filters, the light passes through a field lens which focuses the telescope pupil onto the pupil of a Nikon Nikkor 60 mm F/2.8 camera lens. Finally, the light is collected by a Starlight Xpress SX694 medium format CCD camera. The effective focal length of IoIO is 1200 mm, the FOV for sodium nebula observations is 0.4∘ or 64 – 84 , depending on Jupiter’s geocentric distance and pixels are 0.78′′ per side.
| Filter | CWL (Å) | FWHM (Å) |
|---|---|---|
| R | 6349 | 1066 |
| [S II] on-band | 6731 | 10 |
| Na on-band | 5893 | 12 |
| [S II] off-band | 6640 | 40 |
| Na off-band | 6000 | 50 |
| aMeasured in a collimated, normal-incidence beam at 20∘ C | ||
Sodium observations are recorded in on-band/off-band pairs for five minutes and one minute, respectively, every 30 minutes. On- and off-band images of the Io plasma torus in [S II] 6731 Å are recorded on a 6-minute cadence in the intervals between the Na observations and will be reported in another work.
3 Data Reduction
Because the sodium nebula is a field-filling source for our FOV, we take some care in reducing the data. This starts with the bias and dark subtraction of our on- and off-band images. The IPT is a much smaller target than the sodium nebula, so as a cost-savings measure, we used 32 mm diameter [S II] on- and off-band filters compared to the 50 mm Na filters. The small [S II] filter diameters enabled us to use pixels on the edges of the [S II] FOVs, to construct a near continuous record of the combined effects of bias and dark current through each night. These values were interpolated in time and subtracted from the Na on- and off-band images.
Sky flats show that white light vignetting is 10% starting beyond the region we use for our analyses, so we ignore the effect. Similarly, we ignore small-scale variation in biases, flats, and darks since our primary results are derived by averaging over large areas of pixels.
After bias and dark subtraction, we subtract the off-band image recorded closest in time from each on-band image. A factor, OFFSCALE, is multiplied by each off-band image. OFFSCALE is the product of the flux in the central 1010 pixel () areas of Jupiter in the on- and off-band images times. An additional factor of 0.80 is applied to remove over-subtraction consistently seen in the images. OFFSCALE typically varies by 20% each night and there was a systematic drop of 20% during April attributable to improvements we were making in the guiding system: because on-band images have longer exposure times than off-band, improved guiding reduced smearing of Jupiter preferentially in the on-band images, hence raising OFFSCALE. We show in §5 that the systematic change in OFFSCALE has no effect on our results.
We derive a factor, ADU2R, to convert pixel values to the surface brightness unit of rayleighs (R) where 1 R = photons s-1 cm-1 sr-1:
| (1) |
Here, is the average pixel value of the pixel box centered on Jupiter in the on-band images. This area represents pixels within of the center of Jupiter. ND is the attenuation factor provided by our neutral density filter. R-band measurements of GSC5017:78 on 2018-03-20UT show ND = . is the surface brightness of Jupiter over our 12 Å-wide bandpass on-band filter. To account for the deep sodium Fraunhofer absorption lines, this is calculated using Jovian albedos from Woodman et al. (1979) and Karkoschka (1998, see also PDS: ESO-J/S/N/U-SPECTROPHOTOMETER-4-V2.0) and the Kurucz (2005) solar flux atlas. varied from 52.6 MR to 54 MR over the IoIO observations.
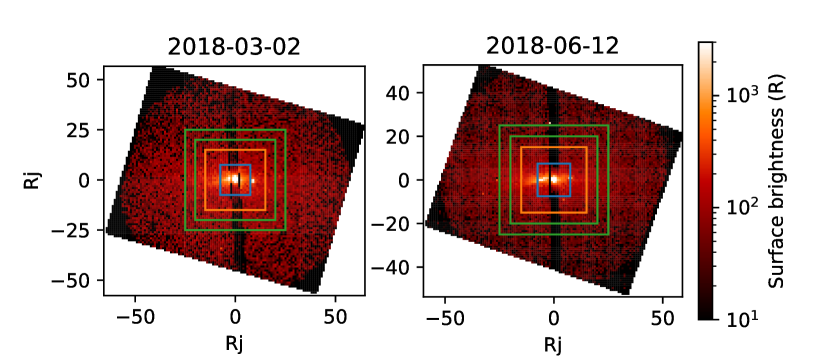
Figure 1 shows two of the over 700 images of the sodium nebula recorded by IoIO and processed as described above. Data were recorded on over 150 nights between IoIO commissioning in March 2017 and the end of the Jovian opposition in July 2018. Subsequent work will address the “banana,” “jet,” and “stream” features described in the caption of Figure 1. For our current work, we concentrate on the diffuse emission in the images, which can be studied using the surface brightness in various apertures centered on Jupiter. In §4 and Figure 2, we present the time evolution of these surface brightness values to show that there was a large modulation in the emission detected by IoIO during the 2018 Jovian opposition. In §5, we demonstrate that this emission was from the Jovian sodium nebula.
4 Results
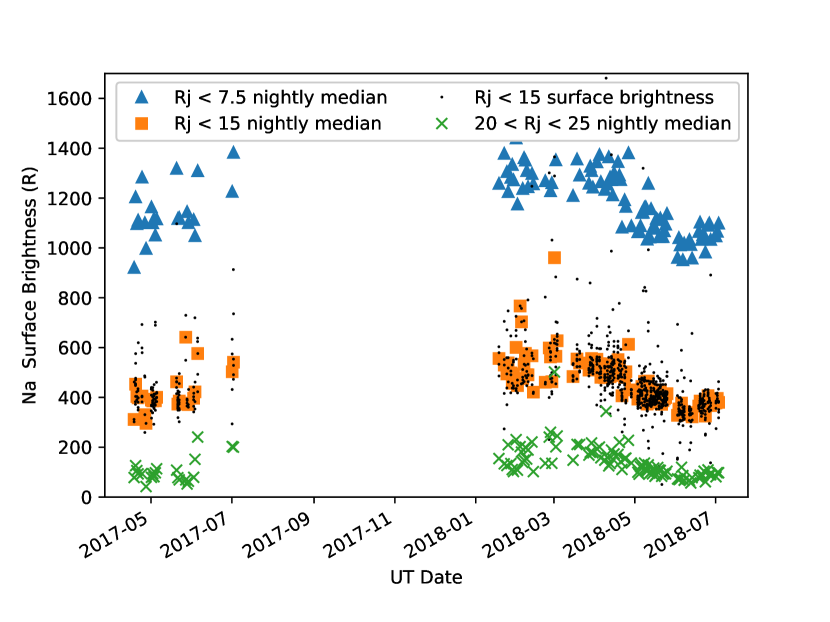
Figure 2 shows that there was a significant and long-lasting enhancement in emission detected by IoIO during the 2018 Jovian opposition. The Figure shows via large colored triangles, squares and Xs, the nightly medians of the average surface brightnesses within the three regions indicated by colored squares in Figure 1. All of the surface brightness measurements for one of the apertures are shown as small black dots. the enhancement bears the mark of modulation in brightness of a centrally peaked source because the more centrally concentrated apertures have larger modulations as a function of time.
5 Discussion
As discussed in §2–§3, IoIO does not see to the edge of the Jovian sodium nebula. Furthermore, sky background observations away from Jupiter were not systematically recorded. Thus, we must take some care in our analyses to ensure we are detecting modulation in the Jovian sodium nebula and not some other source.
The first factor we consider which could possibly contribute to the long-term modulation seen in Figure 2 is improper subtraction of the continuum light recorded in our on-band images. This is particularly concerning given the systematic change in OFFSCALE noted in §3. We rule out this concern in several ways. First, the change in OFFSCALE occurred more abruptly in April compared to the decline see in Figure 2. Second, we reversed the sense of the long-term change in OFFSCALE and re-processed images in March and June and found that the March aperture surface brightness values were still higher than the June. Perhaps most convincingly, we create plots like Figure 2 using our on-band and off-band images separately. These plots show more scatter than Figure 2, but the on-band plot already shows the trend seen in Figure 2. The off-band plot shows no long-term trend. These observations confirm that our background subtraction is reasonable and that the modulation seen in Figure 2 comes from line emission and not continuum emission in the on-band filter bandpass.
Next we consider the response of IoIO to the primary source of sodium emission other than the Jovian sodium nebula: the Earth’s mesospheric sodium layer. This layer is formed from the ablation of meteors. Its thickness has seasonal dependence in the same sense as the modulation seen in Figure 2 (e.g., Dunker et al., 2015, their Figure 4), which is why it is of concern for our analyses. Mesospheric sodium also has a diurnal variation because it is excited by photochemical processes local to the layer (e.g., Kirchhoff et al., 1979). In contrast to this, the Jovian sodium nebula has negligible nightly modulation over the km region covered by the IoIO FOV. Thus, by considering our data on a night-by-night basis, we can probe the response of IoIO to a uniform field-filling source without interference from the nebula. The black dots in Figure 2 show the extent of the nightly modulations for the aperture fall within the 40 R – 200 R range seen at other locations. Larger excursions, are due to passing clouds. Nightly variations in emission in all the apertures are highly correlated with correlation coefficients tending to one, as expected for variation in a uniform, field filling source. Thus, we simultaneously confirm with the IoIO data themselves the design criterion that IoIO’s detection efficiency is flat as a function of position (§2) and that seasonal modulation of a field-filling source would result in equal responses in all the apertures. We show in the next paragraph, this is not what is seen in Figure 2 .
To demonstrate that IoIO detected modulation in the brightness of the Jovian sodium nebula, we point out that the curve for each aperture in Figure 2 has a unique shape. the more centrally concentrated apertures have larger amplitudes. This is the signature of modulation in the brightness of a centrally peaked source. The baseline values for our inner (), middle (), and outer () apertures are R, R, and R, respectively. The peak amplitudes of the middle and inner apertures are factors of 1.5 and 2.2 higher than the outer aperture, respectively. After removal of their respective baselines and scaling, the curves from the three apertures are in good agreement. Were we seeing seasonal modulation in the telluric sodium layer, the amplitudes would all have the same values in the same way This is our most convincing evidence that we are detecting modulation in the Jovian sodium nebula.
Although we have ruled out mesospheric emission as the cause of the long-term modulation seen in Figure 2 , we cannot rule out its contribution as a relatively stable background. In fact, we expect it. As discussed above, we did not record systematic sky background measurements, so this is not something that we can estimate independently. Instead, we compare the measured surface brightness in our outer aperture during the nebula’s quiescent state to the surface brightness of inner aperture used by Yoneda et al. (2009) during similarly quiet conditions. Both these apertures correspond to . As quoted above, the baseline in our outer aperture is R. The mesosphere-subtracted value quoted by Yoneda et al. (2009) is 20 R – 30 R. This suggests that 50 R – 60 R of our emission is mesospheric, which is comparable to baseline values measured by this team at other locations.
6 Conclusion
With our detection of such a long-lasting event during the first half of the 2018 Jovian opposition, other observations may be placed in context. This is particularly important for observations conducted by Juno, large-aperture observatories, and HST, which themselves do not have synoptic coverage comparable to IoIO and were therefore not able to independently detect this event. For instance, our team regularly conducts observations of the IPT with the ARC 3.5 m telescope at Apache Point Observatory (Schmidt et al., 2018). In May 2018, these were seen to be the brightest recorded by this facility. Preliminary reduction of our IoIO [S II] images also shows evidence that the overall brightness of the IPT follows a similar envelope to that observed by Brown & Bouchez (1997) during the volcanic event they saw (§1). EUV observations of the IPT by Hisaki over this time period should be brighter than normal and show chemical and periodicity changes similar to those seen by Steffl et al. (2008) and Kimura et al. (2018) after volcanic events. We predict the neutral oxygen cloud around Jupiter, detectable with the Hisaki satellite (Koga et al., 2018a, b), will show higher values than found previously. Finally, higher than average auroral activity on Jupiter should be detected by in situ measurements from the JUNO/JADE instrument; in the UV by Juno/UVS, Hisaki, and HST; in the infrared by Juno/JIRAM and ground-based infrared telescopes; and in the radio by Juno/WAVES and ground-based radio telescopes such as the Nançay Decametric Array (e.g., McComas et al., 2017; Gladstone et al., 2017; Kimura et al., 2015; Kita et al., 2016; Kurth et al., 2017; Radioti et al., 2013; Marques et al., 2017).
References
- Astropy Collaboration et al. (2013) Astropy Collaboration, Robitaille, T. P., Tollerud, E. J., et al. 2013, Astron. Astrophys., 558, A33, doi: 10.1051/0004-6361/201322068
- Brown & Bouchez (1997) Brown, M. E., & Bouchez, A. H. 1997, Sci, 278, 268, doi: 10.1126/science.278.5336.268
- Brown & Chaffee (1974) Brown, R. A., & Chaffee, Jr., F. H. 1974, Astrophys. J., Lett., 187, L125, doi: 10.1086/181413
- Craig et al. (2015) Craig, M. W., Crawford, S. M., Deil, C., et al. 2015, ccdproc: CCD data reduction software, Astrophysics Source Code Library. http://ascl.net/1510.007
- de Kleer & de Pater (2016) de Kleer, K., & de Pater, I. 2016, Icarus, 280, 378, doi: 10.1016/j.icarus.2016.06.019
- de Kleer et al. (2016) de Kleer, K., de Pater, I., & Yoneda, M. 2016, AGU Fall Meeting Abstracts, P21E
- de Pater et al. (2017) de Pater, I., de Kleer, K., Davies, A. G., & Ádámkovics, M. 2017, Icarus, 297, 265, doi: 10.1016/j.icarus.2017.03.016
- Dunker et al. (2015) Dunker, T., Hoppe, U.-P., Feng, W., Plane, J. M. C., & Marsh, D. R. 2015, Journal of Atmospheric and Solar-Terrestrial Physics, 127, 111, doi: 10.1016/j.jastp.2015.01.003
- Ginsburg et al. (2013) Ginsburg, A., Robitaille, T., Parikh, M., et al. 2013, Astroquery v0.1, figshare, doi: 10.6084/m9.figshare.805208.v2. https://figshare.com/articles/Astroquery_v0_1/805208/2
- Gladstone et al. (2017) Gladstone, G. R., Persyn, S. C., Eterno, J. S., et al. 2017, Space Science Reviews, 213, 447, doi: 10.1007/s11214-014-0040-z
- Harris Geospatial Solutions (2018) Harris Geospatial Solutions. 2018, The Interactive Data Language. https://www.harrisgeospatial.com
- Hunter (2007) Hunter, J. D. 2007, Computing In Science & Engineering, 9, 90, doi: 10.1109/MCSE.2007.55
- Jessup & Spencer (2012) Jessup, K. L., & Spencer, J. R. 2012, Icarus, 218, 378, doi: 10.1016/j.icarus.2011.11.013
- Johnson et al. (1995) Johnson, T. V., Matson, D. L., Blaney, D. L., Veeder, G. J., & Davies, A. 1995, Geophys. Res. Lett., 22, 3293, doi: 10.1029/95GL03084
- Karkoschka (1998) Karkoschka, E. 1998, Icarus, 133, 134, doi: 10.1006/icar.1998.5913
- Kimura et al. (2015) Kimura, T., Badman, S. V., Tao, C., et al. 2015, Geophys. Res. Lett., 42, 1662, doi: 10.1002/2015GL063272
- Kimura et al. (2018) Kimura, T., Hiraki, Y., Tao, C., et al. 2018, J. Geophys. Res., 123, 1885, doi: 10.1002/2017JA025029
- Kirchhoff et al. (1979) Kirchhoff, V. W. J. H., Clemesha, B. R., & Simonich, D. M. 1979, J. Geophys. Res., 84, 1323, doi: 10.1029/JA084iA04p01323
- Kita et al. (2016) Kita, H., Kimura, T., Tao, C., et al. 2016, Geophys. Res. Lett., 43, 6790, doi: 10.1002/2016GL069481
- Kliore et al. (1975) Kliore, A. J., Fjeldbo, G., Seidel, B. L., et al. 1975, Icarus, 24, 407, doi: 10.1016/0019-1035(75)90057-3
- Koga et al. (2018a) Koga, R., Tsuchiya, F., Kagitani, M., et al. 2018a, Icarus, 299, 300, doi: 10.1016/j.icarus.2017.07.024
- Koga et al. (2018b) —. 2018b, J. Geophys. Res., 123, 3764, doi: 10.1029/2018JA025328
- Krüger et al. (2003) Krüger, H., Geissler, P., Horányi, M., et al. 2003, Geophys. Res. Lett., 30, 210000, doi: 10.1029/2003GL017827
- Kupo et al. (1976) Kupo, I., Mekler, Y., & Eviatar, A. 1976, Astrophys. J., Lett., 205, L51, doi: 10.1086/182088
- Kurth et al. (2017) Kurth, W. S., Hospodarsky, G. B., Kirchner, D. L., et al. 2017, Space Science Reviews, 213, 347, doi: 10.1007/s11214-017-0396-y
- Kurucz (2005) Kurucz, R. L. 2005, Memorie della Societa Astronomica Italiana Supplement, 8, 14
- Marques et al. (2017) Marques, M. S., Zarka, P., Echer, E., et al. 2017, Astron. Astrophys., 604, A17, doi: 10.1051/0004-6361/201630025
- McComas et al. (2017) McComas, D. J., Alexander, N., Allegrini, F., et al. 2017, Space Science Reviews, 213, 547, doi: 10.1007/s11214-013-9990-9
- McGrath et al. (2004) McGrath, M. A., Lellouch, E., Strobel, D. F., Feldman, P. D., & Johnson, R. E. 2004, Satellite atmospheres, ed. F. Bagenal, T. E. Dowling, & W. B. McKinnon (Cambridge: Cambridge University Press), 457–483
- Mendillo et al. (1990) Mendillo, M., Baumgardner, J., Flynn, B., & Hughes, W. J. 1990, Nature, 348, 312, doi: 10.1038/348312a0
- Mendillo et al. (2004) Mendillo, M., Wilson, J., Spencer, J., & Stansberry, J. 2004, Icarus, 170, 430, doi: 10.1016/j.icarus.2004.03.009
- Morabito et al. (1979) Morabito, L. A., Synnott, S. P., Kupferman, P. N., & Collins, S. A. 1979, Sci, 204, 972, doi: 10.1126/science.204.4396.972
- Morgenthaler & Morgenthaler (2019) Morgenthaler, D. R., & Morgenthaler, J. P. 2019, Python aliases and shortcuts, v1.0.1, Zenodo, doi: 10.5281/zenodo.2535735. https://doi.org/10.5281/zenodo.2535735
- Morgenthaler (2019) Morgenthaler, J. P. 2019, Io Input/Output facility (IoIO) control, reduction, and analysis software, v1.0.1, Zenodo, doi: 10.5281/zenodo.2535838. https://doi.org/10.5281/zenodo.2535838
- Morgenthaler et al. (2019) Morgenthaler, J. P., Rathbun, J. A., Schmidt, C. A., Baumgardner, J., & Schneider, N. M. 2019, Io Input/Output (IoIO) aperture sum data file, v1.0, Zenodo, doi: 10.5281/zenodo.2535920. https://doi.org/10.5281/zenodo.2535920
- Nozawa et al. (2004) Nozawa, H., Misawa, H., Takahashi, S., et al. 2004, J. Geophys. Res., 109, 7209, doi: 10.1029/2003JA010241
- Oliphant (2006) Oliphant, T. E. 2006, Guide to NumPy (Provo: Trelgol Publishing)
- Radioti et al. (2013) Radioti, A., Lystrup, M., Bonfond, B., Grodent, D., & Gérard, J.-C. 2013, J. Geophys. Res., 118, 2286, doi: 10.1002/jgra.50245
- Rathbun & Spencer (2006) Rathbun, J. A., & Spencer, J. R. 2006, Geophys. Res. Lett., 33, L17201, doi: 10.1029/2006GL026844
- Schmidt et al. (2018) Schmidt, C., Schneider, N., Leblanc, F., et al. 2018, J. Geophys. Res., 123, 5610, doi: 10.1029/2018JA025296
- Schneider & Bagenal (2007) Schneider, N. M., & Bagenal, F. 2007, Io’s neutral clouds, plasma torus, and magnetospheric interaction (Berlin, Heidelberg: Springer Praxis Books / Geophysical Sciences), 265–286
- Schneider et al. (1991) Schneider, N. M., Wilson, J. K., Trauger, J. T., et al. 1991, Sci, 253, 1394, doi: 10.1126/science.253.5026.1394
- Sinton (1980) Sinton, W. M. 1980, Icarus, 43, 56, doi: 10.1016/0019-1035(80)90087-1
- Steffl et al. (2006) Steffl, A. J., Delamere, P. A., & Bagenal, F. 2006, Icarus, 180, 124, doi: 10.1016/j.icarus.2005.07.013
- Steffl et al. (2008) —. 2008, Icarus, 194, 153, doi: 10.1016/j.icarus.2007.09.019
- Tummers (2006) Tummers, B. 2006, DataThief III. https://datathief.org/
- van der Walt et al. (2014) van der Walt, S., Schönberger, J. L., Nunez-Iglesias, J., et al. 2014, PeerJ, 2, e453, doi: 10.7717/peerj.453
- Wilson et al. (2002) Wilson, J. K., Mendillo, M., Baumgardner, J., et al. 2002, Icarus, 157, 476, doi: 10.1006/icar.2002.6821
- Witteborn et al. (1979) Witteborn, F. E., Bregman, J. D., & Pollack, J. B. 1979, Sci, 203, 643, doi: 10.1126/science.203.4381.643
- Woodman et al. (1979) Woodman, J. H., Cochran, W. D., & Slavsky, D. B. 1979, Icarus, 37, 73, doi: 10.1016/0019-1035(79)90116-7
- Yoneda et al. (2009) Yoneda, M., Kagitani, M., & Okano, S. 2009, Icarus, 204, 589, doi: 10.1016/j.icarus.2009.07.023
- Yoneda et al. (2015) Yoneda, M., Kagitani, M., Tsuchiya, F., Sakanoi, T., & Okano, S. 2015, Icarus, 261, 31, doi: 10.1016/j.icarus.2015.07.037
- Yoneda et al. (2010) Yoneda, M., Nozawa, H., Misawa, H., Kagitani, M., & Okano, S. 2010, Geophys. Res. Lett., 37, 11202, doi: 10.1029/2010GL043656
- Yoneda et al. (2014) Yoneda, M., Miyata, T., Tsang, C. C. C., et al. 2014, Icarus, 236, 153, doi: 10.1016/j.icarus.2014.01.019