ALMA photometry of extragalactic radio sources
Abstract
We present a new catalogue of ALMA observations of 3,364 bright, compact radio sources, mostly blazars, used as calibrators. These sources were observed between May 2011 and July 2018, for a total of 47,115 pointings in different bands and epochs. We have exploited the ALMA data to validate the photometry given in the new Planck Multi-frequency Catalogue of Non-thermal sources (PCNT), for which an external validation was not possible so far. We have also assessed the positional accuracy of Planck catalogues and the PCNT completeness limits, finding them to be consistent with those of the Second Planck Catalogue of Compact Sources. The ALMA continuum spectra have allowed us to extrapolate the observed radio source counts at 100 GHz to the effective frequencies of ALMA bands 4, 6, 7, 8 and 9 (145, 233, 285, 467 and 673 GHz, respectively), where direct measurements are scanty, especially at the 3 highest frequencies. The results agree with the predictions of the Tucci et al. model C2Ex, while the model C2Co is disfavoured.
keywords:
Radio sources: statistics – Galaxies: active – AGN: radio continuum – submillimetre: galaxies1 Introduction
Although a substantial progress on the characterization of millimeter and sub-millimeter properties of extragalactic radio sources has been made in recent years mainly thanks to surveys with the Wilkinson Microwave Anisotropy Probe (WMAP; Bennett et al., 2013), the Planck satellite (Planck Collaboration XXVI, 2016; Planck Collaboration Int. LIV, 2018), the South Pole Telescope (SPT; Mocanu et al., 2013) and the Atacama Cosmology Telescope (ACT; Marsden et al., 2014), the available information is still limited.
However, an unprecedented amount of multi-frequency and multi-epoch photometric data on radio sources in this spectral region is being provided by the Atacama Large Millimeter/submillimeter Array (ALMA). This is because ALMA uses mm/sub-mm bright compact radio sources as calibrators to fix the flux density scale, to determine the bandpass response, and to calibrate amplitude and phase of the visibilities of the science targets. Observations of calibrator sources (mainly point-like sources) are made for every science project. Each calibrator is generally observed several times, in connection with different targets, on different days, in various bands and array configurations.
Bonato et al. (2018) have published a catalogue of ALMA flux density measurements of 754 calibrators for a total of 16,263 observations in different bands and epochs (ALMACAL catalogue). These flux densities were uniformly measured from a collection of ALMA images, thus obtaining robust measurements for both resolved and non-resolved sources. The calibration and imaging analyses are described in Bonato et al. (2018). Almost all sources (97%) were found to be blazars.
Combining such catalogue with the “ALMA Calibrator Source Catalogue” (ACSC)111Available at https://almascience.eso.org/sc/, we have collected ALMA observations for 3,364 bright, (mostly) compact radio sources. These sources were observed between May 2011 and July 2018, for a total of 47,115 observations in different bands and epochs. We have 25,907 observations of 3,310 different sources in band 3 (84116 GHz), 671 observations of 171 sources in band 4 (125163 GHz), 8,467 observations of 885 sources in band 6 (211275 GHz), 11,415 observations of 2,201 sources in band 7 (275373 GHz), 394 observations of 88 sources in band 8 (385500 GHz), 253 observations of 59 sources in band 9 (602720 GHz) and 8 observations of 6 sources in band 10 (787950 GHz).
The combined catalogue, referred to as the ALMA Calibrator Catalogue (ACC), contains the ALMA name of the source, its classification, redshift (when available), equatorial coordinates (J2000), flux density measurements with their uncertainties, effective observing frequency, date and time of observations. One example of the information provided is in Table 1.
A search of the literature has yielded redshifts for 2245 sources (67%). About 41% (1391) of our sources are listed in the 5th edition of the Roma Multi-frequency Catalogue of Blazars222http://www.ssdc.asi.it/bzcat/ (BZCAT; Massaro et al., 2009) where they are classified into 5 sub-classes: FSRQs, BL Lacs, BL Lacs-galaxy dominated, Blazars of uncertain type, BL Lac candidates. We have classified the remaining objects following Bonato et al. (2018).
The uncertainties on ALMA flux densities are essentially given by the calibration uncertainty, whose value is still being debated within the ALMA community. An accurate calibration is difficult to achieve due to variability of the emissive and absorptive properties of the Earth’s atmosphere and to the lack of astronomical sources that could serve as accurate flux standards. Following Bonato et al. (2018) we adopt at 5% calibration uncertainty for ALMACAL sources. This value was found to be consistent with the median absolute differences among measurements in Bands 3 and 6 within short time-spans (30 d in the source frame), expected to be only weakly affected by variability (see Sect. 4 of Bonato et al., 2018).
We have made a similar check on ACSC sources. We selected observations within 30 d in the source frame. For this time span we found median absolute differences of 6% for Bands 3 and 6, and of 8% for Band 7. There are no multiple measurements within this time span in Bands 4, 8 and 9, so that no estimates could be obtained. These somewhat larger uncertainties for ACSC compared to ALMACAL sources may be due to the fact that the flux densities of the latter sources were uniformly measured from a collection of ALMA images. The measured differences are however consistent with the uncertainties given in the ACSC, taking into account that outliers are to be expected since blazars show variability also on short timescales. We have therefore adopted the ACSC uncertainties.
. ALMA name Class.1 z RA [deg] DEC [deg] Flux density [Jy] Uncert. [Jy] band [GHz] Date of obs.2 J2148+0657 1 0.89 327.0227 6.9607 2.0900 0.1000 3 98.21 2012-06-30T00:00:00 1.9400 0.1000 3 109.74 2012-06-30T00:00:00 1.9900 0.1000 3 98.21 2012-07-29T00:00:00 1.8400 0.1100 3 109.74 2012-07-29T00:00:00 1.9500 0.2200 3 106.25 2012-08-04T00:00:00 2.0900 0.2100 3 94.35 2012-08-04T00:00:00 1.9900 0.0500 3 98.21 2012-08-09T00:00:00 1.8600 0.0500 3 109.74 2012-08-09T00:00:00 1.9700 0.0600 3 98.21 2012-08-31T00:00:00 1.8500 0.0700 3 109.74 2012-08-31T00:00:00 1.9500 0.0400 3 98.21 2012-09-01T00:00:00 1.8400 0.0500 3 109.74 2012-09-01T00:00:00 1.8500 0.1100 3 106.25 2012-09-02T00:00:00 1.9900 0.1300 3 94.35 2012-09-02T00:00:00 1.9000 0.1400 3 106.25 2012-09-02T00:00:00 2.0300 0.1400 3 94.35 2012-09-02T00:00:00 1.8800 0.0900 3 99.2 2012-10-06T00:00:00 1.7300 0.0900 3 108.76 2012-10-06T00:00:00 1.0100 0.0500 6 221.0 2012-10-06T00:00:00 0.6600 0.0300 7 343.25 2012-10-06T00:00:00 1.9100 0.0300 3 98.21 2012-10-18T00:00:00 1.7800 0.0500 3 109.74 2012-10-18T00:00:00 1.9000 0.0700 3 98.21 2012-10-21T00:00:00 1.7700 0.0800 3 109.74 2012-10-21T00:00:00 2.0100 0.0300 3 98.21 2012-11-06T00:00:00 1.9000 0.0400 3 109.74 2012-11-06T00:00:00 1.9900 0.0300 3 98.21 2012-11-17T00:00:00 1.8700 0.0400 3 109.74 2012-11-17T00:00:00 1.9100 0.0500 3 109.74 2013-05-11T00:00:00 1.9900 0.0300 3 98.21 2013-05-11T00:00:00 2.1566 0.1078 3 91.8551 2013-05-31T09:07:08 … … … … … … … … … … Notes. 1 Classification: 1=Flat-spectrum radio quasar (FSRQ); 2=BL Lac; 3=BL Lac-galaxy dominated; 4=Blazar uncertain type; 5=BL Lac candidate; 6=Steep spectrum; 7=Uncertain. 2 Observing date and time in the ISO standard format [YYYY-MM-DDThh:mm:ss], UTC time. Observations taken from the “ALMA Calibrator Source Catalogue”, for which time information is not available, appear with time “00:00:00”
In this paper we exploit the ACC catalogue for two purposes. In Sect. 2 we use ALMA photometry to validate the new flux density estimates presented in the Planck multi-frequency Catalogue of Non-Thermal sources (PCNT; Planck Collaboration Int. LIV, 2018), and to assess the Planck completeness limits and positional accuracy. So far, only an internal validation was possible and was indeed performed.
Next, we exploit the multifrequency ALMA measurements to estimate the distribution of flux density ratios between Band 3 and higher frequency bands. Such distributions allow us to extrapolate the observed 100 GHz source counts to higher frequencies where direct measurements are quite limited or missing (Sect. 3). Finally in Sect. 4 we present our main conclusions.
2 Validation of the Planck Multi-frequency Catalogue of Non-thermal Sources
| Planck [GHz] | PCCS2 90% | PCNT 90% | PCNT 100% | H-ATLAS 90% | H-ATLAS 100% |
| completeness | completeness | completeness | completeness | completeness | |
| [mJy] | [mJy] | [mJy] | [mJy] | [mJy] | |
| 100 | 269 | 266 | 562 | ||
| 143 | 177 | 312 | 562 | ||
| 217 | 152 | 170 | 316 | ||
| 353 | 304 | 296 | 1000 | ||
| 545 | 555 | 597 | 1585 | ||
| 857 | 791 | 650 | 760 |
The PCNT was built performing a multi-frequency analysis using the “Matrix Filters” (MTFX) methodology (see Herranz & Sanz 2008; Herranz et al. 2009) at the positions of sources detected by the Mexican Hat Wavelet 2 algorithm (González-Nuevo et al., 2006; López-Caniego et al., 2006) in the full mission all-sky temperature maps333The time frame of these data is 2.5 years. with a signal-to-noise ratio (SNR) larger than 3 at either 30 and 143 GHz. The MTFX yielded flux densities and uncertainties in all nine Planck channels. This multifrequency approach has made it possible to reach deeper detection limits, at given SNR, than the Second Planck Catalogue of Compact Sources (PCCS2; Planck Collaboration XXVI, 2016) which contains sources detected in each frequency channel separately.
So far the MTFX photometry could be validated only by comparison with flux densities reported in the PCCS2, complemented with a statistical check made comparing the number counts of catalogued sources with models. But PCCS2 estimates for PCNT sources are generally missing above 217 GHz. Moreover the amount of external data available to validate them was quite limited, particularly at mm and sub-mm wavelengths.
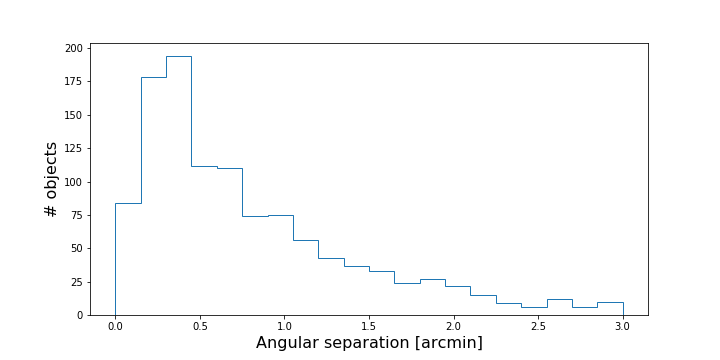
To check the MTFX photometry up to high frequencies we cross-matched the ACC with the PCNT outside the GAL070 mask, i.e. excluding the of the sky more heavily contaminated by Galactic emissions. We used a search radius of , more than a factor of 3 larger than the estimated positional uncertainties of Planck sources (, see tables 5 and 6 of Planck Collaboration XXVI, 2016). As illustrated by Fig. 1, this positional uncertainty estimate is confirmed by the comparison between ALMA and Planck positions. The positional differences peak at and have a standard deviation . The distribution is however strongly asymmetric with an extended tail towards separations of a few arcmin. This tail slightly decreases if sources below the PCCS2 90% completeness limits are excluded.
We found unique Planck counterparts with for 1,120 out of the 3,364 ALMA calibrators. Specifically, we found 1,069 counterparts (out of 3,310 calibrators) at 100 GHz, 100 (out of 171) at 143 GHz, 455 (out of 885) at 217 GHz and 439 (out of 2,201) at 353 GHz. Moreover, 60 sources with ALMA measurements in band 8 or 9 have Planck counterparts at 545 GHz. Obviously there is a large overlap among sources observed in the different ALMA bands.
The mean surface density of PCNT sources outside the GAL070 mask is , so that the probability that a PCNT source lies by chance within of an ALMA source is . Thus the expected number of spurious associations is , i.e. of Planck counterparts.
| N. ALMA band | Charact. [GHz] | N. sources | ||
|---|---|---|---|---|
| 4 | 145 | 164 | 0.11 | 0.10 |
| 6 | 233 | 859 | 0.25 | 0.14 |
| 7 | 285 | 2102 | 0.37 | 0.17 |
| 8 | 467 | 87 | 0.35 | 0.18 |
| 9 | 673 | 58 | 0.41 | 0.23 |
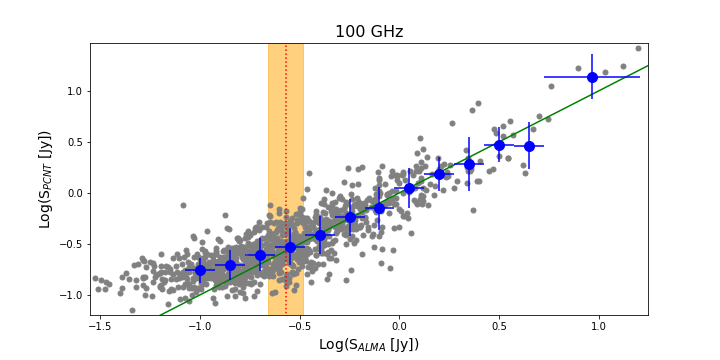
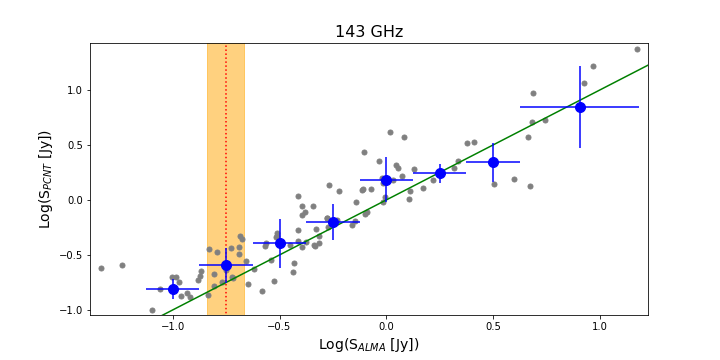
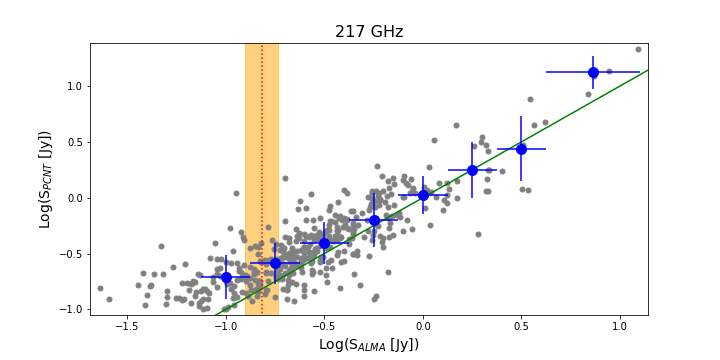
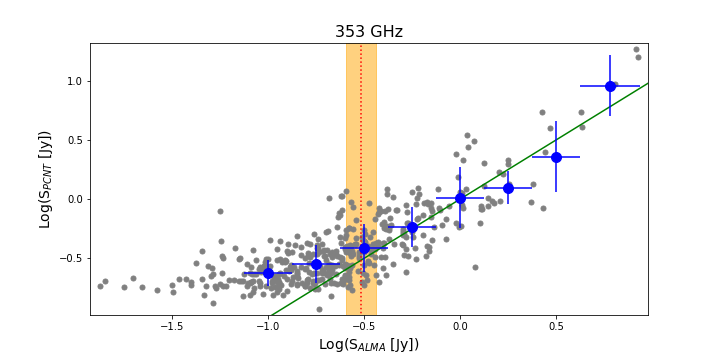
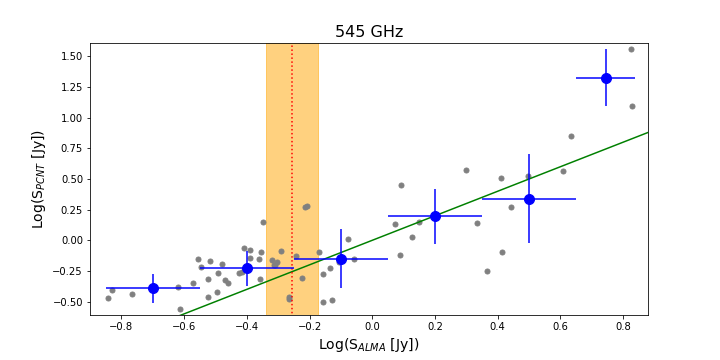
MTFX flux density estimates at 100, 143, 217 and 353 GHz were compared to ALMA flux densities in Band 3, 4, 6 and 7, respectively. The small differences of effective frequencies between Bands 3, 4 and 6 and the nearest Planck channels were neglected. Band 7 flux densities were converted to 353 GHz with , using the mean spectral index of our sources between Bands 6 and 8. The Planck 545 GHz channel is intermediate in frequency to ALMA Bands 8 and 9. We have extrapolated ALMA flux densities in these bands to 545 GHz adopting the mean spectral index of our ALMA sources between these bands, i.e. with . In any case, the extrapolations in frequency are quite small and the spectral indices are relatively flat so that the results are only weakly affected by chosen values.
For most sources we have several ALMA observations in each band. The comparison with PCNT flux densities was made using the mean values and adopting the standard deviation, summed in quadrature with the calibration uncertainty, as an estimate of the uncertainty.
The results for Planck channels from 100 to 545 GHz are illustrated by Fig. 2. At the faintest flux density levels, the MTFX photometry is affected by the Eddington bias (Eddington, 1913; Hogg & Turner, 1998), which accounts for the increase of the Planck/ALMA flux density ratio with decreasing flux density. Above the PCCS2 90% completeness limits (vertical dotted red lines) we find good consistency between the MTFX and the ALMA photometry. The large dispersion of flux density ratios (typically ) can be entirely ascribed to variability444Blazars are known to be strongly variable and Planck and ALMA measurements are non-simultaneous. Planck flux densities are averages over the five full sky surveys with the High Frequency Instrument (HFI) from 2009 August 12 to 2012 January 11. ALMA observations are distributed between May 2011 and July 2018. plus measurement uncertainties, mostly on the Planck side. In particular, the few sources in the brightest luminosity bin have most likely been caught by Planck in a flaring phase555Variability affects the Planck/ALMA comparison at all flux density levels. In well populated flux density bins its main effect is to increase the dispersion of flux density ratios. The highest luminosity bins, however, contain only a few sources whose mean flux density can be dominated by extreme outbursts increasing flux densities by factors of ten or more. This is the simplest explanation of anomalously high Planck/ALMA ratios such as the one in the brightest bin at 545 GHz of Fig. 2. This bin contains only two sources, measured with high signal-to-noise ratio both by Planck and by ALMA, so that the difference must be real..
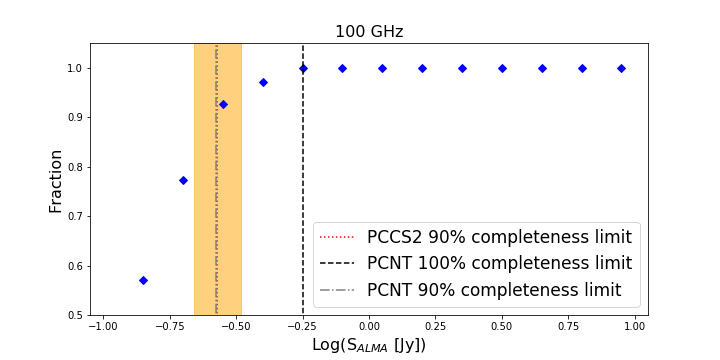
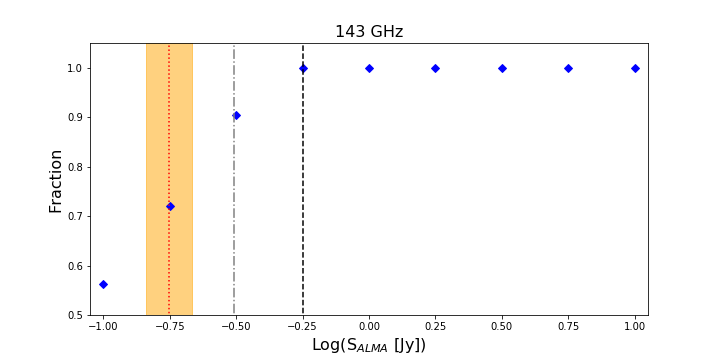
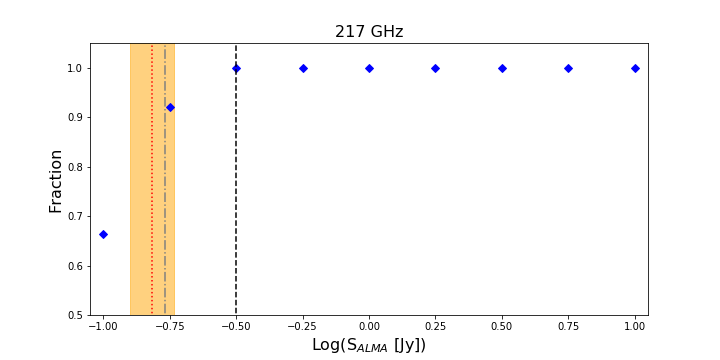
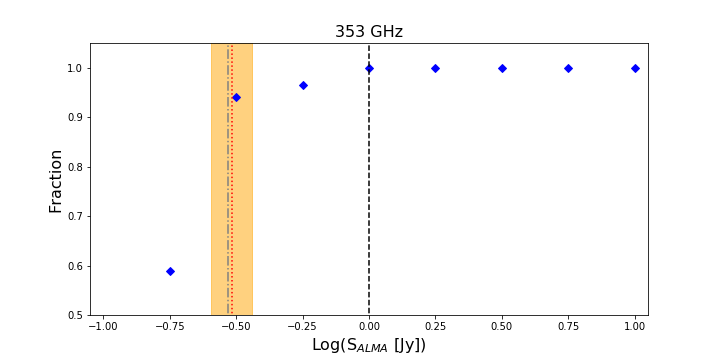
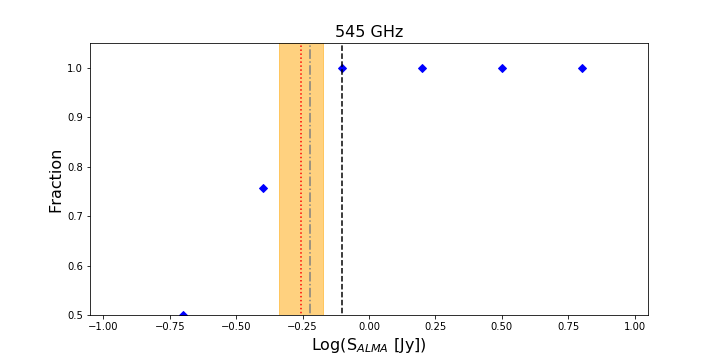
The completeness of the PCNT catalog at each frequency GHz was tested by looking at the fraction of ACC objects having PCNT counterparts with as a function of the ALMA flux density. The results are shown in Table 2 and in Fig. 3. At 100, 217, 353 and 545 GHz our results are in excellent agreement with the estimates of the 90% completeness limits given by Planck Collaboration XXVI (2016).
At 143 GHz the ALMA data suggest a significantly higher PCNT limit, but with limited statistics (only 100 sources unevenly distributed among flux density bins, to be compared with 1,069 sources at 100 GHz, 455 at 217 GHz and 439 at 353 GHz). To assess the significance of the discrepancy we have performed 10,000 simulations of Planck observations of the 100 ALMA calibrators. These simulations were carried out randomly extracting each source from a Gaussian distribution with mean value equal to its ALMA flux density and dispersion equal to the mean PCNT uncertainty of those with a PCNT counterpart (36 mJy). A 90% completeness limit within the uncertainty of the PCCS2 value was found in 10% of the cases, implying that the discrepancy is only marginally significant. We have also checked whether the difference of the completeness limits may be due to the different photometric estimators used for the PCCS2 and the PCNT (although the two photometries were shown to be, on average, in good agreement by Planck Collaboration Int. LIV 2018). To this end we have estimated the PCCS2 completeness levels in the same way as we did for the PCNT. The results did not change significantly.
At 857 GHz, the poor statistics (only 4 calibrators with ALMA band 10 flux density measurements have PCNT counterparts) hampers a reliable estimate. However, an indication that the high frequency PCCS2 completeness limits are conservative was provided by the cross-match of the Herschel Astrophysical Terahertz Large Area Survey (H-ATLAS) with the PCCS2 catalogue (Maddox et al., 2018). These authors found PCCS2 90% completeness limits of mJy at 857 GHz (m). For comparison the PCCS2 estimate of the corresponding 90% completeness limits is of 791 mJy. Using their catalogues, we further derived the 100% PCCS2 completeness limits to be of 760 mJy at this frequency.
These results indicate that, although the MTFX approach reaches, at fixed SNR, fainter flux densities than the single frequency approach adopted for the PCCS2, and therefore the PCNT contains substantially more radio sources666The total number of PCCS2 sources at high frequencies is higher because it includes also dusty galaxies, while the PCNT contains, by construction, only radio sources., the completeness limits remain essentially unchanged.
3 High frequency number counts of radio sources
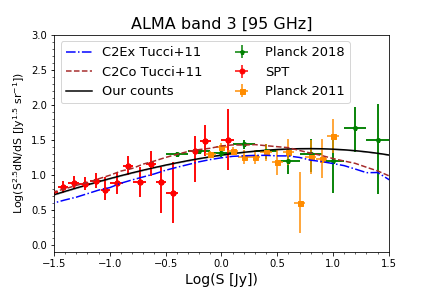
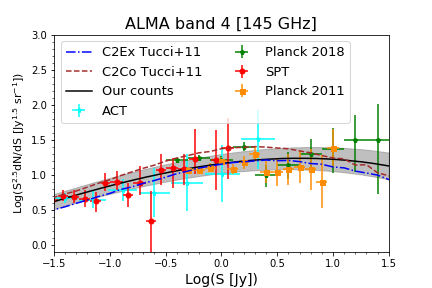
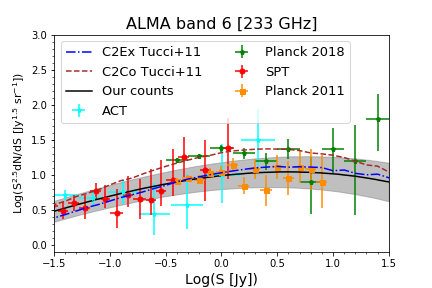
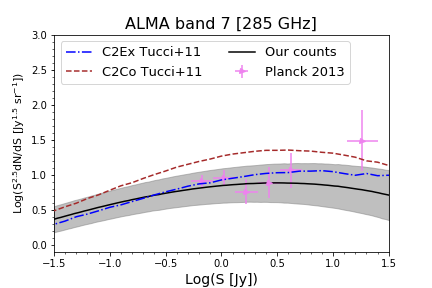
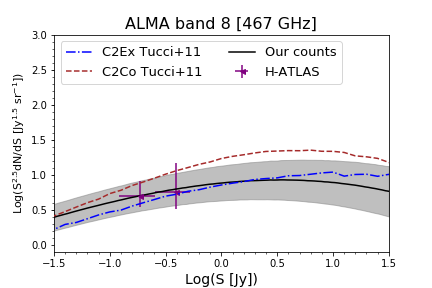
The combination of Planck (Planck Collaboration Int. LIV, 2018) and SPT (Mocanu et al., 2013) data has provided an observational determination of radio source number counts at GHz over a broad flux density range. An empirical description of the Euclidean normalized counts at this frequency is (solid black line in the top left panel of Fig. 4)
| (1) |
where and . We have exploited ALMA observations to extrapolate these counts to higher frequencies where direct survey data are increasingly poor. To this end we have calculated the mean values and the dispersions of the log of the flux density ratios between band 3 (characteristic frequency of 95 GHz) and the ALMA higher frequency bands for which we have sufficient statistics. The results are shown in Table 3.
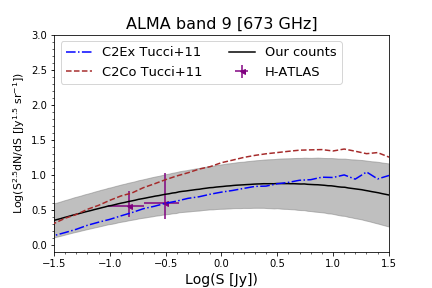
By convolving eq. (1) with the appropriate distribution of flux density ratios, assumed to be a Gaussian with mean and standard deviation given by Table 3, we have obtained the counts in bands 4, 6, 7, 8 and 9 shown by the solid black lines in Fig. 4. The shaded grey bands represent the uncertainties on the extrapolated counts. These number counts are available in a machine readable format in the website of the Italian node of the European ALMA Regional Centre (http://arc.ia2.inaf.it). Polynomial representations of the extrapolated counts are given in Table 4.
The extrapolated counts are fully consistent with the available data. The comparison with the two preferred models by Tucci et al. (2011), “C2Co” and “C2Ex”, shows that the latter performs quite well at all frequencies while the former tends to overpredict the counts above 145 GHz.
| N. ALMA band | Charact. [GHz] | A | B | C | D |
|---|---|---|---|---|---|
| 4 | 145 | -0.0166 | -0.128 | 0.207 | 1.160 |
| 6 | 233 | -0.0160 | -0.133 | 0.175 | 0.988 |
| 7 | 285 | -0.0159 | -0.136 | 0.151 | 0.846 |
| 8 | 467 | -0.0159 | -0.135 | 0.159 | 0.883 |
| 9 | 673 | -0.0157 | -0.134 | 0.156 | 0.833 |
4 Conclusions
We have presented a new catalogue of ALMA flux density measurements of radio sources, mostly blazars, used as flux density, bandpass response, amplitude and phase visibility calibrators. The catalogue was built combining the ALMACAL catalogue published by Bonato et al. (2018) with the ALMA Calibrator Source Catalogue. It contains ALMA observations for 3,364 bright, compact radio sources observed between May 2011 and July 2018, for a total of 47,115 observations in different bands and epochs. The catalogue is available online as supplementary material and on the website of the Italian ALMA Regional Center (ARC; http://arc.ia2.inaf.it).
We have added redshifts found in the literature, available for 2245 (67%) of the sources and a classification for all of them. The classification given in the 5th edition of the Roma Multi-frequency Catalogue of Blazars (BZCAT; Massaro et al., 2009) was adopted for the 1391 objects listed there. The others were classified following Bonato et al. (2018).
The ALMA measurements were exploited to obtain the first external validation of the MTFX photometry presented in the new Planck multi-frequency Catalogue of Non-Thermal sources (PCNT; Planck Collaboration Int. LIV, 2018), to quantify its positional accuracy and to estimate its completeness limits.
We found good agreement between the ALMA and the MTFX photometry above the 90% completeness limits given by Planck Collaboration XXVI (2016). The dispersions around the mean MTFX/ALMA flux density ratios as a function of ALMA flux densities can be accounted for by variability which also explains the excess flux densities measured by Planck for the few brightest sources, most likely detected in a flaring phase. Below these limits, Planck measurements show clear signs of the Eddington bias.
The distribution of differences between ALMA and Planck positions peaks at and has a standard deviation , confirming the Planck Collaboration XXVI (2016) conclusion that the PCCS2 positional accuracy is typically better than 1 arcmin. The distribution has however an extended tail reaching a few arcmin. The extension of such tail slightly decreases if sources below the PCCS2 90% completeness limits are excluded.
An analysis of the fraction of ALMA calibrators with a PCNT counterpart having at the nearest frequency as a function of the ALMA flux density has shown that the PCNT completeness limits are consistent with the PCCS2 ones at 100, 217, 353 and 545 GHz. The PCNT limit at 143 GHz seems to be higher, but the difference is only marginally significant because of the poor statistics. We conclude that although the PCNT reaches fainter flux density levels than the PCCS2, the completeness limits do not change appreciably.
Finally we have exploited the multi-frequency ALMA observations to derive the distribution of flux density ratios between Band 3 and the higher frequency bands. These distributions have allowed us to estimate the counts in such bands, where direct measurements are limited or almost completely missing, by extrapolating the relatively well determined 100 GHz counts of radio sources. The results agree with the available data and are consistent with the C2Ex model by Tucci et al. (2011), while their C2Co model is disfavoured.
Acknowledgements
We thank the anonymous referee for a careful reading of the manuscript and many constructive comments. This paper and the AKF and KAFE development are part of the activities for the ALMA Re-Imaging Study approved in the framework of the 2016 ESO Call for Development Studies for ALMA Upgrade (PI: Massardi). The study acknowledges partial financial support by the Italian Ministero dell’Istruzione, Università e Ricerca through the grant ‘Progetti Premiali 2012 - iALMA’ (CUP C52I13000140001). MB, MM and GDZ acknowledge support from INAF under PRIN SKA/CTA FORECaST. GDZ acknowledges support from ASI/INAF agreement n. 2014-024-R.1 for the Planck LFI Activity of Phase E2 and from the ASI/Physics Department of the university of Roma–Tor Vergata agreement n. 2016-24-H.0 for study activities of the Italian cosmology community. MN acknowledges support from the European Union’s Horizon 2020 research and innovation programme under the Marie Skłodowska-Curie grant agreement No 707601. DH thanks the Spanish MINECO for partial financial support under project AYA2015-64508-P and funding from the European Union’s Horizon 2020 research and innovation programme (COMPET-05-2015) under grant agreement number 687312 (RADIOFOREGROUNDS). LB and JGN acknowledge financial support from the I+D 2015 project AYA2015-65887-P (MINECO/FEDER). JGN also acknowledges financial support from the Spanish MINECO for a ‘Ramon y Cajal’ fellowship (RYC-2013-13256). This paper makes use of the following ALMA data: ADS/JAO.ALMA#2011.0.00001.CAL. ALMA is a partnership of ESO (representing its member states), NSF (USA) and NINS (Japan), together with NRC (Canada), MOST and ASIAA (Taiwan), and KASI (Republic of Korea), in cooperation with the Republic of Chile. The Joint ALMA Observatory is operated by ESO, AUI/NRAO and NAOJ.
References
- Bennett et al. (2013) Bennett C. L., et al., 2013, ApJS, 208, 20
- Bonato et al. (2018) Bonato M., et al., 2018, MNRAS, 478, 1512
- Eddington (1913) Eddington A. S., 1913, MNRAS, 73, 359
- González-Nuevo et al. (2006) González-Nuevo J., Argüeso F., López-Caniego M., Toffolatti L., Sanz J. L., Vielva P., Herranz D., 2006, MNRAS, 369, 1603
- Herranz & Sanz (2008) Herranz D., Sanz J. L., 2008, IEEE Journal of Selected Topics in Signal Processing, 2, 727
- Herranz et al. (2009) Herranz D., López-Caniego M., Sanz J. L., González-Nuevo J., 2009, MNRAS, 394, 510
- Hogg & Turner (1998) Hogg D. W., Turner E. L., 1998, PASP, 110, 727
- López-Caniego et al. (2006) López-Caniego M., Herranz D., González-Nuevo J., Sanz J. L., Barreiro R. B., Vielva P., Argüeso F., Toffolatti L., 2006, MNRAS, 370, 2047
- Maddox et al. (2018) Maddox S. J., et al., 2018, ApJS, 236, 30
- Marsden et al. (2014) Marsden D., et al., 2014, MNRAS, 439, 1556
- Massaro et al. (2009) Massaro E., Giommi P., Leto C., Marchegiani P., Maselli A., Perri M., Piranomonte S., Sclavi S., 2009, A&A, 495, 691
- Mocanu et al. (2013) Mocanu L. M., et al., 2013, ApJ, 779, 61
- Negrello et al. (2017) Negrello M., et al., 2017, MNRAS, 465, 3558
- Planck Collaboration Int. LIV (2018) Planck Collaboration Int. LIV 2018, A&A, 619, A94
- Planck Collaboration XXVI (2016) Planck Collaboration XXVI 2016, A&A, 594, A26
- Planck Collaboration et al. (2011) Planck Collaboration et al., 2011, A&A, 536, A13
- Planck Collaboration et al. (2013) Planck Collaboration et al., 2013, A&A, 550, A133
- Tucci et al. (2011) Tucci M., Toffolatti L., de Zotti G., Martínez-González E., 2011, A&A, 533, A57