Deconstructing double-barred galaxies in 2D and 3D. II. Two distinct groups of inner bars
Abstract
The intrinsic photometric properties of inner and outer stellar bars within 17 double-barred galaxies are thoroughly studied through a photometric analysis consisting of: i) two-dimensional multi-component photometric decompositions, and ii) three-dimensional statistical deprojections for measuring the thickening of bars, thus retrieving their 3D shape. The results are compared with previous measurements obtained with the widely used analysis of integrated light. Large-scale bars in single- and double-barred systems show similar sizes, and inner bars may be longer than outer bars in different galaxies. We find two distinct groups of inner bars attending to their in-plane length and ellipticity, resulting in a bimodal behaviour for the inner/outer bar length ratio. Such bimodality is related neither to the properties of the host galaxy nor the dominant bulge, and it does not show a counterpart in the dimension off the disc plane. The group of long inner bars lays at the lower end of the outer bar length vs. ellipticity correlation, whereas the short inner bars are out of that relation. We suggest that this behaviour could be due to either a different nature of the inner discs from which the inner bars are dynamically formed, or a different assembly stage for the inner bars. This last possibility would imply that the dynamical assembly of inner bars is a slow process taking several Gyr to happen. We have also explored whether all large-scale bars are prone to develop an inner bar at some stage of their lives, possibility we cannot fully confirm or discard.
keywords:
galaxies: photometry – galaxies: structure – galaxies: evolution – galaxies: stellar content1 Introduction
Double-barred galaxies are structurally complex systems due to the coexistence of several axisymmetric and non-axisymmetric components within a disc galaxy, namely disc, outer bar, inner bar, and most likely a bulge (e.g. Erwin, 2004; de Lorenzo-Cáceres et al., 2019a, hereafter Paper I). Other structures, such as spiral arms, inner discs, and lenses, may be present as well (see e.g. de Lorenzo-Cáceres et al., 2019b). Characterising stellar bars through their three main properties (length, strength, and pattern speed) is therefore particularly difficult in the case of double-barred galaxies.
While the measurement of the bar pattern speed usually requires spectroscopic data (see Corsini et al., 2003, for an analysis of the bar pattern speed in a double-barred galaxy), bar length and strength may be photometrically estimated on images with enough spatial resolution. Bars are considered triaxial ellipsoids whose longest axis in the galaxy plane corresponds to the bar length. The strength is a measurement of the prominence of a bar: it is strong if it is long, massive, flat, elongated, and induces intense tangential forces, whereas weak bars are those which are small and with little gravitational influence on the rest of the galaxy. The most accurate way for estimating the bar strength is by means of the parameter, introduced by Buta & Block (2001). is measured as the maximum value of the ratio between the tangential force and the mean axisymmetric radial force in a barred potential, and correlates well with other strength estimators, such as the bar ellipticity (Laurikainen et al., 2002) or the parameterisation by Abraham & Merrifield (2000). The bar ellipticity is relatively simple to measure and it therefore is the most commonly used proxy for bar strength.
Photometric properties of bars have usually been derived through unsharp masking, ellipse fitting, or Fourier analysis (see Aguerri et al. 1998, Aguerri et al. 2000, and Erwin 2004, among others). The parameters obtained through these techniques are measured on the integrated light, where the overlapping with other bright structures such as the central bulge may be affecting the results. Such contamination is particularly important in the case of a small inner bar embedded in a double-barred system. Performing better suited two-dimensional (2D) multi-component photometric decompositions of double-barred galaxies is complicated, and it has only been applied to a handful of individuals: two double-barred galaxies in Méndez-Abreu et al. (2017) and another two in de Lorenzo-Cáceres et al. (2019b).
In Paper I we presented the most complete photometric analysis of double-barred galaxies ever performed on a sample of 17 individuals. It consists of a combination of 2D photometric decompositions including a bulge, inner bar, outer bar, and (truncated) disc, and a three-dimensional (3D) statistical deprojection of bulges and bars thus retrieving their intrinsic 3D shape. The main objective of this project is to use the accurate photometric properties of double-barred galaxies to answer four important questions still debated within the community, namely: i) whether there exists a major incidence of disc-like bulges within double-barred galaxies where secular evolution is assumed to take place in a very efficient way; ii) whether inner bars form secularly after disc-like bulges already present in barred galaxies; iii) whether inner bars are transient or long-lived structures; and iv) whether all barred galaxies will develop an inner bar at some stage of their lives.
Questions i) and ii) are elaborated in Paper I, where we find that all galaxies host a classical dominant bulge as indicated by the Kormendy (1977) relation and their intrinsic 3D shape (Costantin et al., 2018a). Such result poses the possibility that hosting a central hot component is a requirement for a barred galaxy to develop an additional inner bar. In this second and last paper of the series, we present the photometric properties of the inner and outer bars and compare them with previous results measured on integrated galaxy light. We remark this is the first time the intrinsic photometric properties of double bars are studied. We also address open questions iii) and iv), whose relevance is put in context in the following.
1.1 Formation of inner bars
Two main formation mechanisms have been proposed for the case of double-barred galaxies. The first scenario is a direct formation of the inner bar after gas inflow through the outer bar, as shown by various simulations such as those from Friedli & Martinet (1993), Heller et al. (2001), Englmaier & Shlosman (2004), and Wozniak (2015). The gas is trapped in the orbits of the outer bar, shaping a transient, gaseous inner bar; star formation is then triggered and a stellar inner bar eventually appears. The second possibility is the formation of a double-barred system without the need of gas. Debattista & Shen (2007) and Du et al. (2015) demonstrate that inner bars may form as soon as a rapid-rotating component is present in the galaxy centre. Likewise single bars, which form dynamically out of a cold disc, small-scale bars are formed out of small-scale discs. Disc-like bulges, which are supposed to be frequent in barred galaxies (but see the results shown in Paper I where we find a majority of classical bulges in double-barred galaxies), may act as the small-scale disc supporting the formation of an inner bar.
Observational studies of inner bar formation are scarce in the literature, with the notable exception of de Lorenzo-Cáceres et al. (2012, 2013, 2019b). These projects pursued the analysis of the stellar populations and kinematics of double-barred galaxies. The results of these three articles, once combined, agree better with a formation through stellar redistribution supported by an underlying disc structure. All these works conclude notwithstanding that inner bars, once they are already formed, play a very mild role in promoting secular evolution.
1.2 Long-lived nature of inner bars
Bars in general have been proposed to be transient structures that dissolve and reform
over time (e.g. Bournaud &
Combes, 2002; Wozniak, 2015).
Inflow processes can contribute to the bar destruction: it has been
theoretically proved that large central mass concentrations may,
together with the angular momentum exchange induced by the bar,
dissolve it in rather short timescales (2 Gyr; see for example Bournaud &
Combes, 2002).
On the other hand, some numerical simulations show that bars can be long-lived structures
(e.g. Debattista &
Sellwood, 2000; Athanassoula
& Misiriotis, 2002; Martinez-Valpuesta et al., 2006),
despite the combined effect of the gas
flow and central mass concentrations (Berentzen
et al., 2007).
Few observational results support this idea for the
case of single bars (Sánchez-Blázquez
et al., 2011; Pérez et al., 2017).
Whether bars, or even inner bars, are long-lived structures is
an important matter of debate and consensus has not been reached yet
(see e.g. Friedli &
Martinet 1993 and Wozniak 2015 for opposite results
on the life time for inner bars).
The paper is organised as follows: the double-barred and comparison samples are described in Sect. 2. In Sect. 3 we summarise the 2D and 3D analyses performed with gasp2d and galaXYZ, respectively. The individual photometric properties of inner bars are presented in Sect. 4. The results are discussed within the context of the formation and evolution of double-barred galaxies in Sect. 5. Conclusions are wrapped up in Section 6. A flat cosmology with 0.3, 0.7, and 0.75 is assumed. These are the same parameters adopted by Méndez-Abreu et al. (2017), whose work is used for comparison throughout this paper.
2 The samples of barred galaxies
The sample of 17 double-barred galaxies photometrically analysed here corresponds to all the barred galaxies with inner bars presented in Erwin (2004) with available Sloan Digital Sky Survey (SDSS; York et al., 2000) images. While this first constraint provided a list of 23 out of 50 objects, 6 of them (Mrk 573, UGC 524, NGC 1068, NGC 4303, NGC 4321, and NGC 4736) were finally removed from the sample as either the SDSS spatial resolution is not enough for resolving their inner bars or the inner bar had been misclassified due to the presence of dust or other central components resembling elongated structures.
We use the -, -, and -band images of the SDSS Data Release
9 (Ahn et al., 2012) for our photometric analysis. Besides the standard SDSS reduction, we
re-calibrate the images from nanomaggies to counts and refine the sky subtraction
(Pagotto
et al., 2017; Costantin
et al., 2018a).
Such additional treatment is a requirement for our analysis, as explained in
Paper I.
Méndez-Abreu et al. (2017) analysed the photometric properties of a sample of galaxies from the CALIFA survey (Sánchez et al., 2012). The 2D photometric decompositions performed by Méndez-Abreu et al. (2017) are analogous to those presented here: they also applied the gasp2d code to SDSS , , and images. 404 galaxies are analysed in that work, among which there are 160 single-barred and two double-barred hosts: NGC 0023 and NGC 7716, this last galaxy being in common with the current sample. For the sake of completeness and to show the good agreement between our results for the one galaxy in common, we have included the corresponding measurements obtained by Méndez-Abreu et al. (2017) in the figures analysed throughout this paper.
3 2D and 3D photometric analyses
A detailed description of the procedures used for performing the 2D multi-component photometric decomposition of the sample galaxies with gasp2d (Méndez-Abreu et al., 2008, 2014, 2017), as well as the 3D statistical deprojection of the bulges, inner bars, and outer bars with galaXYZ (Méndez-Abreu et al., 2010; Costantin et al., 2018b), is presented in Paper I. For the sake of completeness we summarise here the most relevant aspects of these methodologies. Throughout this paper, we refer to the properties of the structures within the plane of the galaxy disc as in-plane quantities, whereas off-plane properties correspond to the vertical direction, i.e. perpendicular to the galaxy disc.
3.1 2D analysis with gasp2d
gasp2d uses a Levenberg-Marquardt algorithm for fitting the 2D surface brightness distribution of each galaxy with a combination of structural components, each of which is modelled with a parametric mathematical function. In particular, we use Sérsic (1968) profiles for the bulges, Ferrers (1877) profiles for the bars, and single (double) exponential profiles for the Type I (Type II or Type III) discs.
We fitted the three (, , and ) images for the 17
double-barred galaxies, taking the -band image as benchmark
for the rest of the fits. Moreover, single-barred fits were also
performed in order to explore the effect of the most common approach
of dismissing possible inner bars in photometric decompositions of barred
galaxies. The parameters describing all structural components present in every galaxy,
as well as their errors (computed in a Monte Carlo fashion by means of
mock galaxies),
are listed in Appendix A of Paper I. We remark again this is the first time
a 2D multi-component photometric decomposition analysis of
a large sample of double-barred galaxies
including the inner bars is performed.
The Ferrers model used for the bars is characterised by two shape parameters, namely and . is related to the decay of the surface-brightness profile along the bar and its value is highly correlated with the bar length. indicates the bar boxiness: represents a perfectly elliptical bar while and describe boxy and discy bars, respectively. The standard procedure in photometric decompositions is to fix these parameters to their default values and (e.g. Laurikainen et al., 2005; Méndez-Abreu et al., 2017). With the aim of performing an accurate analysis, we explore the space of and parameters and search for the most suitable value for our inner and outer bars. We refer the reader to Paper I for an extensive description of this analysis.
Our results indicate that the majority of both inner and outer bars
are well described with the default , while the remaining galaxies
tend to host boxier bars. Regarding , all bars show
steeper profiles than the default . and
values for all our inner and outer bars are provided in the corresponding
tables presented in Paper I (Appendix A).
In summary, gasp2d provides the shape of the isolated structural components for every galaxy as projected onto the sky plane. The bar and bulge parameters are then deprojected in order to retrieve the properties of each structure in-plane, i.e., within the galaxy plane. To this aim, we perform the strict mathematical deprojection of an ellipse, following the equations shown in Gadotti et al. (2007). It is worth noting that the Ferrers bar is not a classical but a generalized ellipse and therefore some additional uncertainties are introduced by this deprojection. Zou et al. (2014) perform an extensive study of deprojection uncertainties with simulated barred galaxies for which the bars are not classical ellipses, finding that the mathematical deprojection introduces a 10% uncertainty of the same order of other 2D deprojections. Note however that the study from Zou et al. (2014) is focused on ellipse-fitting estimates; a similar study for parameters retrieved from photometric decompositions is still lacking.
We remark here that, while deprojected in-plane position angles, ellipticities, and sizes in physical units are used throughout this paper (as requested for a proper discussion and comparison between different galaxies), observed results are listed in Appendix A of Paper I. For the sake of completeness, current Table 1 lists physical deprojected measurements (semi-major axes, effective radii, ellipticity, and position angle for the bars), as well as the physical disc effective radii for all sample galaxies as used throughout this paper.
3.2 3D analysis with galaXYZ
Based on the properties of the structural components obtained through 2D photometric decompositions, galaXYZ performs a statistical deprojection in order to retrieve the shape off the galaxy plane, thus providing the full 3D morphology of the isolated structures. For galaXYZ to be properly applied, three conditions must be fulfilled: i) the structure under study is well modelled as a triaxial ellipsoid; ii) the galaxy disc is an oblate spheroid; and iii) disc and structure share the same centre. This technique has been successfully used with bulges (Costantin et al., 2018b) and large-scale bars (Méndez-Abreu et al., 2018), and its pioneering application to bulges, inner bars, and outer bars within double-barred systems was presented in Paper I.
While it is known that bars may develop vertical instabilities which may give rise to vertical-extended components such as box/peanut structures (e.g. Martinez-Valpuesta et al., 2006, among others), we refer the reader to Méndez-Abreu et al. (2018) for a demonstration of how the parameters retrieved with galaXYZ correspond to the thin part of the bars. Central vertical components such as box/peanuts do therefore not affect the results.
The outcome of galaXYZ is the joined probability distribution function (PDF) for the in-plane () and off-plane () axis ratios of the structures under study. A summary of the mathematical equations used in this analysis is presented in Costantin et al. (2018b). In Paper I we show that the deprojected in-plane axis ratios derived with gasp2d match very well those obtained using galaXYZ. Table 2 of Paper I lists the results for the 17 sample galaxies of this project.
4 Photometric properties of bars within double-barred systems
Here we explore for the very first time the individual photometric properties of inner and outer bars in double-barred galaxies, which are worth comparing with previous values and conclusions from analyses with the most extensively used ellipse fits over integrated-light images.
4.1 Lengths of inner and outer bars
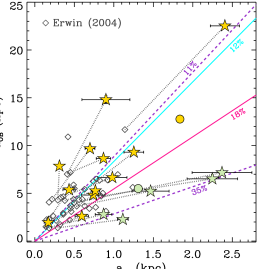
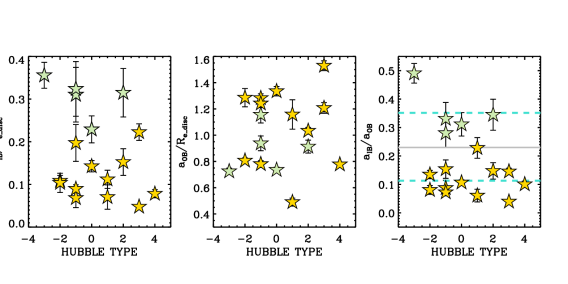
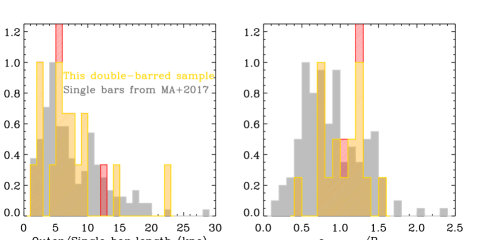
Figure 1 shows the deprojected inner and outer bar lengths as measured with photometric decompositions. Inner bars are rather small systems with physical lengths ranging from 0.17 kpc to 2.4 kpc (semi-major axis). Outer bars can be as short as 1.9 kpc, meaning that some galaxies host outer bars shorter, or of the same length, than inner bars in other galaxies.
Ellipse-fitting measurements from Erwin (2004) are shown in Fig. 1 for comparison. Photometric decompositions provide systematically longer bar lengths with respect to ellipse-fitting techniques, as already observed by Gadotti (2011). This trend is expected as our photometric decompositions measure the whole extent of the Ferrers profile, i.e. up to when its contribution to the total galaxy light drops to zero. It therefore represents the actual individual bar length. On the contrary, bar-length measurements from ellipse fits recover estimates of the extent to which signatures of the bar presence on the total integrated light (i.e. the image) are found: when the surface brightness of the bar is dropping to zero, its effects over the galaxy isophotes become negligible.
Erwin (2004) provides four different ellipse-fitting estimates of the bar length. We note that the values shown in Fig. 1 correspond to the lower limit , measured as the radius of maximum ellipticity within the bar. We chose this parameter because it is the only one available in Erwin (2004) for all our sample galaxies. We remark that, although other measurements such as and (we refer the reader to Erwin, 2004, for details on how these estimates are derived) provide larger bar length values, these are still shorter than the individual sizes derived from photometric decompositions.
While bars measured through photometric decompositions are always longer than ellipse-fitting estimates, Gadotti (2011) finds an approximated match for both quantities when the effective radii of bars are considered instead of their full length. To make a similar comparison, we have calculated the effective radii of our Ferrers profiles for the inner bars (see Table 1). We find a good agreement between the inner bar effective radii and measurements from Erwin (2004), with a median deviation of 18% for the whole sample that can be as low as 2% for some galaxies. This result further supports the fact that photometric analyses of integrated light focus on the brightest regions of bars, particularly inside their effective radii. Such conclusion is robust against different parametric functions of the bars, since Gadotti (2011) uses Sérsic instead of Ferrers profiles.
Figure 1 also shows a slight correlation so galaxies with shorter outer bars tend to host shorter inner bars, although a non-negligible dispersion is present. In average, our measured inner bars have 18% the in-plane size of outer bars, in contrast with the 12% ratio previously reported by Erwin & Sparke (2002) with ellipse fits. By inspecting the Spearman factor of this ratio, we find the global correlation is indeed very weak (=0.34 with a significance of 0.18). Fig. 1 suggests that a bimodal behaviour of the bar length ratio may hold. If such bimodality is taken into account, two strong trends between the bar sizes are found. We infer that, when galaxies are separated according to a bar length ratio above and below =0.23, a clear correlation of =35% (=0.90 and a significance of 0.04) and a milder, although still significant relationship =11% (=0.65 and a significance of 0.02), appear. The global mean ratio and the two trends are slightly transformed into 17%, 32%, and 11%, respectively, when effective radii instead of full bar lengths are considered.
The origin of the possible bimodality in the size ratios is not known but it is not related to
the Hubble type of the
host galaxy, as demonstrated in the right panel of
Fig. 2. We have also explored whether it could be related to the central bulge,
but no global correlations between bar length and bulge parameters have been found
(see Fig. 5 in Paper I).
The left and central panels
of Fig. 2 show how the bimodality in
is mainly driven by the inner bars, as those with 0.23 are
the longest inner bars in the sample.
Numerical works exploring the formation and evolution of double-barred galaxies predict the size evolution of a two-bars system. Numerical simulations by Wozniak (2015) form a double bar in a two-steps process: a transient inner bar is first created with a very small inner/outer bar length ratio of just 5%; after the dissolution of this first inner bar, a second, long-lived inner bar with =0.275 is created, and it rapidly evolves in size and eventually gets 0.15. Other authors provide similar measurements, such as Friedli & Martinet (1993, 26%) and Du et al. (2015, from 10% to 16%). They all lay within the range covered by the ratios measured in this work and shown in the right panel of Fig. 2.
Fig. 2 also shows four galaxies with 0.3. Saha & Maciejewski (2013) report on the spontaneous formation of double-barred systems with length ratios as large as 50%, starting with a dark-matter-dominated model that includes a disc, classical bulge, and halo, but no gas. We note that this simulation forms both bars rather simultaneously, against the available observational evidence (e.g. de Lorenzo-Cáceres et al., 2013, 2019b). Still, simulations must reproduce the formation of double bars with 0.4, since observational evidence for such systems has been provided not only by this work but also by other authors (e.g. the deprojected bar lengths for NGC 3358 in Erwin, 2004, account for 0.43).
We note here that the highest bar length ratio in Fig. 2
corresponds to NGC 3941 (=0.49). For this galaxy, Erwin (2004)
measures a deprojected bar length ratio of 0.2 from ellipse fitting.
When our bar full lengths are translated into effective radii,
we obtain a similar inner bar size (as expected) but a shorter outer bar radius than from ellipse fitting,
thus resulting in a still high 0.43 for this galaxy. We remark again
ellipse fitting and photometric decompositions are different techniques and only the latest is able to isolate
the galaxy structures thus providing their true parameters.
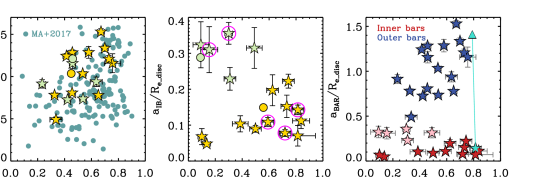
Figure 3 shows the distribution of deprojected large-scale bar lengths for the double-barred galaxies of this sample (i.e., outer bars) and the single-barred galaxies from Méndez-Abreu et al. (2017), as it has been argued that outer bars in double-barred systems are longer than single bars (see e.g. Erwin, 2011). We remind the reader that both samples of galaxies have been analysed in an analogous way with gasp2d and therefore they represent the best double/single-barred galaxies pair of samples to probe this. Moreover, we have performed the deprojection of the bar lengths for the galaxies of Méndez-Abreu et al. (2017) following the same recipe than for our double-barred sample. As seen in the left panel of Fig. 3, both distributions peak at approximately 5 kpc, with median values of 6.3 kpc and 6.5 kpc for the single and double bars, respectively. The bulk of double-barred galaxies host outer bars which populate the central parts of the distribution for single-barred galaxies, although there are two double-barred systems with quite large bars as well.
The right panel of Fig. 3 shows analogous measurements, but bar lengths are normalised by the effective radius of the disc included in Table 1. This is done in order to prevent biases due to trends inherent to differences in the galaxy hosts, not related to the nature of bars. Note that, indeed, no galaxy with particularly large bar stands out. This indicates that the two largest outer bars are hosted by also-large galaxies. The distribution for double bars overlaps with that for single bars and they have median values of 1. and 0.8, respectively. We must highlight the different statistics accounted for in the two samples (160 single-barred galaxies in CALIFA against the 17+2 probed in this work). The conclusion is notwithstanding that outer bars within double-barred systems are not systematically longer than single bars.
4.2 Bar length versus morphological type
For large-scale bars (i.e., single bars or outer bars in double-barred systems), it has been found that they tend to be shorter in later-type galaxies (e.g., Martin, 1995; Laurikainen et al., 2002; Erwin, 2005; Aguerri et al., 2009). With the aim at exploring this trend on inner bars as well, Fig. 2 shows the individual bar lengths measured from gasp2d versus the morphological type provided by Erwin (2004, see Table 1 in Paper I). No correlations are found for either the inner or outer bar. This lack of trend stands for physical bar lengths (not normalised by disc effective radius).
Our sample covers up to Sbc types, with very few individuals in our latest-type regime. The decreasing (large scale) bar length behaviour mentioned before holds for Sc-Sd galaxies, whereas Sb-Sbc galaxies have been found to span a large range in bar length (see Fig. 11 in Erwin, 2005), in agreement with our measurements for outer bars. The slight decrease of outer-bar lengths for Hubble types is also in agreement with previous findings. We also remark that recent results from Erwin (2019) indicate that the relation between bar length and morphological type is indeed weak and most likely driven by the correlation between morphological type and galaxy mass.
4.3 Bar position angles
Two relevant pieces of information can be inferred from the position angles
of the two bars within a double-barred system. First, the random relative
orientation of the bars has been used as demonstration of their independent
rotation, since a preferred relative angle would be expected otherwise
(e.g. Friedli &
Martinet, 1993).
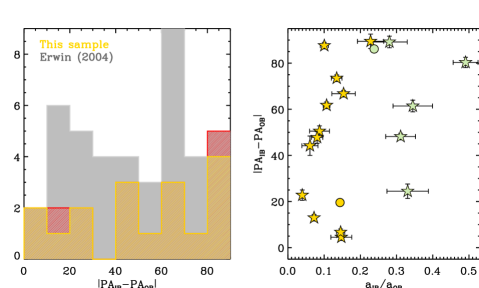
Left panel in Fig. 4 shows the relative position angles measured
with photometric decompositions in this work together with the ellipse-fitting results
from the larger sample of Erwin (2004). As expected, the distribution
covers the whole range and agrees with the two bars having independent pattern speeds.
This is a robust result since the measurements of the position angles have been corrected
for the galaxy inclination.
A proper confirmation of this result has been performed
for NGC 2950 via a Tremaine-Weinberg analysis by Corsini et al. (2003)
and for a handful of other double-barred galaxies with indirect techniques (Font et al., 2014).
Second, numerical simulations predict the formation and dynamical evolution of a double-barred system and the bar position angles may therefore be used to analyse the goodness of the predicted scenarios. It is widely accepted that both bars grow in length and strength during their lifetimes, and their evolution depends on their relative position, inner bars being longer (and axis ratios being higher) when both bars are perpendicular. This trend is indeed found in many numerical works such as those of Du et al. (2015, and references therein); Wozniak (2015, and references therein); Saha & Maciejewski (2013, and references therein), and it finds its physical explanation in the orbital analysis of double bars performed by Maciejewski & Sparke (2000) and Maciejewski & Small (2010). The pattern speed also oscillates so inner bars rotate slower when both bars are perpendicular. It is therefore sensible to state that it is most likely to find orthogonal than almost-parallel double bars, and a correlation between the bar-length ratios and the relative position angles is expected.
This hypothesis is not supported by the results shown in the right panel of Fig. 4, in which the distribution of double bars along the relative position angles is rather homogeneous and there is no noticeable correlation with respect to the bar axis ratios. We must note here that the oscillating amplitudes, strength, and pattern speeds behaviour found in the simulations applies to settled-up bars, while the proper formation process before is quite chaotic. For example, in Saha & Maciejewski (2013) inner bars are born as very slow structures that progressively speed up and eventually rotate faster than outer bars.
4.4 Bar ellipticities and 3D shapes
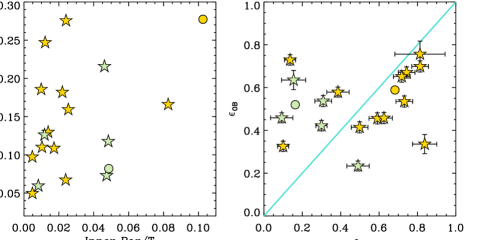
The right panel of Fig. 5 shows the deprojected ellipticity values for our sample of inner and outer bars. Both bars span almost the full range of ellipticities. It is particularly noticeable that inner bars can be as round as 0.1 and as elongated as 0.85. Outer bars are constrained to the slightly narrower regime [0.23,0.76].
We remark that the ellipticities shown in Fig. 5
have been corrected for galaxy inclination. Erwin (2004) does not provide deprojected measurements
of the ellipticities. For this reason, we do not overplot his results in Fig. 5,
but we note that the ellipse fitting provides systematically rounder bars in projection, as expected:
contamination from the bulge
light generates rounder isophotes in the central regions.
Ellipticity is often used as a proxy for bar strength (Laurikainen et al., 2002). The results shown in Fig. 5 indicate that double-barred galaxies can host either stronger outer bars than inner bars, or the opposite. It is worth noting that longer inner bars (coloured in green) tend to be rounder (i.e. weaker) than outer bars, even though they correspond to rather prominent structures with respect to the total galaxy light, as observed in the left panel of Fig. 5. We must however note that the vertical shape of a barred structure also affects the gravitational potential it introduces. The 3D statistical deprojection presented here allows us to take into account not only the deprojected ellipticity (or axis ratio), but also the off-plane axis ratio when studying the influence of the bar on the galaxy. Thin bars have a stronger effect than thick bars and they may, for example, trigger star formation or promote secular evolution in a more efficient way.
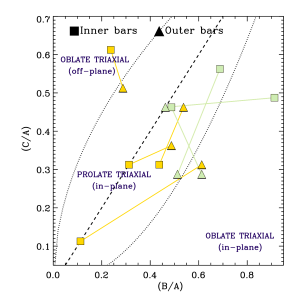
Figure 6 shows the in-plane and off-plane axis ratios for the outer and inner bars of the double-barred sample. Only those galaxies for which the uncertainties in both axis ratios for the two bars are less than 0.5 are shown (we refer the reader to Paper I for more details on this threshold). This analysis is therefore restricted to seven out of 17 galaxies, with five of the inner bars mostly being prolate triaxial ellipsoids whereas only the other two are consistent with an oblate shape. Attending to the two axis ratios available, two galaxies host clearly stronger outer bars than inner bars (i.e., outer bars are thinner and more elongated than inner bars) and three galaxies show stronger inner bars. The remaining two galaxies show opposite behaviours for the two proxies under use. No clear trend is therefore found for the bar strength when not only the ellipticity but also the vertical thickness is analysed.
5 Discussion: formation and evolution of double-barred galaxies
We discuss here the previous results within the context of the two major questions brought up in Sect. 1 concerning the formation and evolution of double-barred galaxies: iii) whether inner bars are transient or long-lived structures; and iv) whether all barred galaxies will develop an inner bar at some stage of their lives. Other related issues, such as at which precise stage of their evolution we are witnessing inner bars, are addressed too.
5.1 Assembly of outer and inner bars
In Fig. 7 the bar length is directly compared with bar ellipticity for the outer and inner bars of the sample. Bar lengths are provided in units of disc effective radius to prevent biases due to different galaxy sizes. A positive correlation is found for outer bars (Spearman correlation factor 0.49 with a significance of 0.05). Single bars in Méndez-Abreu et al. (2017) mostly behave in an analogous way. However, no correlation is seen for the case of inner bars, where two clouds hosting galaxies with different inner bar sizes appear. This result suggests again a bimodal distribution of the inner bar lengths, which lays at the basis of the bimodality found for the ratio in Fig. 1 and Fig. 2.
Three possibilities arise for explaining the lack of correlation within the properties of inner bars:
(a) different nature of inner and outer bars; (b) different nature of the small-scale discs
from which the inner bars are dynamically formed; and (c) different assembly stage between the two
groups of inner bars. In the following we elaborate
each of these explanations.
(a) The correlation between bar length and ellipticity shown for outer and single bars in Fig. 7
agrees with the prediction provided by some numerical simulations that bars grow in size and strength with time
(e.g. Saha &
Maciejewski, 2013; Du
et al., 2015). However, bar evolution is complicated as bars buckle several times
during their lives, this process affecting their overall shape and strength (Martinez-Valpuesta &
Shlosman, 2004).
Whatever the origin of such bar length vs. ellipticity correlation is, the fact that we do not find it for inner bars
might be due to a totally different nature of inner bars, for which the process responsible
for the correlation in outer/single bars does not apply.
This possibility may not be fully discarded with the pieces of evidence
known so far. However, our recent observational results presented in Méndez-Abreu et al. (2019)
and de Lorenzo-Cáceres
et al. (2019b) do suggest that inner bars behave in a fully analogous
way than outer bars: they indeed appear to suffer one or more buckling episodes during their lives
and they are both formed dynamically from disc instabilities, the only difference being the
spatial scale of the hosting disc. A different nature of inner and outer bars does therefore seem unlikely.
(b) In Fig. 7, bar lengths are normalised by the effective radius of each galaxy disc. The size of large scale bars is known to correlate with that of the galaxy disc as bars are the result of dynamical processes happening within the disc structure (Aguerri et al., 2009; Erwin, 2019). Inner bars are dynamically formed from small-scale discs (hereafter called inner discs; de Lorenzo-Cáceres et al., 2019b); it is thus expected that their size correlates with that of the inner discs. We can therefore suspect that the length vs. ellipticity correlation would remain for inner bars if the effective radius of the inner disc was considered for the normalisation () instead of the effective radius of the main galaxy disc. In this case, the bimodality of the properties of inner bars would be due to a bimodality of the properties of their progenitor inner discs. In particular, there would exist two types of inner discs attending to how they behave with respect to their corresponding main galaxy discs.
The right panel of Fig. 7 shows how the group of inner bars with (i.e. the longest inner bars) lays on the length vs. ellipticity relation shaped by outer bars, whereas the short inner bars are spread throughout the plot. This suggests that the inner discs hosting long inner bars are indeed related to the main galaxy disc and that is why the correlation stands even if the inner bar size is normalised by the main disc effective radius. This is the expected result if inner discs are formed through resonances due to the large scale bar which, in turn, is related to the galaxy disc size. On the contrary, the inner discs hosting short inner bars (which lay out of the length vs. ellipticity relation) must have a different nature since their sizes are not related with the size of the main disc.
Since the study of the faint inner discs is beyond the scope of this paper
and they have not been included in the photometric analysis, this possibility cannot be fully confirmed or
discarded for all our sample galaxies. However, a similar 2D photometric analysis with gasp2d including
the inner discs
is presented in de Lorenzo-Cáceres
et al. (2019b). For the one galaxy in common with that work, NGC 5850,
we have overplotted the measurement in the right panel of Fig. 7.
It shows a good agreement with the bar length vs. ellipticity correlation of outer bars.
Although this test is not conclusive for the whole sample of short inner bars,
it provides promising support for this hypothethical scenario that can be summarised as follows:
the bar length vs. ellipticity correlation stands for all inner and outer bars
when their size is normalised to the size of their progenitor, i.e., inner discs and main galaxy discs, respectively.
The existence of two different kinds of inner discs explains the bimodality observed for inner bars when
the usual normalisation by the size of the main galaxy discs is applied to them.
(c) The third and last explanation is that inner bars are not settled structures. If the length vs. ellipticity correlation were actually due to bars growing in length and strength with time, it would happen only in the case of fully assembled systems which are now subject of a stable evolution. During the bar formation process, those correlations are not expected. Inner bars have even been found to form and dissolve one or two times before they finally settle down (e.g. Wozniak, 2015). All observational studies performed so far on double-barred galaxies agree that outer bars form prior to inner bars (de Lorenzo-Cáceres et al. 2012, 2013, 2019b), as confirmed by their stellar populations and star formation histories. Within this scenario, large-scale bars that have developed an inner bar should be already assembled systems growing accordingly in size and strength, while inner bars could still be immersed in the process of settling up. The main caveat for this explanation is that the already-mentioned observational studies find that inner bars, although younger than outer bars, are old systems with luminosity-weighted ages around 6 Gyr. However, and as specifically pointed out by Wozniak (2007), the time since the dynamical formation of the bars does not necessarily corresponds to the mean age of the bar stellar populations. The most precise constraint for the assembly epoch of double-barred galaxies is presented in de Lorenzo-Cáceres et al. (2019b), where we measure that the two inner bars under study were dynamically formed 4.5 Gyr and 6 Gyr ago.
The only way of reconciling this scenario with the studies about stellar populations of double-barred galaxies is assuming that we are witnessing inner bars at different evolutionary stages. The bimodality in the physical length of inner bars may be suggestive of an assembled/non-assembled behaviour. Such possibility was already introduced by Wozniak (2015), who finds there is a first generation of transient inner bars with small bar length ratios. These are subsequently dissolved and reformed with a larger ratio. The fact that the long inner bars lay at the bottom end of the relation for the outer bars (see right panel of Fig. 7) would be in agreement with the fact that those inner bars correspond to already settled structures, while the remaining galaxies would still be immersed in the process of inner bar formation. Within this scenario, inner bars at the formation process would be shorter than settled inner bars, in accordance with the statement that bars grow in length with time, and inner bars would be long-lived structures as predicted by the numerical simulations and similarly to the case of large-scale bars.
In an attempt of exploring this last hypothesis, in Fig. 7 we identify the 5 out of the 6 galaxies from the samples analysed in the set of papers by de Lorenzo-Cáceres et al. (2008); de Lorenzo-Cáceres et al. (2012, 2013, 2019b) and included in this analysis. In particular, the inner bar in NGC 5850 belongs to the short-length group. This structure was formed 4.5 Gyr ago as demonstrated in de Lorenzo-Cáceres et al. (2019b). The other two galaxies hosting short inner bars are NGC 2859 and NGC 4725, while NGC 357 and NGC 3941 have long inner bars. A stellar population analysis for all these galaxies show inner bars are shaped by mainly old stellar populations (mean luminosity-weighted age 6 Gyr). Within our proposed scenario, NGC 5850 would host a non-assembled inner bar. We therefore conclude that either the assembly stage of the bars is not driving the observed bimodality, or the dynamical settling of inner bars is a long process that might take several Gyr to happen.
Finally, we seek for any difference among the off-plane shape of the long and short inner bars: three out of the seven galaxies shown in Fig. 6 belong to the group of long inner bars with . No particular properties of the vertical extension of these galaxies with respect to the remaining ones is apparent in this analysis: the clear bimodality found for the in-plane length of inner bars does not have a counterpart in its off-plane shape.
5.2 Will all barred galaxies be double barred at some stage?
Similarly to the debated question of whether all bars have the capability of forming disc-like bulges through secular evolution (discussed in Paper I), it is sensible to ask whether all single-barred galaxies will develop an inner bar at some evolutionary stage of their lives. This hypothesis backs on the two possible formation scenarios presented for inner bars. Friedli & Martinet (1993); Heller et al. (2001); Saha & Maciejewski (2013), among others, obtain that outer bars are formed first and the material flown through them is responsible for creating the inner bar structures thanks to the dynamics of the outer bar. Debattista & Shen (2007) and Du et al. (2015), on the other hand, find that inner bars are formed dynamically from cold inner discs. Although this scenario does not invoke the presence of gas, the most likely possibility is that the inner discs are formed in a star-forming process out of gas that has inflown along the outer bar. We remark again that our stellar population analyses of double-barred galaxies presented in de Lorenzo-Cáceres et al. (2012, 2019b) support the dynamical origin of inner bars. But regardless of which scenario dominates the inner bar formation, the premise is that, as long as gas is present, inner bars could be formed, either directly or through the gas-rich formation of an inner disc.
Assuming once again that large-scale bars grow with time since their assembly (see previous discussion about Fig. 7), our aim here is to check if bars hosting inner bars are more evolved than pure single bars. If (outer/single) bars are long-lived, the observables indicating the time since the assembly of the bar, i.e. length and ellipticity (as proxy for strength), should acquire larger values in the case of outer bars (that have developed an inner bar inside) than in the case of single bars (that have not formed inner bars yet).
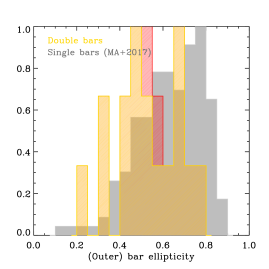
Figure 3 compares the sizes of truly single-barred galaxies from Méndez-Abreu et al. (2017) with the outer bars of our double-barred sample. Outer bars are not systematically longer than single bars. We complete this comparison with a similar plot for the ellipticities of large-scale bars in single- and double-barred galaxies, shown in Fig. 8. Notwithstanding the fact that both distributions are different as proven with a Kolmogorov-Smirnov test (with a probability of being similar distributions of 0.05), the derived trend is the opposite than expected, with truly single bars being stronger (i.e. with higher ellipticity values) than outer bars.
Although our analysis does not support the ubiquity of inner bars, this possibility cannot be ruled out yet as there are several caveats hampering these results: first, the presence of gas is required for either forming the inner bar or, most likely, for forming the inner disc which will develop the inner bar. The presence of gas is not considered in this analysis. Second, other galaxy properties (probed for example with the Hubble galaxy type) besides the dynamical age of the outer bar may be influencing the moment at which the inner bar is formed. And third, bars may actually not grow in length and strength in a stable way with time, as discussed in previous Sect. 5.1. Our sample of 17 galaxies is not large enough to probe more parameters and provide robust conclusions but it is worthwile to keep this possibility in mind.
6 Conclusions
Following the thorough photometric analysis of double-barred galaxies presented in Paper I, we study here the intrinsic photometric properties of inner and outer bars. They are furthermore compared with widely used results from analyses of integrated images and discussed within the context of the formation and evolution of these complex galaxies.
The main observational pieces of evidence observed here are:
-
•
The 17 inner bars analysed in this work show lengths between 0.17 kpc and 2.4 kpc (in-plane semi-major axes).
-
•
Inner bars may be longer than outer bars hosted by other double-barred systems, as we find outer bars spanning from 1.9 kpc to 22.5 kpc in length (in-plane semi-major axes).
-
•
A bimodal distribution of the length ratio between inner and outer bars is found, which is in turn related to two distinct groups of bars in the inner bar length vs. ellipticity diagram. The length ratios are of 11% (similar to the measurement by Erwin & Sparke, 2002) and 35%. The origin of this behaviour is related neither to the Hubble type of the host galaxy nor to the bulge properties. No equivalent bimodality in the off-plane thickness is found.
-
•
No preferred orientation between the outer and inner bars is found, as probed by their deprojected position angles.
-
•
There is no relation between the relative orientation of the two bars and the length ratio.
-
•
No particular trend is found between the strength of the inner and outer bars, being the inner bar weaker or stronger than the outer bar. The bar strength has been probed using the in-plane ellipticity and off-plane thickness as proxies.
-
•
Length and ellipticity are correlated for the case of outer bars, as expected for a fully assembled, settled up structure. Although such correlation is not found for inner bars in general, the group of long inner bars does lay in the short end of the relation for outer bars.
The bimodality observed for the length of the inner bars may be a consequence of (a) a different formation or evolution path for some inner bars; (b) a different nature of the inner discs from which the inner bars are dynamically formed; or (c) a different assembly stage at the moment we are witnessing these galaxies. Previous spectroscopic studies of the stellar populations and star formation histories of double-barred galaxies have demonstrated that inner bars form and behave in an analogous way to large scale bars, thus suggesting that option (a) is very unlikely. These studies have used inner bars belonging to the two subgoups found in this work: the long and the short inner bars. Both explanations (b) and (c) could lay at the basis of the bimodality, but we note that a different assembly stage (c) would imply that the dynamical assembly of inner bars is a slow process that may take several Gyr.
We have also explored whether there is evidence of outer bars being
more evolved systems than single bars. If so, this would leave room for the possibility
that all bars, once they have lived enough, will develop an inner bar
at a later stage of their lives. However, outer bars within double-barred systems
do not appear longer or stronger than purely single bars.
The photometric results presented here in combination with a detailed spectroscopic study of the stellar populations and star formation histories of double-barred galaxies is the most powerful strategy to assess the formation of these systems. Such combination of techniques has already been sucessfully used in de Lorenzo-Cáceres et al. (2019b) for a limited sample of two individuals. Its application to a large sample of double-barred galaxies, as that studied in this paper, would be necessary to constrain the nature of inner bars and their stability over time.
| Galaxy | Re_disc (kpc) | (kpc) | (kpc) | PAIB (∘) | (kpc) | (kpc) | PAOB (∘) | ||
|---|---|---|---|---|---|---|---|---|---|
| (1) | (2) | (3) | (4) | (5) | (6) | (7) | (8) | (9) | (10) |
| NGC357 | 7.64 0.36 | 2.37 | 0.90 | 0.15 | -87.31 | 7.17 | 2.71 | 0.64 | -62.84 |
| NGC718 | 4.18 0.16 | 0.43 | 0.18 | 0.39 | 16.66 | 5.37 | 1.85 | 0.58 | -31.12 |
| NGC2642 | 12.78 0.87 | 0.90 | 0.38 | 0.81 | -19.66 | 14.80 | 5.59 | 0.76 | 116.14 |
| NGC2681 | 2.50 0.06 | 0.17 | 0.06 | 0.10 | -148.95 | 1.95 | 0.74 | 0.33 | -98.43 |
| NGC2859 | 11.54 0.19 | 1.25 | 0.47 | 0.59 | 57.25 | 9.31 | 3.52 | 0.46 | -16.22 |
| NGC2950 | 3.76 0.06 | 0.74 | 0.25 | 0.63 | 66.47 | 4.82 | 1.82 | 0.46 | -0.29 |
| NGC2962 | 7.14 0.27 | 2.25 | 0.85 | 0.49 | -87.72 | 6.52 | 2.76 | 0.23 | -26.31 |
| NGC3368 | 7.79 0.13 | 0.70 | 0.26 | 0.50 | 115.76 | 9.67 | 3.65 | 0.41 | 102.80 |
| NGC3941 | 3.13 0.08 | 1.11 | 0.42 | 0.30 | -105.66 | 2.27 | 0.96 | 0.42 | -25.36 |
| NGC3945 | 6.44 0.11 | 0.98 | 0.37 | 0.73 | 75.08 | 6.65 | 2.82 | 0.53 | 70.55 |
| NGC4314 | 6.50 0.16 | 0.31 | 0.11 | 0.14 | -9.37 | 7.85 | 2.97 | 0.73 | -32.12 |
| NGC4340 | 3.44 0.06 | 0.77 | 0.26 | 0.74 | 13.38 | 5.27 | 2.59 | 0.67 | 20.05 |
| NGC4503 | 3.80 0.06 | 0.87 | 0.39 | 0.31 | -92.81 | 2.80 | 1.19 | 0.54 | -44.63 |
| NGC4725 | 11.12 0.18 | 0.87 | 0.33 | 0.72 | -45.03 | 8.65 | 3.27 | 0.65 | -132.63 |
| NGC5850 | 16.87 0.28 | 2.41 | 1.02 | 0.81 | 46.95 | 22.52 | 7.75 | 0.70 | 108.67 |
| NGC7280 | 5.31 0.25 | 0.59 | 0.25 | 0.84 | -52.75 | 2.60 | 1.10 | 0.34 | 36.72 |
| NGC7716 | 4.53 0.17 | 1.47 | 0.55 | 0.09 | -80.95 | 5.23 | 2.22 | 0.46 | 9.88 |
Notes. (1) Galaxy name; (2) physical disc effective radius in kpc; (3) deprojected physical inner bar length (semi-major axis) in kpc; (4) deprojected inner bar effective radius in kpc; (5) deprojected inner bar ellipticity; (6) deprojected inner bar position angle in degrees; (7) deprojected physical outer bar length (semi-major axis) in kpc; (8) deprojected outer bar effective radius in kpc; (9) deprojected outer bar ellipticity; and (10) deprojected outer bar position angle in degrees. Deprojection adds its own uncertainties; they depend on the galaxy inclination but are generally within 10% of the values. We refer the reader to Zou et al. (2014) for an analysis on the uncertainties caused by deprojection over bar parameters.
Acknowledgments
The authors are very grateful to the anonymous referee of this paper for his/her careful revision and interesting suggestions. AdLC acknowledges support from grants ST/J001651/1 (UK Science and Technology Facilities Council - STFC) and AYA2016-77237-C3-1-P (Spanish Ministry of Economy and Competitiveness - MINECO). JMA acknowledges support from the Spanish Ministry of Economy and Competitiveness (MINECO) by grant AYA2017-83204-P. LC acknowledges financial support from Comunidad de Madrid under Atracción de Talento grant 2018-T2/TIC-11612 and the Spanish Ministerio de Ciencia, Innovación y Universidades through grant PGC2018-093499-B-I00.
References
- Abraham & Merrifield (2000) Abraham R. G., Merrifield M. R., 2000, AJ, 120, 2835
- Aguerri et al. (1998) Aguerri J. A. L., Beckman J. E., Prieto M., 1998, AJ, 116, 2136
- Aguerri et al. (2009) Aguerri J. A. L., Méndez-Abreu J., Corsini E. M., 2009, A&A, 495, 491
- Aguerri et al. (2000) Aguerri J. A. L., Muñoz-Tuñón C., Varela A. M., Prieto M., 2000, A&A, 361, 841
- Ahn et al. (2012) Ahn C. P., Alexandroff R., Allende Prieto C., Anderson S. F., Anderton T., Andrews B. H., Aubourg É., Bailey S., Balbinot E., Barnes R., et al. 2012, ApJS, 203, 21
- Athanassoula & Misiriotis (2002) Athanassoula E., Misiriotis A., 2002, MNRAS, 330, 35
- Berentzen et al. (2007) Berentzen I., Shlosman I., Martínez-Valpuesta I., Heller C. H., 2007, ApJ, 666, 189
- Bournaud & Combes (2002) Bournaud F., Combes F., 2002, A&A, 392, 83
- Buta & Block (2001) Buta R., Block D. L., 2001, ApJ, 550, 243
- Corsini et al. (2003) Corsini E. M., Debattista V. P., Aguerri J. A. L., 2003, ApJ, 599, L29
- Costantin et al. (2018a) Costantin L., Corsini E. M., Méndez-Abreu J., Morelli L., Dalla Bontà E., Pizzella A., 2018a, MNRAS, 481, 3623
- Costantin et al. (2018b) Costantin L., Méndez-Abreu J., Corsini E. M., Eliche-Moral M. C., Tapia T., Morelli L., Dalla Bontà E., Pizzella A., 2018b, A&A, 609, A132
- de Lorenzo-Cáceres et al. (2013) de Lorenzo-Cáceres A., Falcón-Barroso J., Vazdekis A., 2013, MNRAS, 431, 2397
- de Lorenzo-Cáceres et al. (2008) de Lorenzo-Cáceres A., Falcón-Barroso J., Vazdekis A., Martínez-Valpuesta I., 2008, ApJ, 684, L83
- de Lorenzo-Cáceres et al. (2019a) de Lorenzo-Cáceres A., Méndez-Abreu J., Thorne B., Costantin L., 2019a, MNRAS, 484, 665
- de Lorenzo-Cáceres et al. (2019b) de Lorenzo-Cáceres A., Sánchez-Blázquez P., Méndez-Abreu J., Gadotti D. A., Falcón-Barroso J., et al. 2019b, MNRAS, 484, 5296
- de Lorenzo-Cáceres et al. (2012) de Lorenzo-Cáceres A., Vazdekis A., Aguerri J. A. L., Corsini E. M., Debattista V. P., 2012, MNRAS, 420, 1092
- Debattista & Sellwood (2000) Debattista V. P., Sellwood J. A., 2000, ApJ, 543, 704
- Debattista & Shen (2007) Debattista V. P., Shen J., 2007, ApJ, 654, L127
- Du et al. (2015) Du M., Shen J., Debattista V. P., 2015, ApJ, 804, 139
- Englmaier & Shlosman (2004) Englmaier P., Shlosman I., 2004, ApJ, 617, L115
- Erwin (2004) Erwin P., 2004, A&A, 415, 941
- Erwin (2005) Erwin P., 2005, MNRAS, 364, 283
- Erwin (2011) Erwin P., 2011, Memorie della Societa Astronomica Italiana Supplementi, 18, 145
- Erwin (2019) Erwin P., 2019, MNRAS, 489, 3553
- Erwin & Sparke (2002) Erwin P., Sparke L. S., 2002, AJ, 124, 65
- Ferrers (1877) Ferrers N. M., 1877, Quart. J. Pure and Appl. Math, 14, 1
- Font et al. (2014) Font J., Beckman J. E., Zaragoza-Cardiel J., Fathi K., Epinat B., Amram P., 2014, MNRAS, 444, L85
- Friedli & Martinet (1993) Friedli D., Martinet L., 1993, A&A, 277, 27
- Gadotti (2011) Gadotti D. A., 2011, MNRAS, 415, 3308
- Gadotti et al. (2007) Gadotti D. A., Athanassoula E., Carrasco L., Bosma A., de Souza R. E., Recillas E., 2007, MNRAS, 381, 943
- Heller et al. (2001) Heller C., Shlosman I., Englmaier P., 2001, ApJ, 553, 661
- Kormendy (1977) Kormendy J., 1977, ApJ, 218, 333
- Laurikainen et al. (2005) Laurikainen E., Salo H., Buta R., 2005, MNRAS, 362, 1319
- Laurikainen et al. (2002) Laurikainen E., Salo H., Rautiainen P., 2002, MNRAS, 331, 880
- Maciejewski & Small (2010) Maciejewski W., Small E. E., 2010, ApJ, 719, 622
- Maciejewski & Sparke (2000) Maciejewski W., Sparke L. S., 2000, MNRAS, 313, 745
- Martin (1995) Martin P., 1995, AJ, 109, 2428
- Martinez-Valpuesta & Shlosman (2004) Martinez-Valpuesta I., Shlosman I., 2004, ApJ, 613, L29
- Martinez-Valpuesta et al. (2006) Martinez-Valpuesta I., Shlosman I., Heller C., 2006, ApJ, 637, 214
- Méndez-Abreu et al. (2008) Méndez-Abreu J., Aguerri J. A. L., Corsini E. M., Simonneau E., 2008, A&A, 478, 353
- Méndez-Abreu et al. (2018) Méndez-Abreu J., Costantin L., Aguerri J. A. L., de Lorenzo-Cáceres A., Corsini E. M., 2018, MNRAS, 479, 4172
- Méndez-Abreu et al. (2019) Méndez-Abreu J., de Lorenzo-Cáceres A., Gadotti D. A., Fragkoudi F., van de Ven G., Falcón-Barroso J., Leaman R., Pérez I., Querejeta M., Sánchez-Blazquez P., Seidel M., 2019, MNRAS, 482, L118
- Méndez-Abreu et al. (2014) Méndez-Abreu J., Debattista V. P., Corsini E. M., Aguerri J. A. L., 2014, A&A, 572, A25
- Méndez-Abreu et al. (2017) Méndez-Abreu J., Ruiz-Lara T., Sánchez-Menguiano L., de Lorenzo-Cáceres A., Costantin L., et al. 2017, A&A, 598, A32
- Méndez-Abreu et al. (2010) Méndez-Abreu J., Sánchez-Janssen R., Aguerri J. A. L., 2010, ApJ, 711, L61
- Pagotto et al. (2017) Pagotto I., Corsini E. M., Dalla Bontà E., Beifiori A., Costantin L., Cuomo V., Morelli L., Pizzella A., Sarzi M., 2017, Astronomische Nachrichten, 338, 841
- Pérez et al. (2017) Pérez I., Martínez-Valpuesta I., Ruiz-Lara T., de Lorenzo-Caceres A., Falcón-Barroso J., et al. 2017, MNRAS, 470, L122
- Saha & Maciejewski (2013) Saha K., Maciejewski W., 2013, MNRAS, 433, L44
- Sánchez et al. (2012) Sánchez S. F., Kennicutt R. C., Gil de Paz A., van de Ven G., Vílchez J. M., et al. 2012, A&A, 538, A8
- Sánchez-Blázquez et al. (2011) Sánchez-Blázquez P., Ocvirk P., Gibson B. K., Pérez I., Peletier R. F., 2011, MNRAS, 415, 709
- Sérsic (1968) Sérsic J. L., 1968, Atlas de galaxias australes
- Wozniak (2007) Wozniak H., 2007, A&A, 465, L1
- Wozniak (2015) Wozniak H., 2015, A&A, 575, A7
- York et al. (2000) York D. G., Adelman J., Anderson Jr. J. E., Anderson S. F., Annis J., et al. 2000, AJ, 120, 1579
- Zou et al. (2014) Zou Y., Shen J., Li Z.-Y., 2014, ApJ, 791, 11