Current address:] Google, Inc., New York, NY
Properties of Interaction Networks in Compressed Two and Three Dimensional Particulate Systems
Abstract
We consider two (2D) and three (3D) dimensional granular systems exposed to compression, and ask what is the influence of the number of physical dimensions on the properties of the interaction networks that spontaneously form as these systems evolve. The study is carried out based on discrete element simulations of frictional disks in 2D and spheres in 3D. Within the constraints of the considered protocols involving compression, system properties (involving the presence of bounding walls) and finite system sizes considered, the main finding is that both the number of physical dimensions and the type of particle-particle interaction influence significantly the properties of interaction networks. These networks play an important role in bridging the microscale (particle size) and macroscale (system size), thus both aspects (the interaction model and dimensionality) are carefully considered. Our work uses a combination of tools and techniques, including percolation study, statistical analysis, as well as algebraic topology-based techniques. In many instances we find that different techniques and measures provide complementary information that, when combined, allow for gaining better insight into the properties of interaction networks.
I Introduction
Particulate systems are very common in nature and take different form ranging from dry or wet granular matter to suspensions. Still, there are many unresolved fundamental questions. In particular, the connection between microscale behavior (on the scale of constitutive granular particles) and macroscale response of granular systems that are subject to external load, such as compression or shear, is still an open question.
A significant body of work, that has been mostly developed during the last decade, suggests that connecting the micro and macroscale involves interaction networks that spontaneously develop in particulate-based systems. These works involve topology-based studies arevalo_bif_chaos_09 ; arevalo_pre10 ; arevalo_pre13 ; azema_pre_12 ; ardanza_pre14 ; epl12 ; pre13 ; kramar_2014 ; kramar_pre_14 ; Pugnaloni_2016 ; kondic_2016 ; pg17 ; PRE_2018 ; pre18_impact , cluster analysis zhang_10 ; tordesillas_pre10 ; walker_pre12 , community detection schemes peters05 ; daniels_pre12 , force network ensembles tighe_sm10 ; tighe_jsm11 ; sarkar_prl13 , statistical analysis radjai_96b ; radjai97b ; radjai99 percolation-based approaches ostojic06 ; kovalcinova_scaling ; ostojic_pre07 ; stauffer , and discussion of percolation and jamming transitions kovalcinova_percolation ; ohern01 ; ohern_pre03 ; ohern_pre_12 ; Pastor-Satorras_12 ; stauffer .
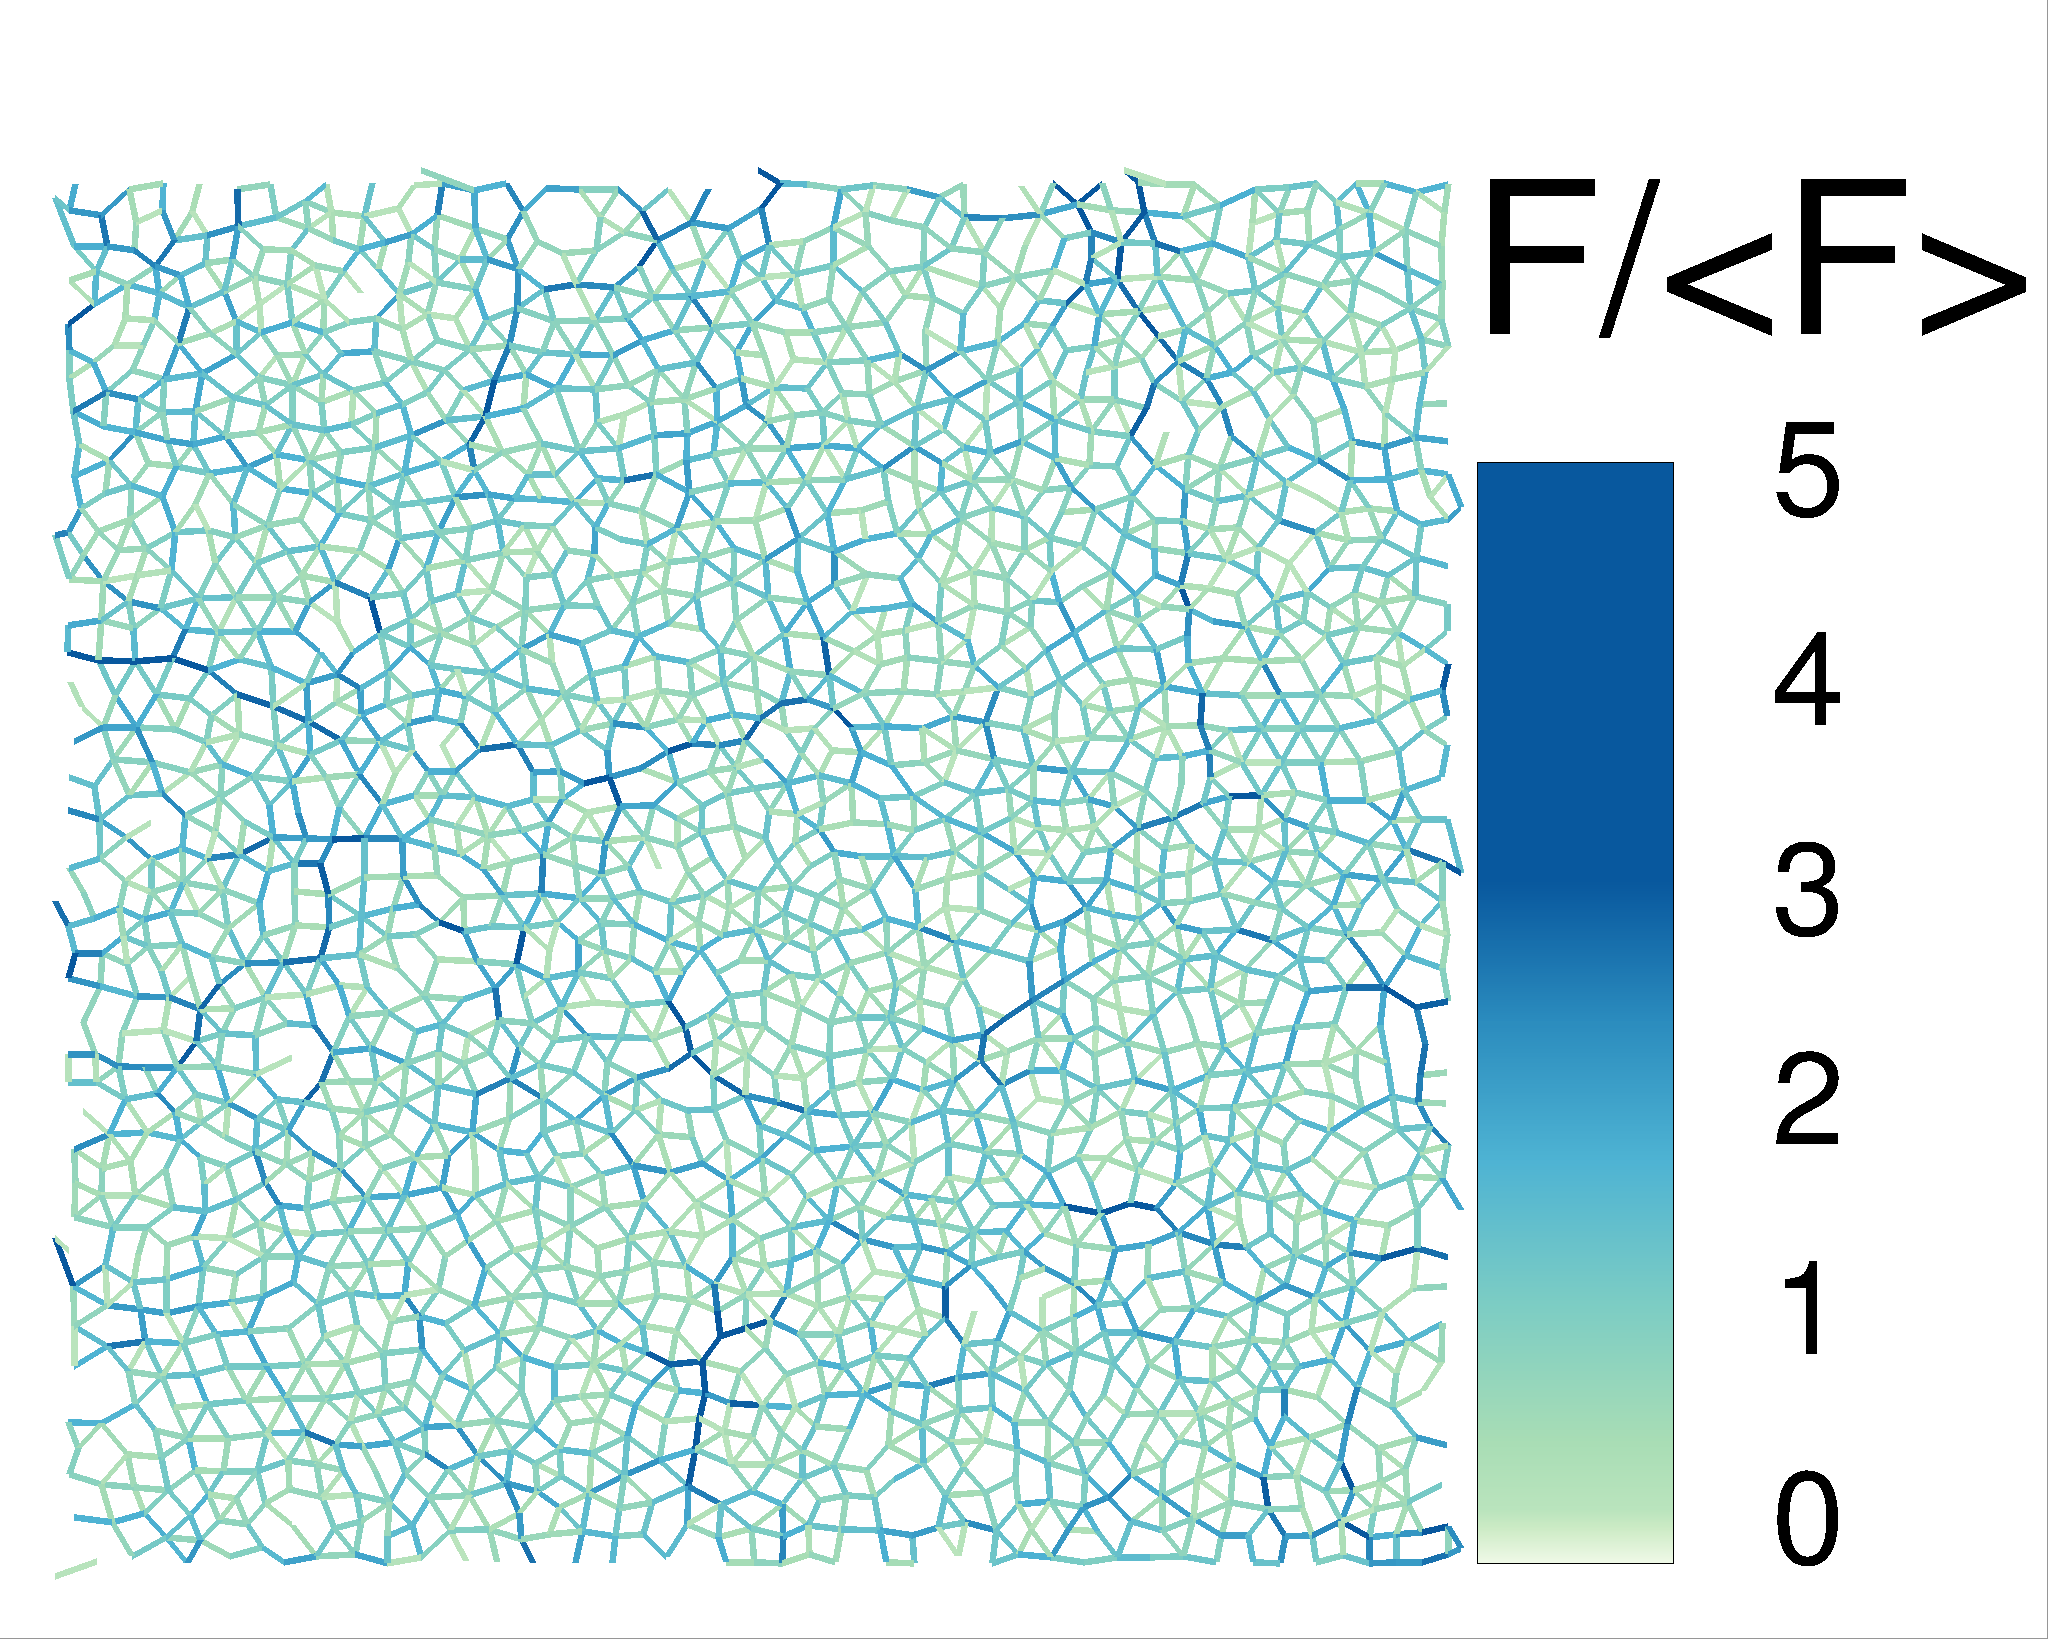
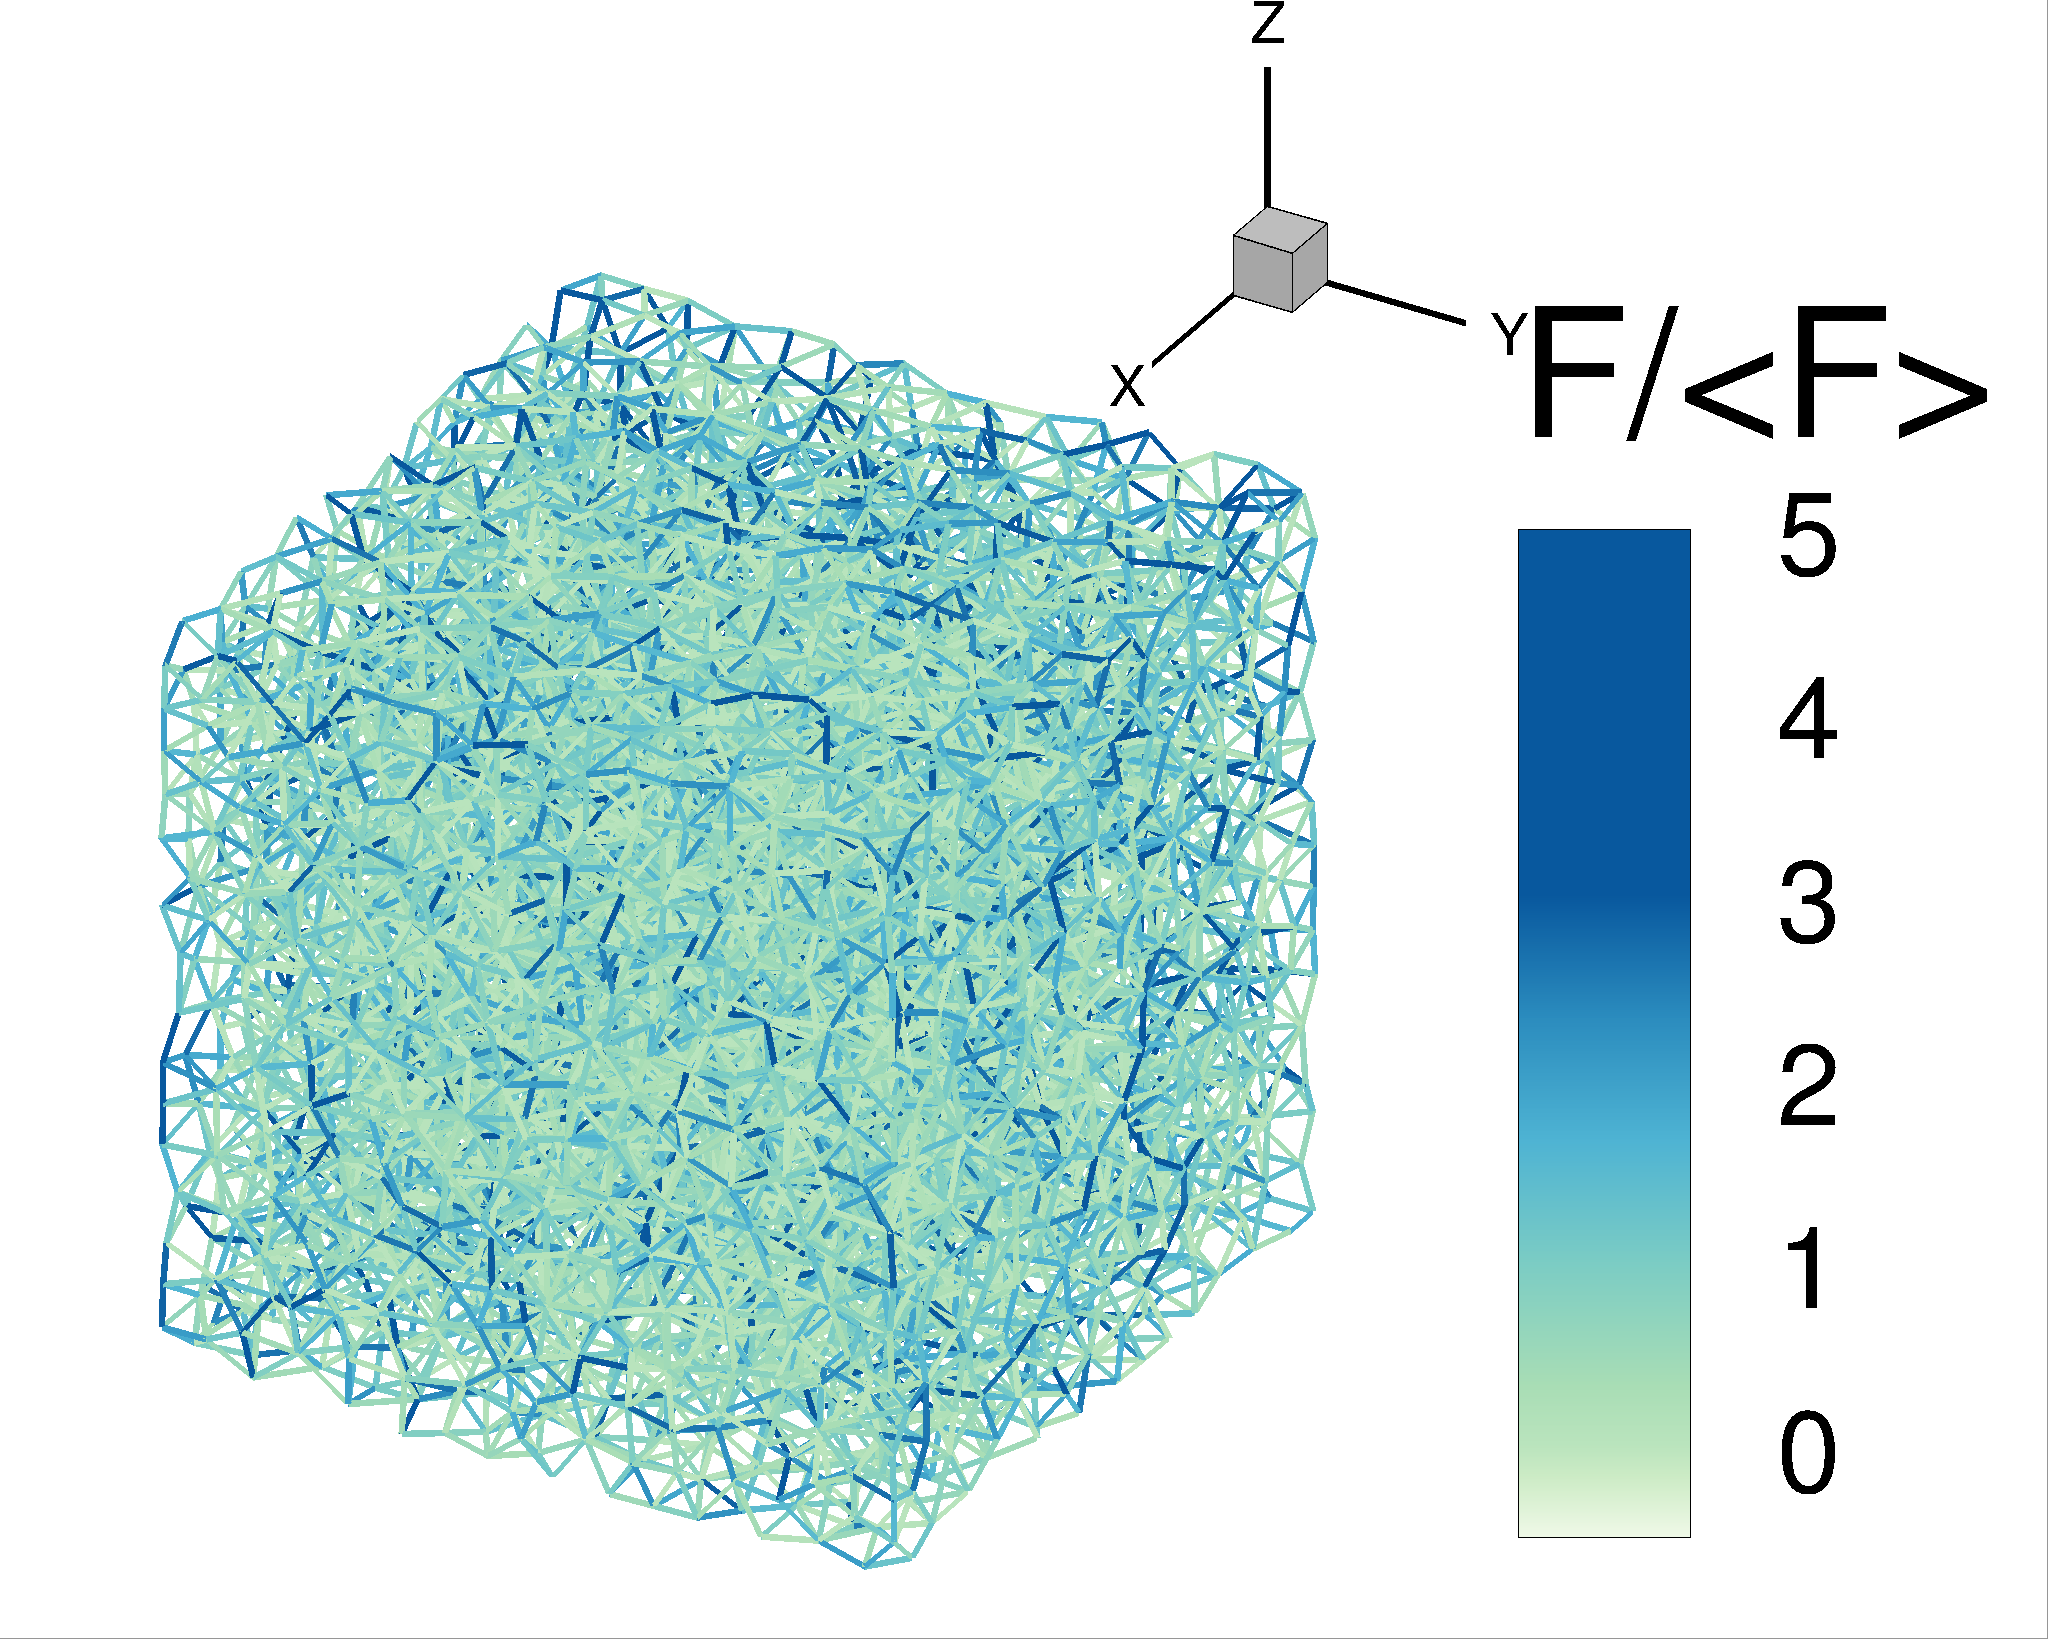
Most of the past analysis of interaction networks obtained computationally is carried out in two spatial dimensions (D) due to reduced computational complexity and simplified interpretation of the results. A significant amount of experimental work focusing on interaction networks has been carried out in D as well, mostly using photoelastic particles, see, e.g. majmudar05a ; clark_prl12 . However, a majority of applications focus on three spatial dimensions (D). In D experiments, it is difficult to extract the information about particle contacts and in particular interaction strength. While there have been recent experimental works in D using, e.g., hydrogel brodu_natcom_15 rubber Saadatfar_2012 particles, or oil droplets brujic_2003 , the progress has been rather limited. Currently, experimental techniques that could be used to track the force networks for stiff and frictional 3D particles, are just being developed hurley_prl16 , and this field of investigation has to rely mostly on simulation results. In addition to being computationally costly, D simulations are complicated to analyze, compared to 2D. As an illustration, Fig. 1 shows two examples from the simulations that we will consider in the present paper. Relatively recent approaches that focus on inter-particle forces include measurements of force probability density function silbert02a , as well as various network-based approaches (see Papadopoulos_18 for a review). However, it is not obvious how to correlate and compare D results to the ones obtained in much more commonly considered D geometry. This is the main goal of the present work.
The number of physical dimensions has complex influence on the properties of interaction networks in particulate systems. First, the interaction networks are built on top of contact networks between the particles, and contact networks are clearly influenced by the number of physical dimensions, since the geometry of particle contacts differs in D and D. Second, the interaction between the particles is influenced by the particle shape - commonly disks are considered in D and spheres in D (of course, more complex D and D shapes could be considered, but we do not discuss these in the present work). Assuming validity of the standard approach based on Hertz model, one finds that the (normal) interaction force, , between particles should scale as , where the compression distance, , is defined in soft particle simulations as the difference between the sum of particle radii and the distance of their centers, and for 2D and 3D, respectively. Thus, there are two obvious aspects of the influence of the number of physical dimensions on particle interactions. It is desirable to separate these two aspects so that one could distinguish between the influence of the number of dimensions on contact geometry, and on the force interaction law. In addition, experiments carried out in D in some cases find that particle interaction law deviates from Hertzian theory, and that PRE_2018 . Therefore, motivated both by our desire to separate the aspects influencing particle interactions, and by the listed experiments, we consider D systems with both and , in addition to considering D systems with .
In this paper, we focus on granular systems, however we expect that the results will be of interest to other particulate-based systems, such as suspensions, emulsions, or foams, and even to the systems characterized by more complex interaction between interacting particles, such as gels. We focus on the compression protocol, so that we could discuss evolution of interaction networks as the considered systems evolve through jamming transition.
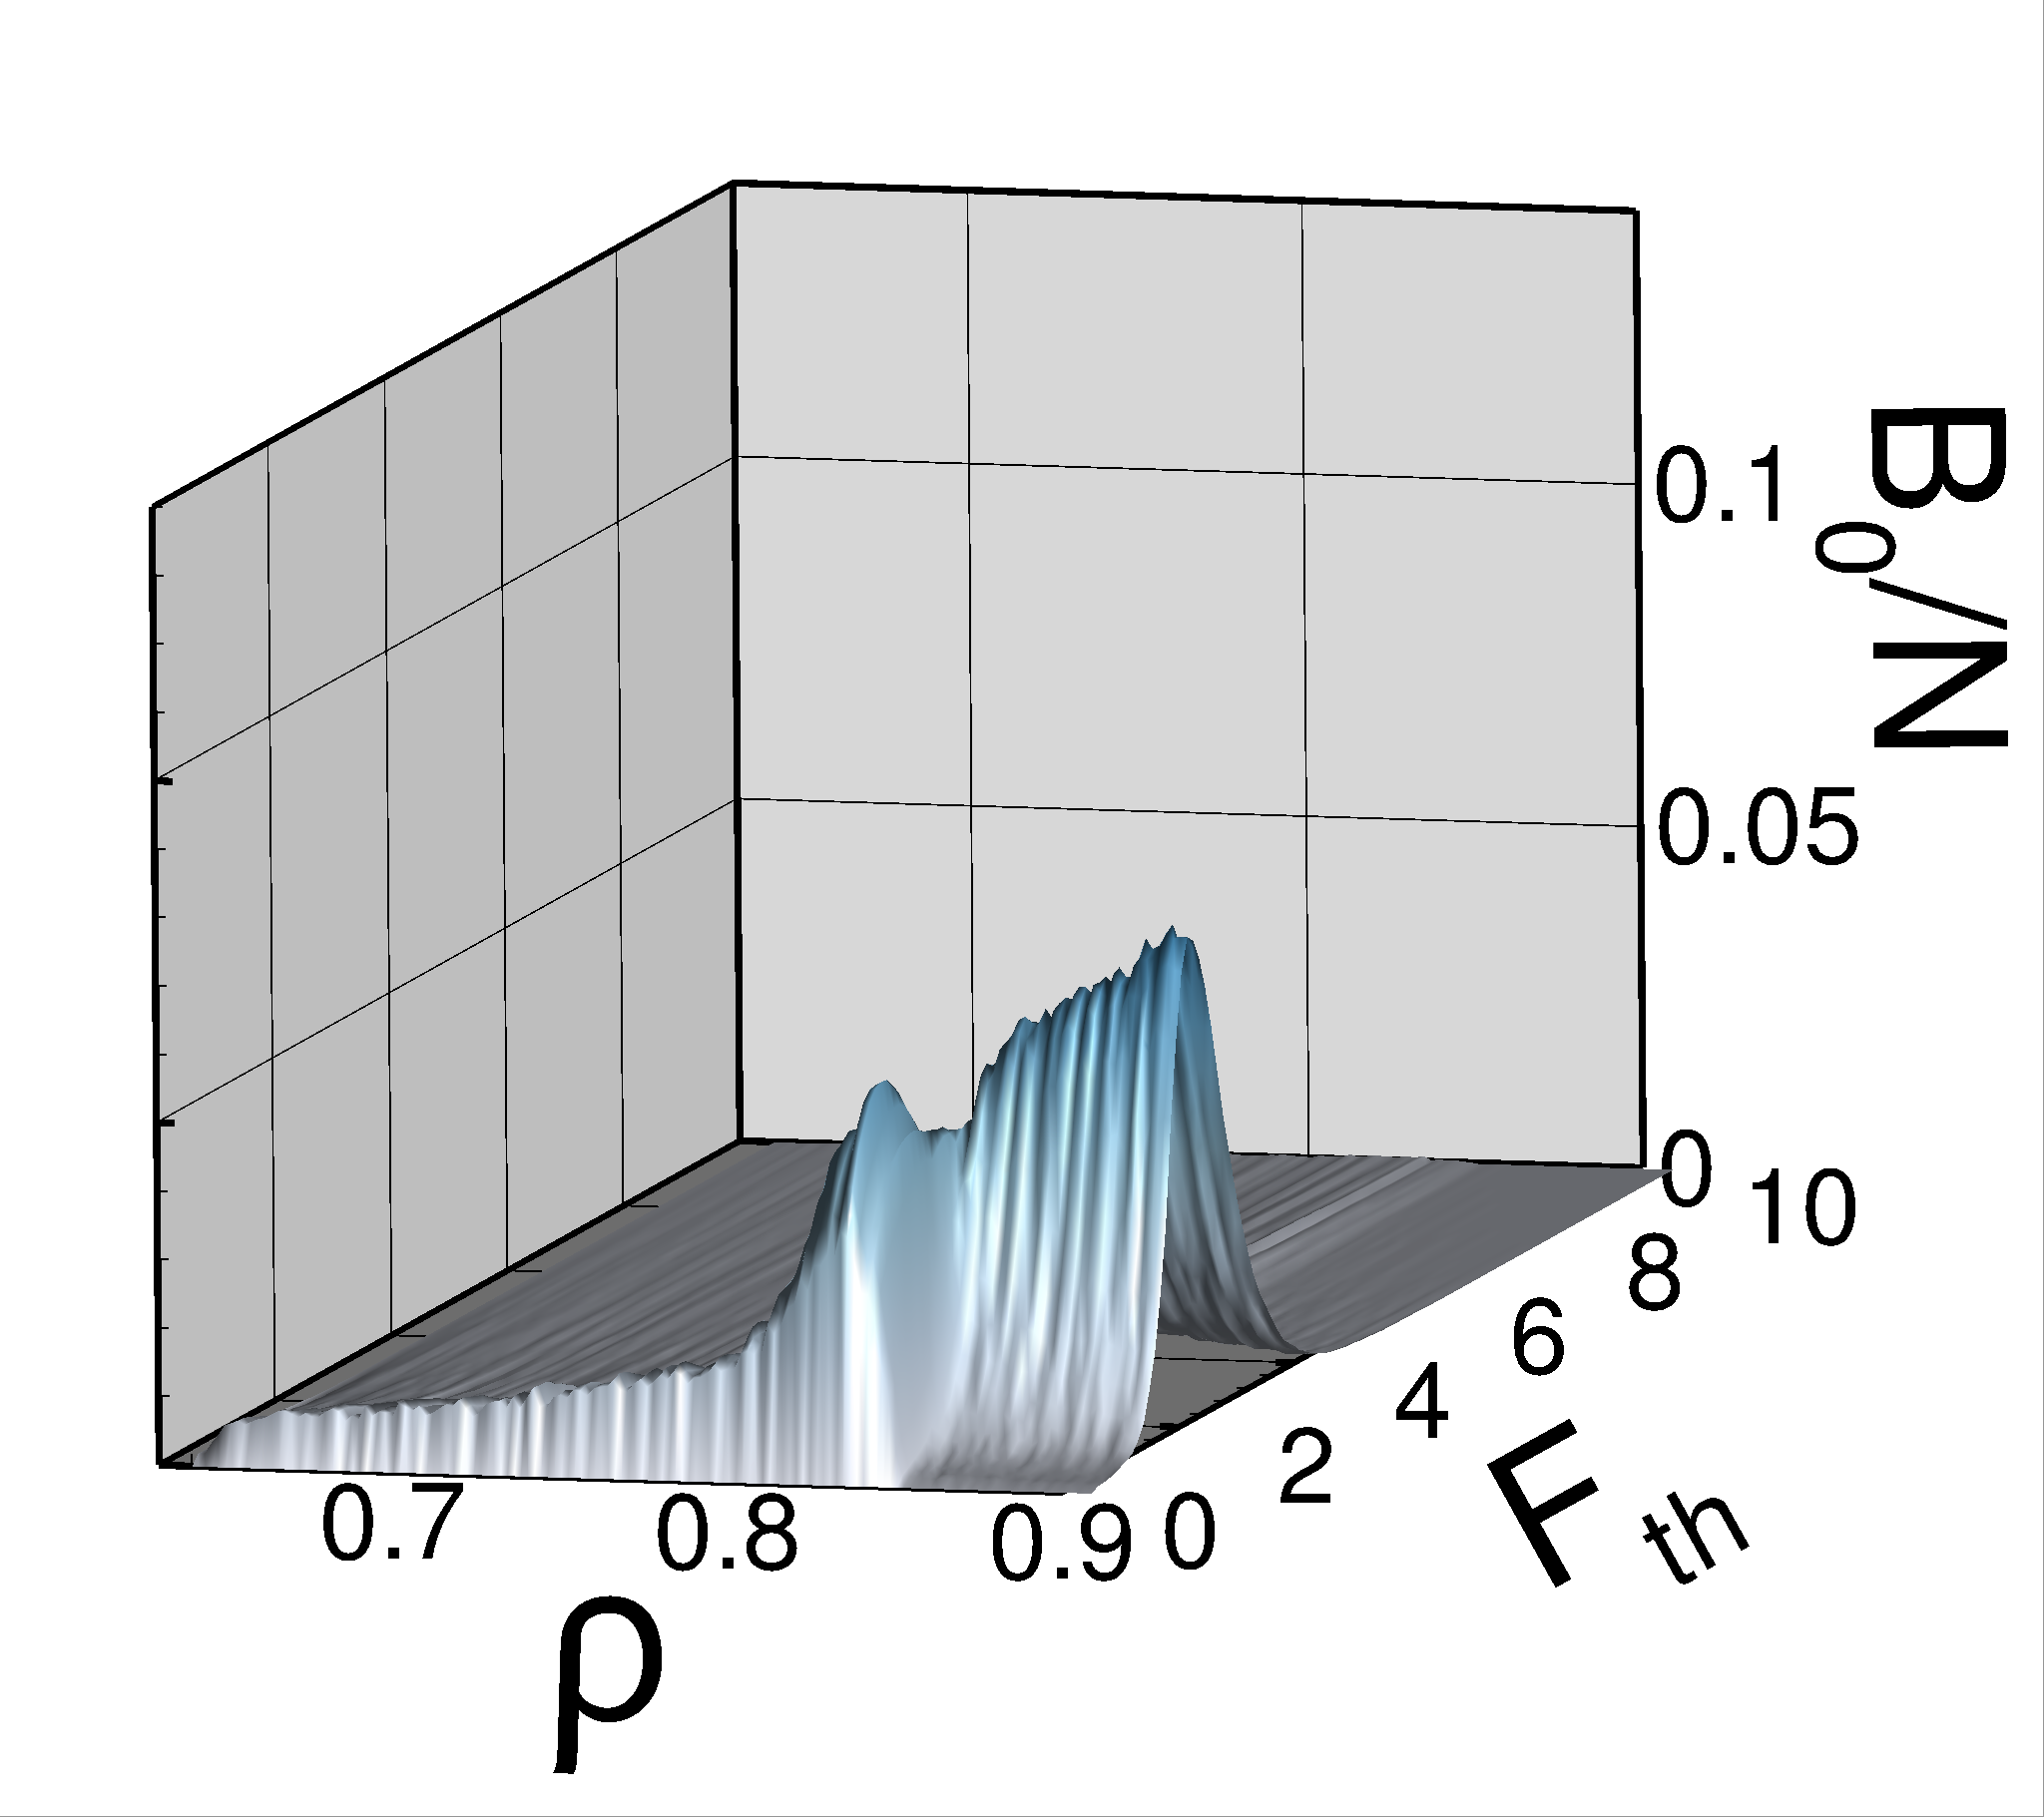
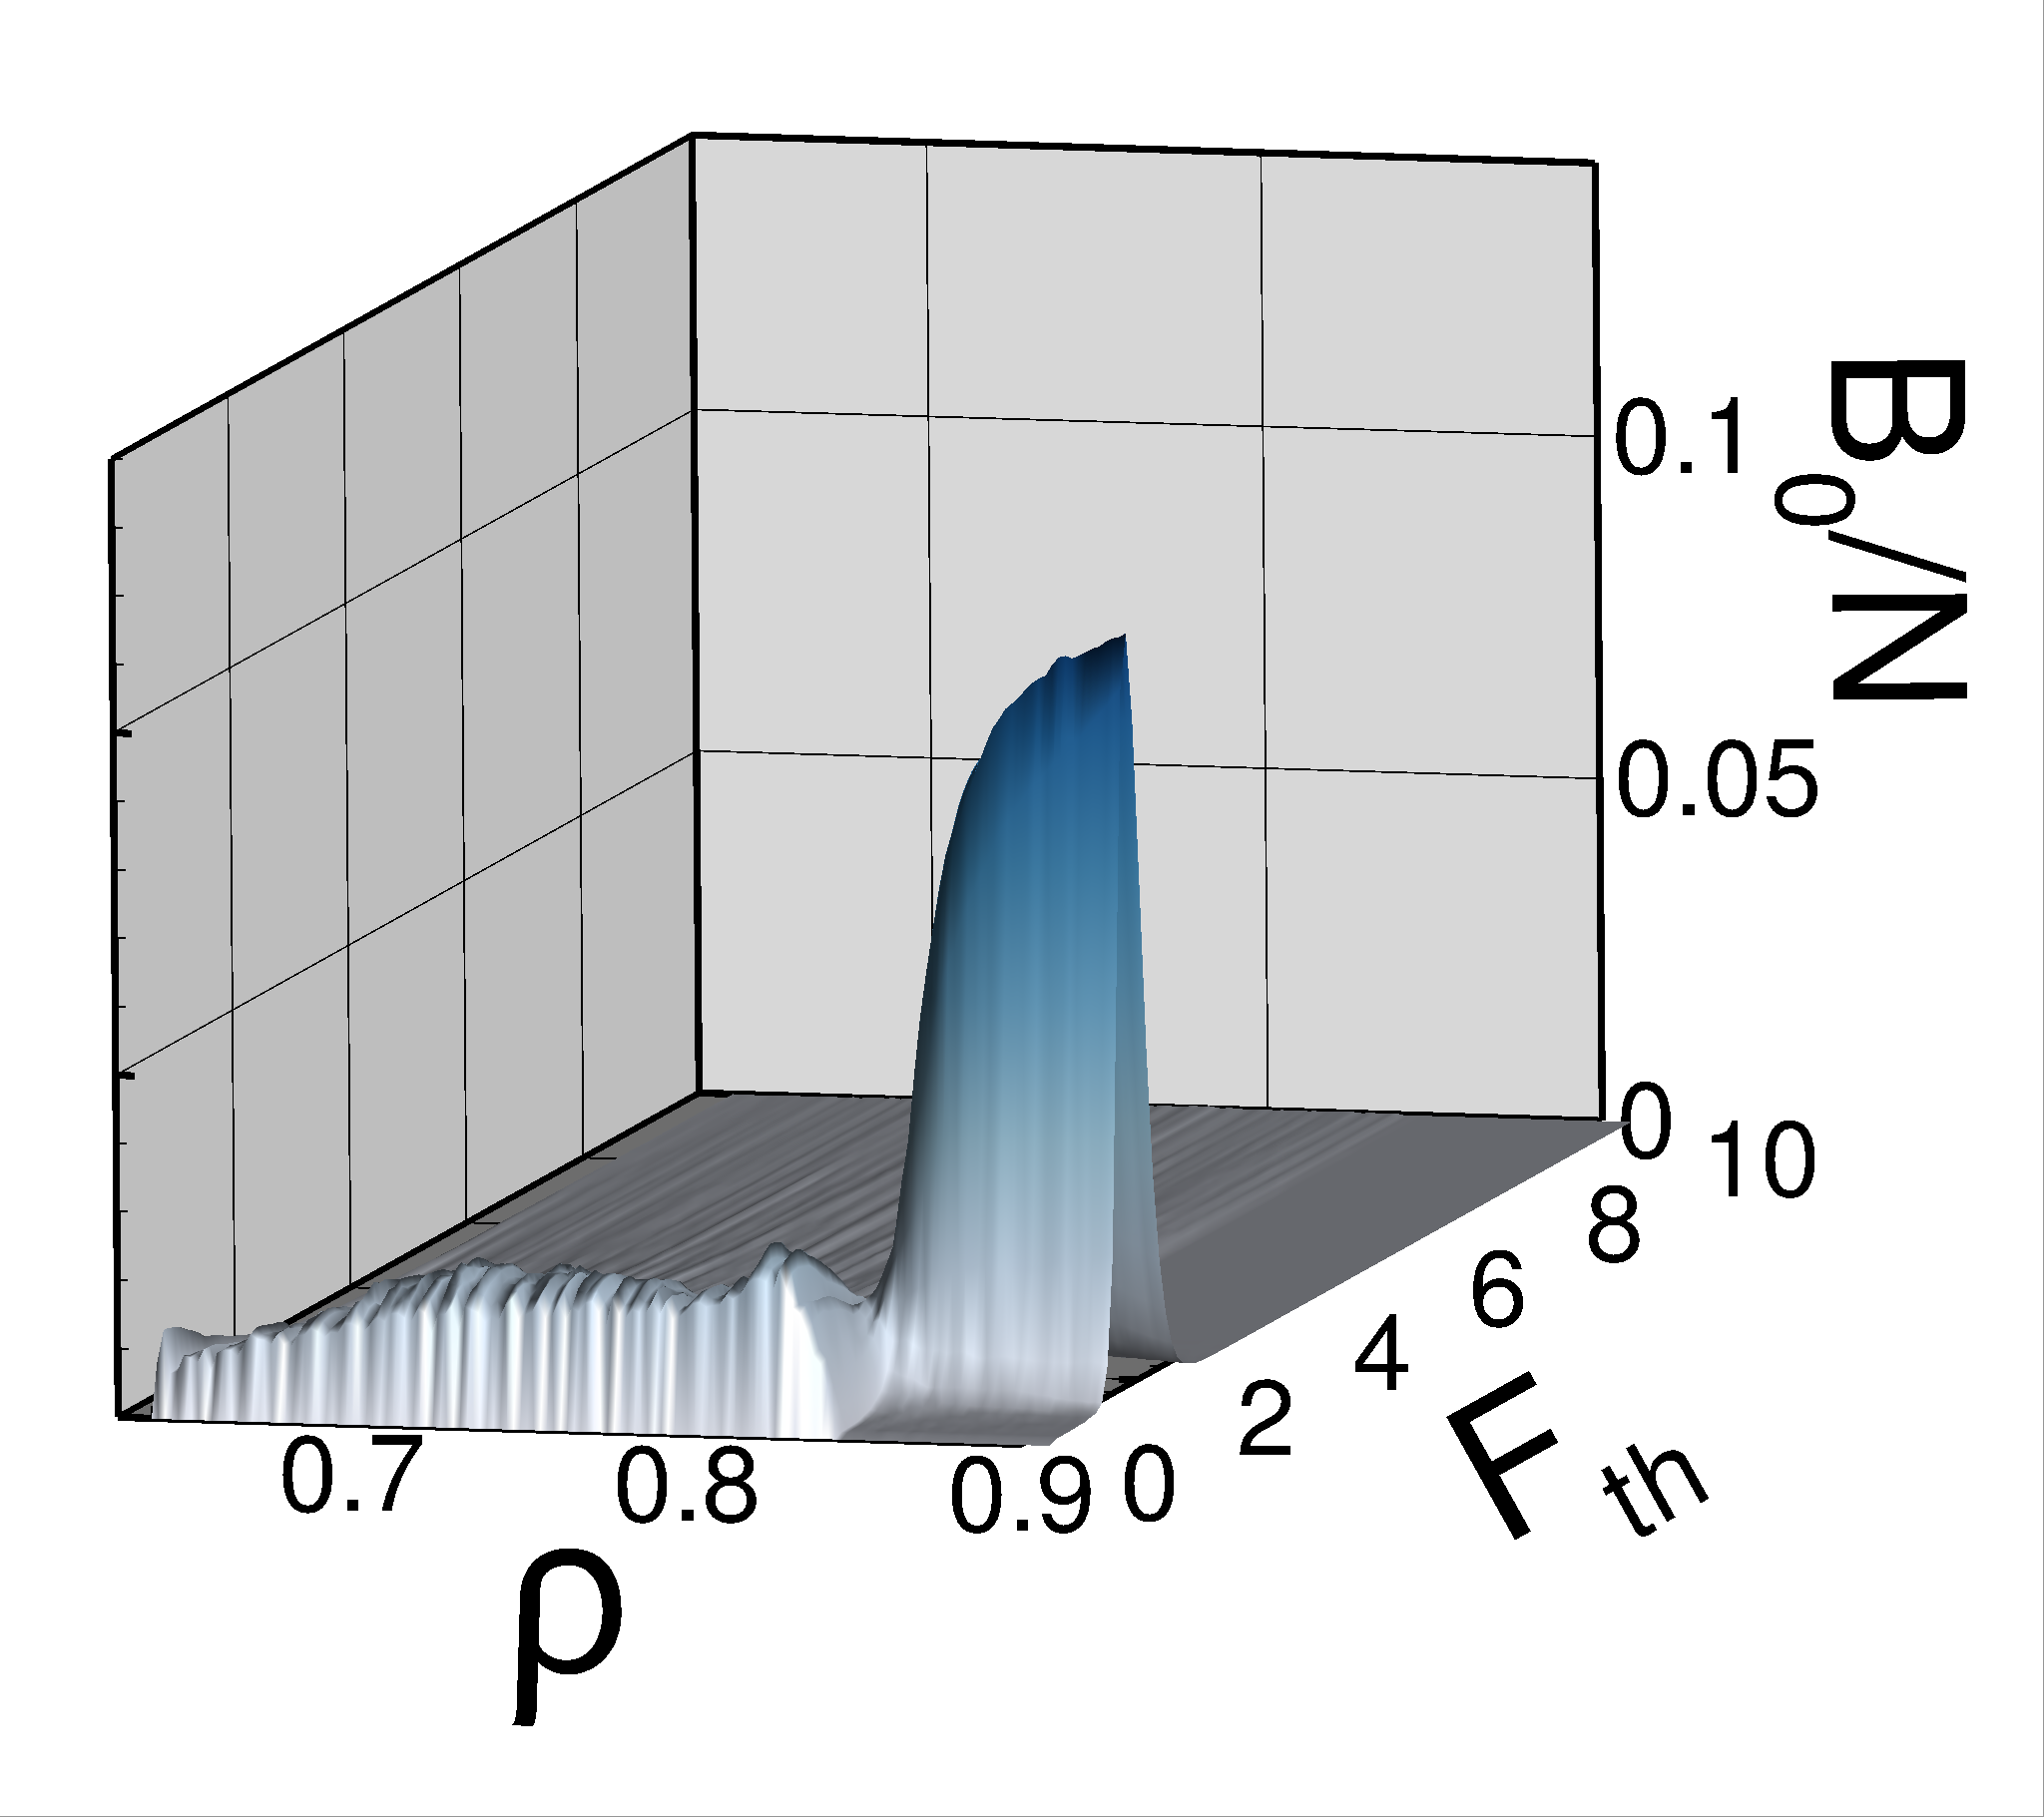
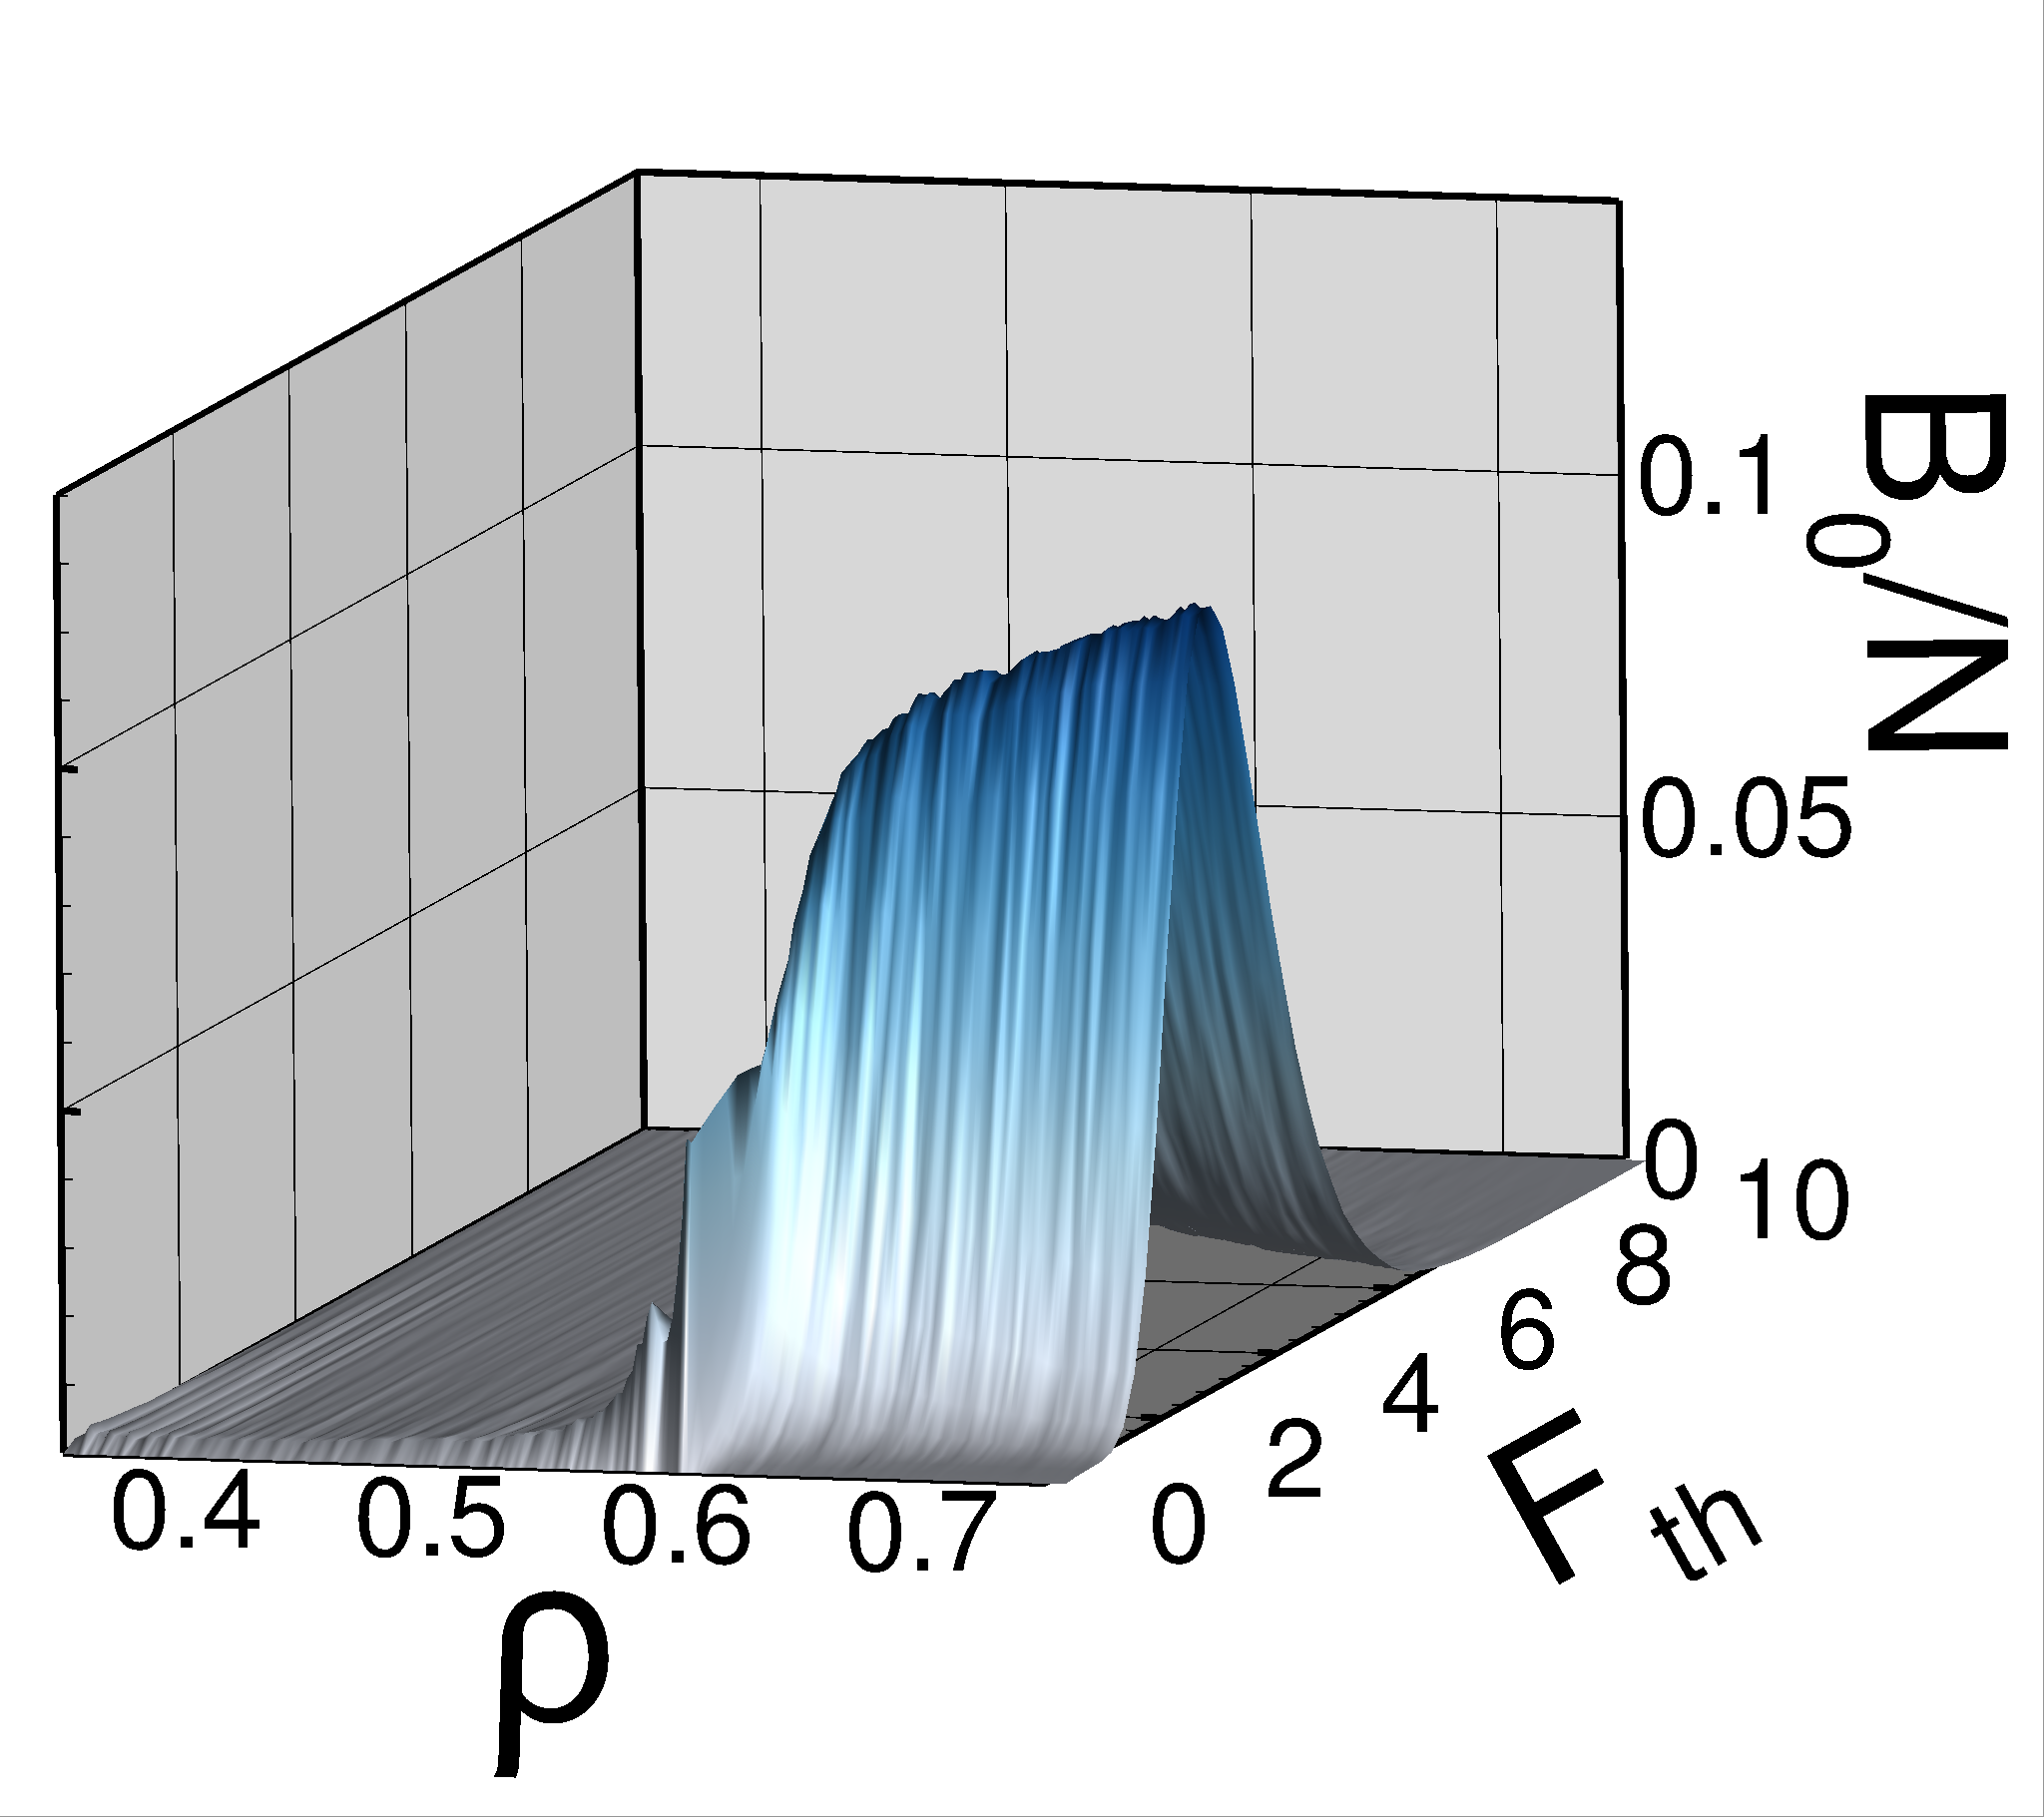
To introduce the results that will be discussed in the rest of this paper, Fig. 2 shows the simplest topological measure, zeroth Betti number, , that counts the number of connected components (clusters), as a function of imposed force threshold (panels (c - e)) (only the particle contacts characterized by the force larger than the specified threshold are considered). The evolution from small to large volume fractions is driven by slowly converging walls, as discussed in more detail in Sec. III. To put the results in perspective, we note that choosing a threshold, , that corresponds to the average force between the particles, would separate the considered networks into ‘strong’ (the contacts involving forces larger than the average), and ‘weak’ (the remaining contacts) radjai97 . The approach considered in the present work is more general, since we vary the considered force thresholds continuously and are therefore in the position to obtain more complete picture describing the networks. We will discuss introduced above, as well as , that measures the number of loops in D, or tunnels in D (sometimes also called ‘cycles’). In D we will also discuss , measuring the number of enclosed voids, but to much lesser extend. In the second part of the paper we present the results obtained by implementing more complex measures based on persistent homology. We note that the software for computing Betti numbers as well as persistence measures discussed later in the paper is widely available in the public domain perseus ; javaPlex ; phat ; gudhi .
Before closing the introduction, we should also point out the aspects of the considered problem that are addressed only marginally in the present work. First, the main part of results that are reported in the manuscript are obtained using specified domain size for the 2D and 3D systems considered. We carried out limited set of additional simulations and corresponding data analysis to verify that the results regarding interaction networks remain valid for other system sizes, but have not carried out extensive analysis, leaving such endeavor for the future work. Our focus in the present work is on the qualitative properties of interaction networks in the systems that differ in the number of physical dimensions and the interaction model. We point out to the reader that there is a a number of works where the influence of system size has been discussed; for the discussion in the context of interaction networks we refer the reader to ostojic ; kovalcinova_scaling and references therein; carrying out similar type of analysis with focus on the detailed properties of interaction networks remains to be done. Second, most of the results that we report in the manuscript are empirical, since we are not aware of a well-defined theory or at least a model that could be used for comparison in the context of connectivity and structure of the interaction networks. This being said, we attempt where possible to provide at least qualitative arguments rationalizing the physical reasons leading to the observed properties of the interaction networks.
The rest of this paper is organized as follows. The force model describing the interaction between particles is discussed in Sec. II, and the protocol of the simulations in Sec. III. Section IV gives results based on consideration of percolation, jamming, and force distributions. A complementary set of results obtained using topology-based methods is discussed in Sec. V. An overview and conclusions are given in Sec. VI.
II Force Model
We perform discrete element simulations using a set of circular disks confined to a square domain (D) or spheres in a cubic domain (D). The number of particles in D is and in D. The walls are flat and are given material properties of a plexiglass (the choice of the wall material is motivated by recent experiments brodu_natcom_15 ). The domain length is initially set to (in D) and (in D) average particle diameters. To avoid crystallization, the system particles are chosen as bidisperse in all systems and the ratio of the diameters of the small and large particles is . The ratio of the number of small to large particles is .
Particles are soft and interact via normal and tangential forces that include static friction and viscous damping. The force model used in the simulations is either linear or non-linear. The linear force model is used only in D and arises from the derivation of the Hertz law. The non-linear force is considered for both D and D. The analysis of the results for the non-linear force model in D is motivated by our recent study PRE_2018 that showed that using non-linear force model in D is essential for achieving a quantitative match between simulations and experiments.
The general form of the normal force between particles and is (for more details, see kondic_99 )
| (1) | |||||
Exponents and for linear and and for non-linear force model with ; is set to the relative normal velocity and and are Young’s modulus and Poisson ratio, respectively. The amount of compression is , where , and are the diameters of the particles and . Note that for simplification we assume that in the expression for the force constant, , is the overall average particle diameter of all particles. Also, , where are the vectors pointing from the centers of particles towards the point of contact. The value of Young’s modulus and Poisson ratio is set to those of soft hydrogel particles in brodu_pre_15 . Choosing the same values of material parameters for D and D simplifies the comparison between different systems that we consider; it should be also noted that the choice simply specifies the time scale in the problem; a different choice of (for example) stiffer particles would simply change the relevant time scale without modifying the results in any significant manner 111Minor influence of different material properties of the particles could be due to particle - wall interaction, and, in the case of a nonlinear force model, due to weak dependence of the particle collision time on impact speed..
We implement the commonly used Cundall-Strack model for static friction cundall79 , where a tangential spring is introduced between the particles for each new contact that forms at time . Due to the relative motion of the particles, the spring length, , evolves as , where and is the relative velocity. For long lasting contacts, may not remain parallel to the current tangential direction defined by (see, e.g,. brendel98 ); we therefore define the corrected and introduce the test force
| (2) |
where (close to the value used in goldhirsch_nature05 ) and is the coefficient of viscous damping in the tangential direction (with ). The value of the friction coefficient is set to . To ensure that the magnitude of the tangential force remains below the Coulomb threshold, we constrain the tangential force as follows
| (3) |
The interaction between a particle and flat wall is given by the same expression as in the case of interaction between two particles except for assuming that the amount of compression where is particle diameter and is the vector pointing from the particle center towards the point of contact with the flat wall.
All the results given in the rest of the paper are presented using the following length, time, and mass scales. The characteristic length scale is cm, and the average particle mass, g brodu_pre_15 , is the mass scale. The binary particle collision time, , is the time scale set to kondic_99
| (4) |
where cm/s is a characteristic magnitude of velocity in the system (compression speed); prefactor is of the form luding94d
| (5) |
where denotes Gamma function. In particular, for the linear force model we have and for the non-linear force model . The damping coefficient is obtained as reported in kondic_99 . Note that the average particle mass and diameter are the same for D and D systems; the thickness of the disk particles in D is chosen to ensure that this is the case.
We integrate Newton’s equations of motion for the translational and rotational degrees of freedom using a th order predictor-corrector method with the time step and in D and D, respectively. Smaller value of time step in D is needed to keep the minimum distance between interacting particles sufficiently large for the whole duration of the simulations. The use of smaller time step in D does not influence the results that follow in any visible manner.
III Protocol and Methods
The initial condition is produced by placing the particles on a square (2D) or a cubic (3D) grid and by assigning to each particle a random initial velocity; we verified that the results presented here are not sensitive to the specific distribution from which the velocities are sampled. To ensure a statistical significance of the results, we perform simulations for different initial conditions for each considered system.
The system is compressed by moving the walls inward with the velocity . Relaxation is interjected after each compression step of , where is the packing fraction, defined as the ratio of the total volume of the particles and the domain volume. After each compression step, the kinetic energy dissipates exponentially when the system is relaxed; we continue relaxation until the fluctuation of the kinetic energy drops to of the mean, that is computed over time steps. We verified that a more strict relaxation condition does not change our conclusions nor does it change the measured quantities significantly; however if the threshold for the kinetic energy fluctuations is set to a value , the computational time increases significantly and the differences in the results are on the level of random fluctuations in each measured quantity. We find that using a protocol for relaxation based on the total magnitude of the kinetic energy does not yield different results either. We have also implemented different relaxation protocols based on tracking of the average contact number change and on cooling of the particles (annealing). The protocol corresponding to the first method verifies that the contact number drops to a near-zero value for unjammed systems, and that for jammed systems the contact number does not change over a large number of time steps. We find that such protocol does not influence the results presented in this paper and it turns out to be more computationally expensive. The annealing protocol implements the approach for cooling of the particles during relaxation as discussed recently zhang_jchp_13 . For the system considered in this work, we find that jamming transition is influenced by cooling rate even for the smallest cooling rates we could use with available computing resources, and is therefore not suitable for our study.
It is beyond the scope of the present work to discuss why implemented annealing protocol has such an influence in the considered simulations; one possibility is that the differences between implemented protocols vanish in the limit of large system sizes, however, as pointed out already, such an analysis is left for future work.
The reason for this detailed discussion of the implemented protocol is the presence of a relatively small, but non-vanishing, number of clusters for packing fractions below jamming in particular for D simulations, see Fig. 2, and Figs. 4 and 6 later in the paper. One obvious question is whether these clusters would disappear if a different relaxation protocol were used. Our finding is that these clusters remain present for any of the considered relaxation protocols.
This observations is consistent with the earlier works Miller2004 ; Poeschel2005 that found that the cooled unjammed systems always contain clusters of connected particles, at least for the simulation setup and relaxation protocols considered in the present work. One could also ask whether such clusters would be still present as the system size is increased, or whether the fraction of the particles participating in such clusters would decay as the system size increases. Such questions should be considered in the future work.
Interaction networks: We consider the forces between particles and define the interaction network in a granular system by its nodes (particle centers) and weighted edges (inter-particle forces). The interaction networks are analyzed for different values of and for a range of (dimensionless) force thresholds, , where only the forces that are larger than are taken into account. We note that the forces are always rescaled by the average force in an interaction network, , which itself is -dependent. For simplicity, in this work we consider only the total force between the particles (the absolute value of the vector sum of the normal and tangential forces at each contact). We show the results up to the value of such that the average force does not exceed a maximum, , defined as follows. We find the average force in an interaction network, , for all ’s (averaged over realizations for D linear and non-linear, and for D systems), and determine the value for each considered system. We define so that for all considered systems, the results are given for the same range of average force thresholds. The maximum packing fractions are found as and for the non-linear D system, linear 2 system, and the D system, respectively.
Data pre-processing: During compression, especially for small values of , the particles collide and often form two-particle clusters. The particles with only one or no contacts, are referred to as rattlers. As in the previous experimental and numerical studies PRE_2018 ; dapeng ; Zhang_soft_2010 , we do not consider rattlers in our computations; these clusters are non included in the Betti number results discussed later in the paper.
We note that we have carried out additional simulations using different system sizes: and (in D) and and (in D) average particle diameters. The finding of relevance for the present paper is that the results reported in the rest of manuscript remain qualitatively the same for the considered domain sizes. We have also carried out simulations using different friction coefficient (in addition to the value considered in all the reported simulations, we used and ). The only visible difference between systems with different friction values was found in the specific value of , and in the precise values of the various measures describing the interaction networks.
IV Force Distribution, Percolation and Jamming Transitions
In this section we focus on the differences between D and D systems that undergo jamming and percolation transitions (described below) in terms of the distribution of forces and properties of the interaction networks.
During compression and relaxation, particles come into contact and clusters randomly form and break. Since we include relaxation between compression steps, the compression protocol is quasi-static and we expect that the percolation and jamming transition occur at the same packing fraction kovalcinova_percolation . Note that both here and in kovalcinova_percolation a jamming transition is characterized by a rapid increase of average contact number. More specifically, jamming packing fraction, , is defined here as the point at which curve has an inflection point. We refer the reader to recent works that discuss in more detail current understanding of jamming in granular systems sastry_nature16 ; luding_nature16 . Percolation transition is defined by at which a percolating cluster connecting at least two opposite walls of the domain forms. We indeed observe the formation of a stable percolating cluster (that does not disappear even after arbitrarily long relaxation) for any (and only when) , confirming that . Finding that also suggests that the relaxation protocol that we use is essentially quasi-static, so that the results are not influenced in any meaningful manner by the relaxation protocol, see kovalcinova_percolation for further discussion regarding this issue. For the future reference, we note that for the systems that we consider the jamming occurs at for the D non-linear and linear systems, respectively, and for the D system colorblue (note that these numbers may be influenced by the system size).
IV.1 Force Distribution
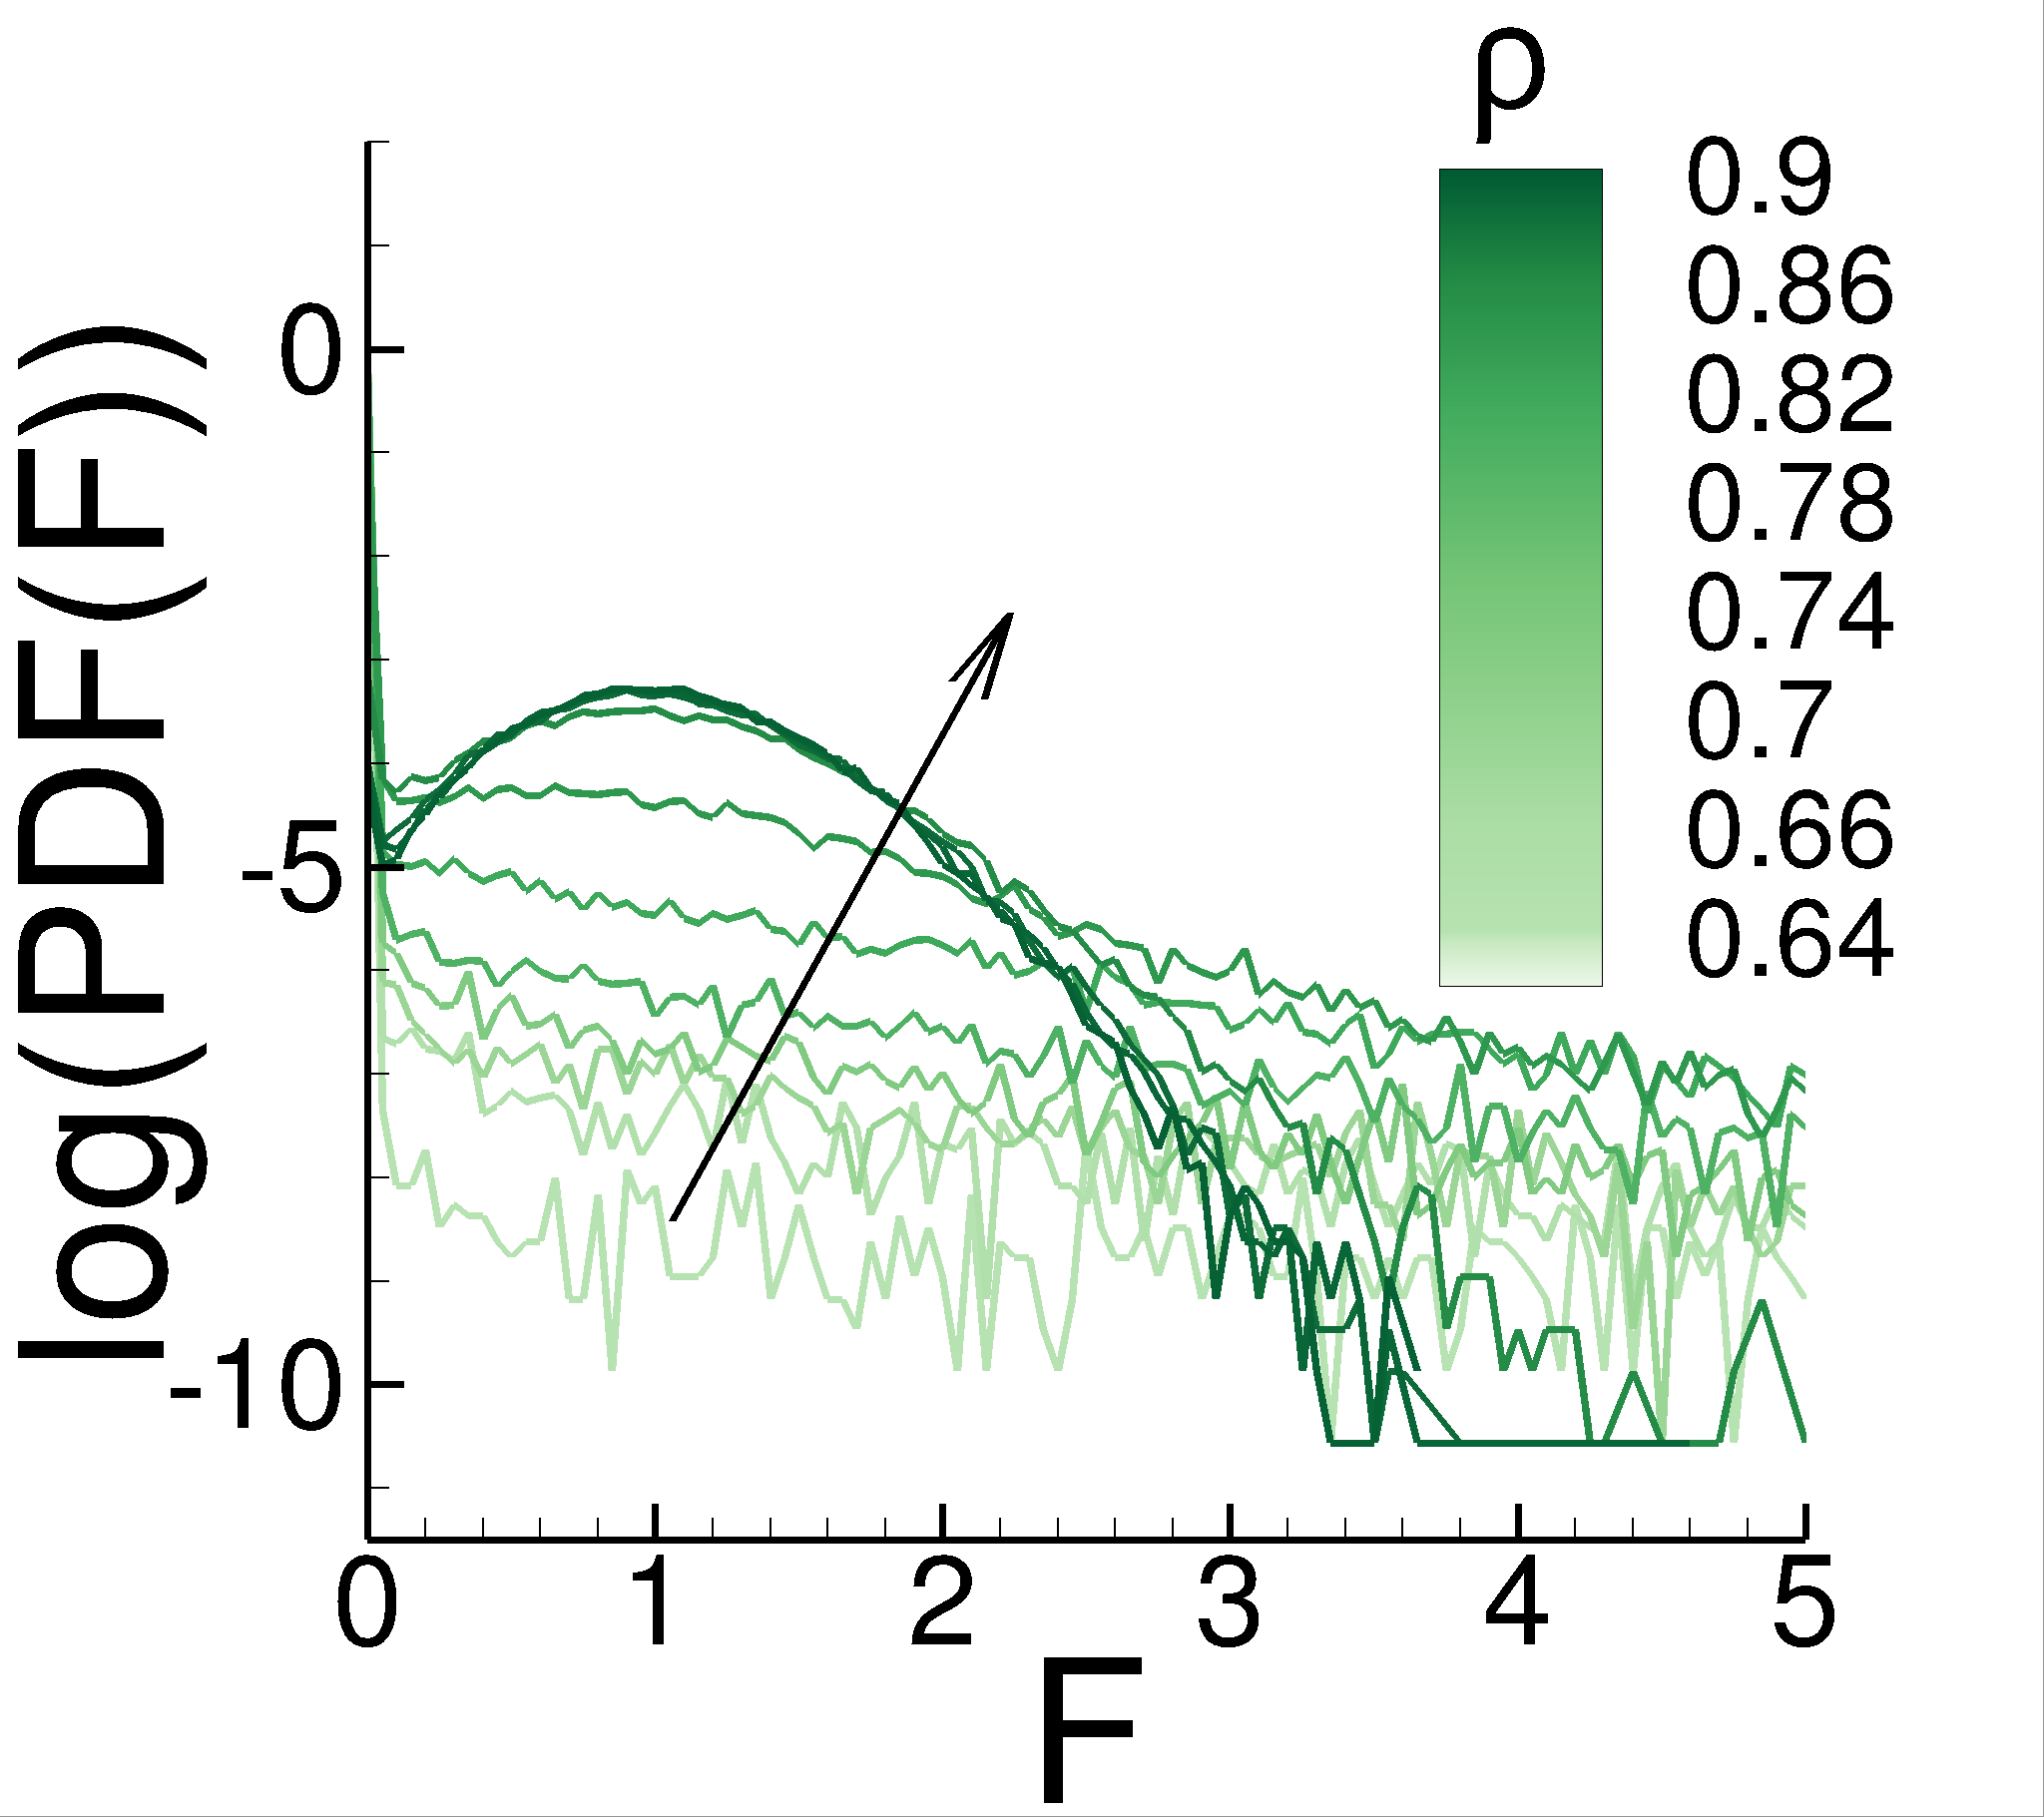
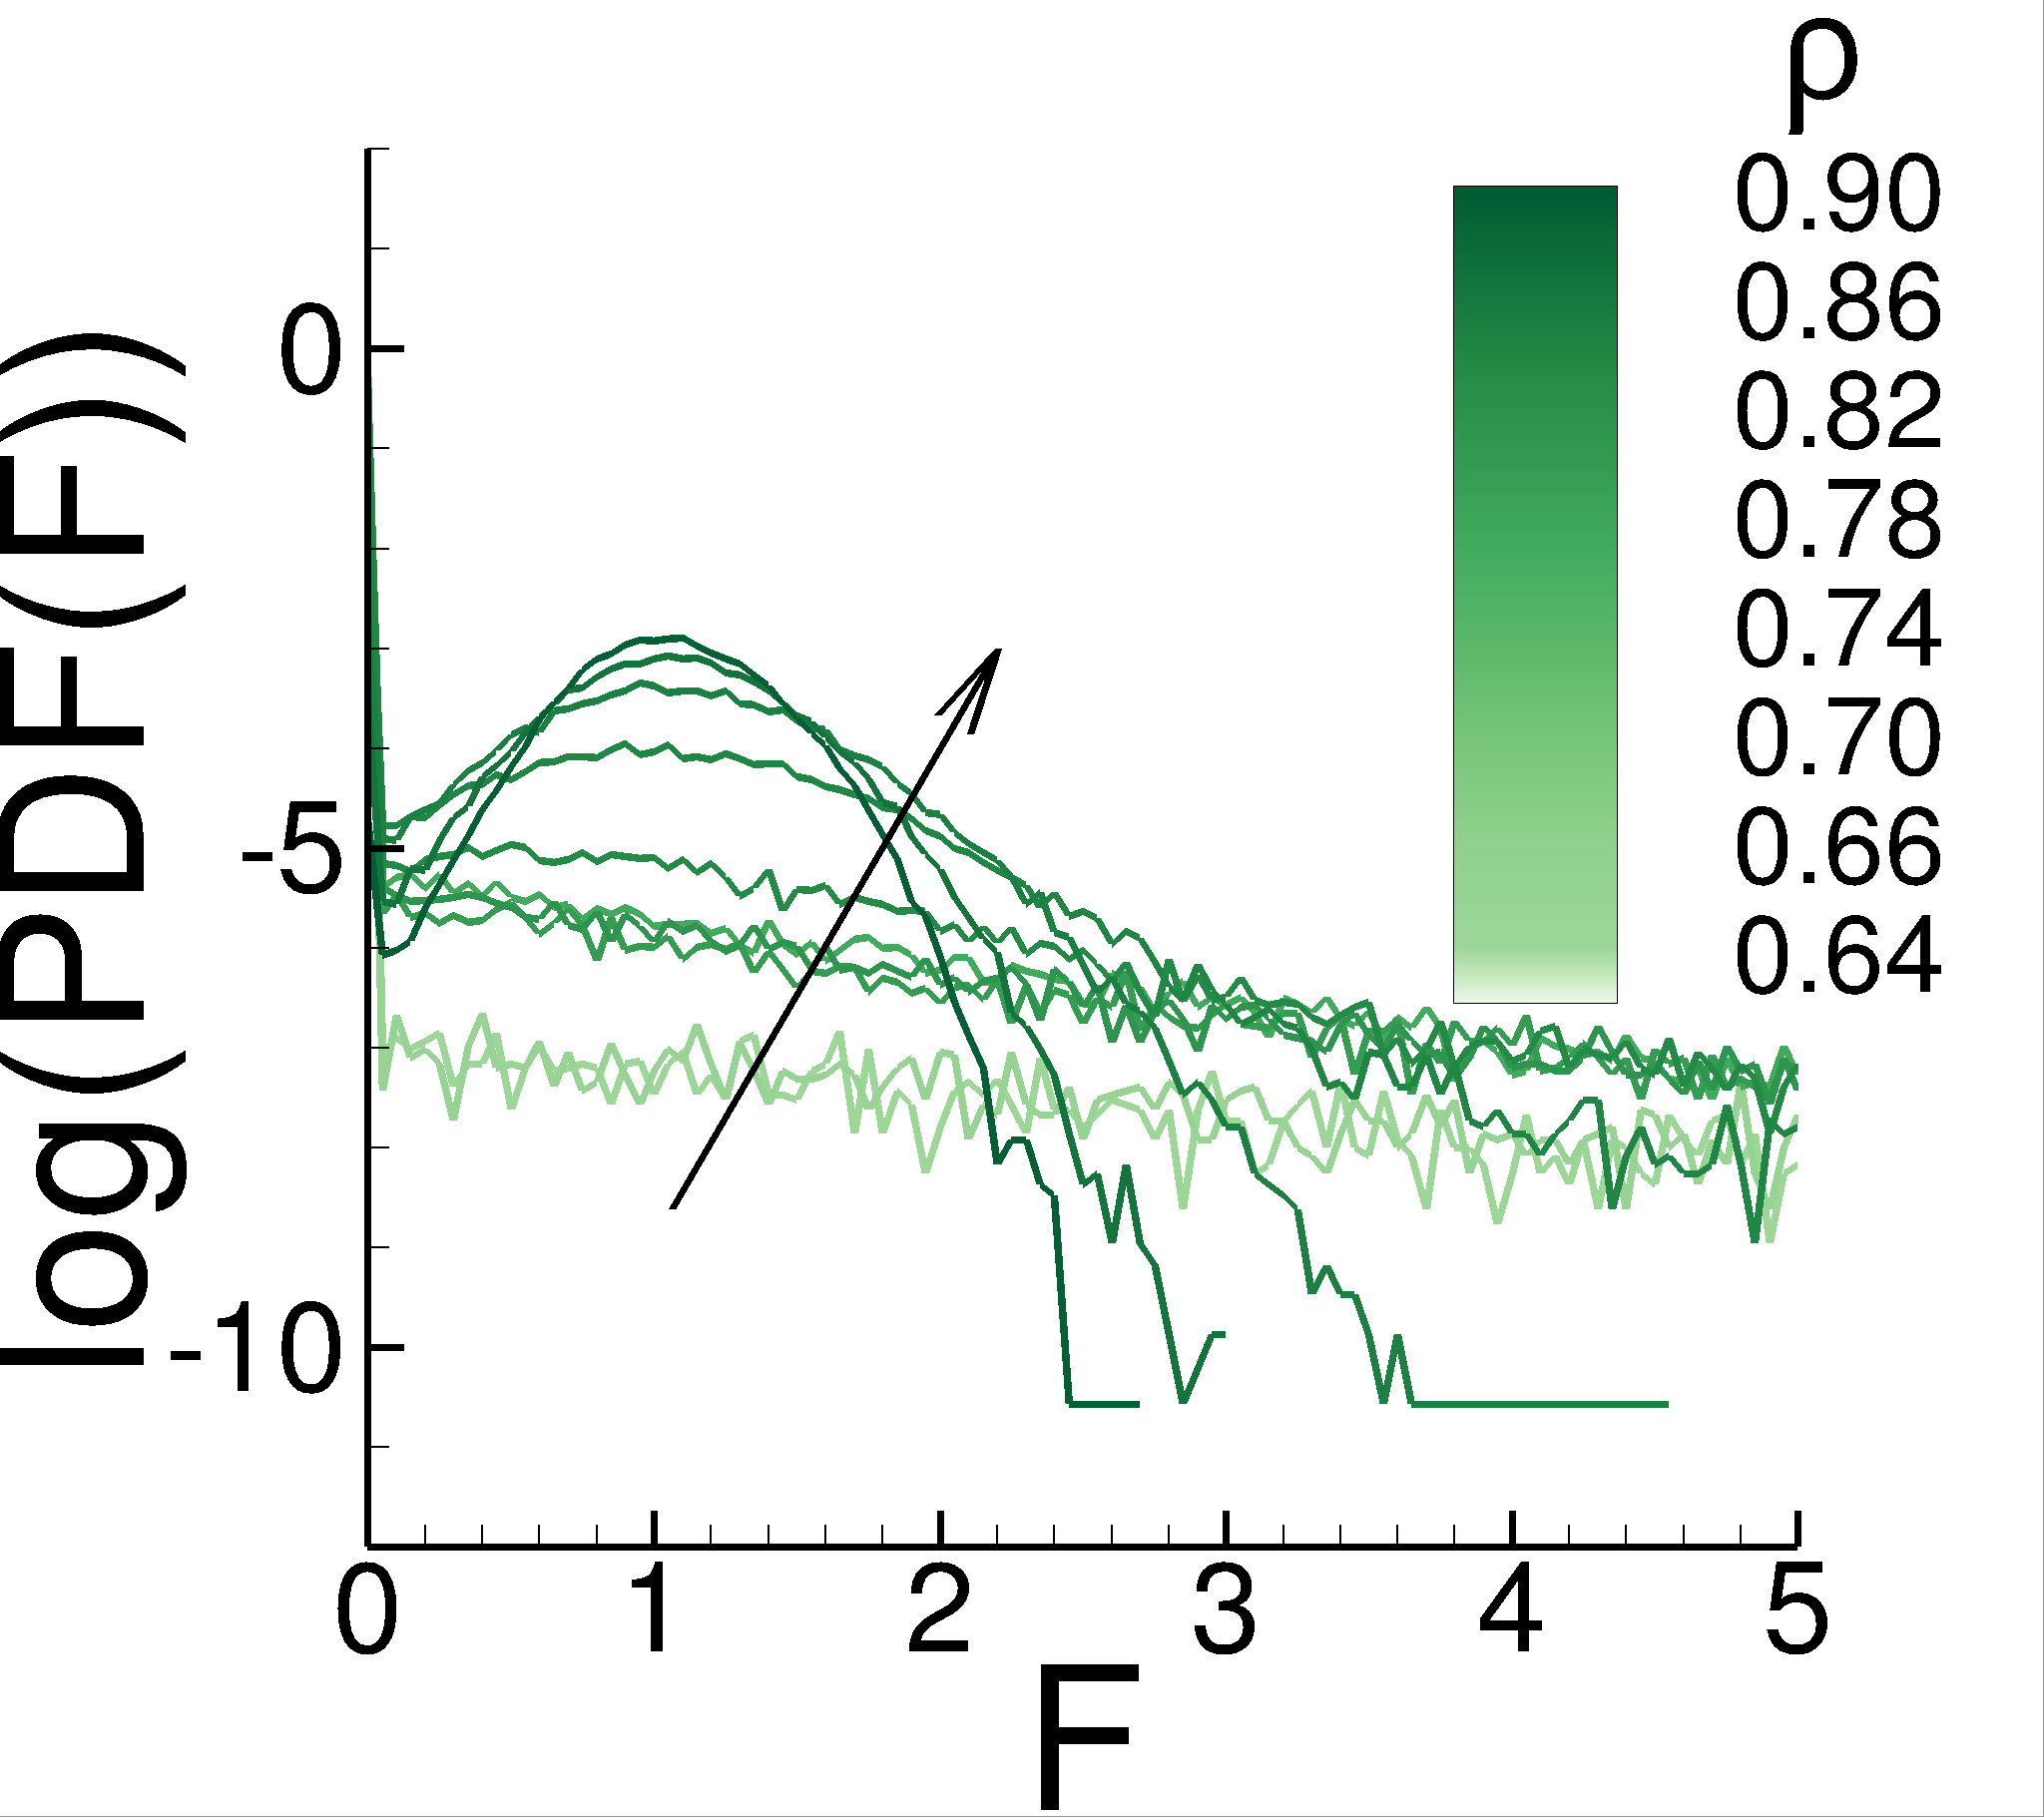
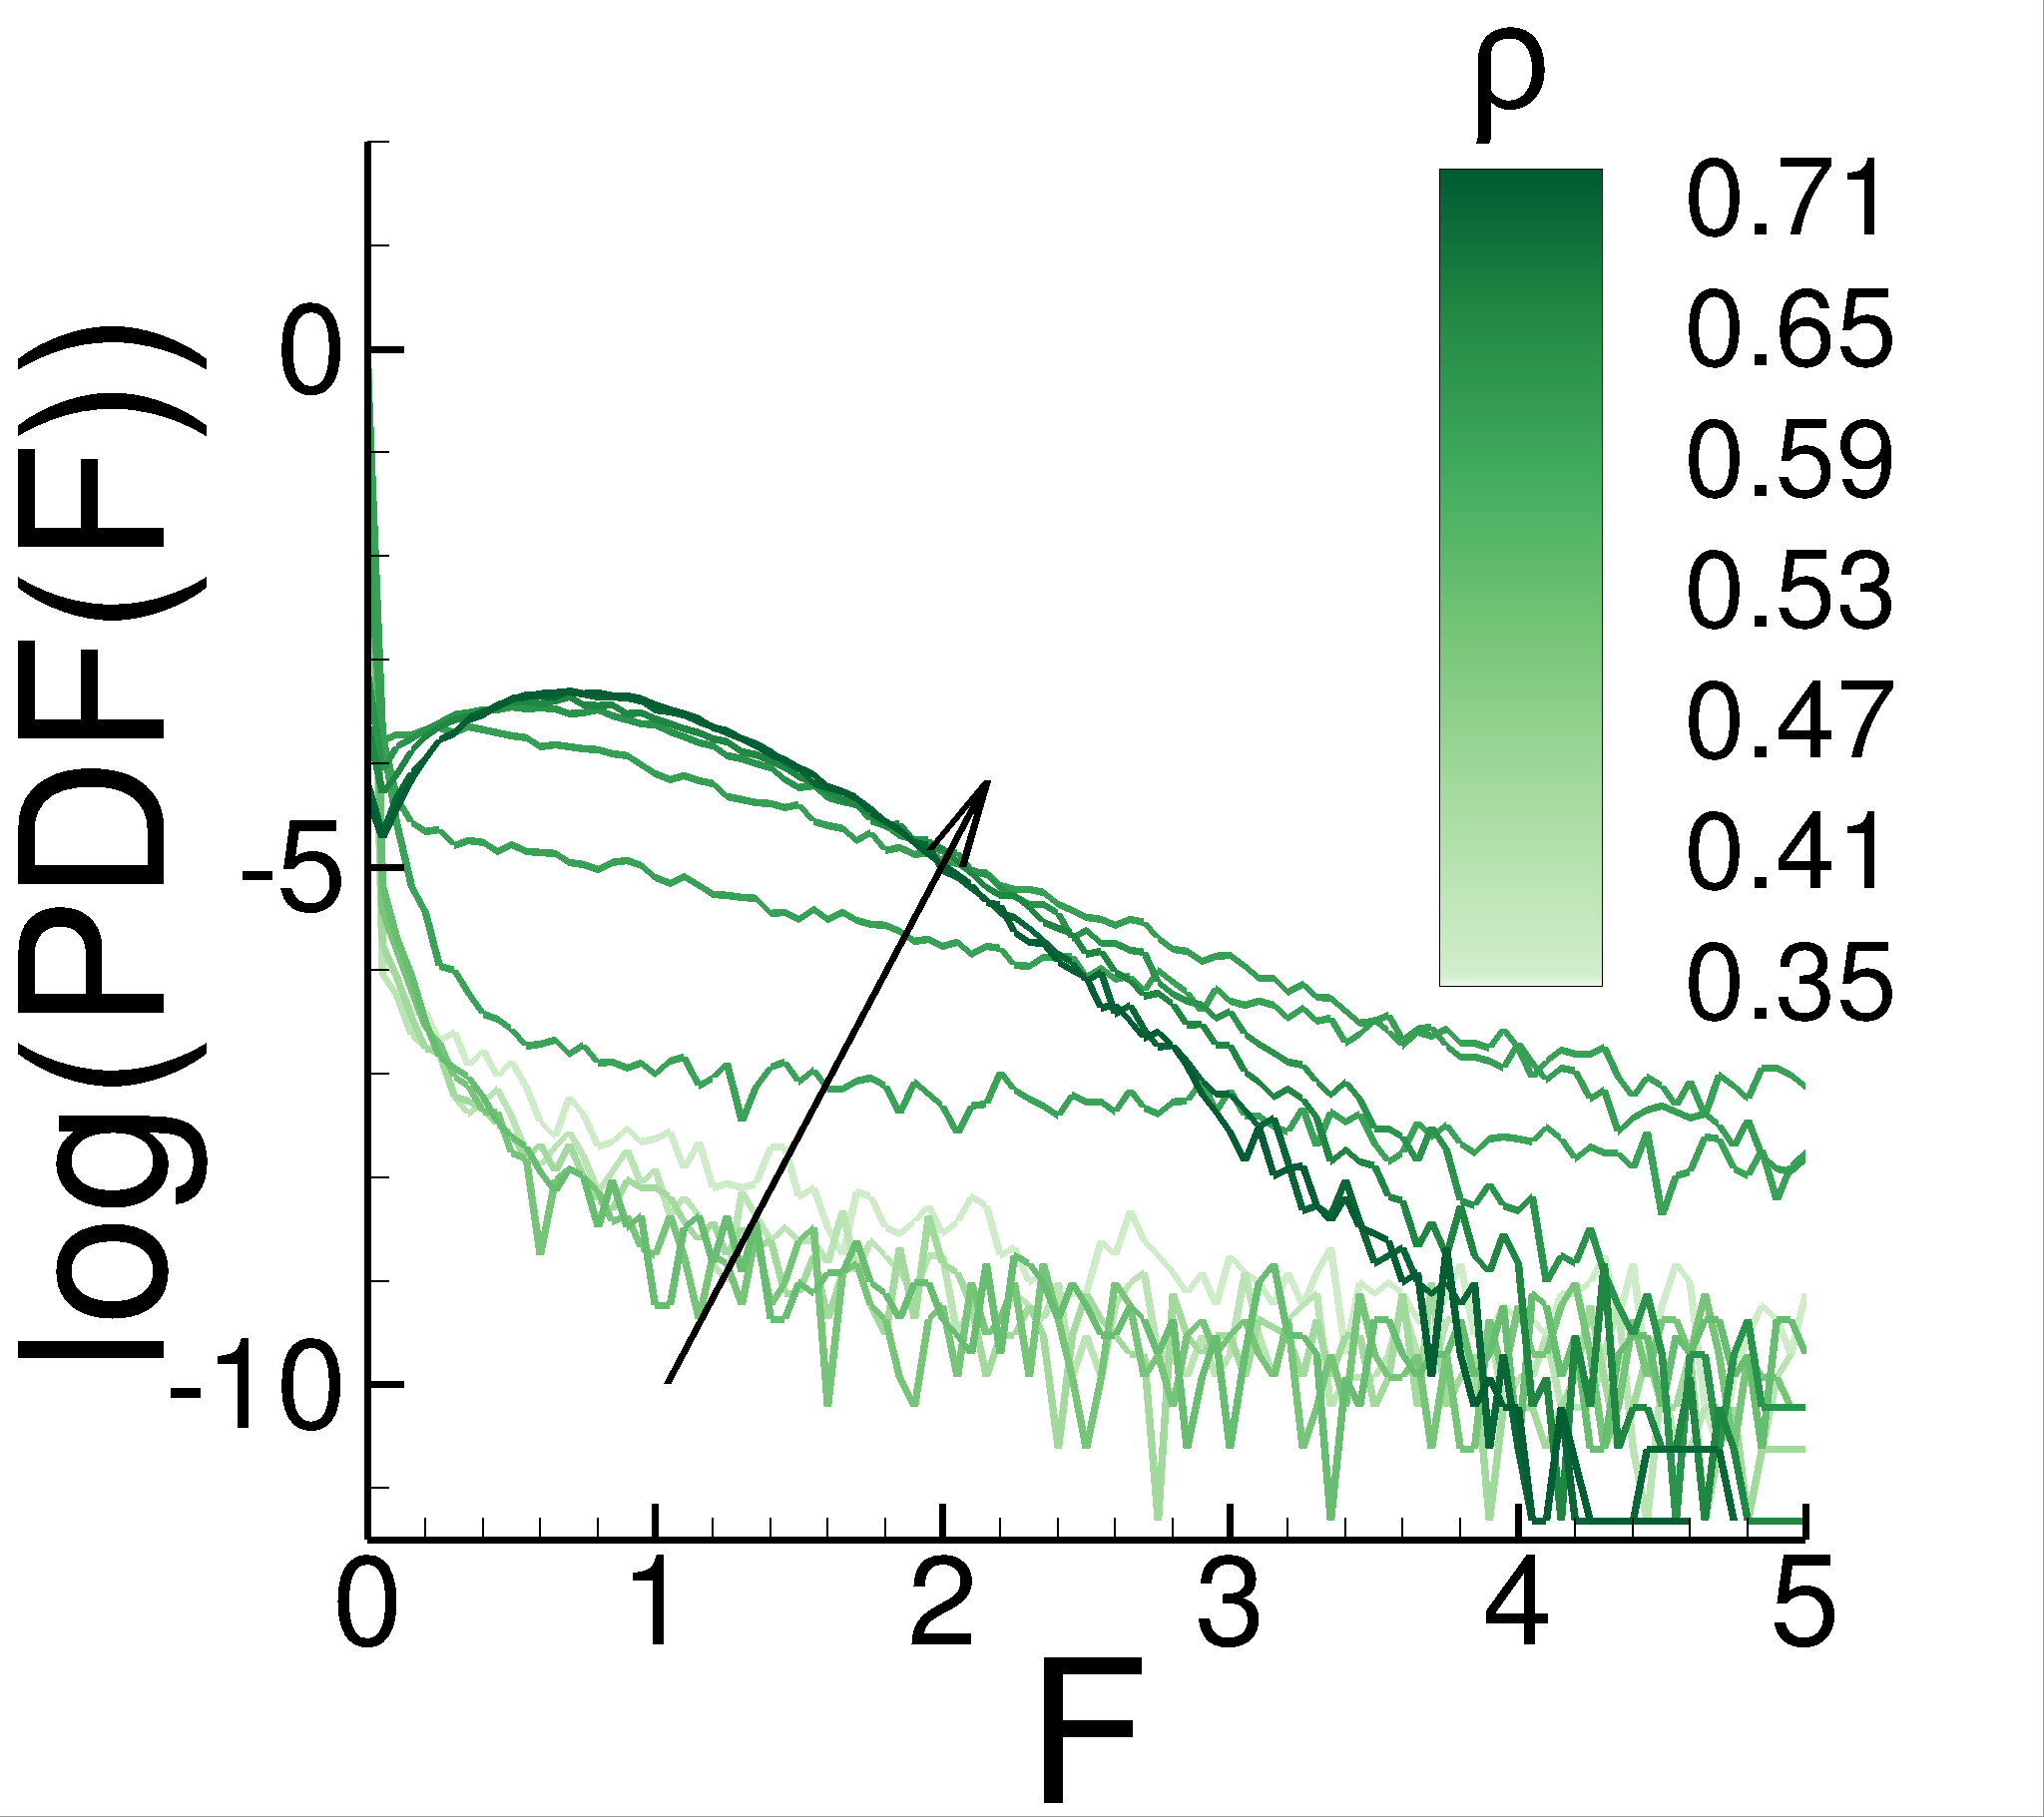
Figure 3 shows the force distribution, , for the three considered systems. We note that the width of the distributions for the largest values differs for the linear and two non-linear systems, with smaller width of in the linear system, suggesting a smaller variation of the forces and a more homogeneous interaction network. The systems based on the non-linear force model have wider distribution and in the D system we observe the largest variation. While the functional form of PDF(F) has been widely discussed in the literature brujic_2003 ; Minh2014 ; brodu_pre_15 ; mueth98 ; radjai_prl_96 ; azema_pre_07 ; Pugnaloni_2016 ; makse_prl_00 , we are not aware of the precise comparison of these functional forms between the systems characterized by different number of physical dimensions, or by different interaction force model.
In the next section, we will use PDF(F) results together with the topological measures that will be introduced to discuss further distinguishing features of the interaction networks as the number of physical dimensions and the force model are varied.
IV.2 Force cluster analysis: non-percolating clusters
We continue our analysis of the forces between particles by examining the cluster size distribution in the interaction networks. We omit the percolating cluster if it is present in the interaction network. Since percolating cluster has a different characteristic scaling behavior stauffer than the average cluster size of the non-percolating clusters ostojic06 ; kovalcinova_scaling , we discuss its properties separately.
Figure 4 shows the average cluster size, , rescaled by the total number of particles, , for different values of . In the D systems, the largest values of are observed for and for the linear and non-linear systems, respectively. This finding implies that regardless of the force model, the interaction network is dominated by the force clusters composed of forces near the average force in D. Force model becomes important in D when and . Specifically, in the linear case, decays faster than in the non-linear one. In other words, the interaction network is more uniform for the linear system and we expect to observe a smaller variation of forces for . Indeed, our discussion of PDF’s in the context of Fig. 3 confirms that the in the linear system follows a more narrow distribution than the in the non-linear one.
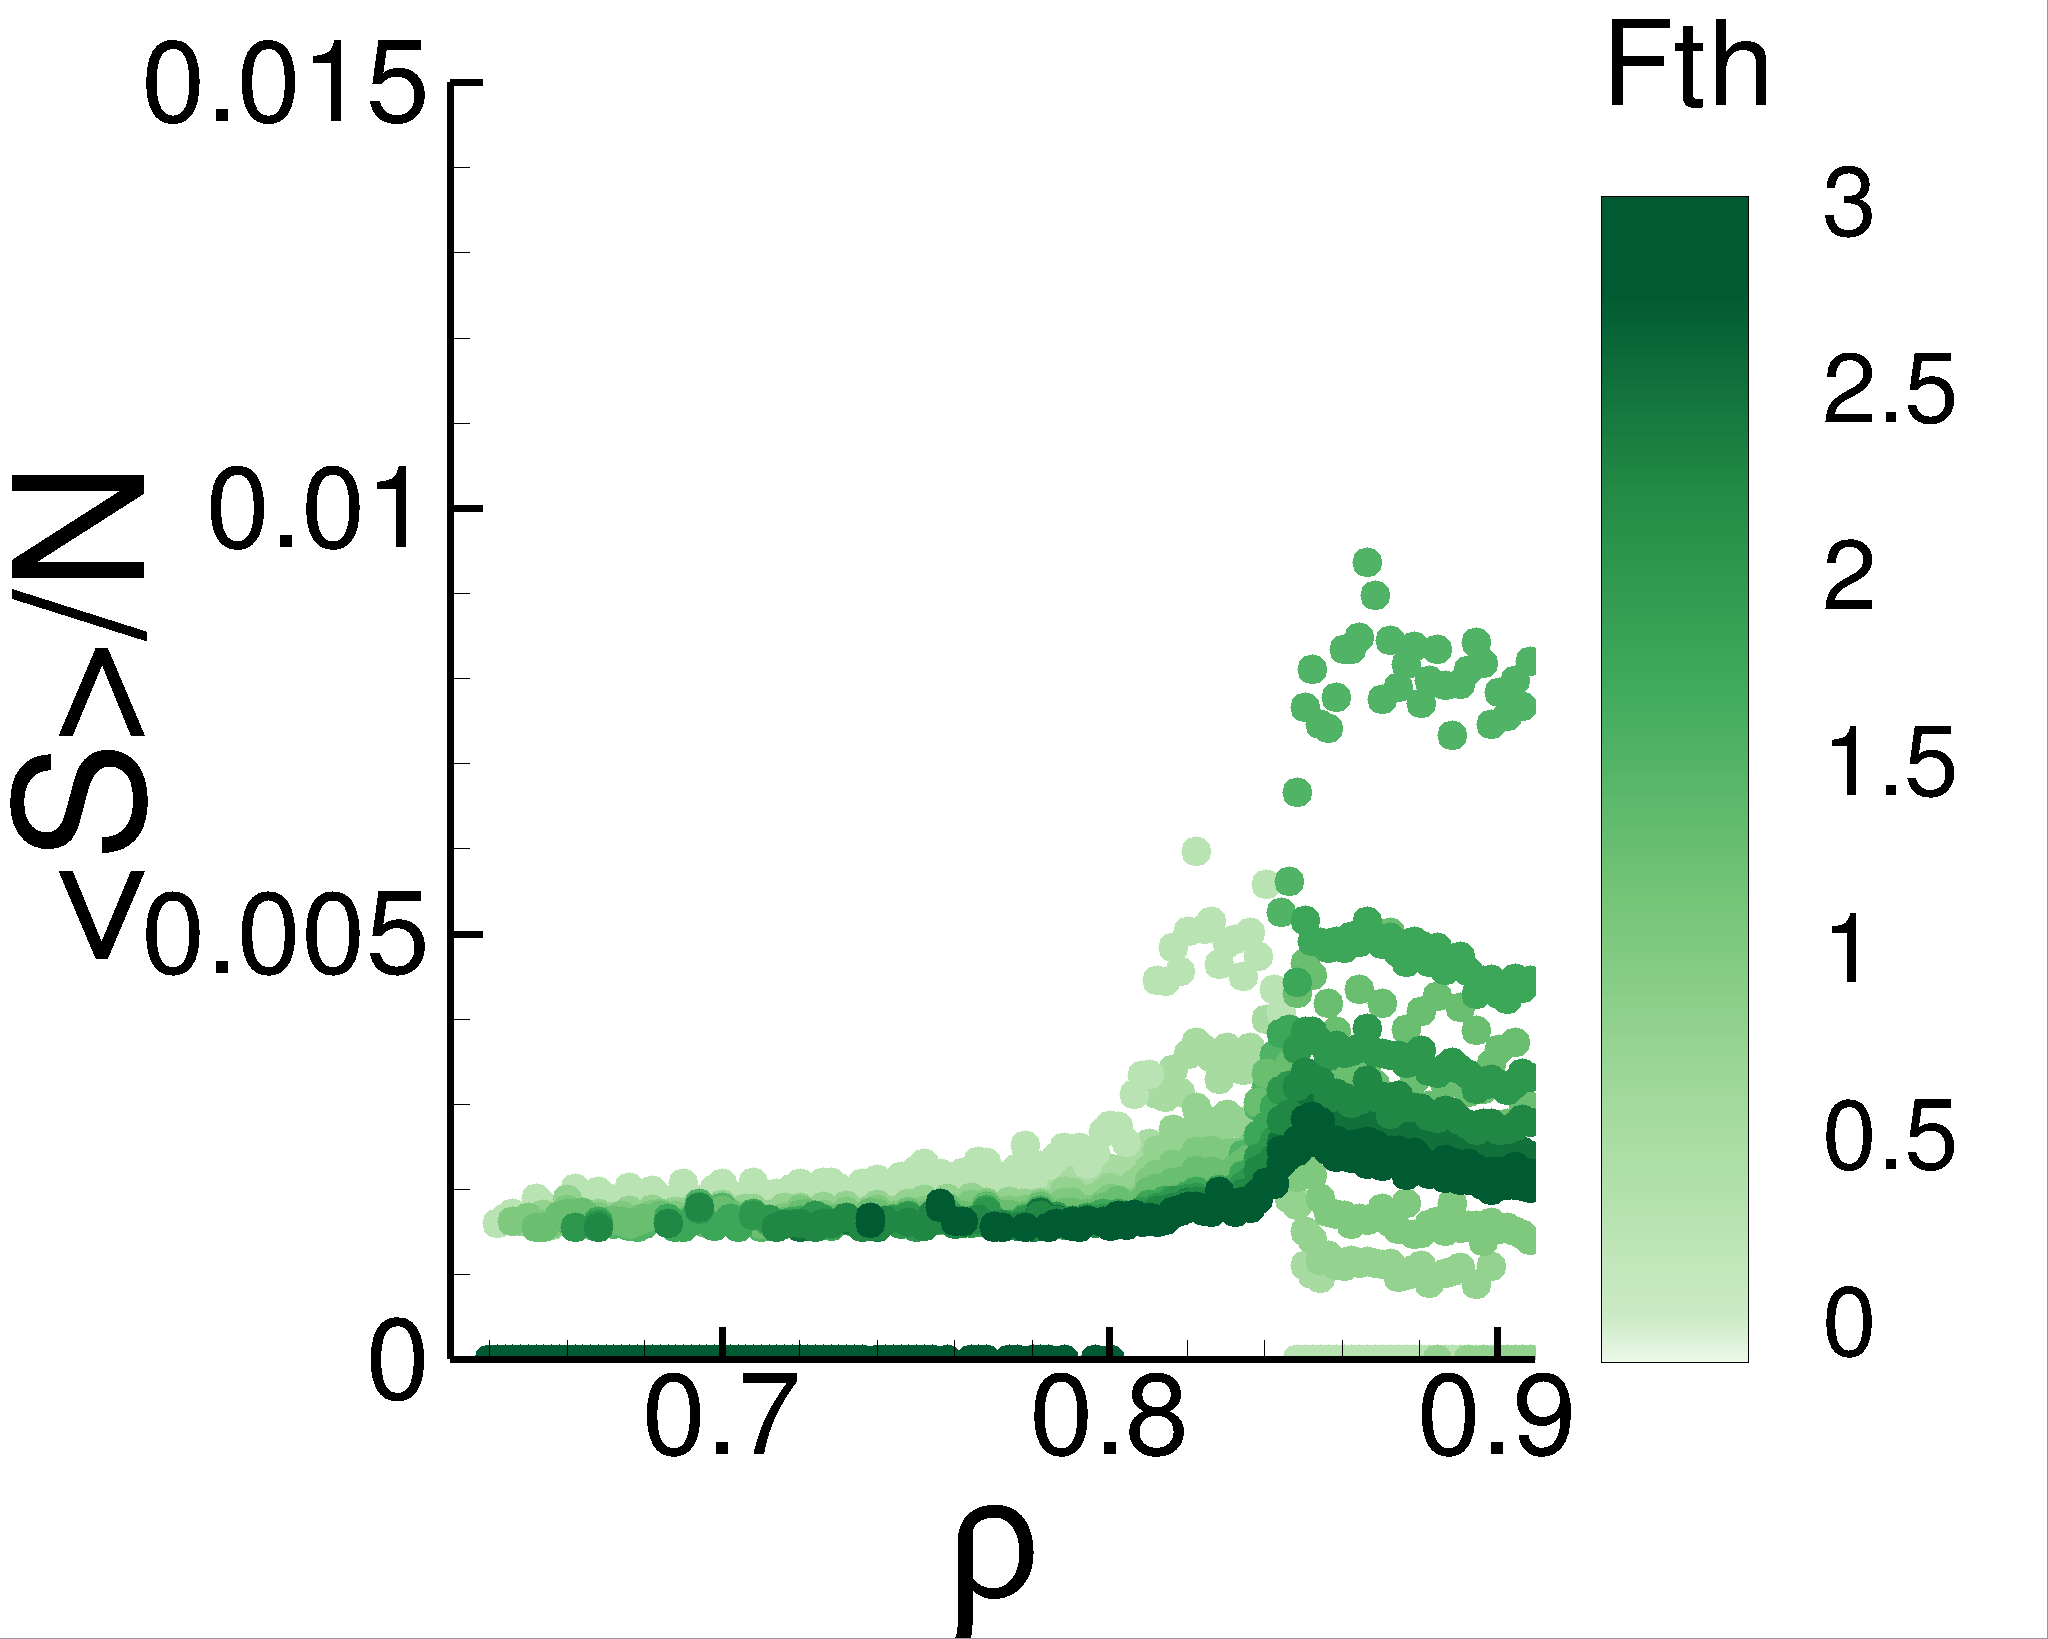
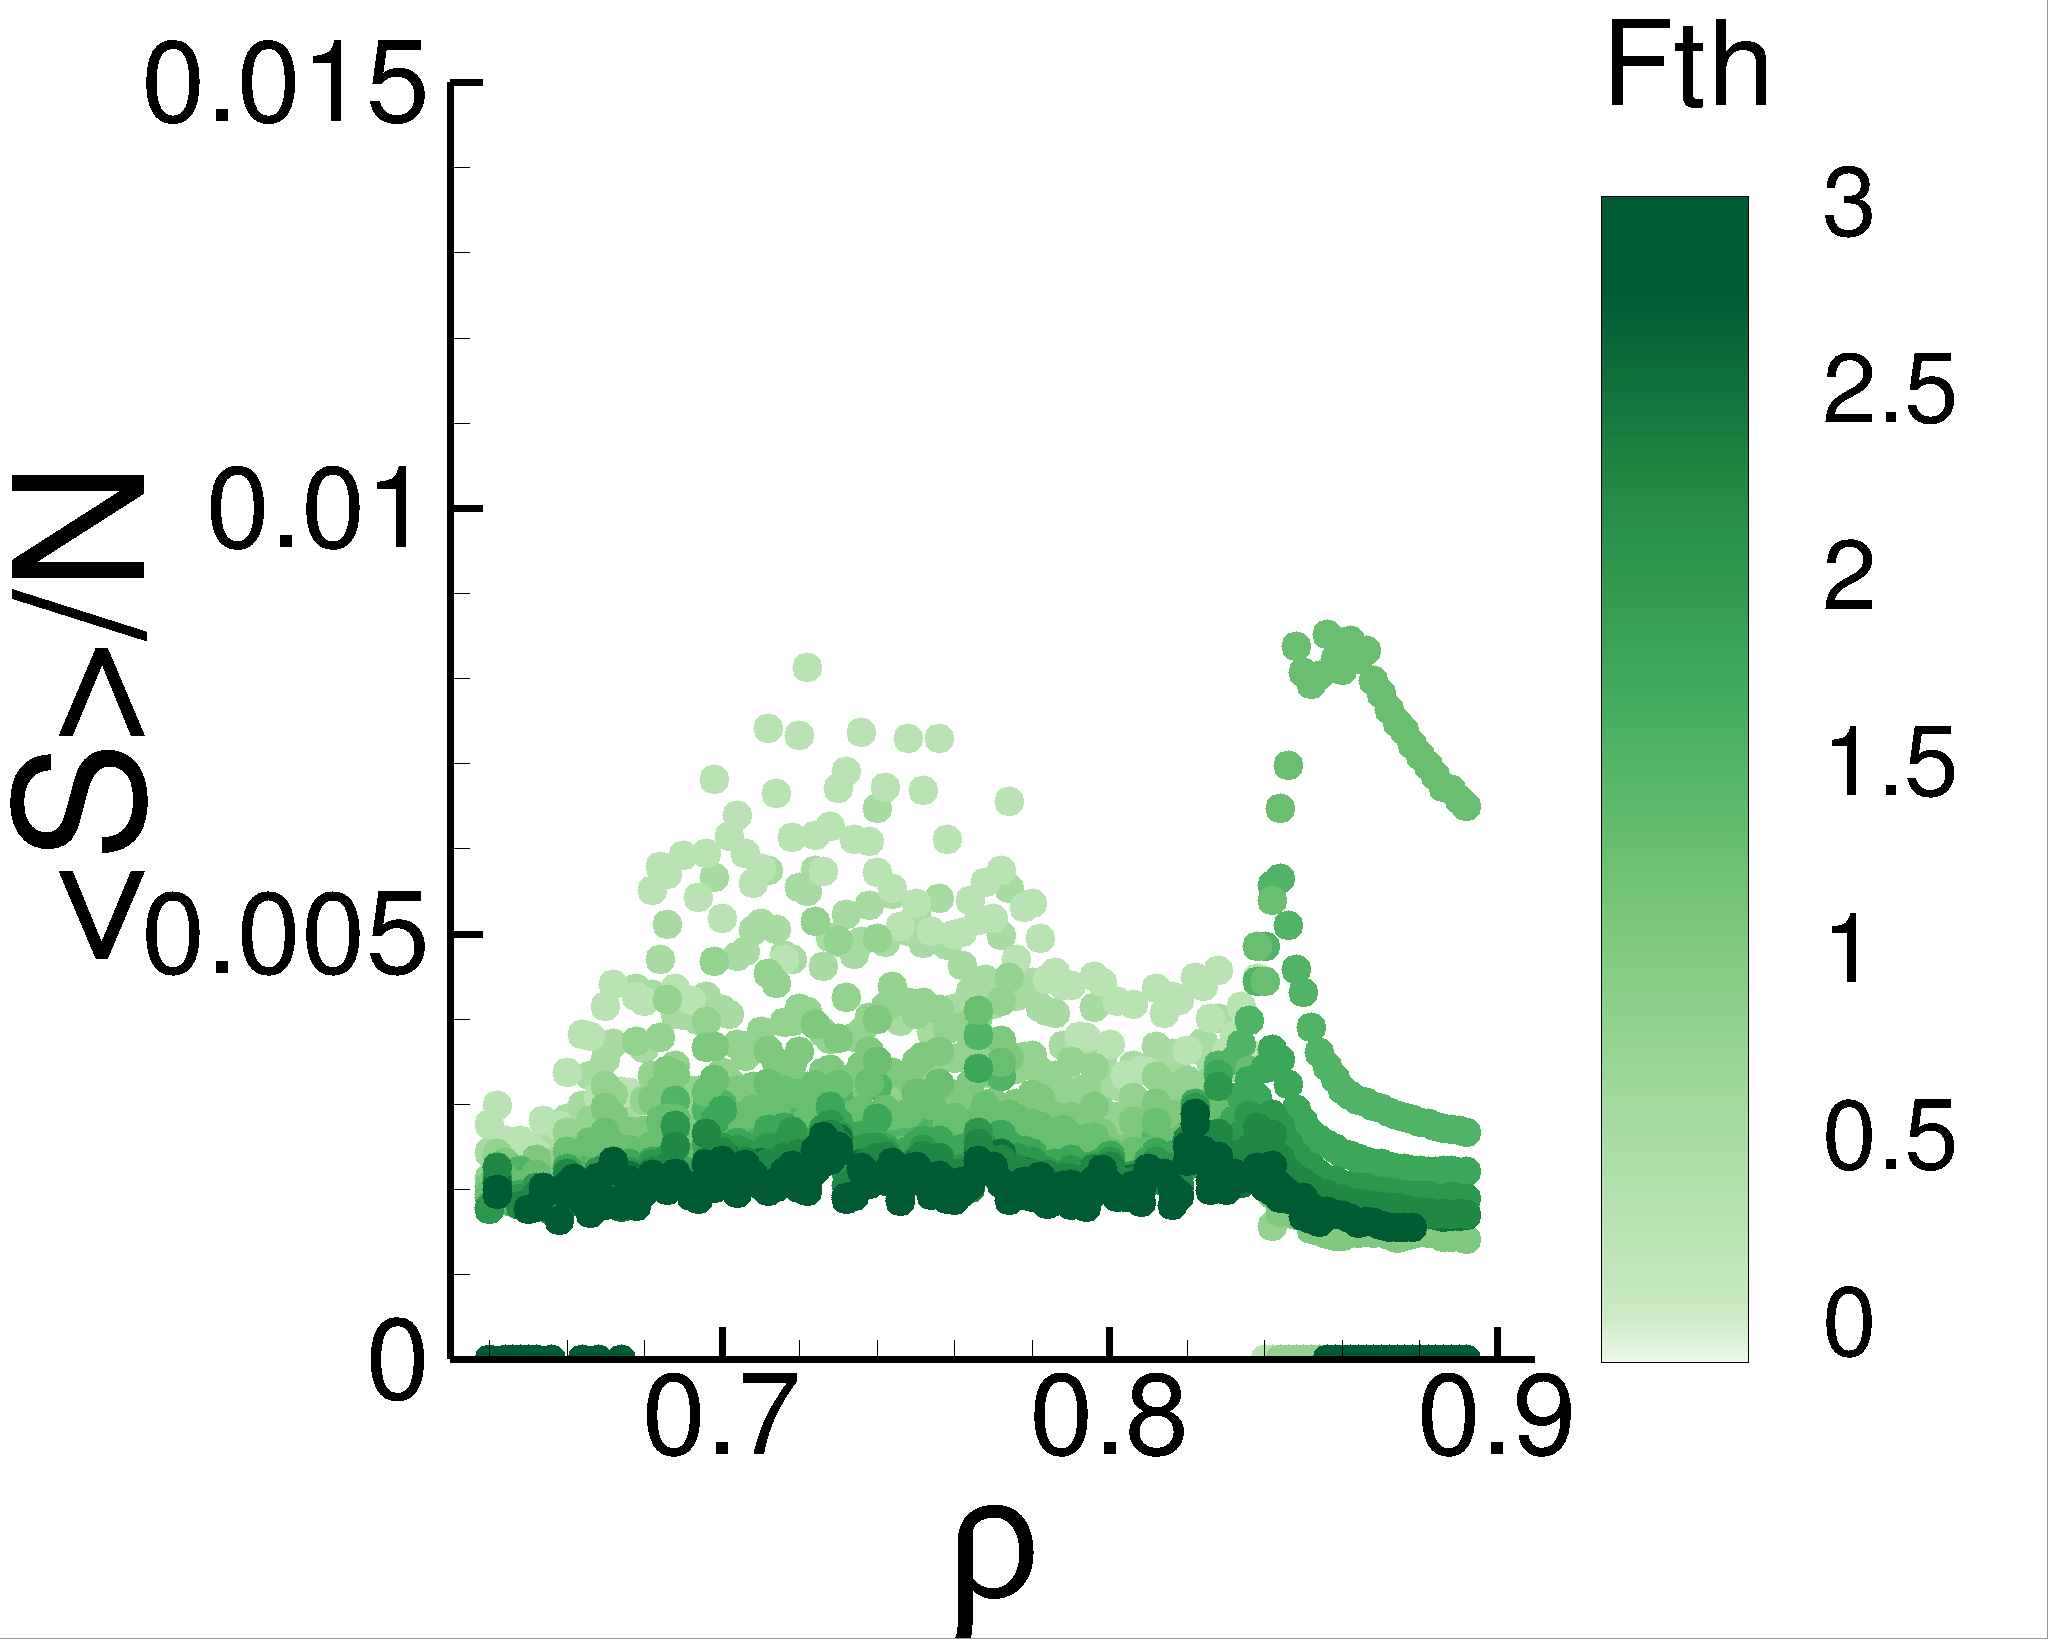
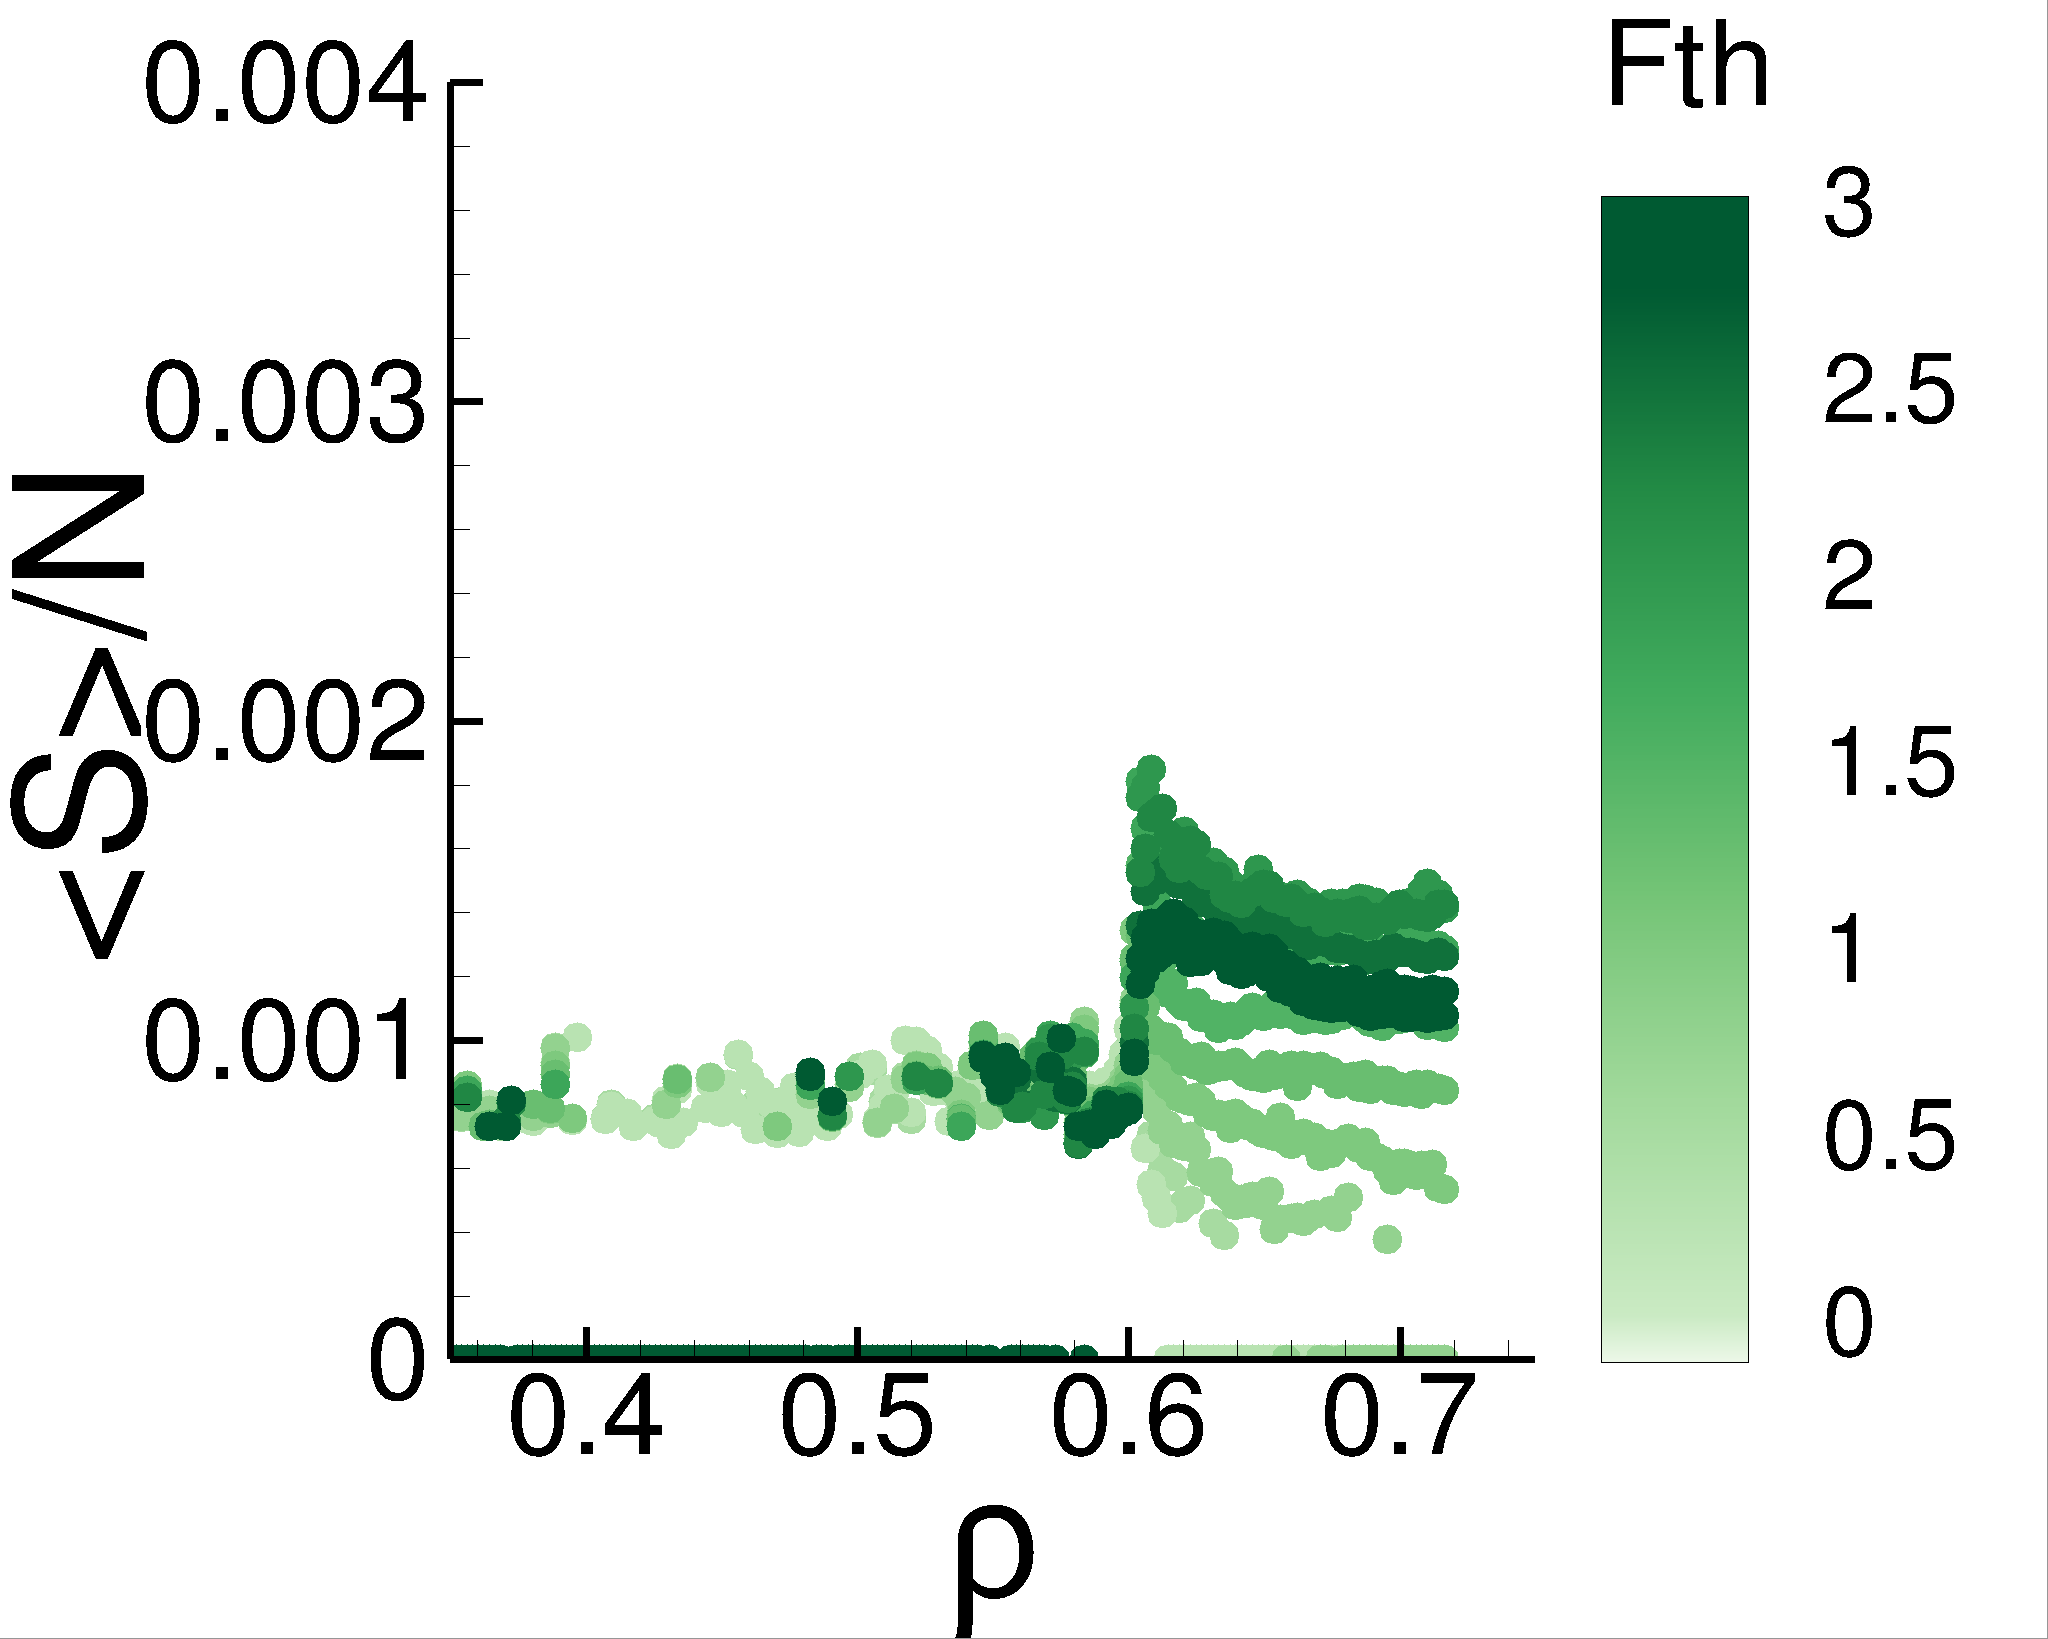
Turning now our attention to the influence of the number of physical dimensions, we compare the panels (a) and (c) of Fig. 4. The most obvious difference between the two is the for which attains the maximum for . In the D system, the largest values of are observed for . Therefore, the interaction networks in D contain more clusters with large forces - the forces are less concentrated around the mean force. The for the 3D system shown in Fig. 3 is indeed wider confirming larger force variation in comparison to D.
IV.3 Force cluster analysis: percolating cluster
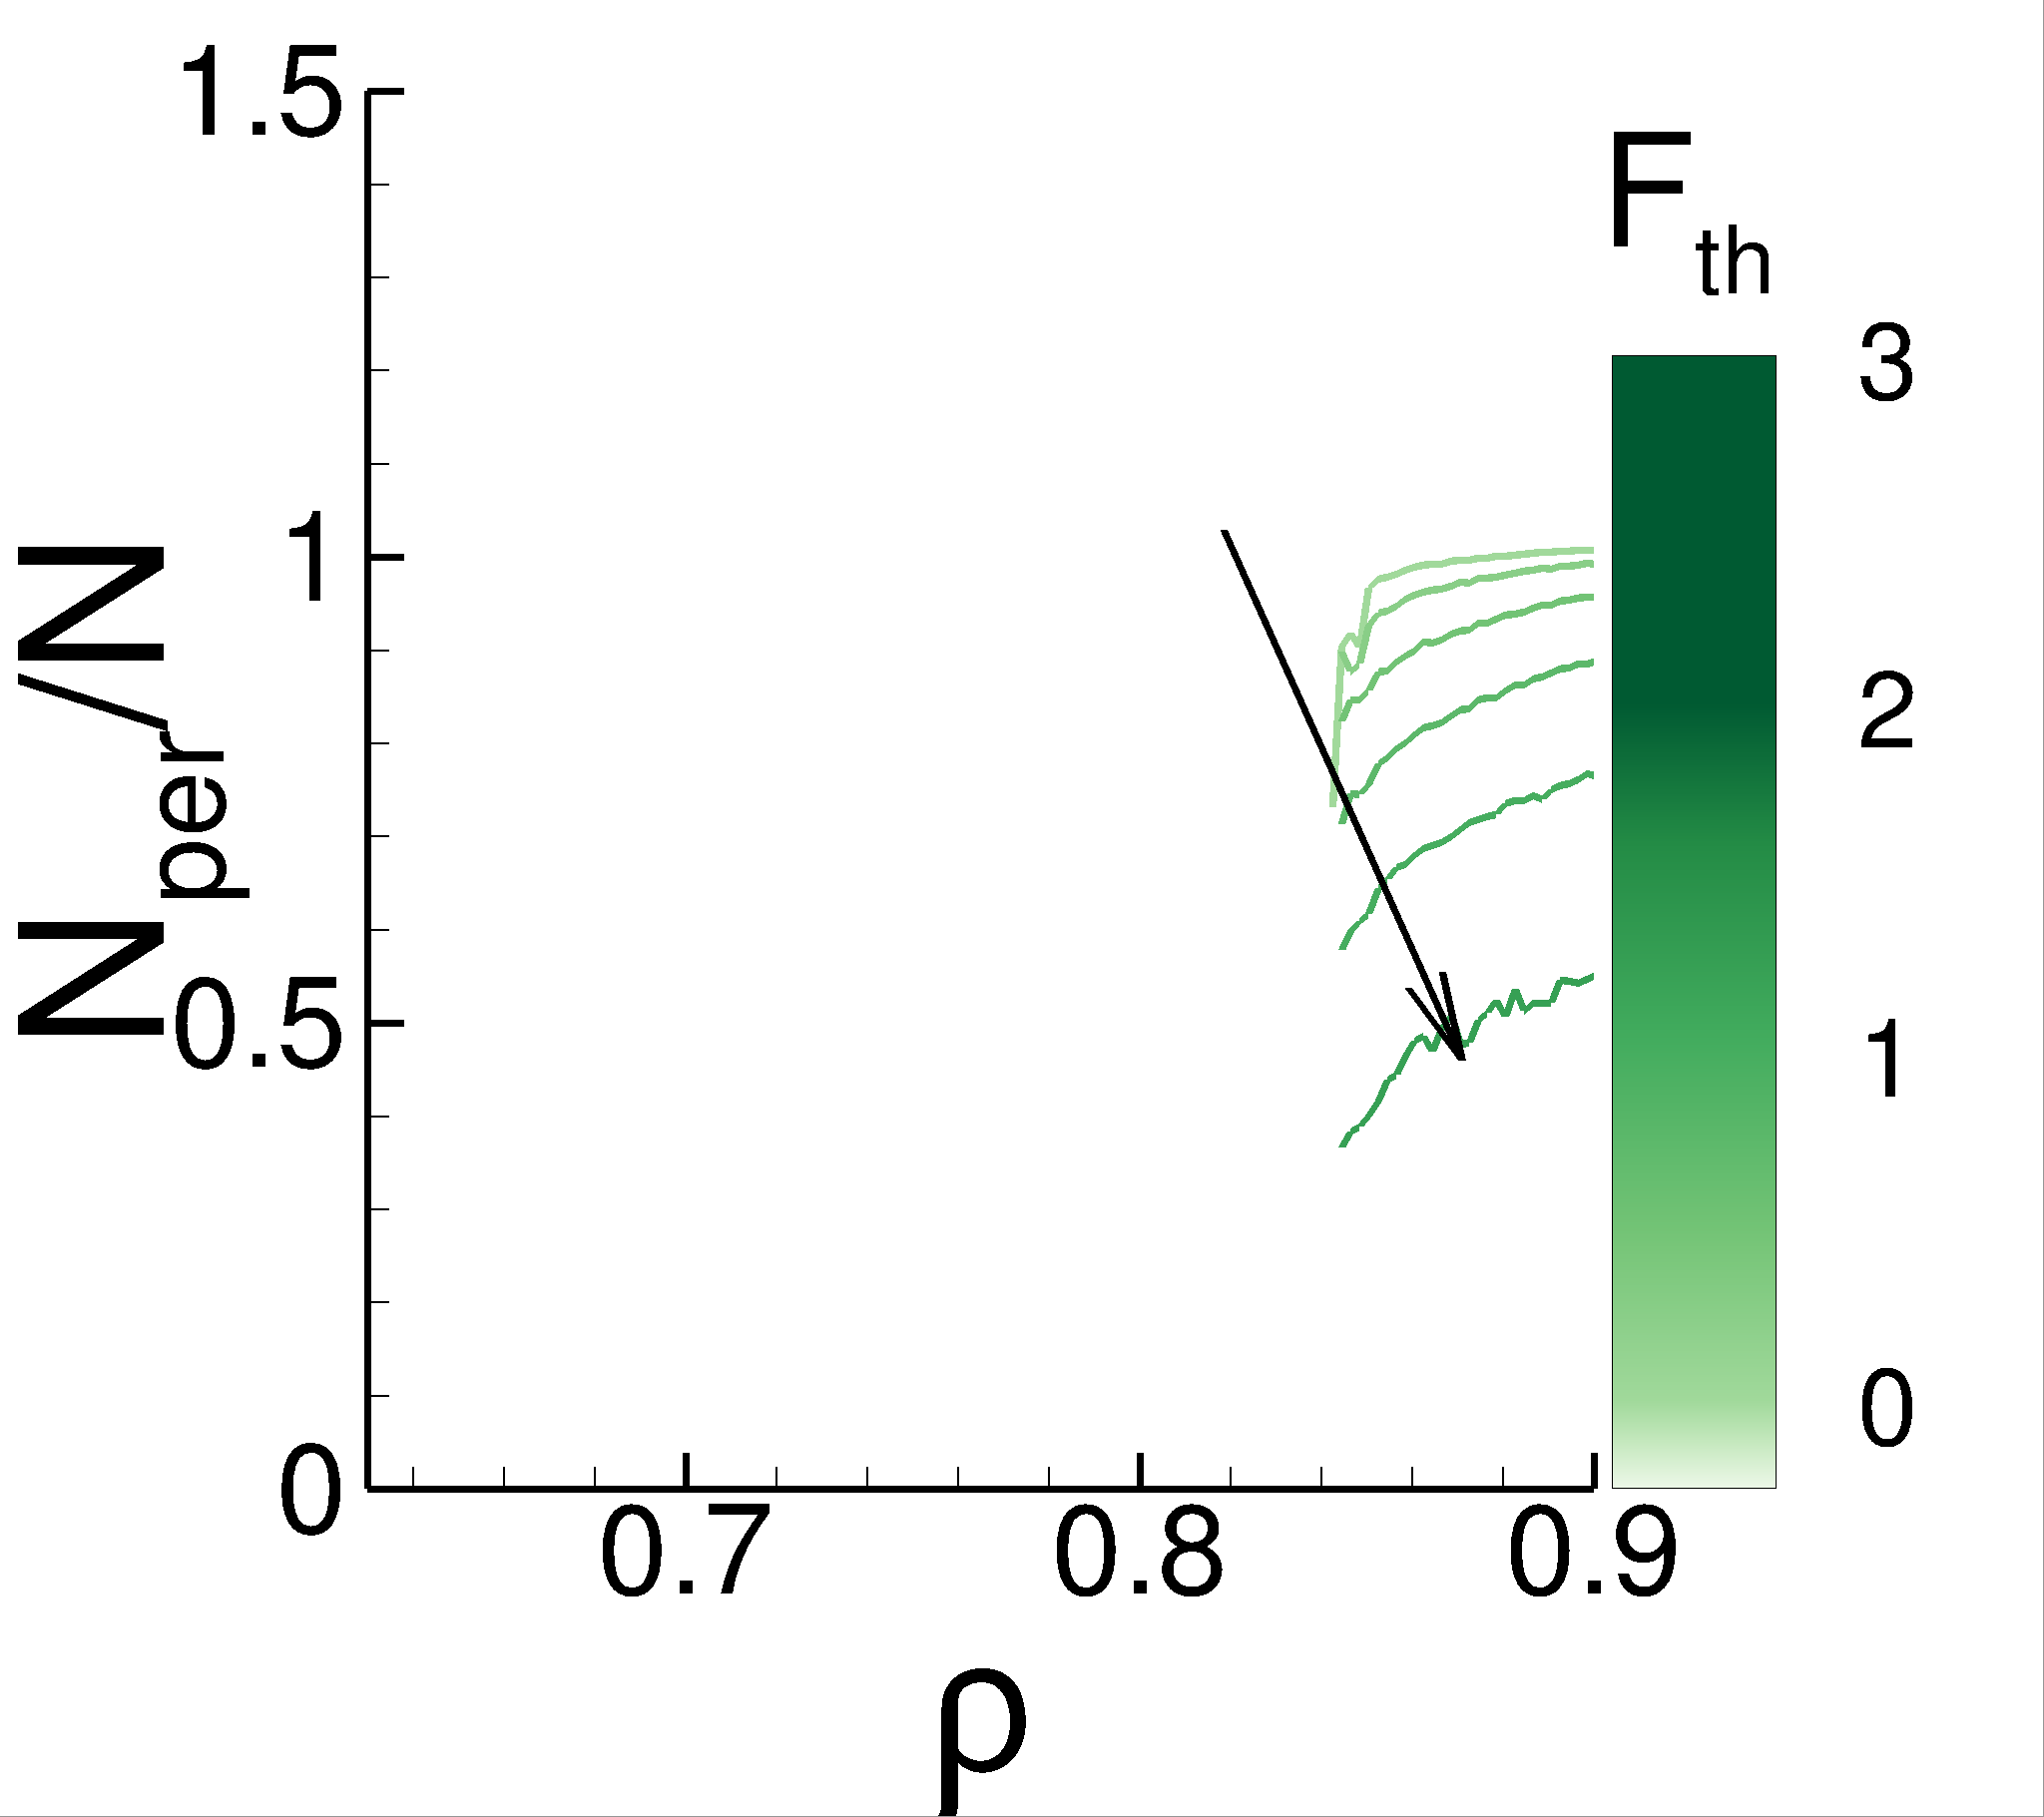
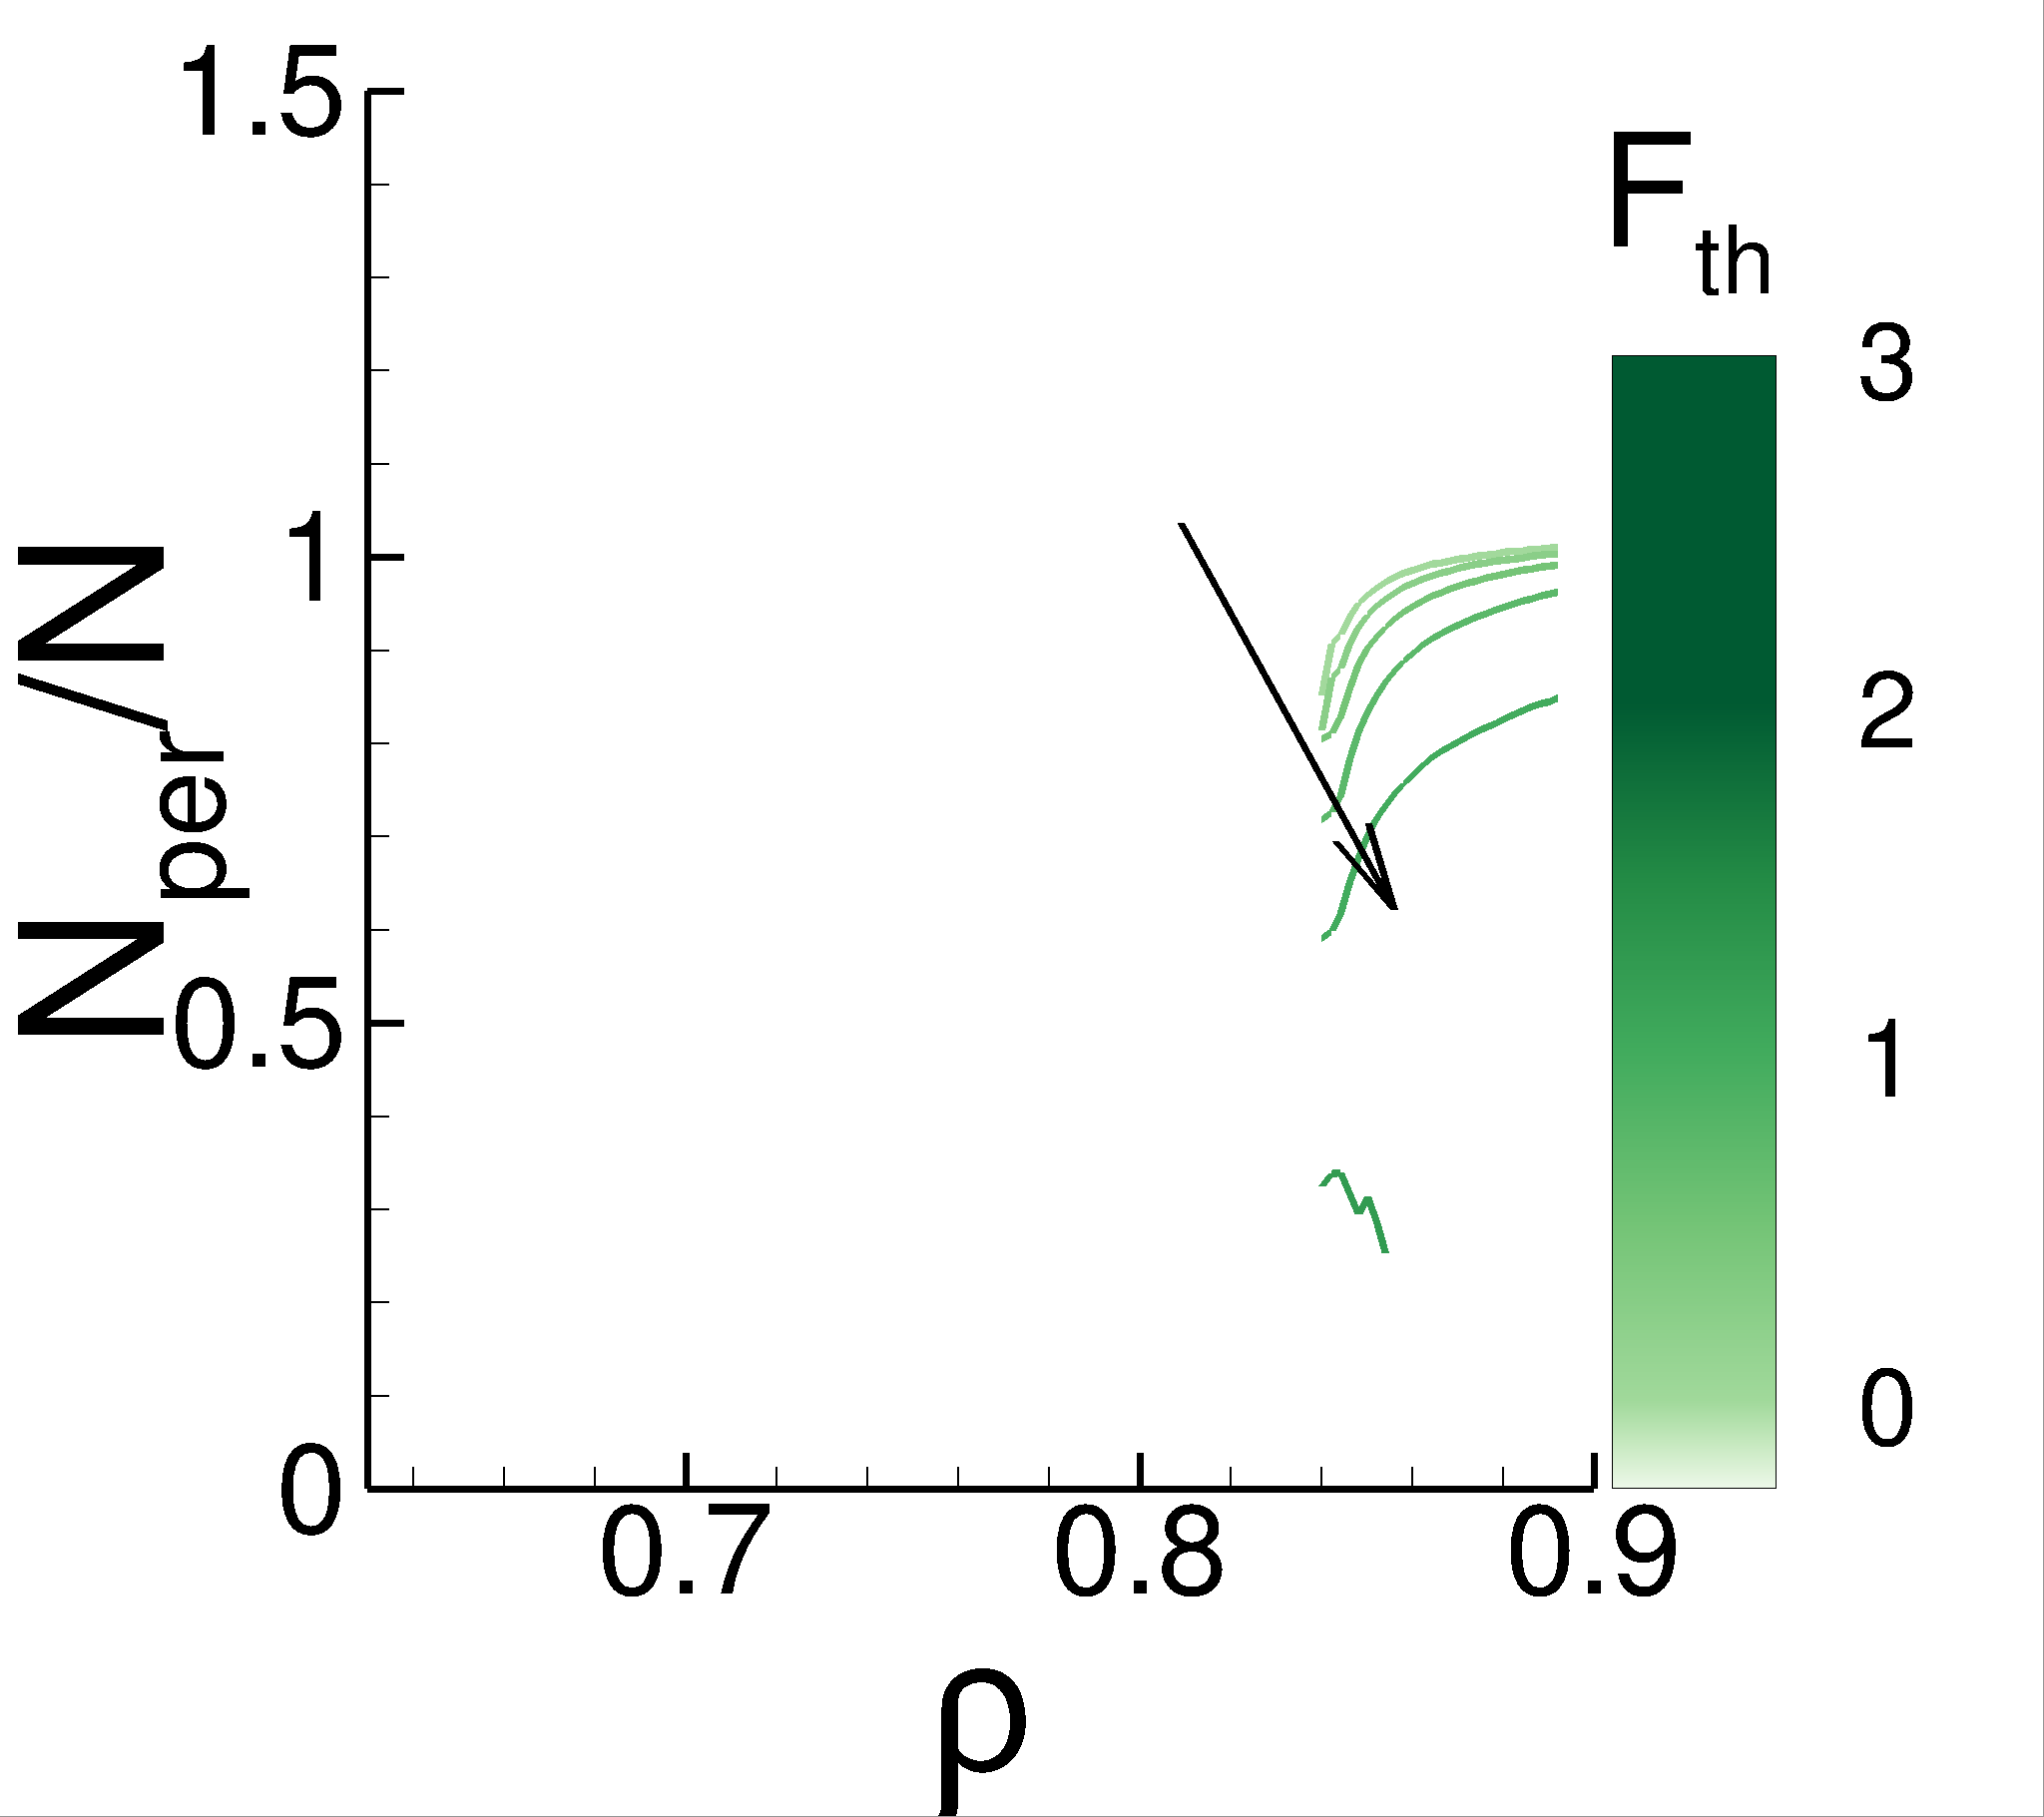
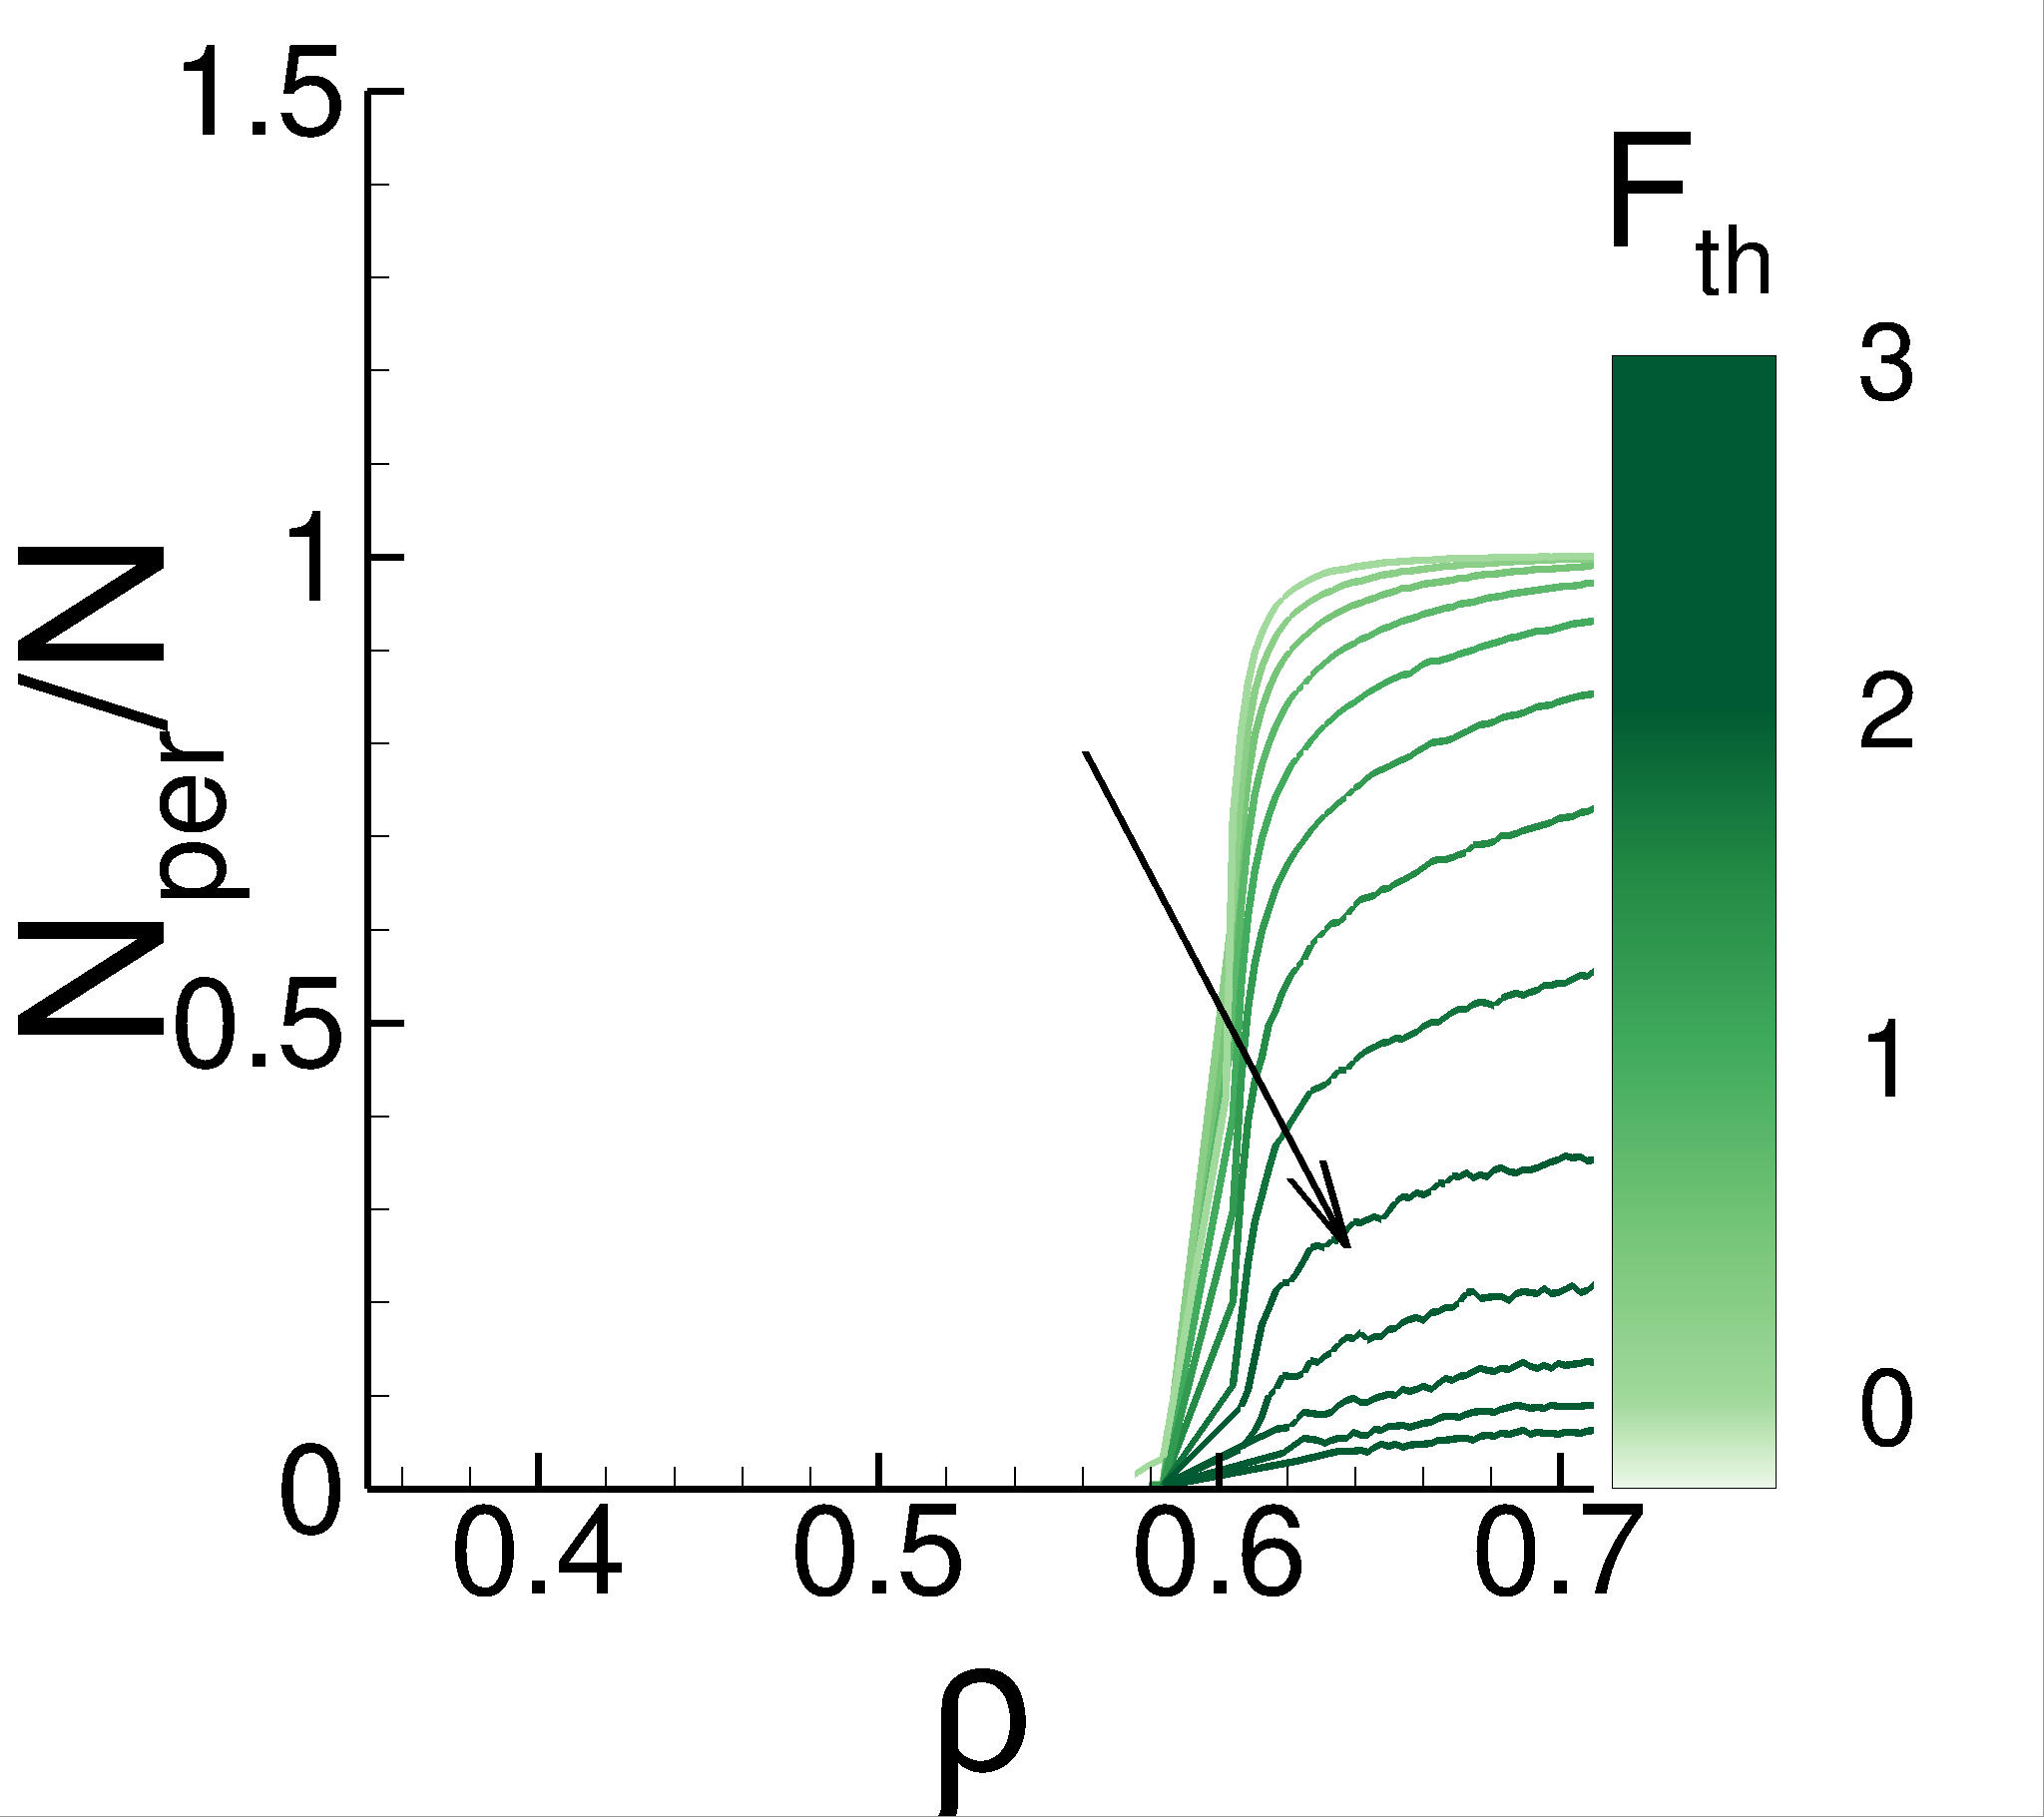
Figure 5 shows the average force and the amount of particles participating in a percolating cluster, , normalized by the total number of particles, . We remind the reader that the results are averaged over realizations for each system; here we only show the results if at least of the realizations contain a percolating cluster. Recall that percolation is observed only when the system jams, consistently with our previous findings kovalcinova_percolation . We note that when we take into account all the contacts, i.e. when , the percolating cluster in the D systems contains almost all the particles. However, in the D case, in particular for , the percolating cluster contains only a very small number of particles, as it can be seen in Fig. 5.
The reason why less particles are needed for percolation in D is purely geometrical and is discussed next. We consider the interaction networks at first and represent them as random networks with particles as vertices and contacts represented by edges. We also define the mean degree of a random network, as the mean number of edges per vertex (in the context of granular systems is equivalent to the average contact number, ). Let us now assume that a given random network has vertices and a mean degree and ask what is the maximum number of vertices we can randomly remove and still have a percolating cluster. From the theory of random networks cohen_2004 ; Newman_2010 , a critical occupation probability is estimated by
| (6) |
( is the smallest ratio of the vertices present in a random network leading to a percolating cluster). Note that provides a lower bound for . We can now use Eq. (6) to estimate in D and D. In our simulations close to jamming, we find that, as expected, and in D and D, respectively. Note that the exact value of depends on the friction between particles Liu ; hecke_2010 ; Henkes_epl_2010 ; majmudar07a and is estimated by where is the mean number of contacts that have tangential forces equal to the Coulomb threshold Papadopoulos_18 ; Shundyak_pre_2007 ; Henkes_epl_2010 ; Liu . If we assume that (this assumption would be exactly satisfied if each particle had the same number of contacts), we find in D and in D at . This estimate provides intuitive (even if only approximate) explanation of why we observe smaller (relative to the total number of particles) percolating clusters in D compared to D systems when . Note that this argument is purely geometrical and does not depend on simulation protocol, particle properties (other than friction that plays a role in the estimate), or the system size.
Our results show that the differences in extend to the non-zero force thresholds and . Specifically, we find that whenever percolating cluster exists for the D systems, it is composed of a significant number of particles. In D, on the other hand, we can find a percolating cluster composed of a very small percentage of particles, particularly when or when . Let us also reiterate that the presented results are robust with the respect to the details of the relaxation period, at least within the range that we could consider using available computational resources.
V Topology of interaction networks
We now continue with the study of topological properties of interaction networks. We focus on the number of components/clusters in the interaction network, the number of loops and voids (to be defined below) and on the measures emerging from persistent homology pre13 . The general motivation is that Betti numbers and persistence analysis can be used to compare the geometries of the force distributions kramar_2014 and find their characteristic behavior during the jamming transition kramar_pre_14 . We will see in what follows that this type of analysis indeed allows for quantifying significant differences between the topology of interaction networks in D and D systems, as well as in D systems characterized by different interaction force models. To start with, we discuss the simplest topological measure, Betti numbers.
V.1 Betti numbers
Zeroth Betti numbers, , denotes the number of components (clusters), and denotes the number of loops in a force network (a loop in an interaction network is a collection of connected edges forming a closed cycle). The next Betti number, , relevant to D geometry, counts the number of cavities. Note that provides different (but related) information than the average cluster size, , discussed in Sec. IV.2; provides the information about the number of clusters, independently of their size.
When analyzing Betti numbers, in particular, one has to make a choice of whether to consider the loops made out of three particles in contact, sometimes referred to as 3-cycles in the studies of interaction networks in granular systems tordesillas_pre10 . It is known that such loops play a role in stability of interaction networks in granular systems tordesillas_pre10 ; ardanza_pre14 . However, since 3-cycles are prevalent and not unique to a specific set of physical parameters or number of physical dimensions, we ignore them in the present analysis and focus on the loops involving at least four particles, similarly as it was done in our earlier studies kramar_2014 ; pre13 ; kramar_pre_14 ; epl12 .
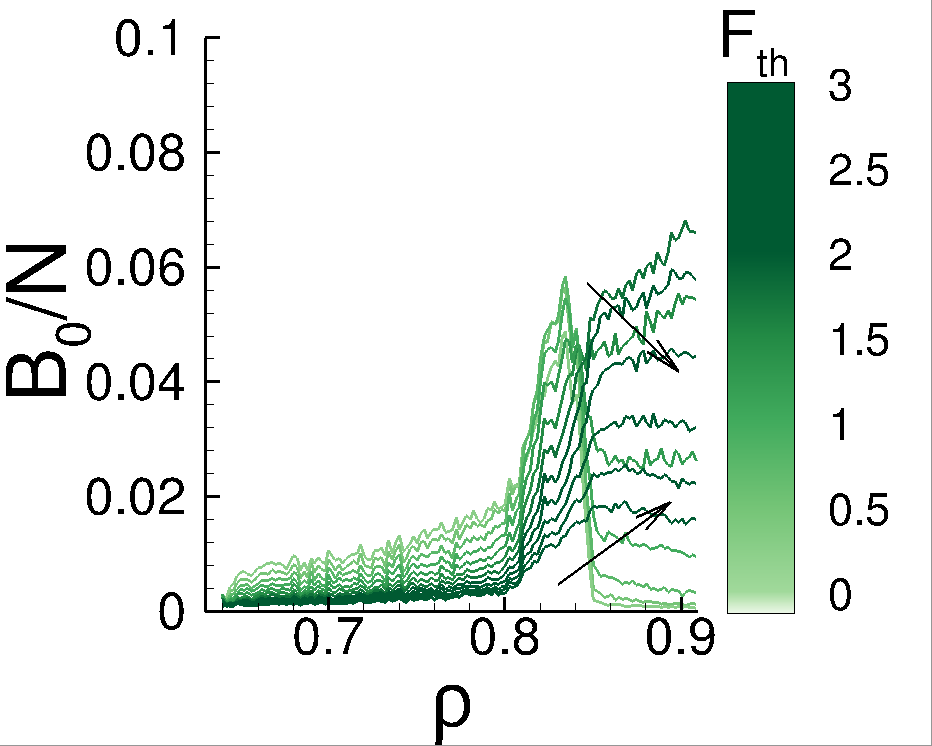
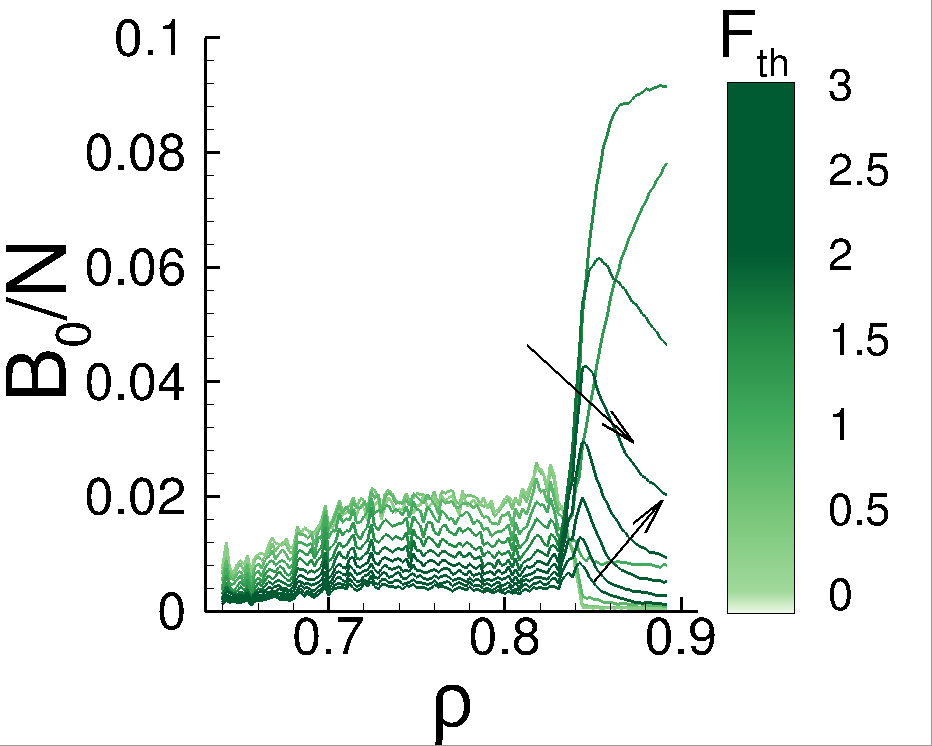
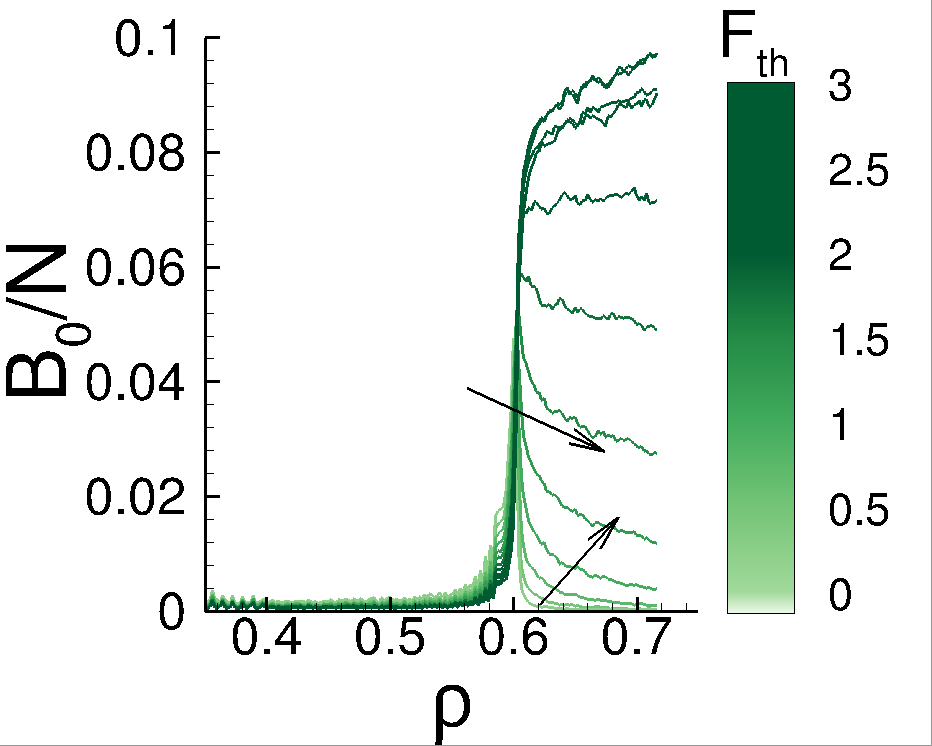
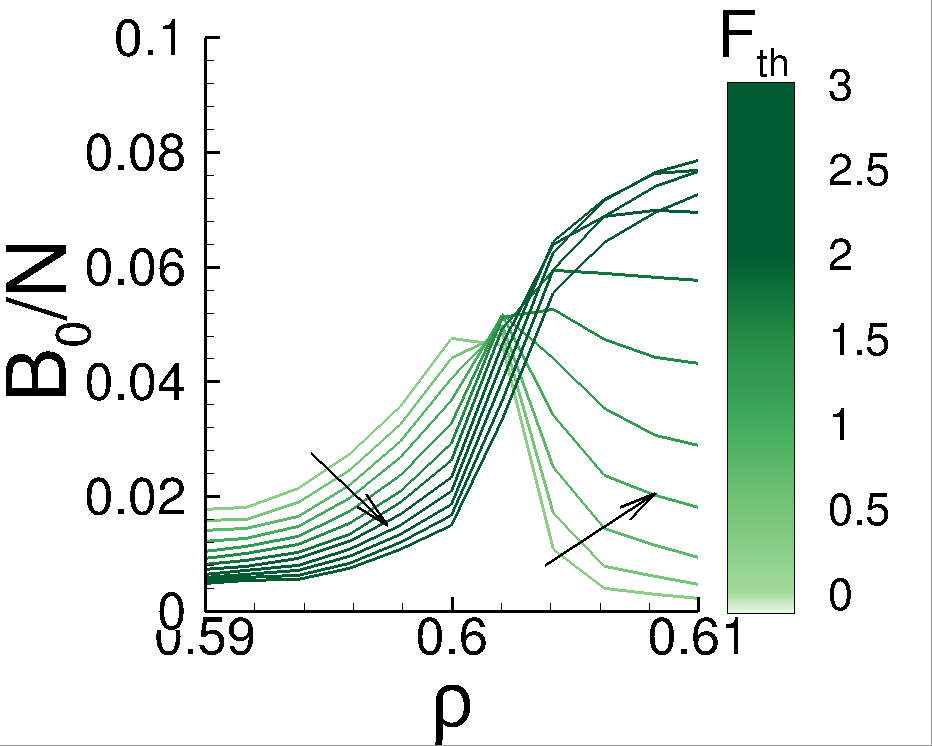
Let us begin by examining the number of clusters, , forming in the interaction network during compression. For a complete representation of the interaction network evolution, a range of force thresholds is considered for each packing fraction. Figure 6, which shows a set of cross-sections of the introductory Fig. 2, plots rescaled by the total number of particles, . When considering Betti numbers, inclusion of percolation cluster is not relevant, since it modifies only by unity; for simplicity we include it in the Betti number count.
Figure 6(a), (c) shows that for small values of , the systems based on the non-linear force model develop a pronounced peak near the respective jamming packing fractions, (see in particular Fig. 6(d), which is a zoom-in of Fig. 6(c)).
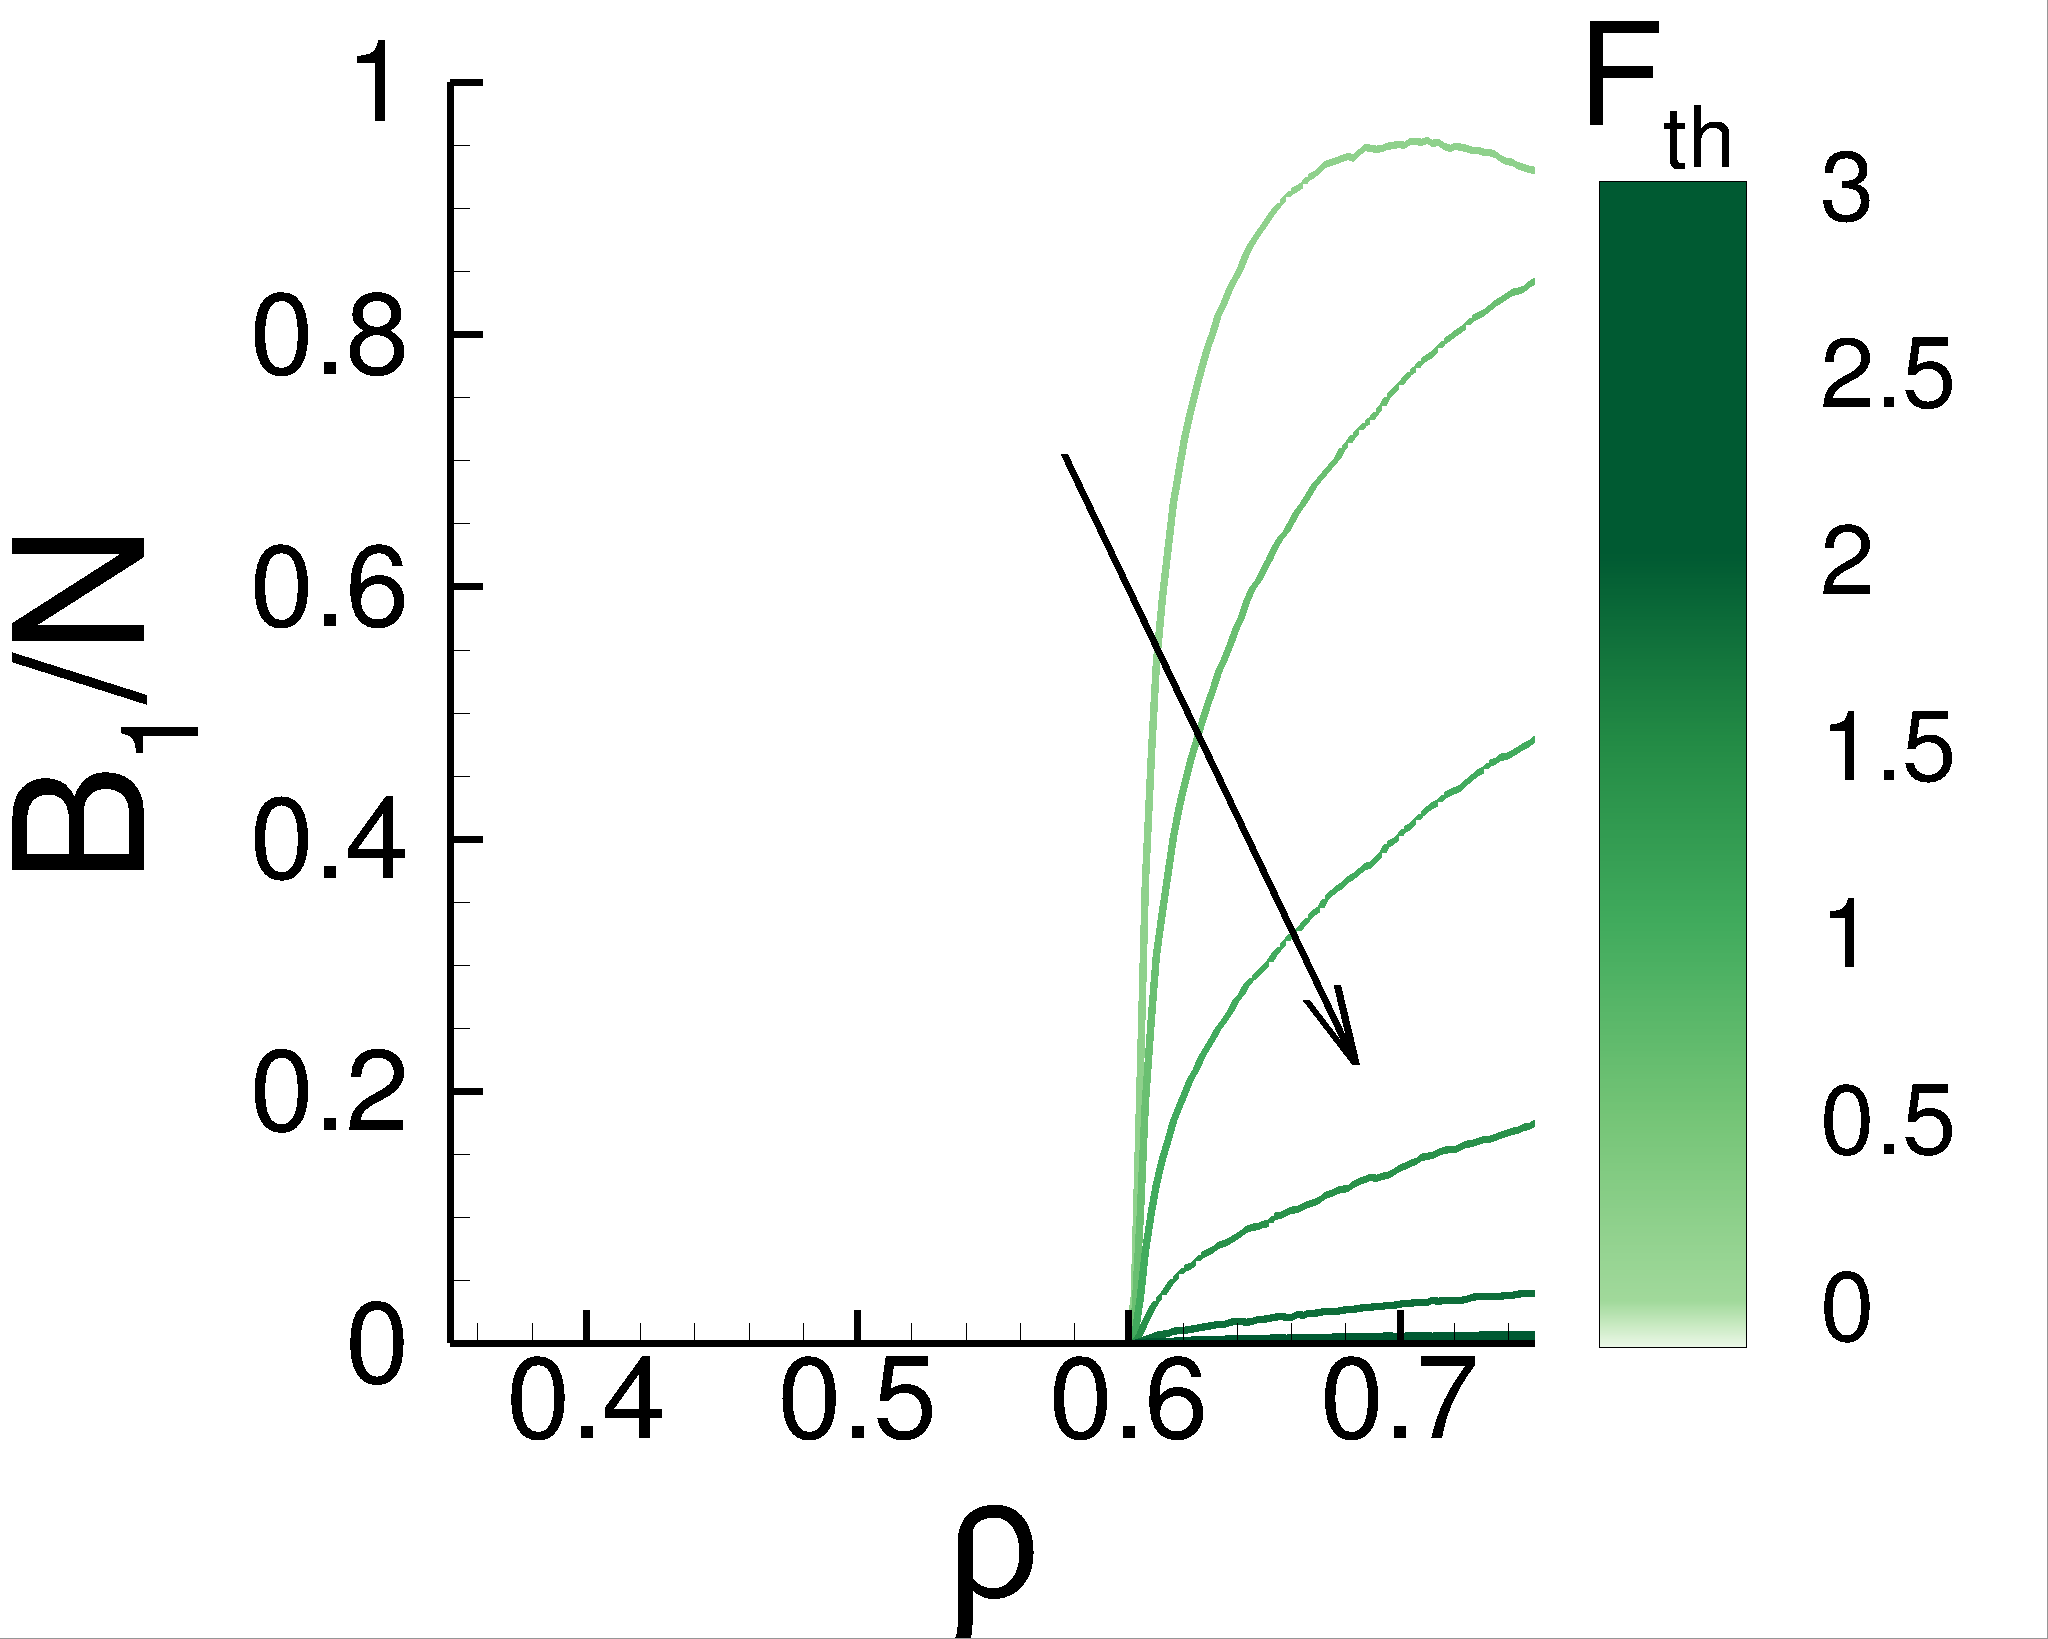
The observations made based on Fig. 4 suggest that there are important structural differences between the linear and non-linear systems. For the non-linear force model, we find that for and the clusters are more numerous compared to the ones found for (leading to the peaks visible in Figs. 6(a), (c), (d)). In contrast, for the linear force model the peak in is rather insignificant.
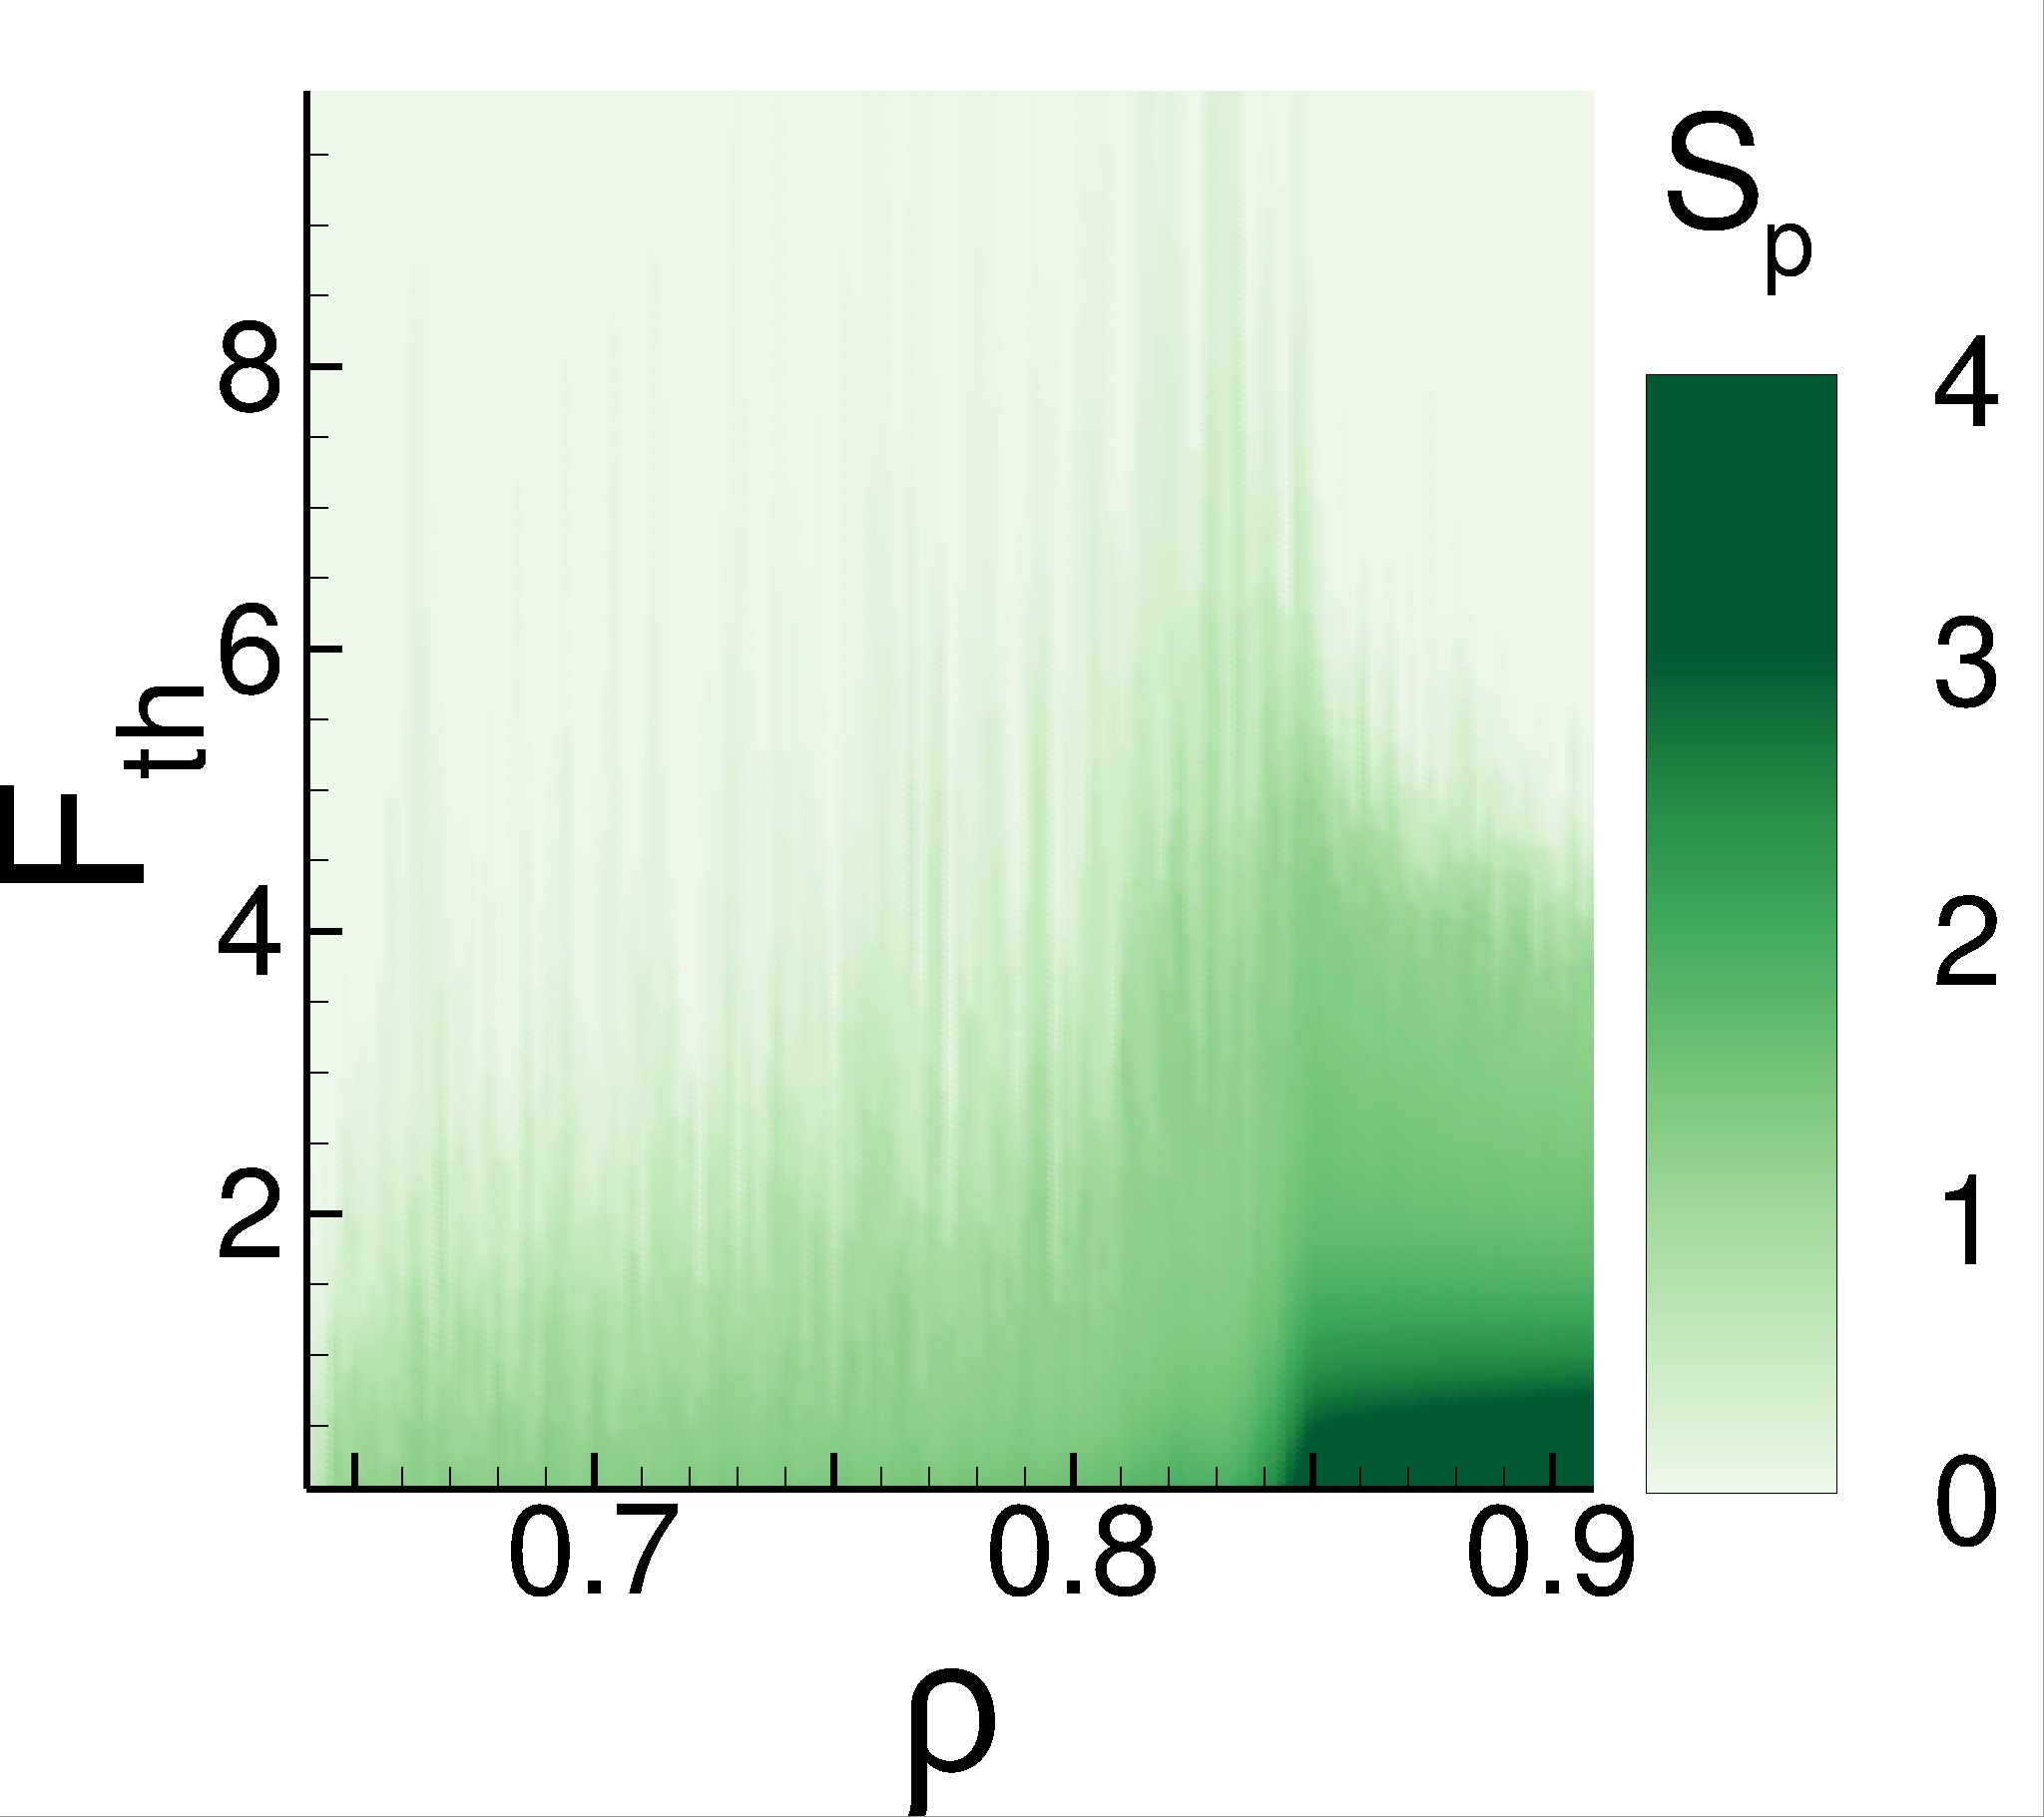
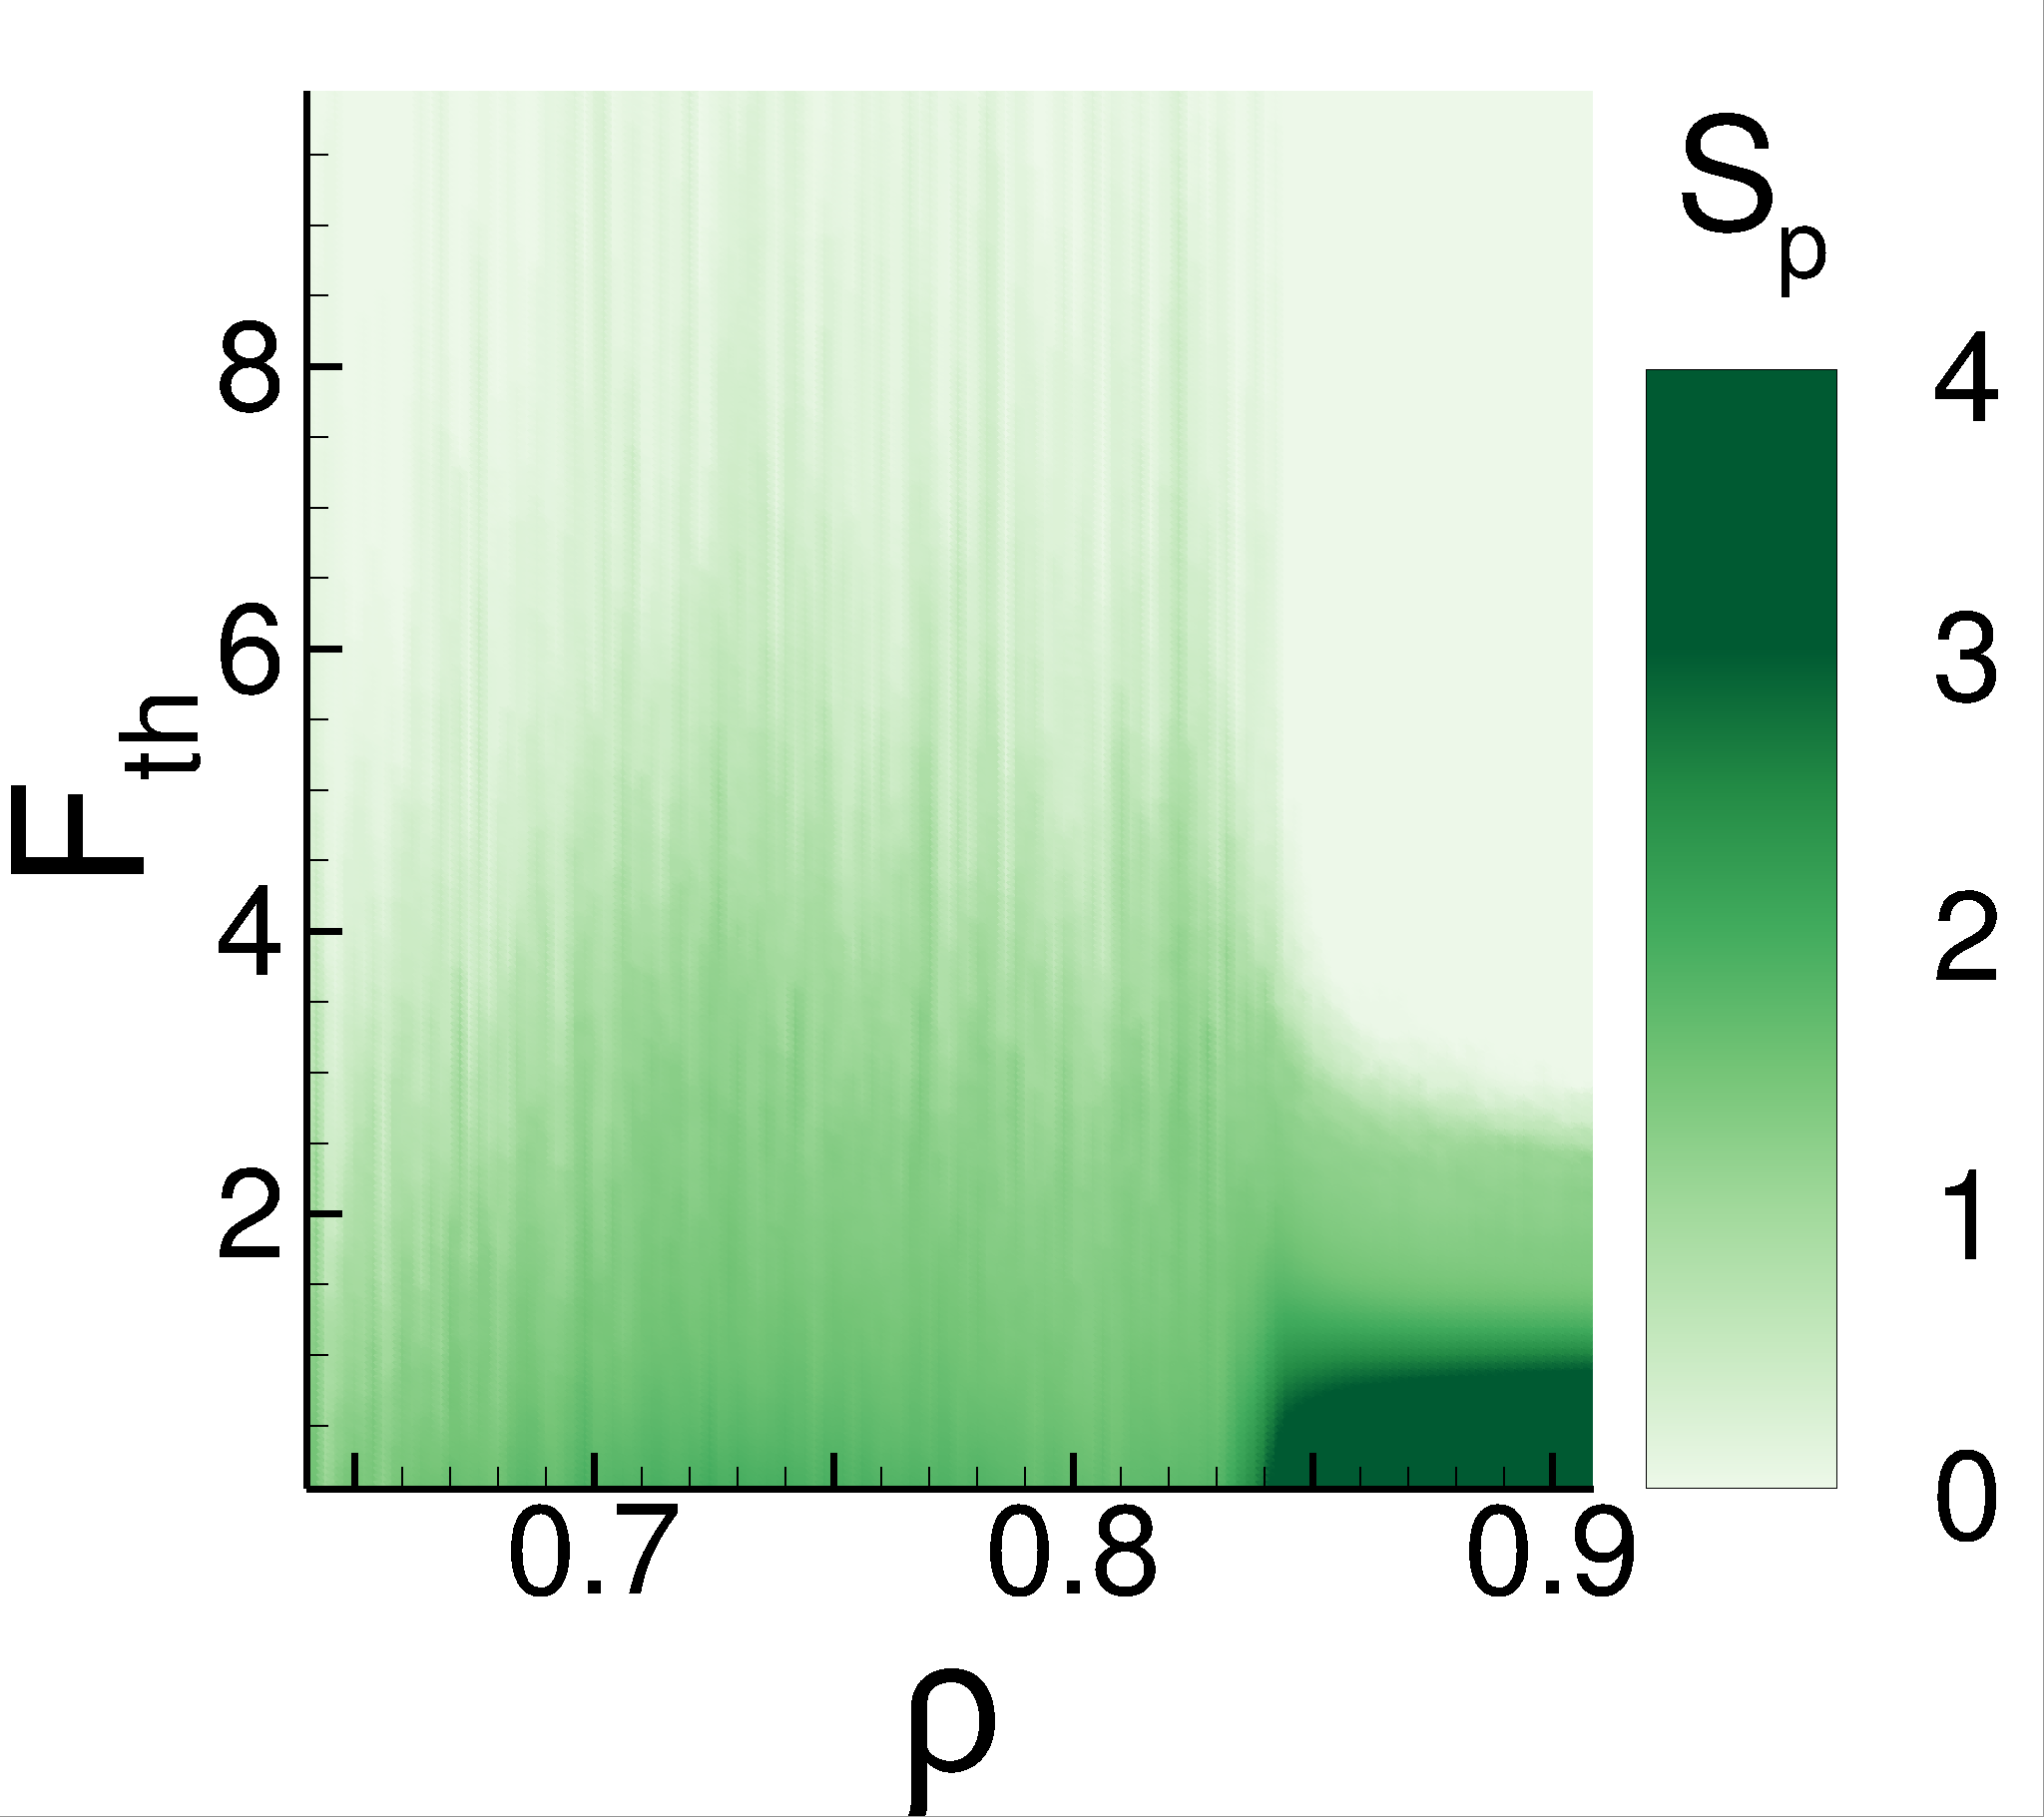
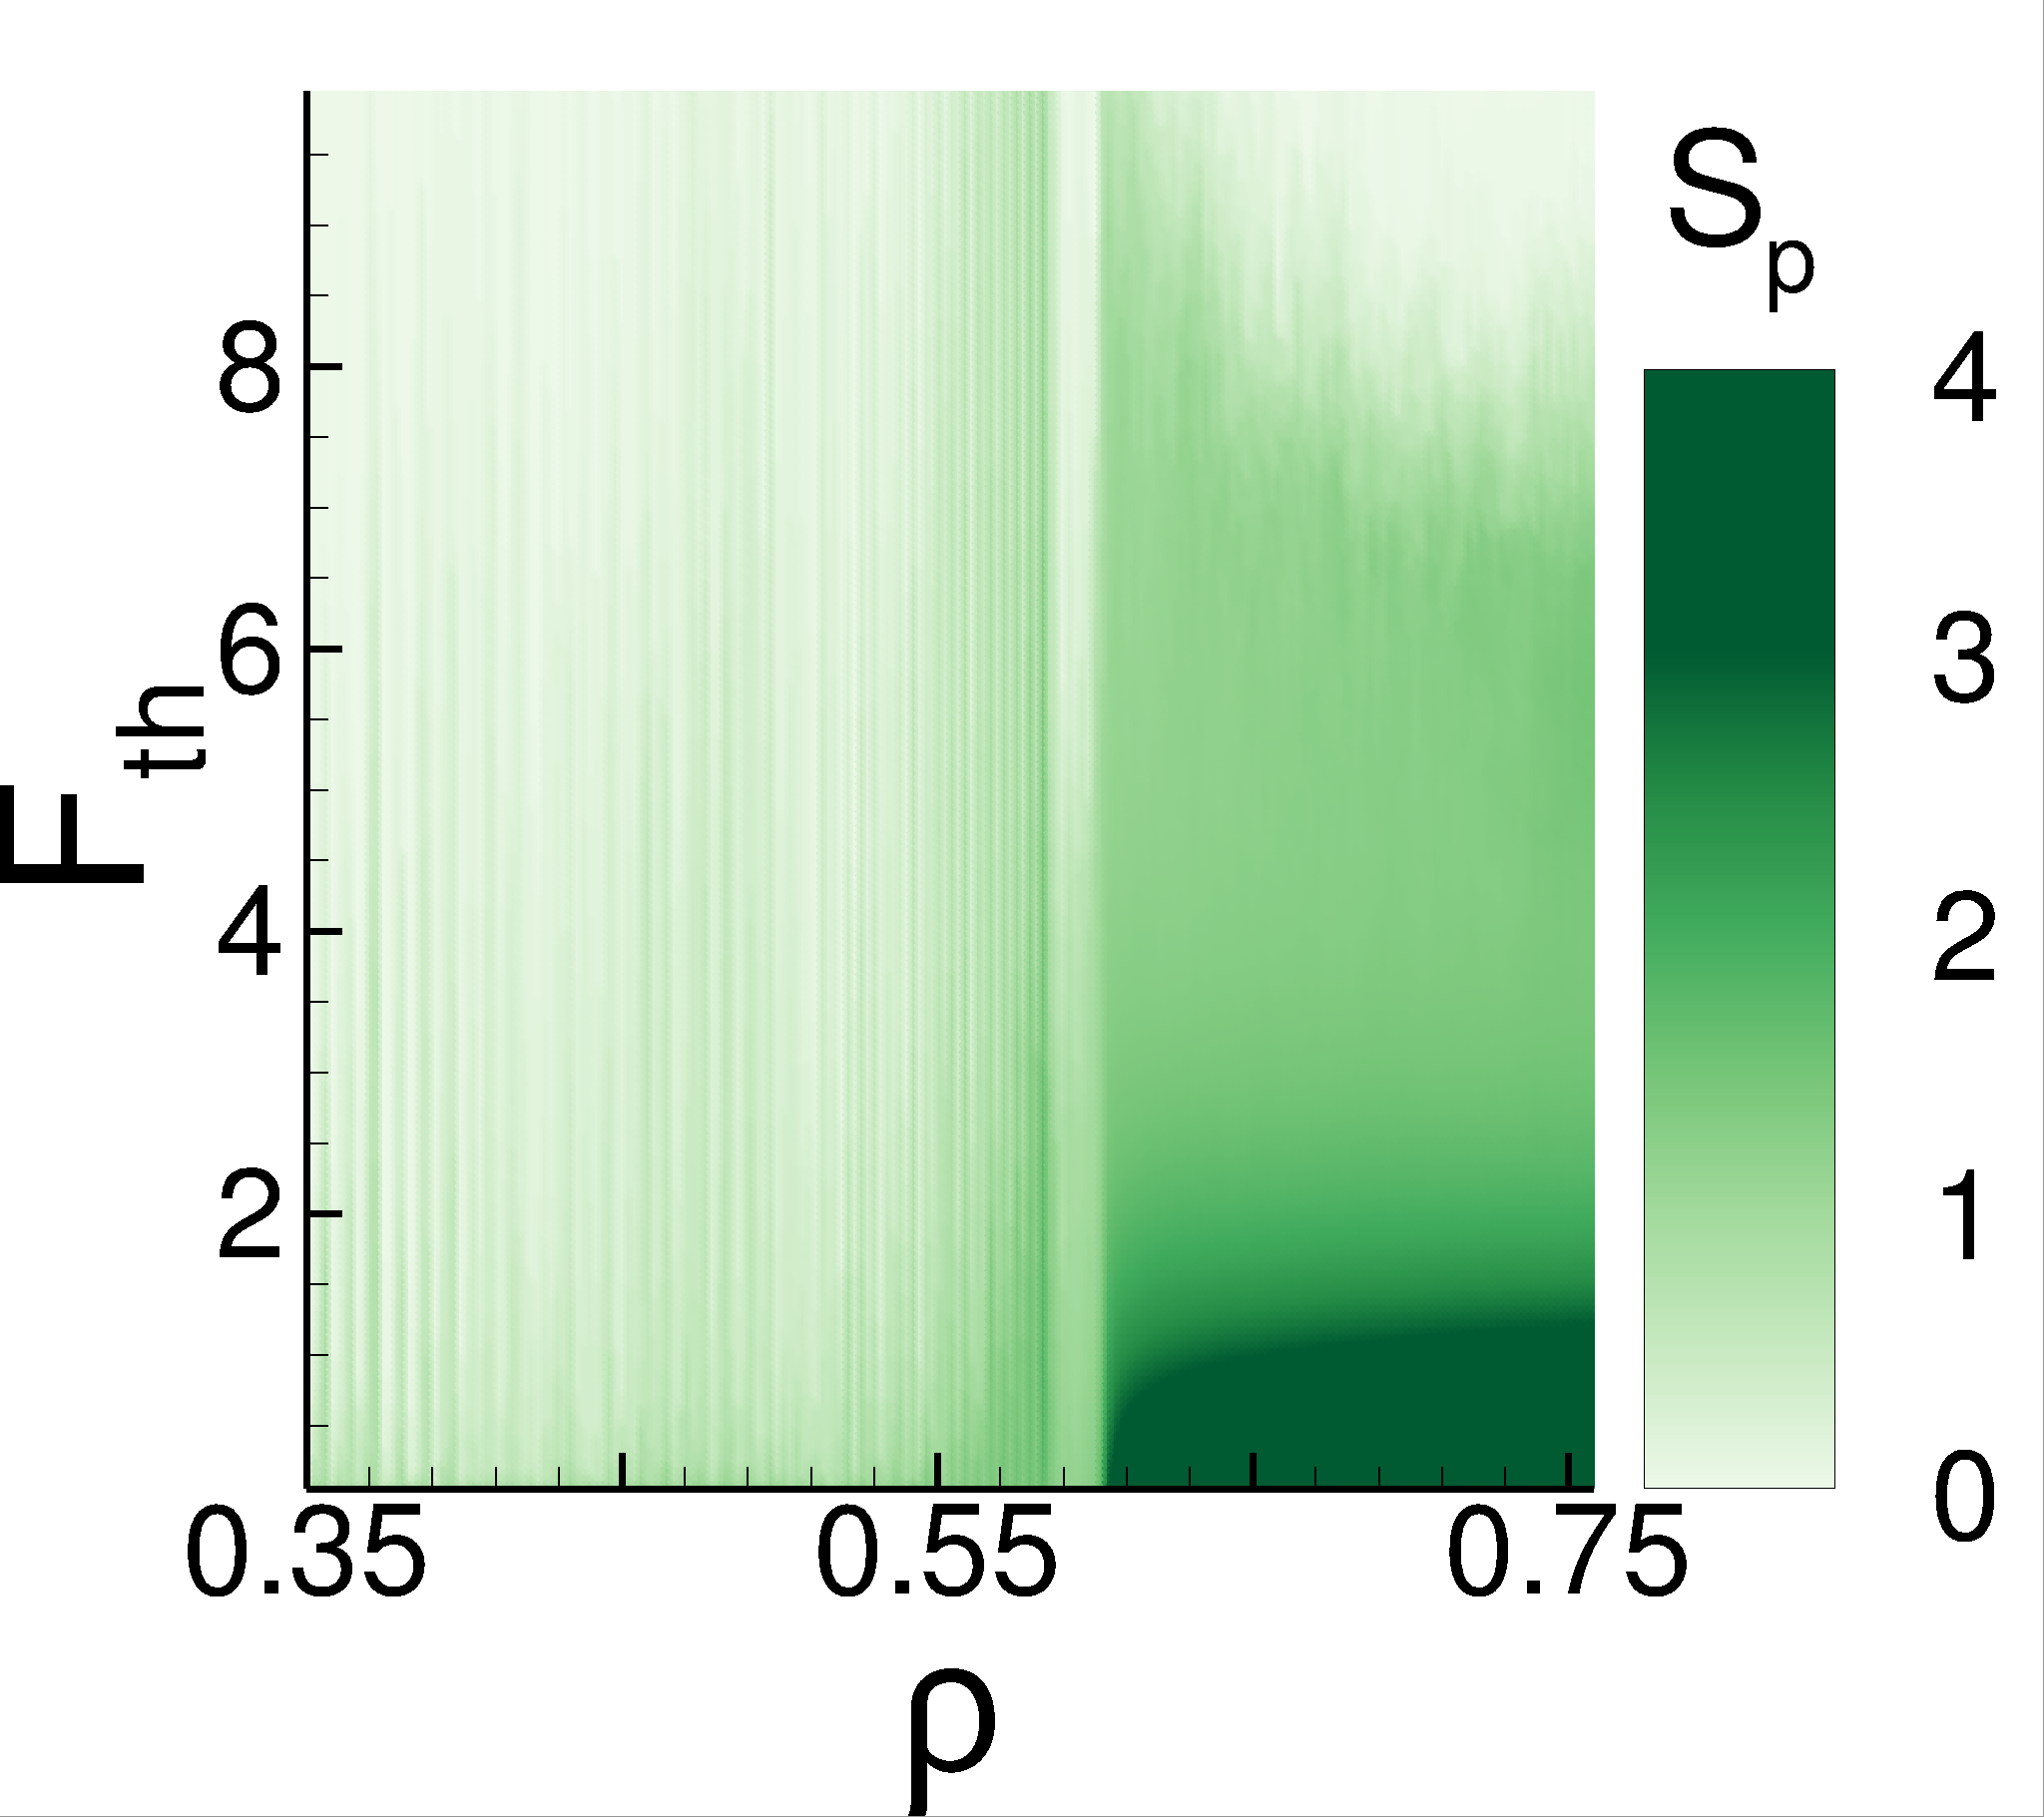
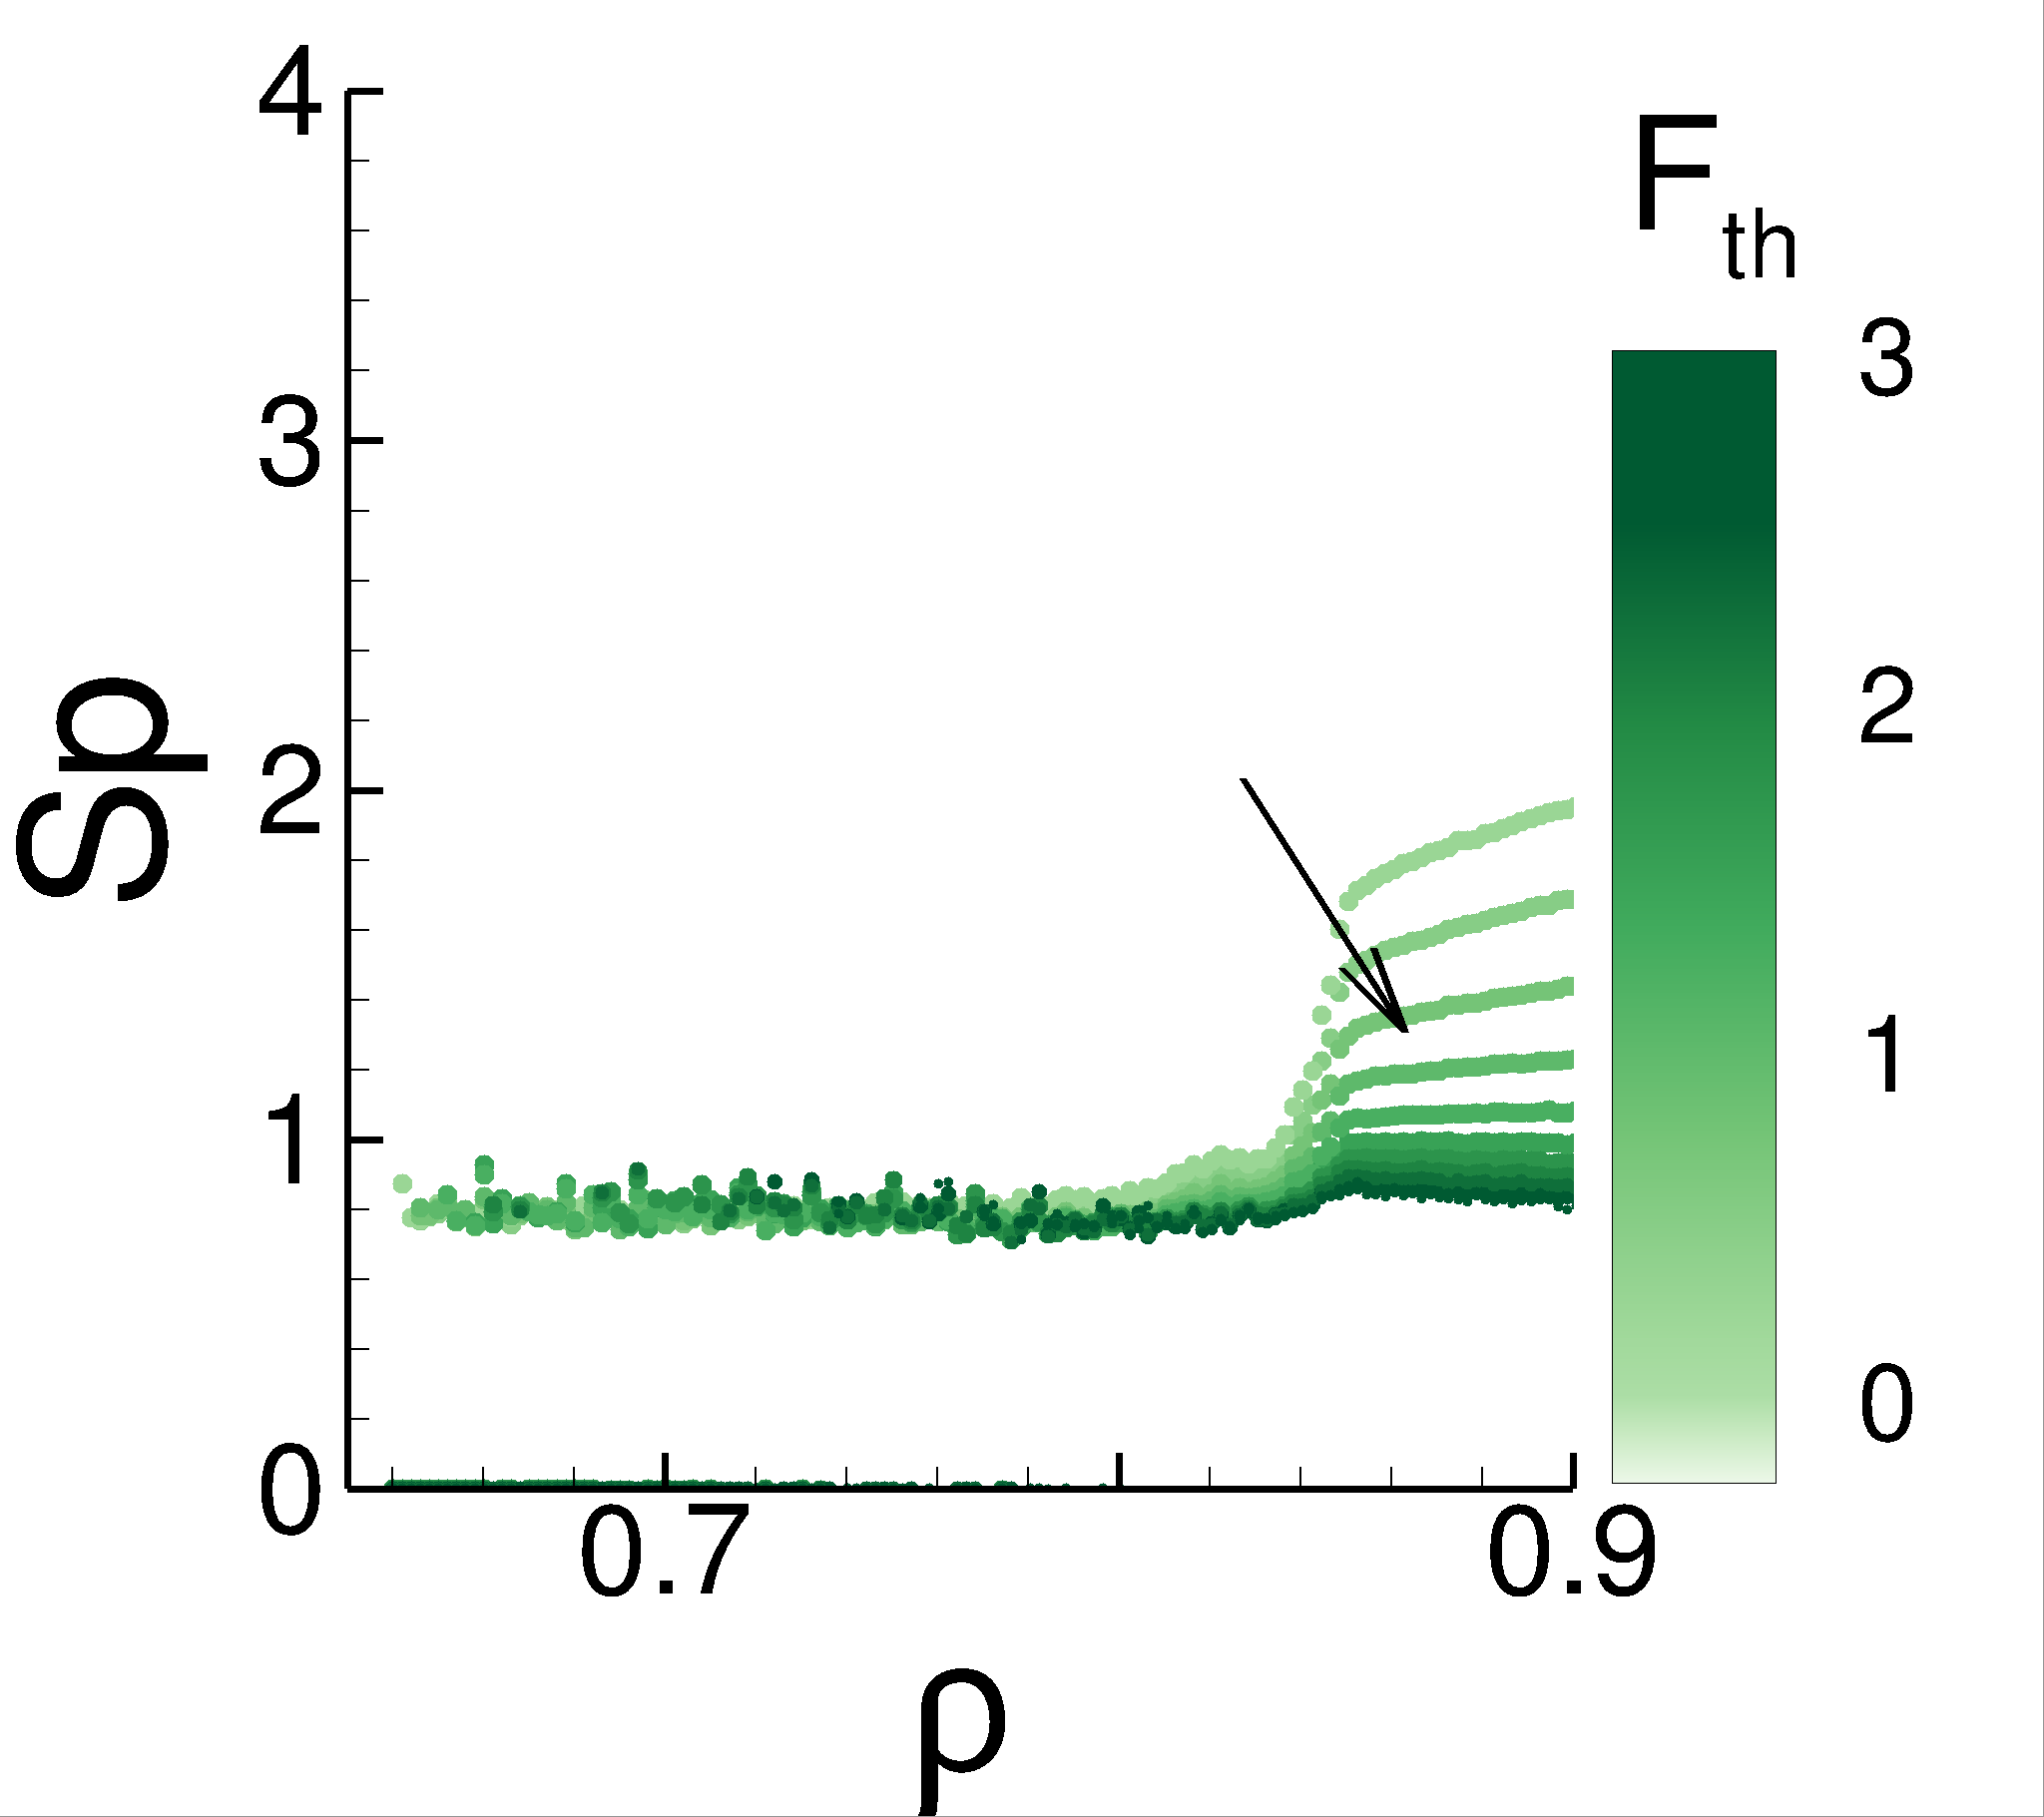
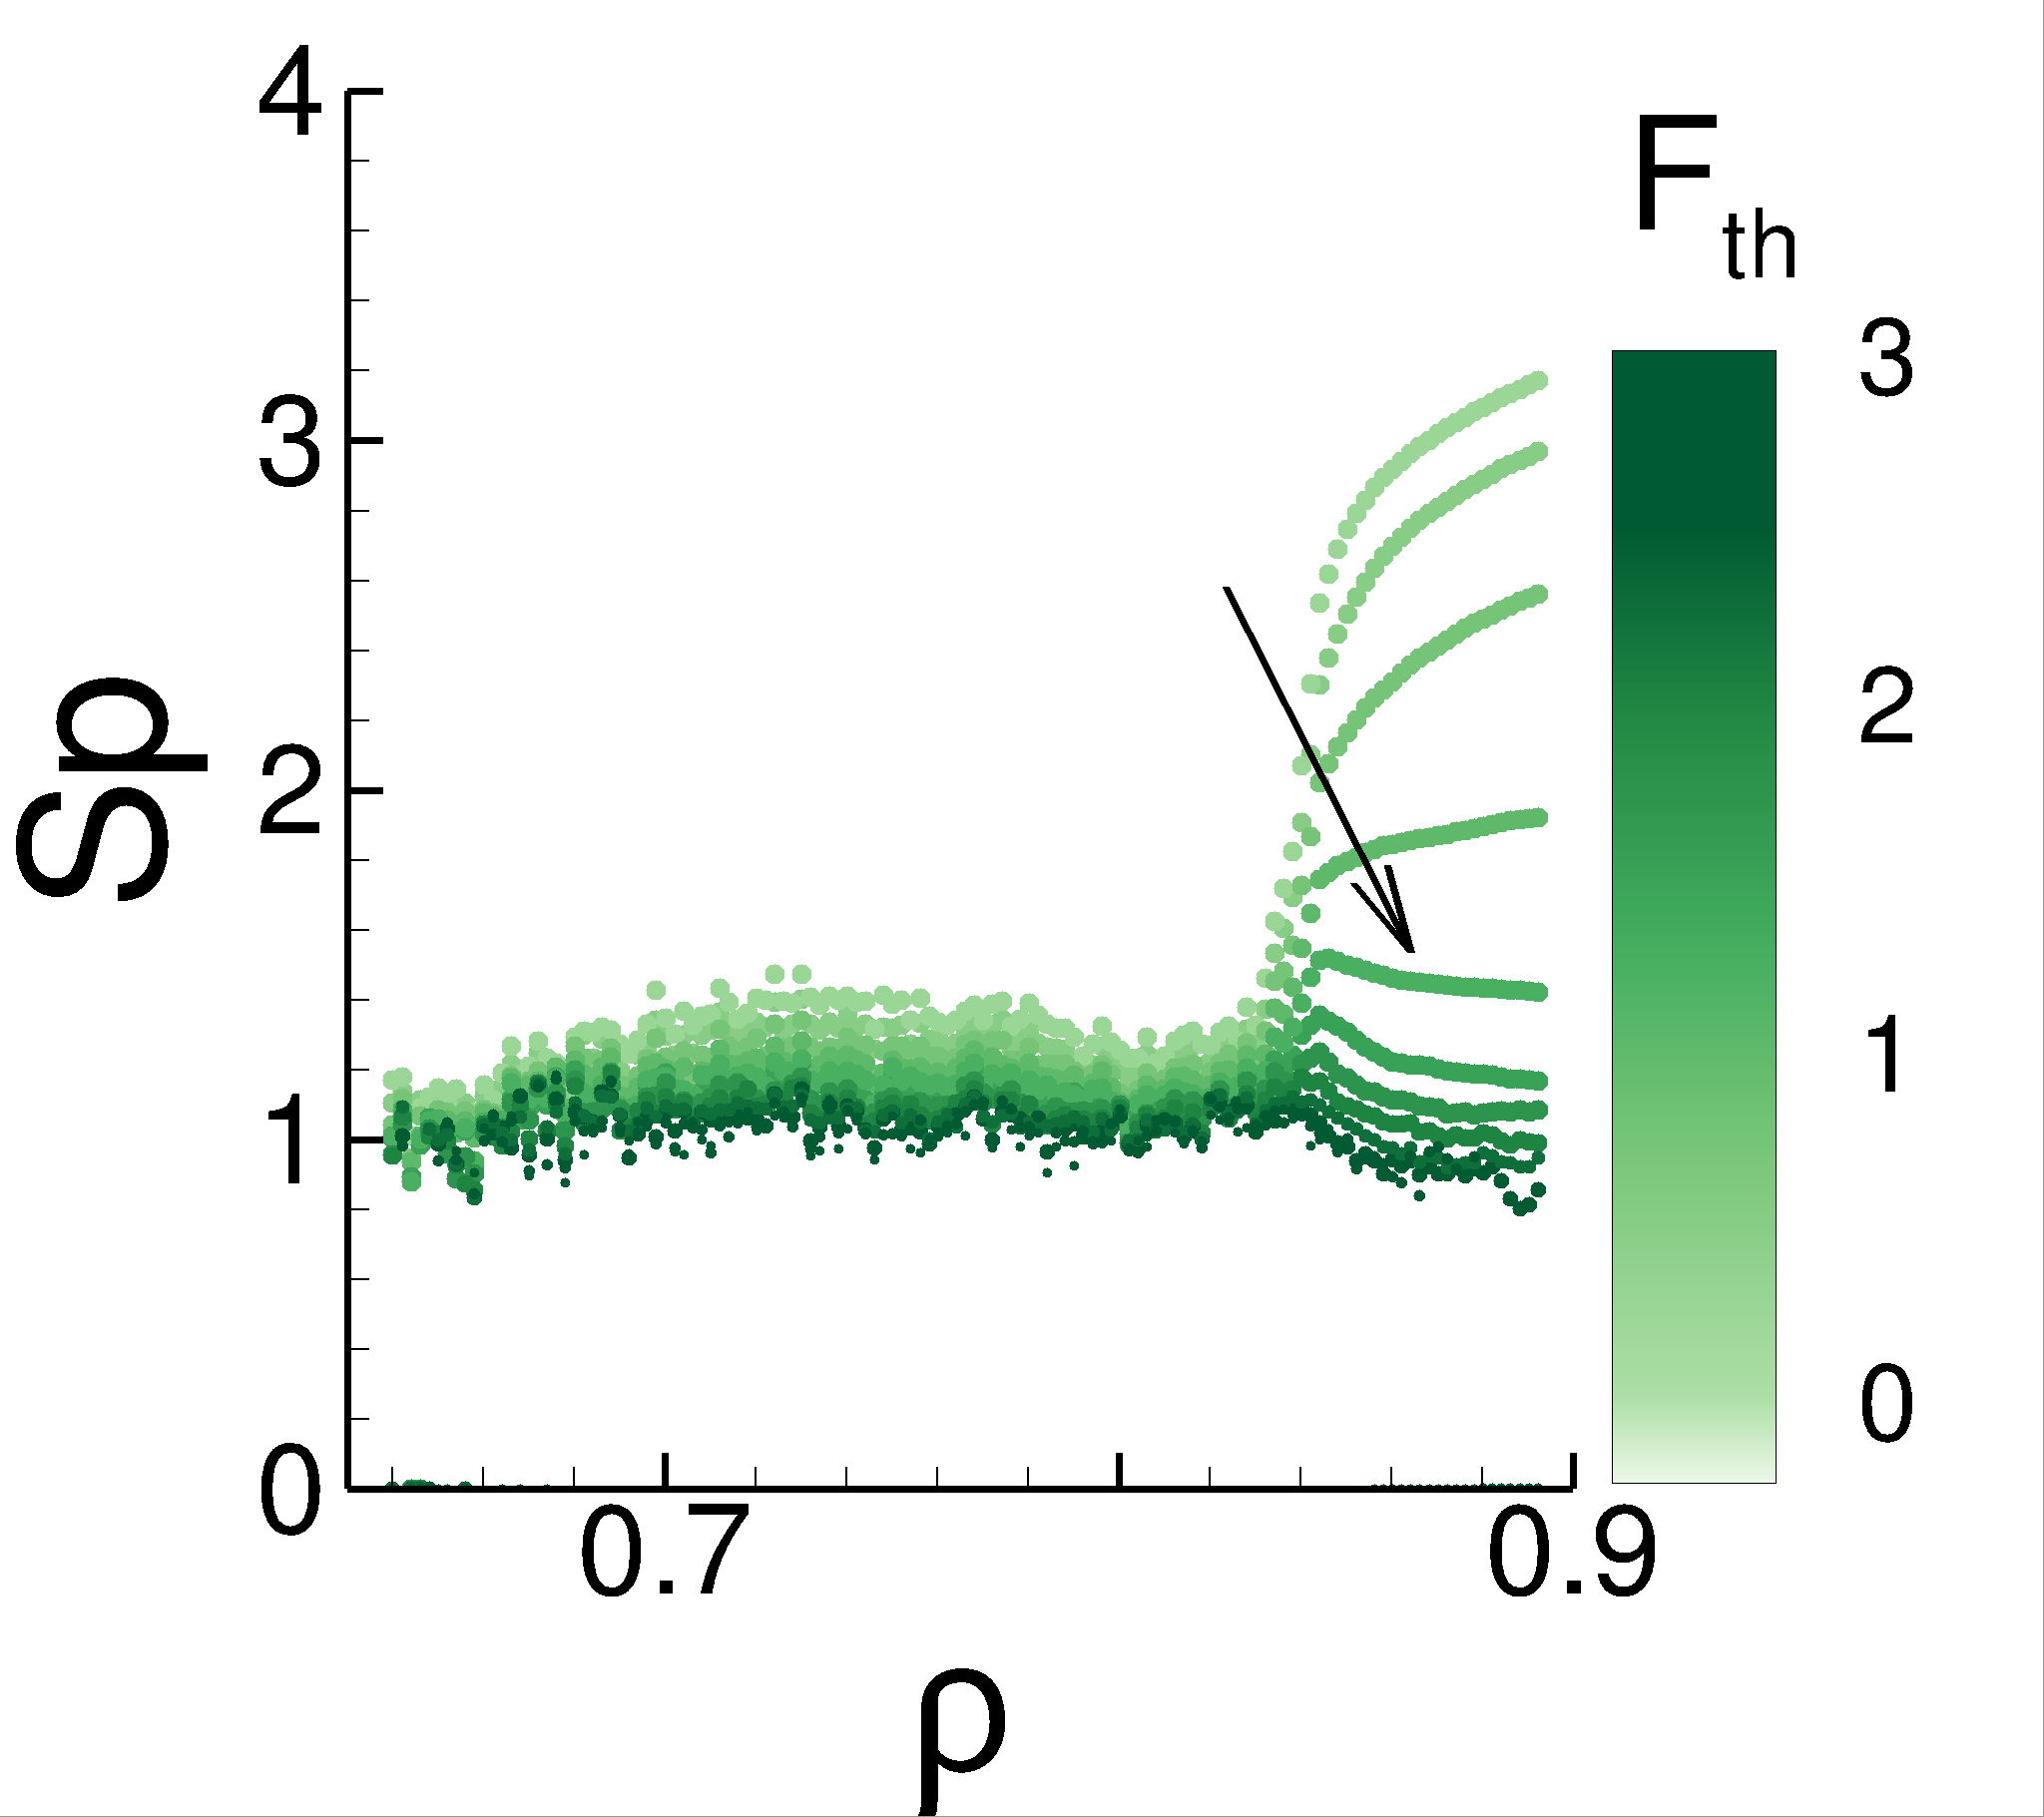
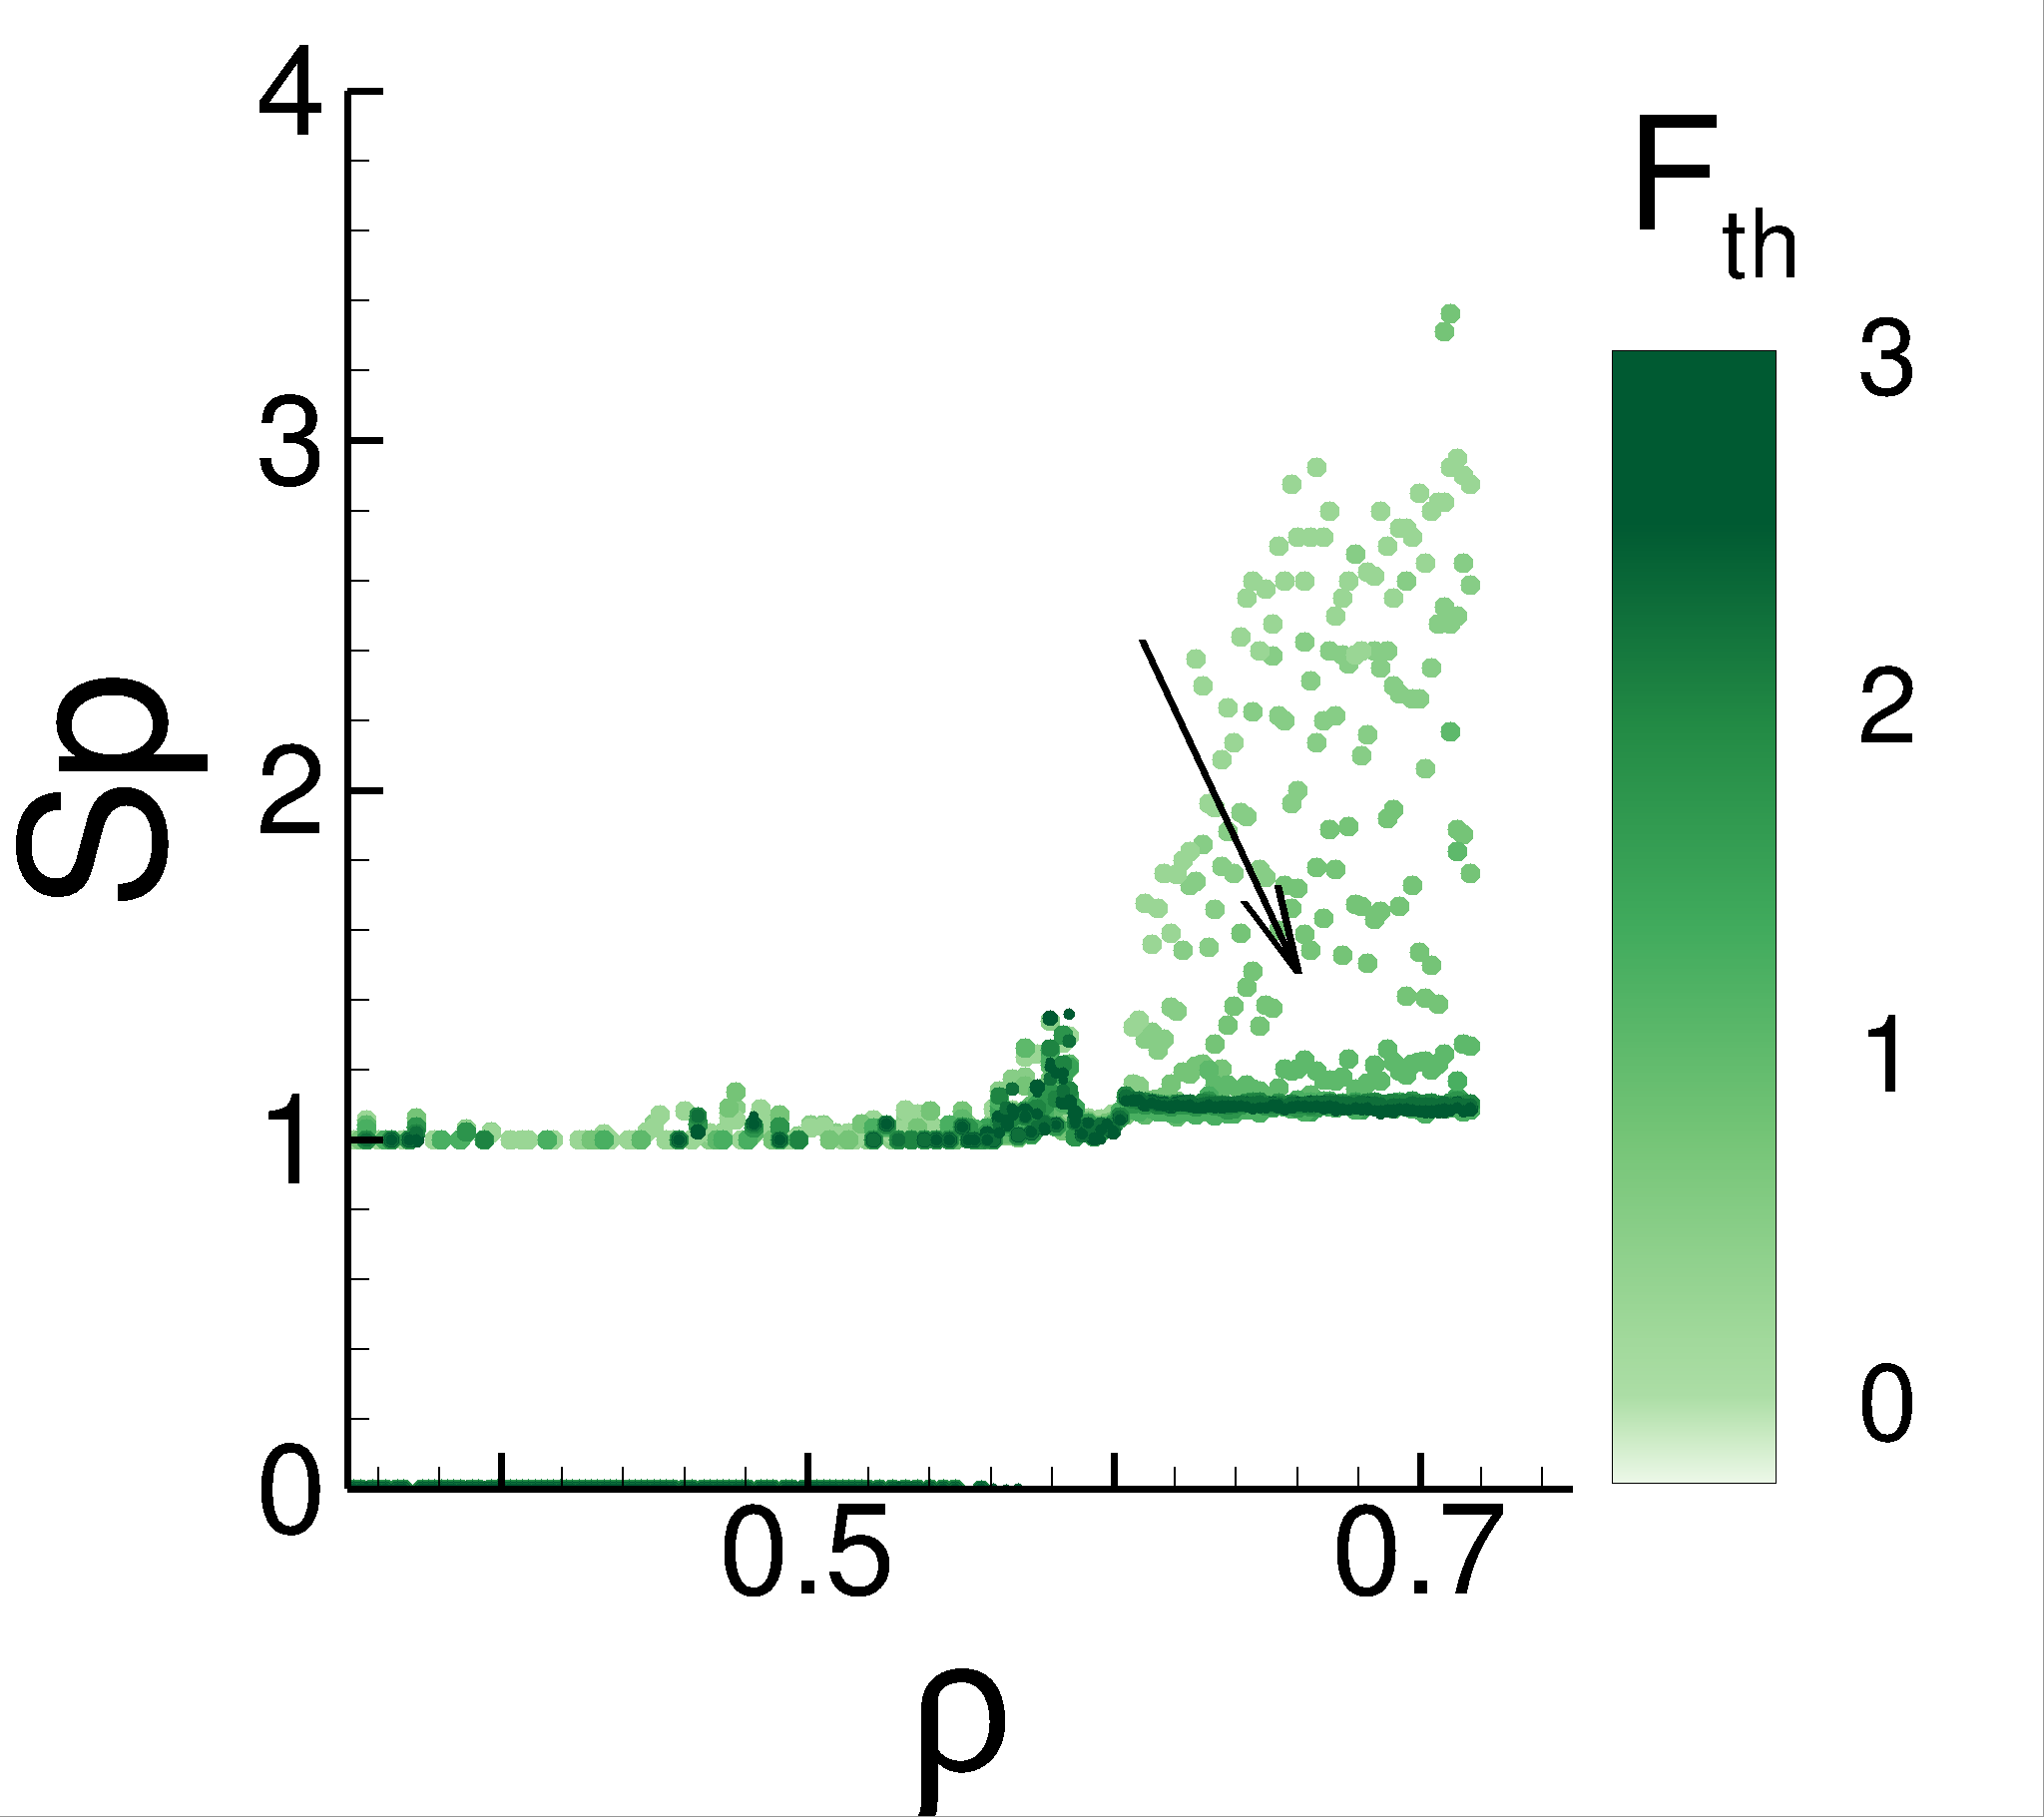
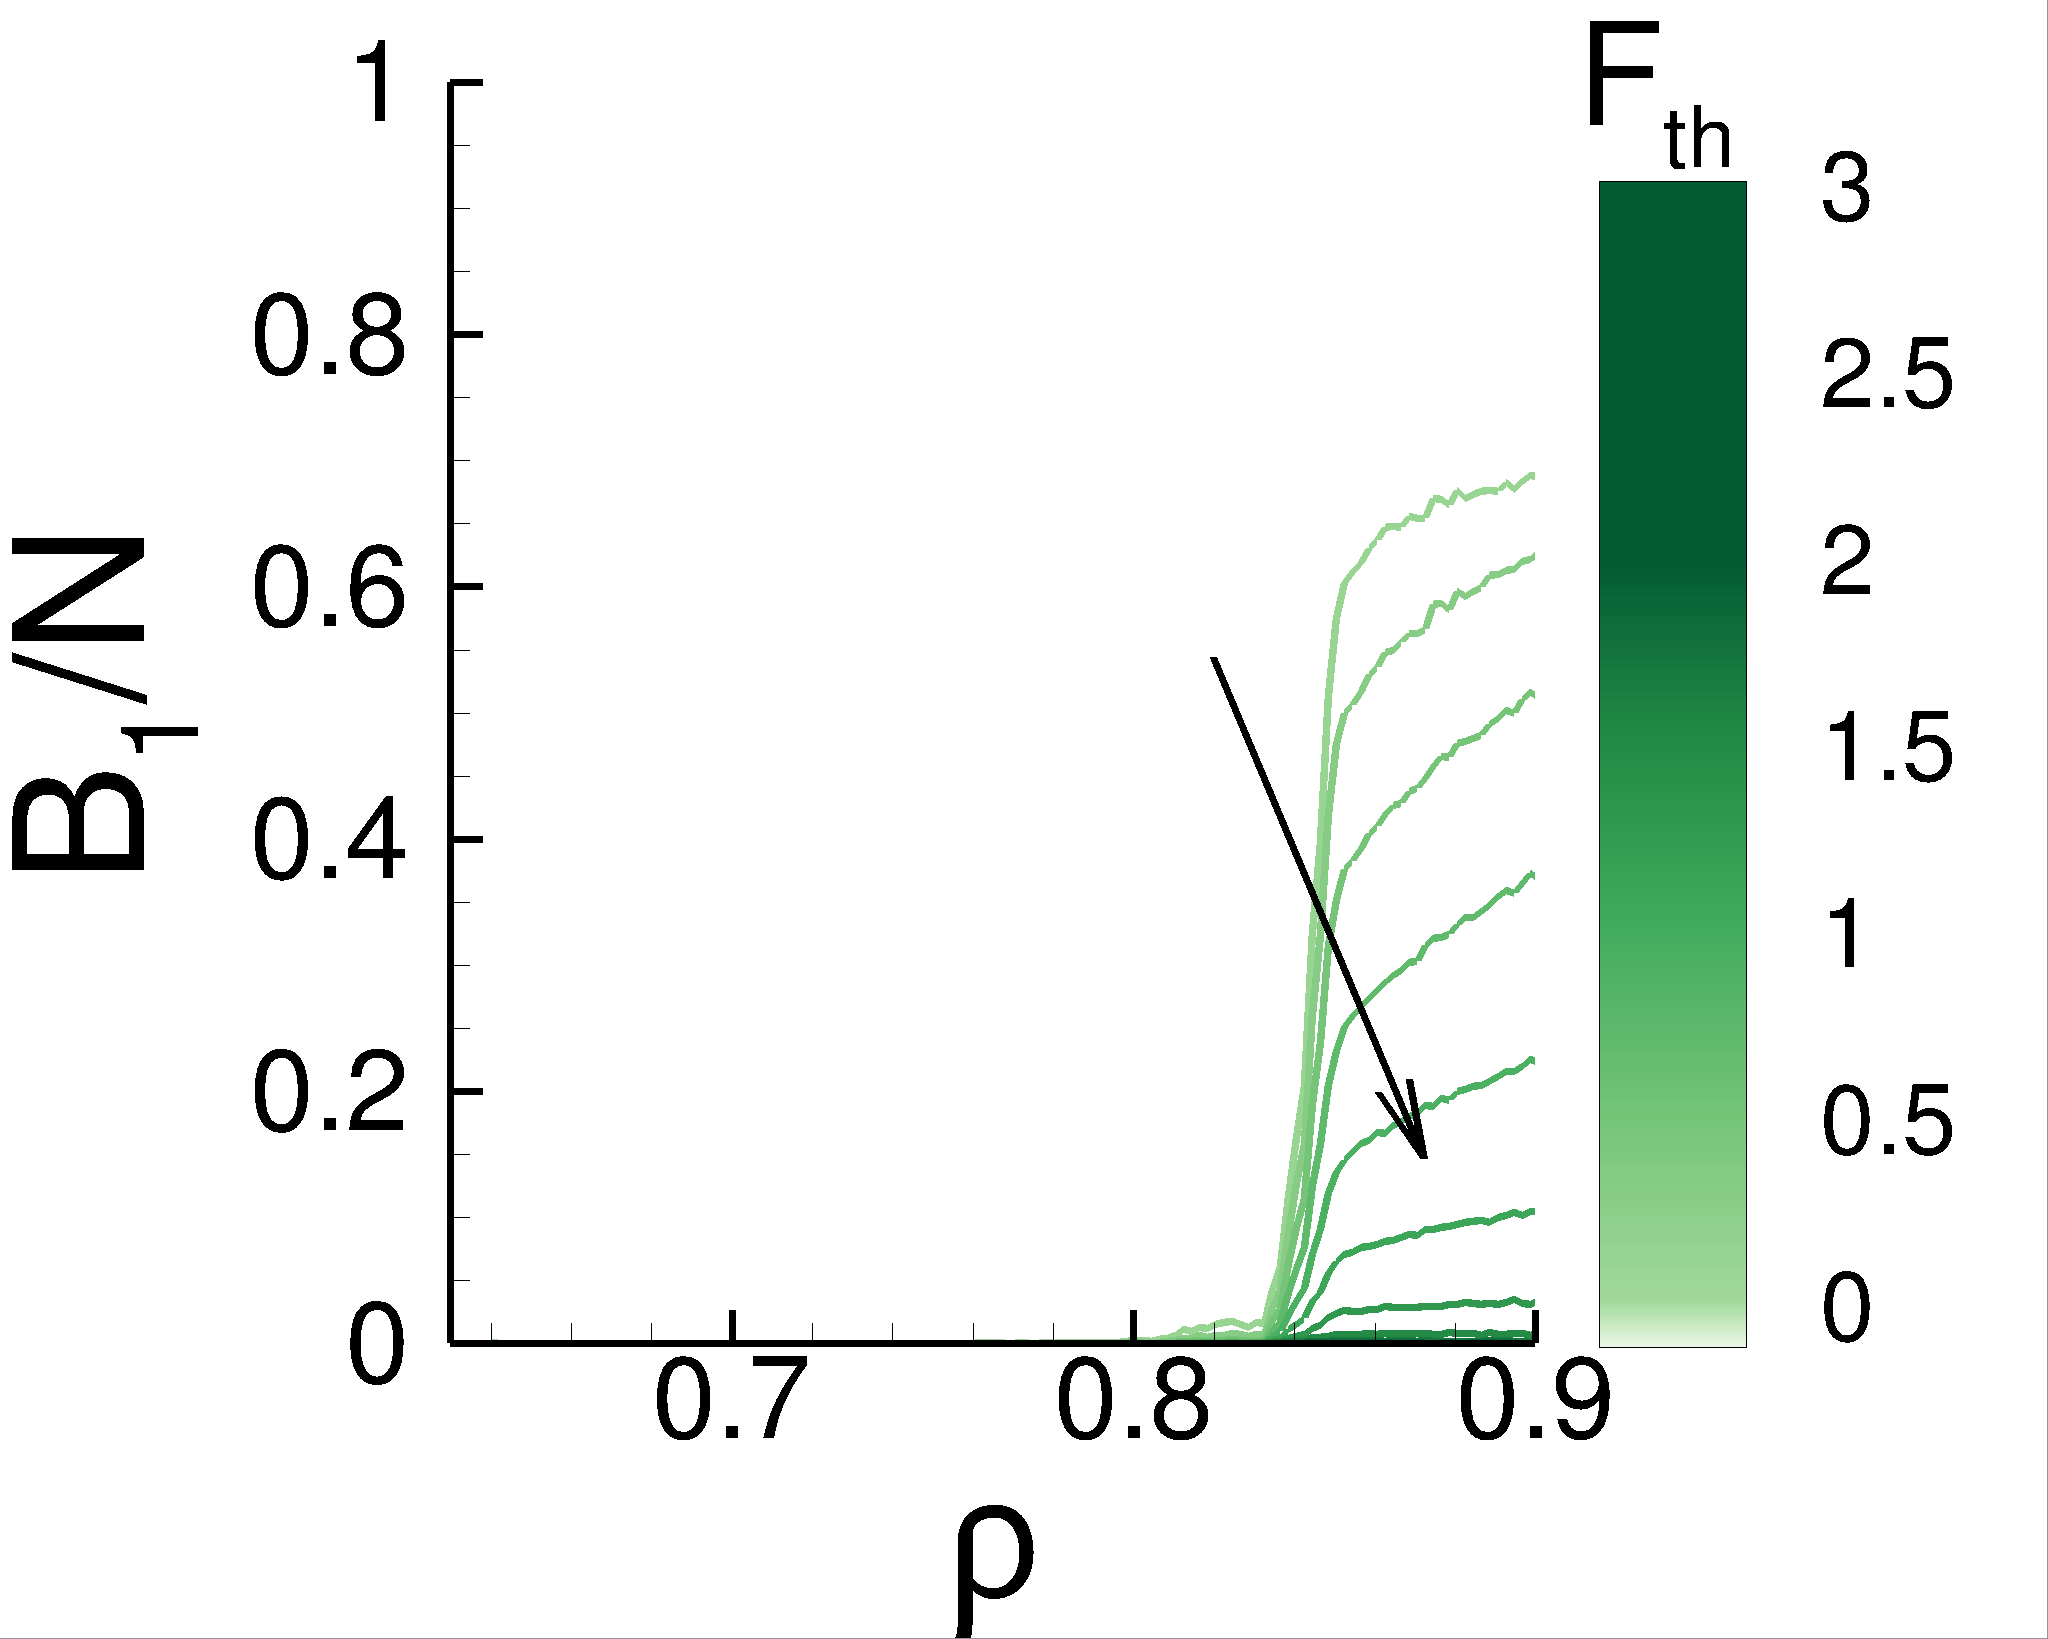
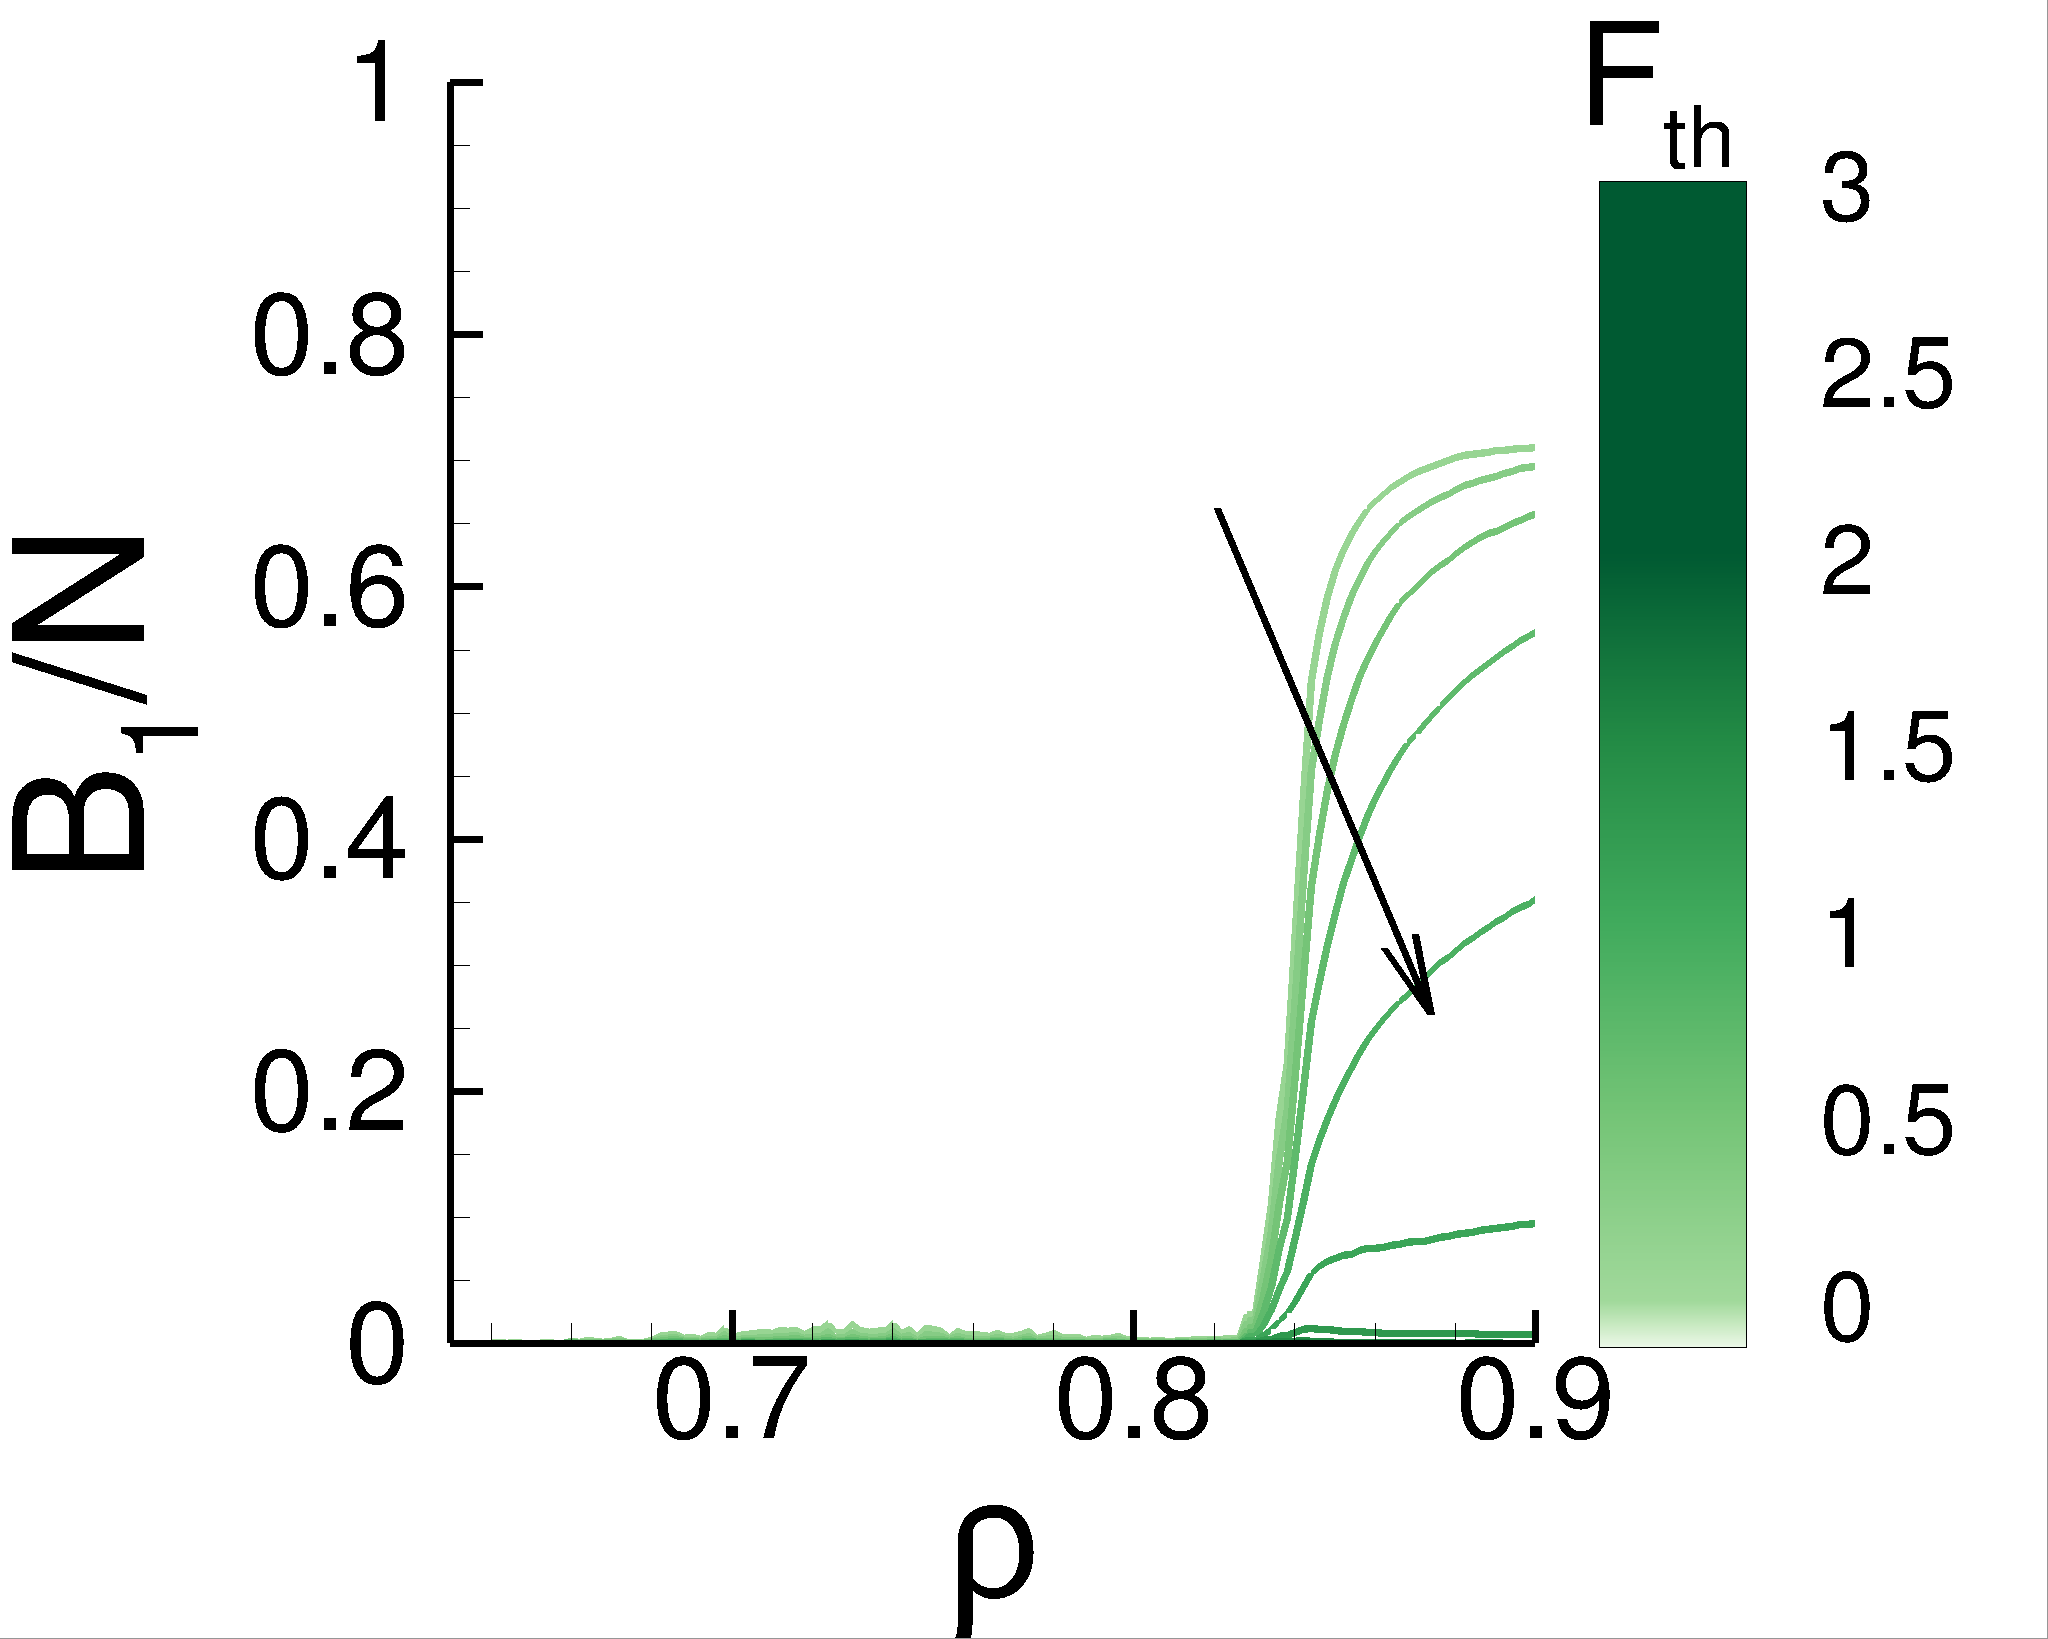
Figure 7 shows, perhaps surprisingly, that results follow the same trend for all systems considered. The evolution is generic during compression: for small below jamming we do not observe any loops forming and only beyond jamming, starts to rise and then plateaus for close to . The only visible difference between D and D systems is the larger magnitude of for the D case.
The evolution of the next Betti number, , is not analyzed here in detail since is not defined in D. We only briefly mention that in D, vanishes for and grows in a monotonous fashion as increases beyond .
V.2 Shape of the clusters
The Betti numbers provide only the count of the clusters and loops in the interaction network and do not provide any information about the cluster shape; based on Betti numbers, we do not know whether the clusters are isotropic, chain-like, or of some other form. To explore the cluster shape, we introduce a shape parameter, , defined as the number of edges in the clusters divided by the number of participating particles, averaged over all realizations. The motivation behind such measure is the following. If the particles that participate in a cluster all have one or two contacts, the cluster forms either an open or closed path, defined as a sequence of vertices (here particles). Note, that a closed path is a loop and contributes to count. Let us assume that the number of particles in such a path is . Then, the number of inter-particle contacts forming an open path is and the resulting shape parameter for such a path is . For any loop, we have . For more complex shape structures (not simple paths), we expect that in D and in D. (To avoid any confusion, we refer by to the measure averaged over all clusters and realizations, and by to the measure describing shape of an individual cluster, or to the measure describing the clusters of an individual realization. ) The upper values of are estimated from the maximum average contact number for the D and D systems. For the purpose of simplifying discussion below, we refer to the clusters with more than (on average) two contacts per particle as complex clusters; the clusters that are not complex are simple.
Figure 8 shows for all systems and for all values of and for varying packing fraction, ; Figure 9 shows cross-sections of for selected values of . Note that we put whenever for at least half of the realizations. Otherwise the values are averaged only over the realizations such that .
In discussing the results shown on Figs. 8 and 9, we focus first on the 2D systems, and small packing fractions, . We observe that for both systems . Further insight is obtained by relating this result to the ones for shown in Fig. 7. Figure 7 shows that there are no loops present for and therefore the interaction network must be composed of open paths for such values of . Although the results for the considered D systems and are similar, we still observe that is consistently larger for the linear system compared to the non-linear one, in particular for smaller values of (compare Fig. 9(a) and (b)).
Still considering the D systems, but for , we observe that for large , approaches for both systems, and we can again use the observations from Fig. 7 to conclude that the interaction network is composed of open paths, since is small. The differences between linear and non-linear systems appear when smaller values of are considered: here we find that the values of are significantly larger for the linear compared to the non-linear system. The main finding here is that for a significant range of force thresholds around the average force, the clusters are significantly more complex for the systems based on linear compared to nonlinear force model.
Let us now consider the D system, shown in Figs. 8(c) and 9(c). First of all, note that the data are more noisy in D, particularly for small . The reason for the noisiness is twofold: first, there are only few clusters when at large , so the statistics is not very good; second, there are also more possible cluster shapes in D compared to D; a quick intuitive explanation comes from considering a lattice in D and D and counting the number of possible cluster shapes with a fixed number of particles. Despite the restrictions imposed by noise, one can still conclude that the clusters are more complex in D compared to the D (non-linear) system, although the difference between the two is not as significant as expected based on geometry considerations (note that the upper limit of is and for D and D geometry, respectively). For , we find . We use again the results shown in Fig. 7 to conclude that the interaction network in this regime consists mainly of open paths.
To summarize, we find that for small or average force thresholds (less than twice the average force) regardless of the number of physical dimensions, the non-linear systems contain clusters with less complex structure compared to the linear system, suggesting that the force model plays a crucial role in the cluster shape. For large force thresholds (considering forces larger than twice the average force), the force networks are typically composed of open paths for all systems considered, independently of the force model and of the number of physical dimensions.
V.3 Persistence diagrams
In Sec. V.1 we analyzed ’s for a set of force thresholds, . Zeroth Betti number however provides only the information about the number of clusters, and not about how they are connected. This information can be obtained by analyzing persistence diagrams, which allow us to capture information about the force clusters for all force thresholds at once, including their persistence as a considered force threshold is changed. We explain the use of the persistence diagrams in interaction network analysis further by considering an example below; the reader is referred to kramar_2014 for the in-depth discussion of persistent homology in the context of interaction networks for particulate systems, and to pre13 ; kramar_pre_14 for less technical descriptions. We note that there are multiple software packages and libraries used to compute persistence diagrams perseus ; javaPlex ; phat ; gudhi . We used JavaPlex javaPlex to obtain the results discussed in this section.
When the force threshold, , changes, the clusters that are formed in the force network composed of forces above either appear or disappear: note that a cluster disappears when it merges with another one. We indicate a birth, ( at which a cluster appears), on the -axis and death, ( when a cluster disappears), on the -axis. The set of points constructed in this way forms a persistence diagram (PD); we construct a PD for each . Note that for a given , a persistence diagram contains the information about particle connectivity for all force thresholds at once. Betti numbers, for example, could be easily computed directly from the persistence diagrams. However the opposite is not true since the amount of information contained in persistence diagrams is significantly larger. For the present purposes, we also define the lifespan of a cluster as the difference . The relevance of lifespan in describing the interaction networks is discussed further below.
Figure 10 shows an example of a PD (D non-linear system is used here). One approach to analysis of persistence diagrams is to split them into bins: rough, strong, medium, and weak, similarly as in pre13 . A point on a persistence diagram belongs to the rough category if . Such points indicate clusters that have a short lifespan (after the birth, clusters in the rough region disappear after only a small change in ) and can be thought of as a noise. The points that have a lifespan larger than are divided into the following bins: weak when , medium when , and large when and . This binning of the forces is in spirit similar to the separation of interaction networks in ‘strong’ and ‘weak’ categories, commonly used in the granular literature. We use the binning approach for the purpose of developing better understanding of the differences between the granular systems considered so far. Specifically, we will discuss the origins of the ridge in Fig. 2.
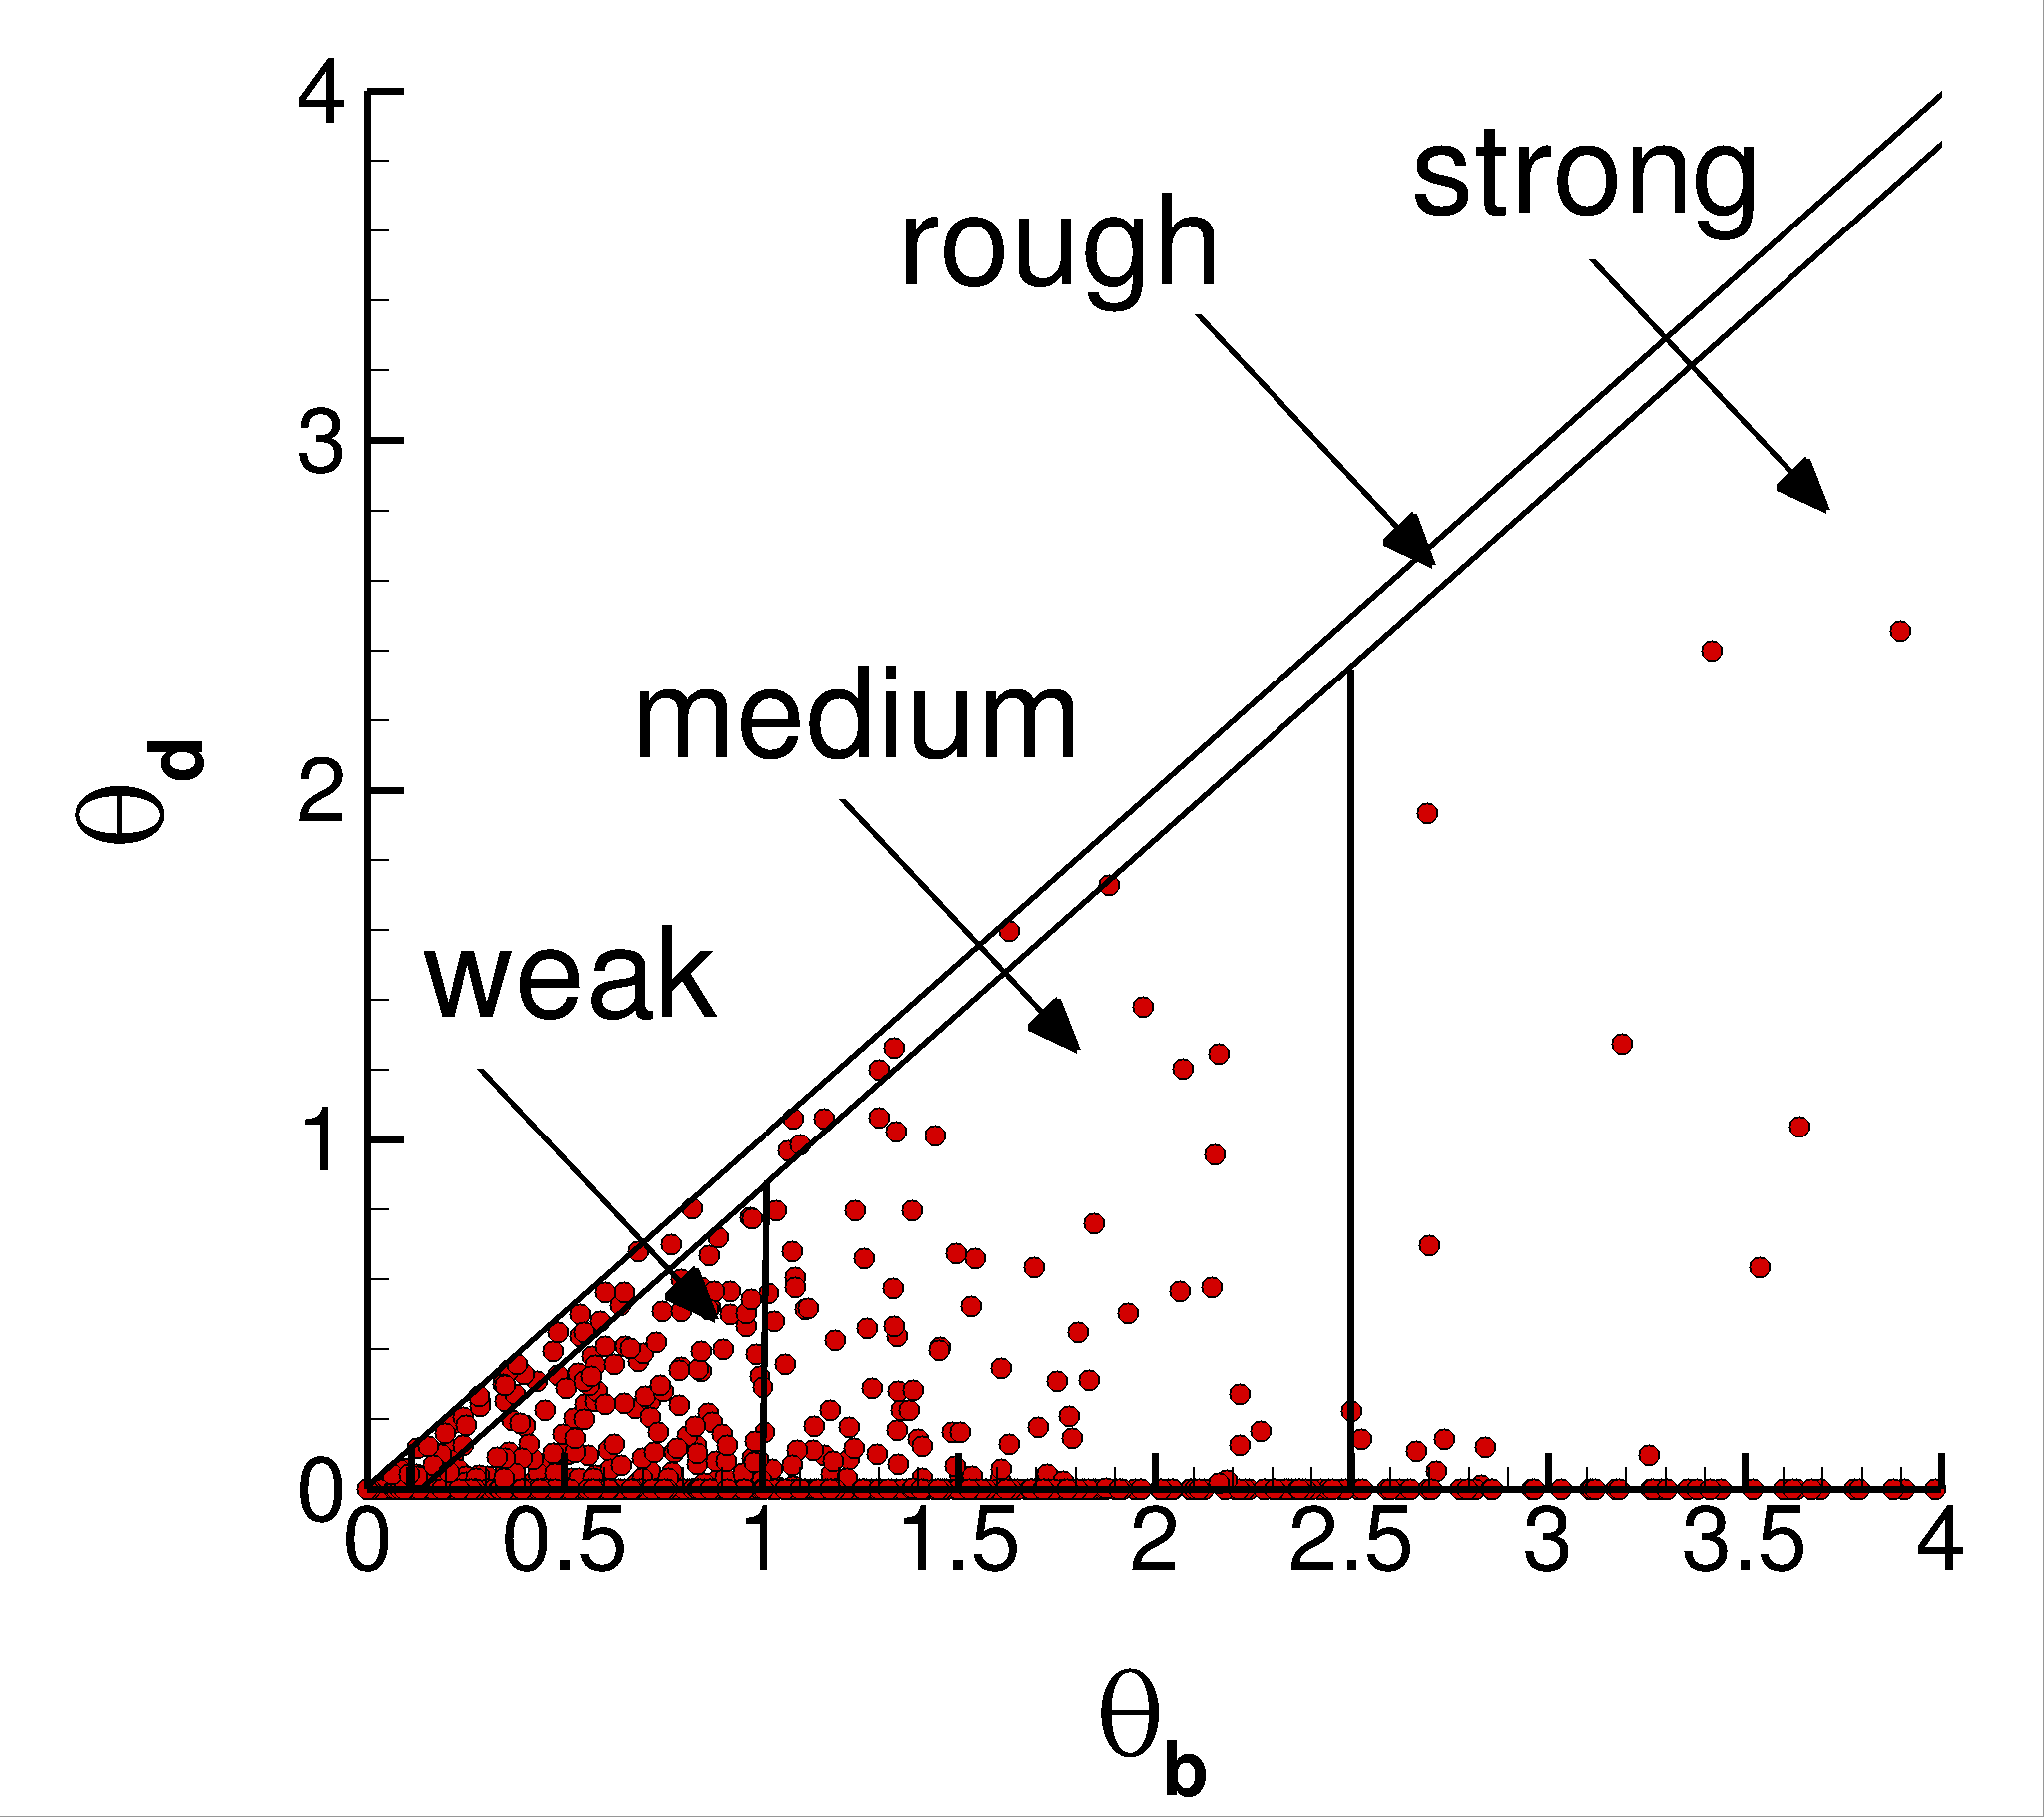
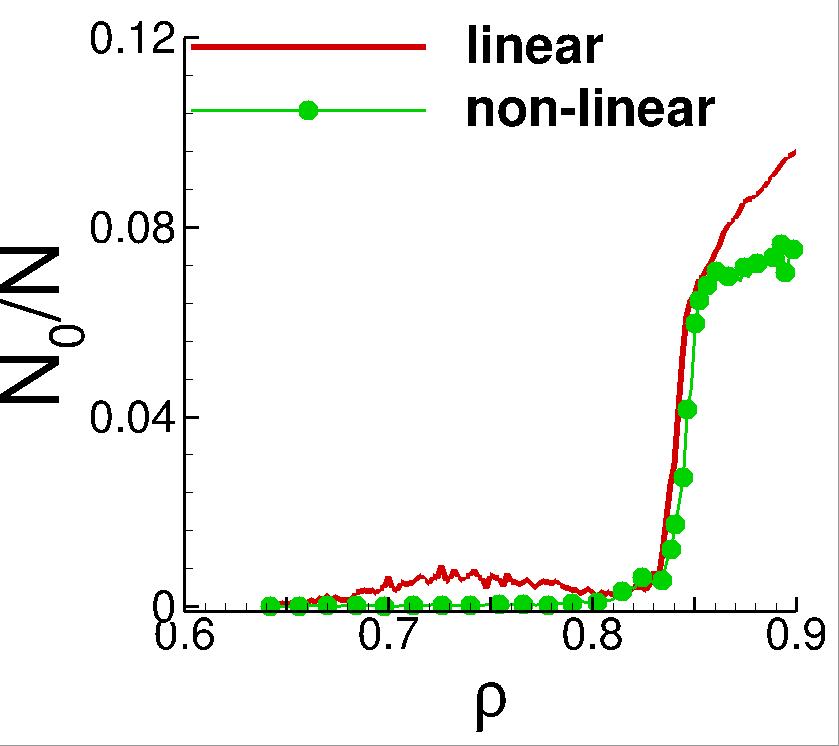
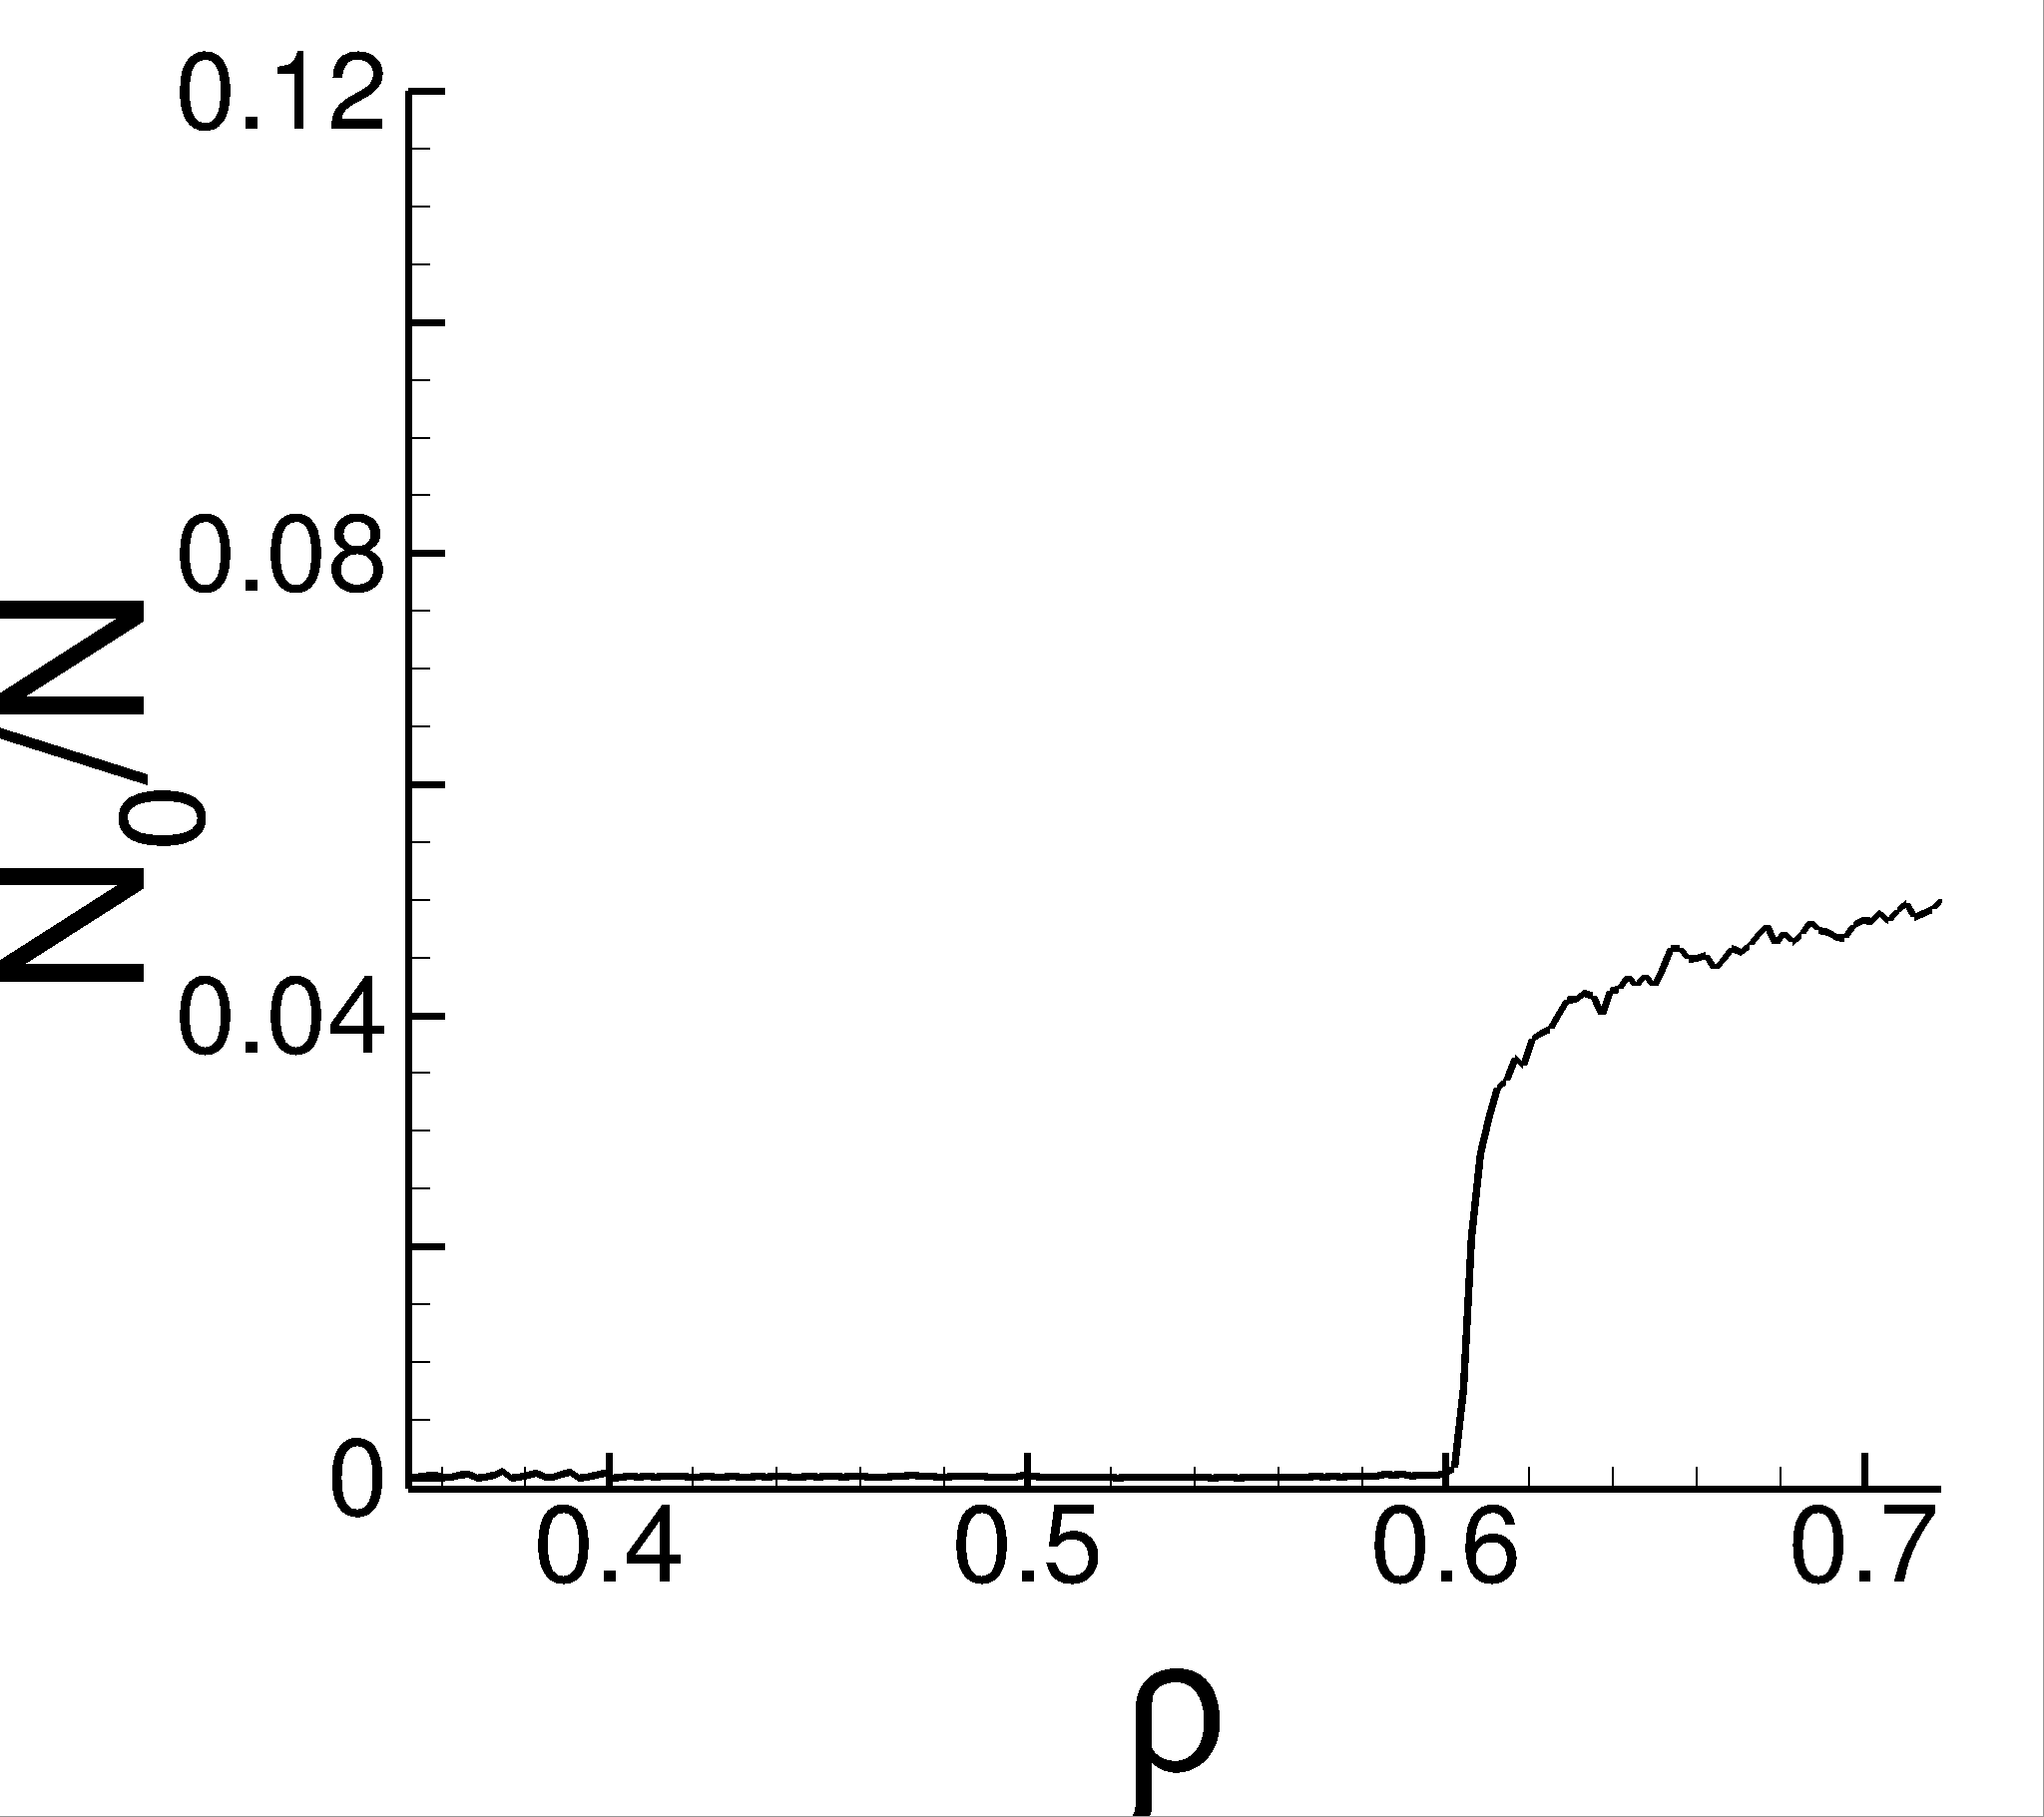
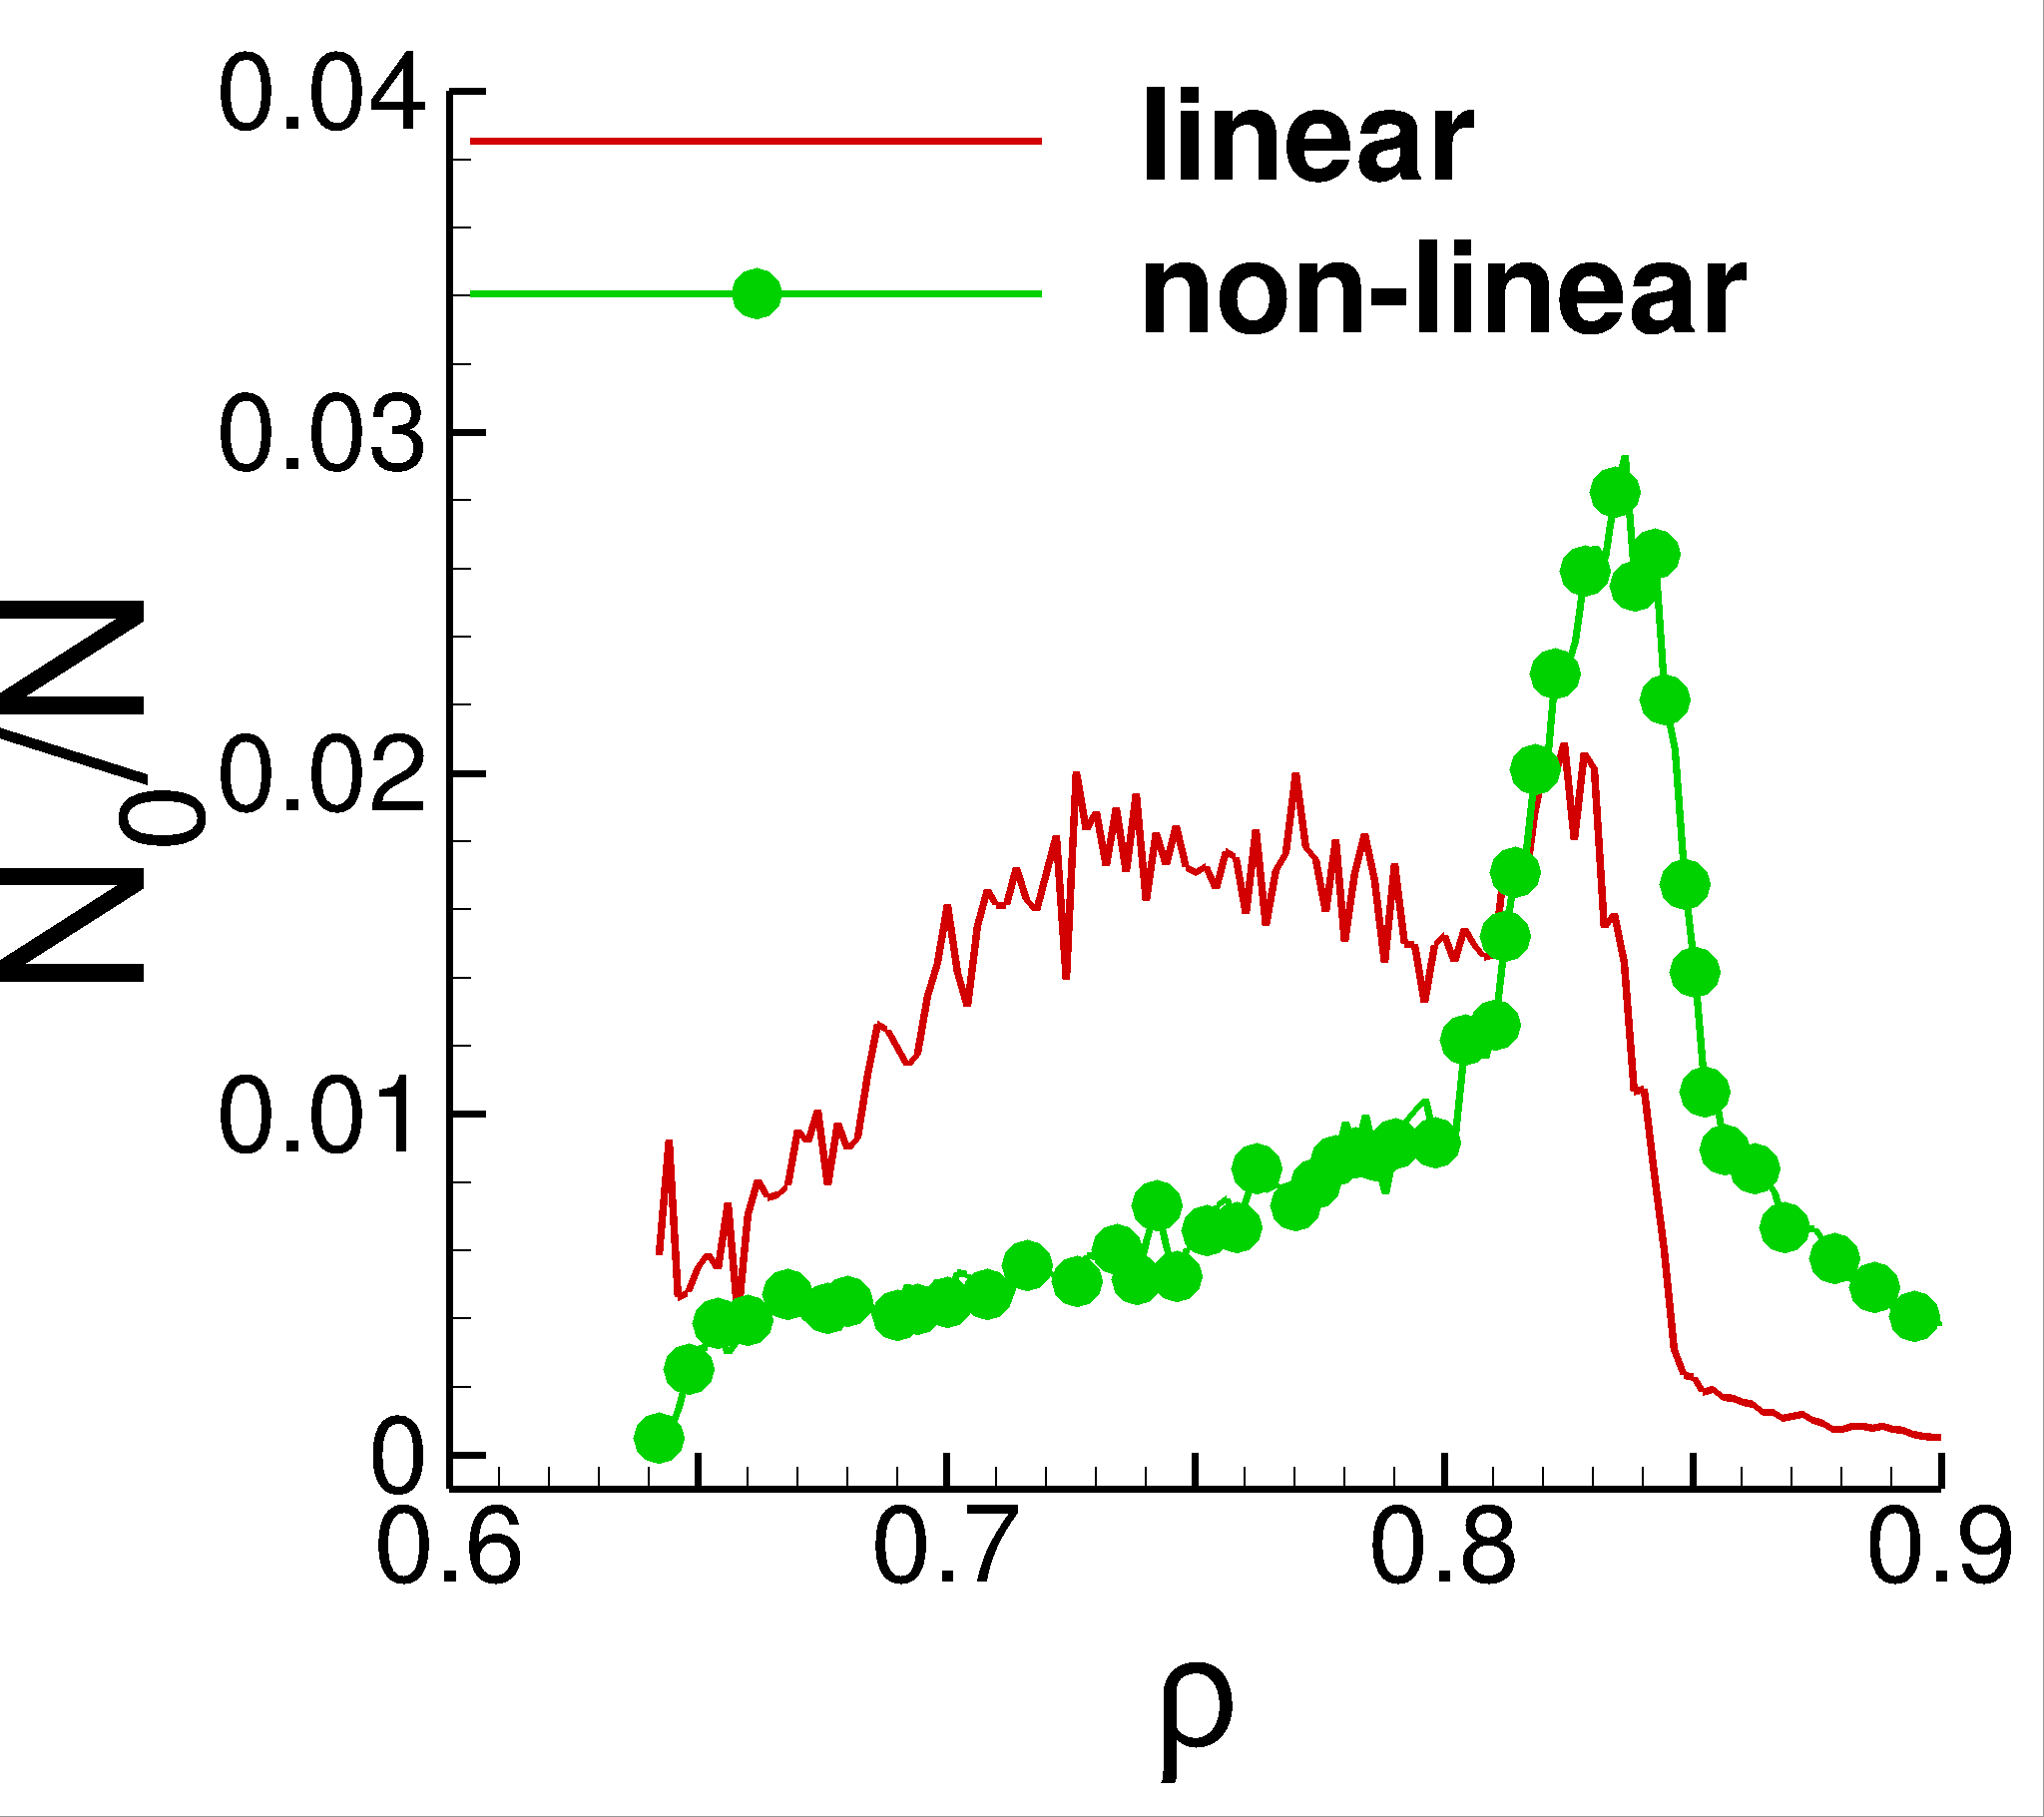
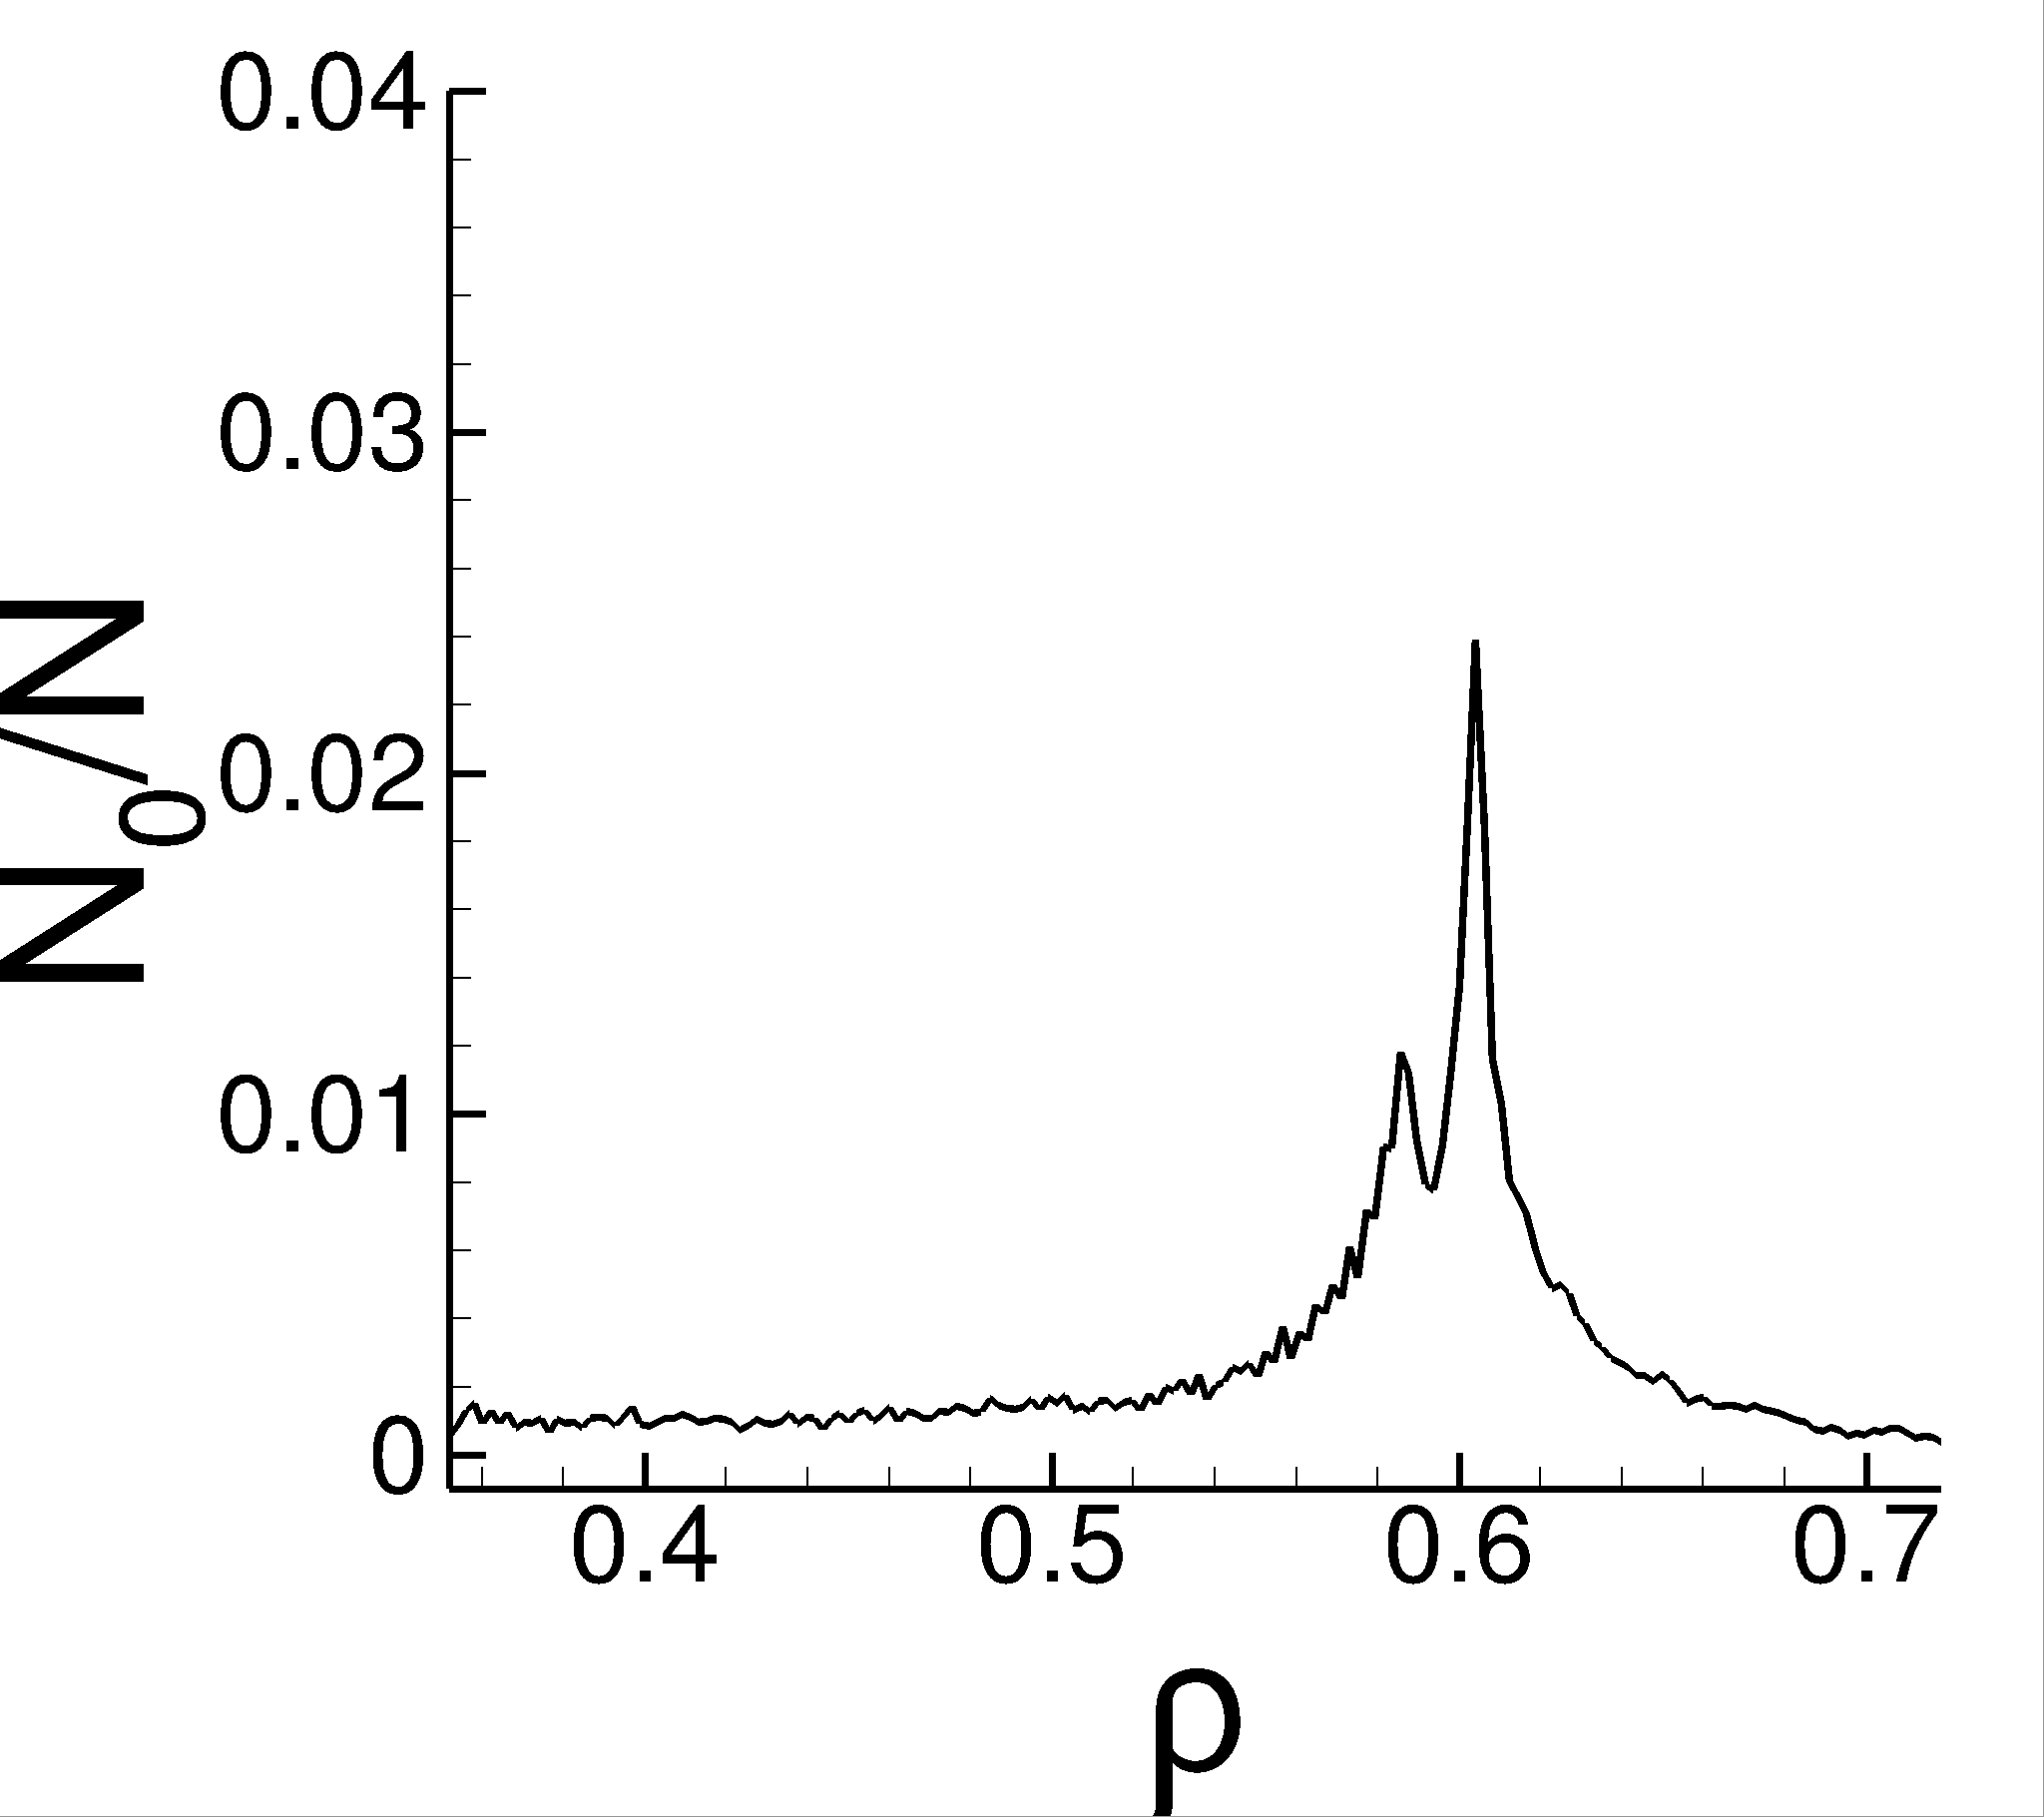
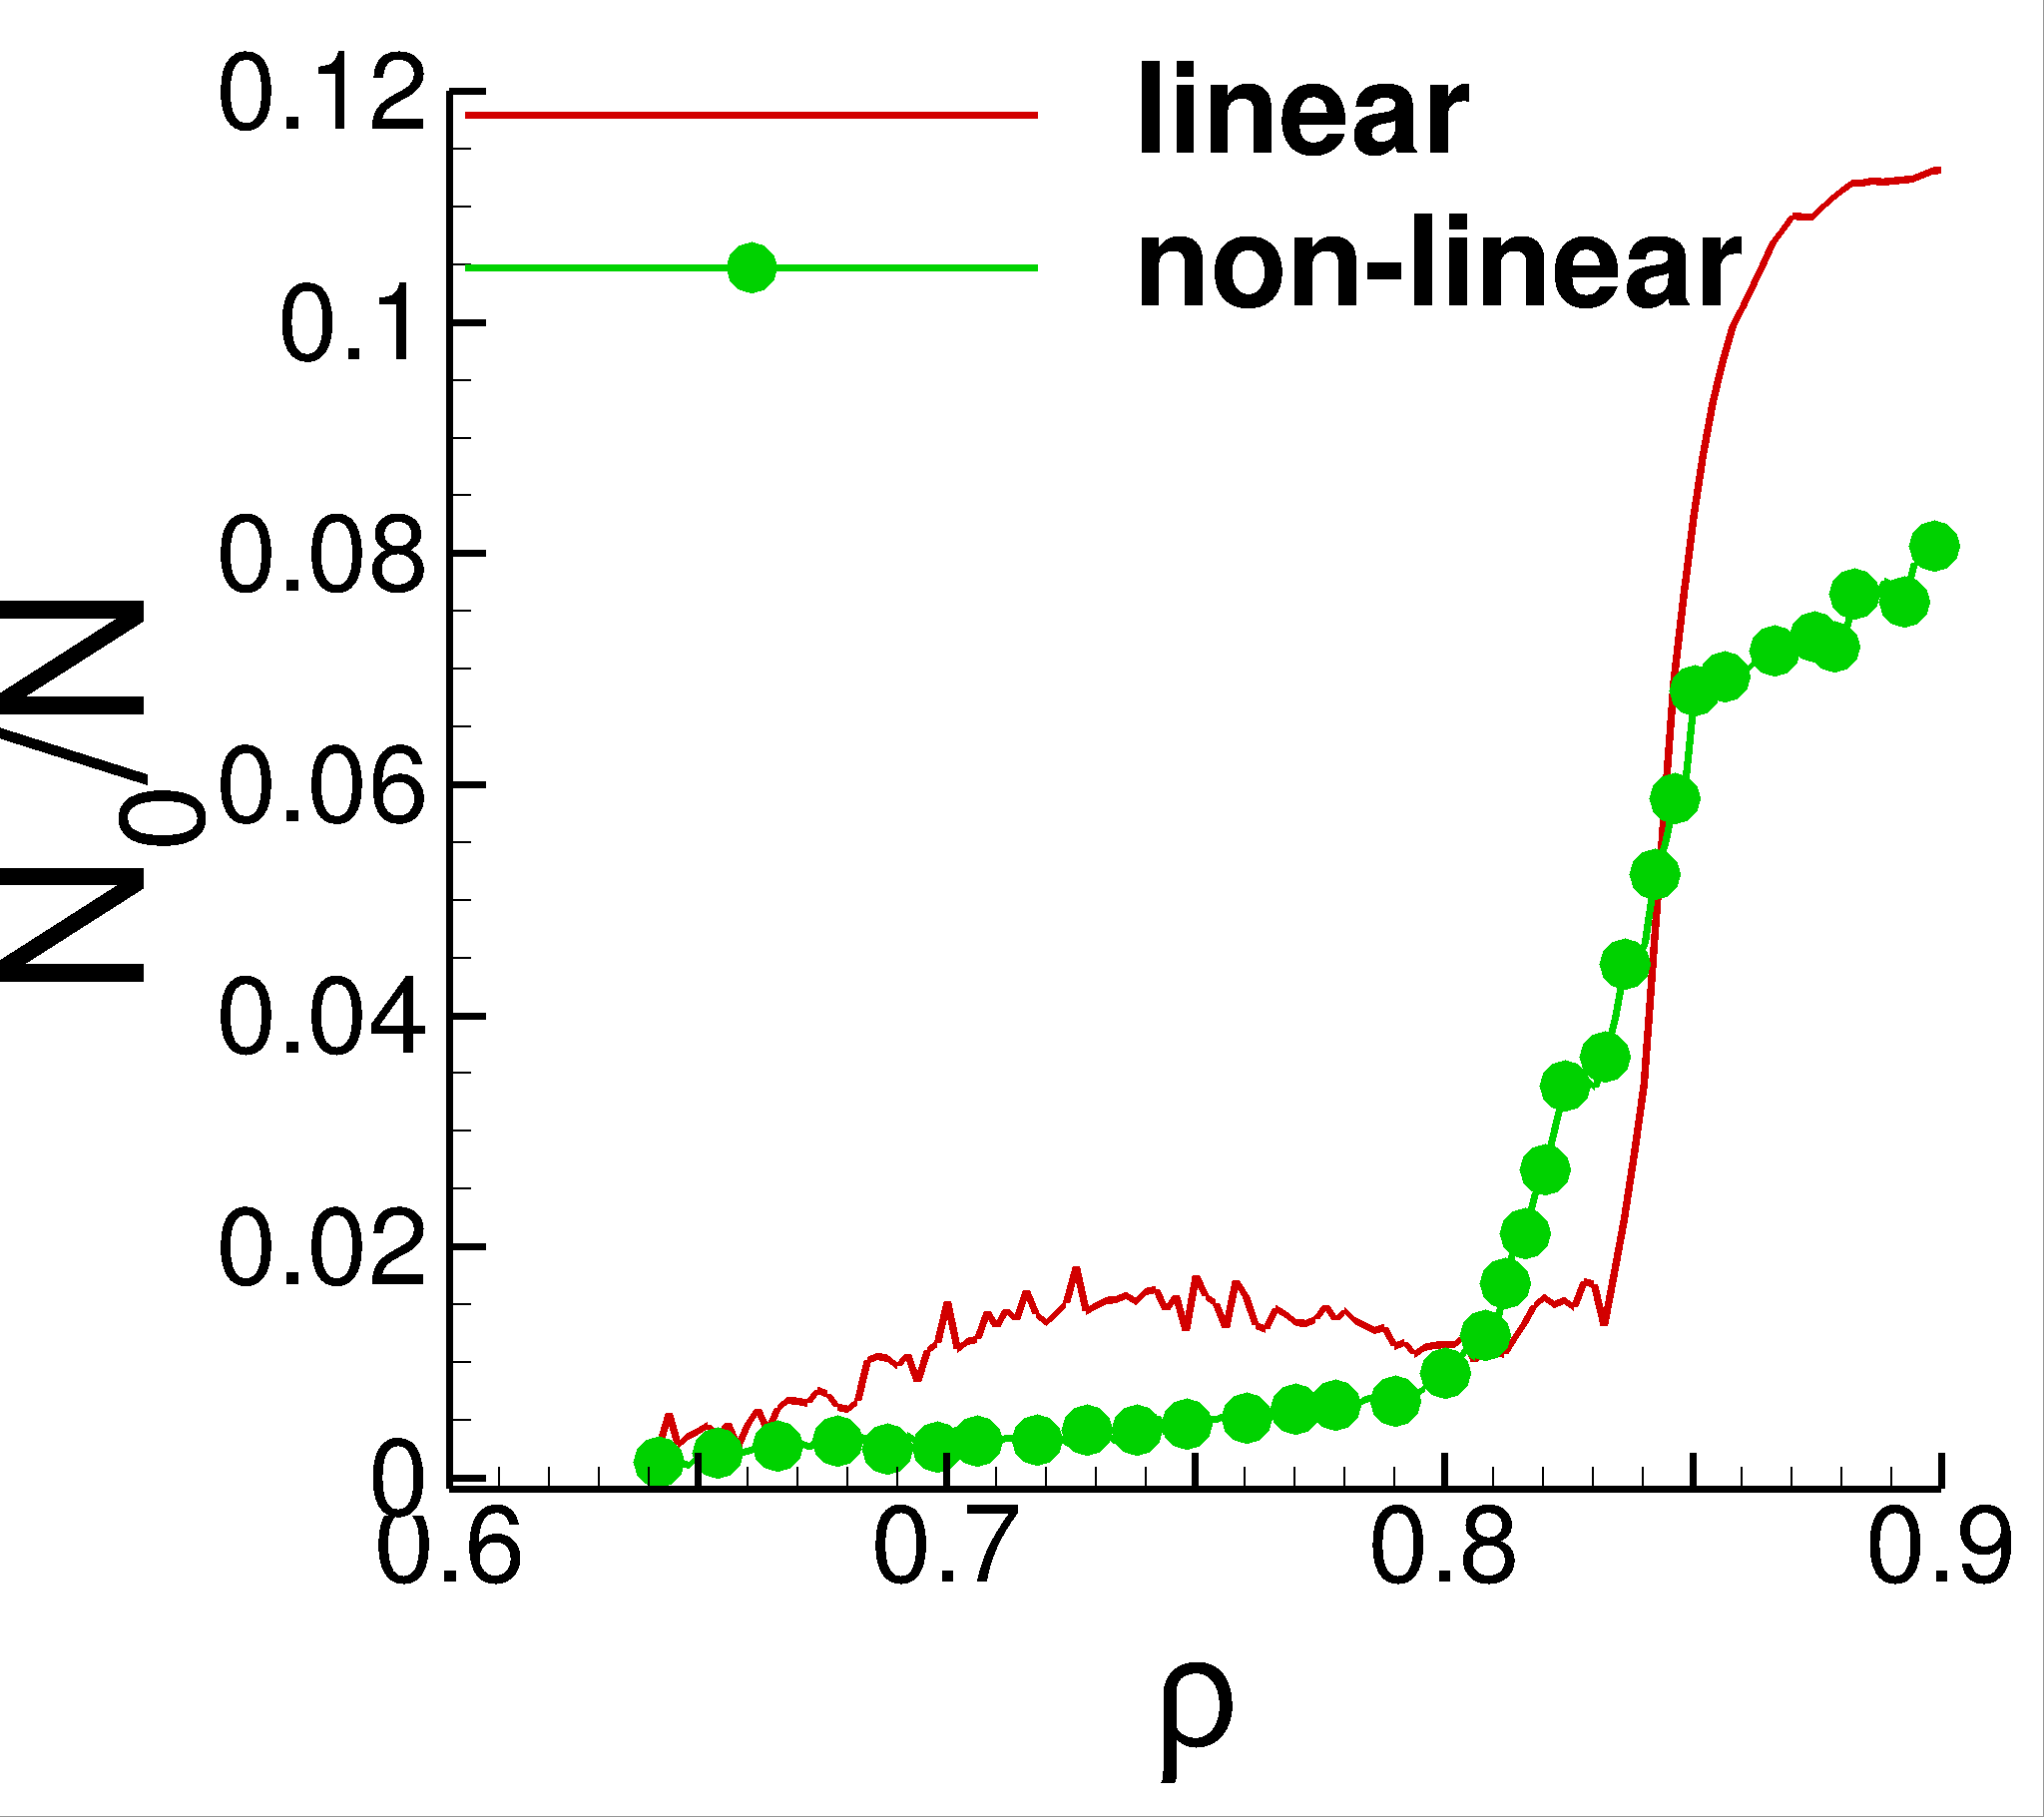
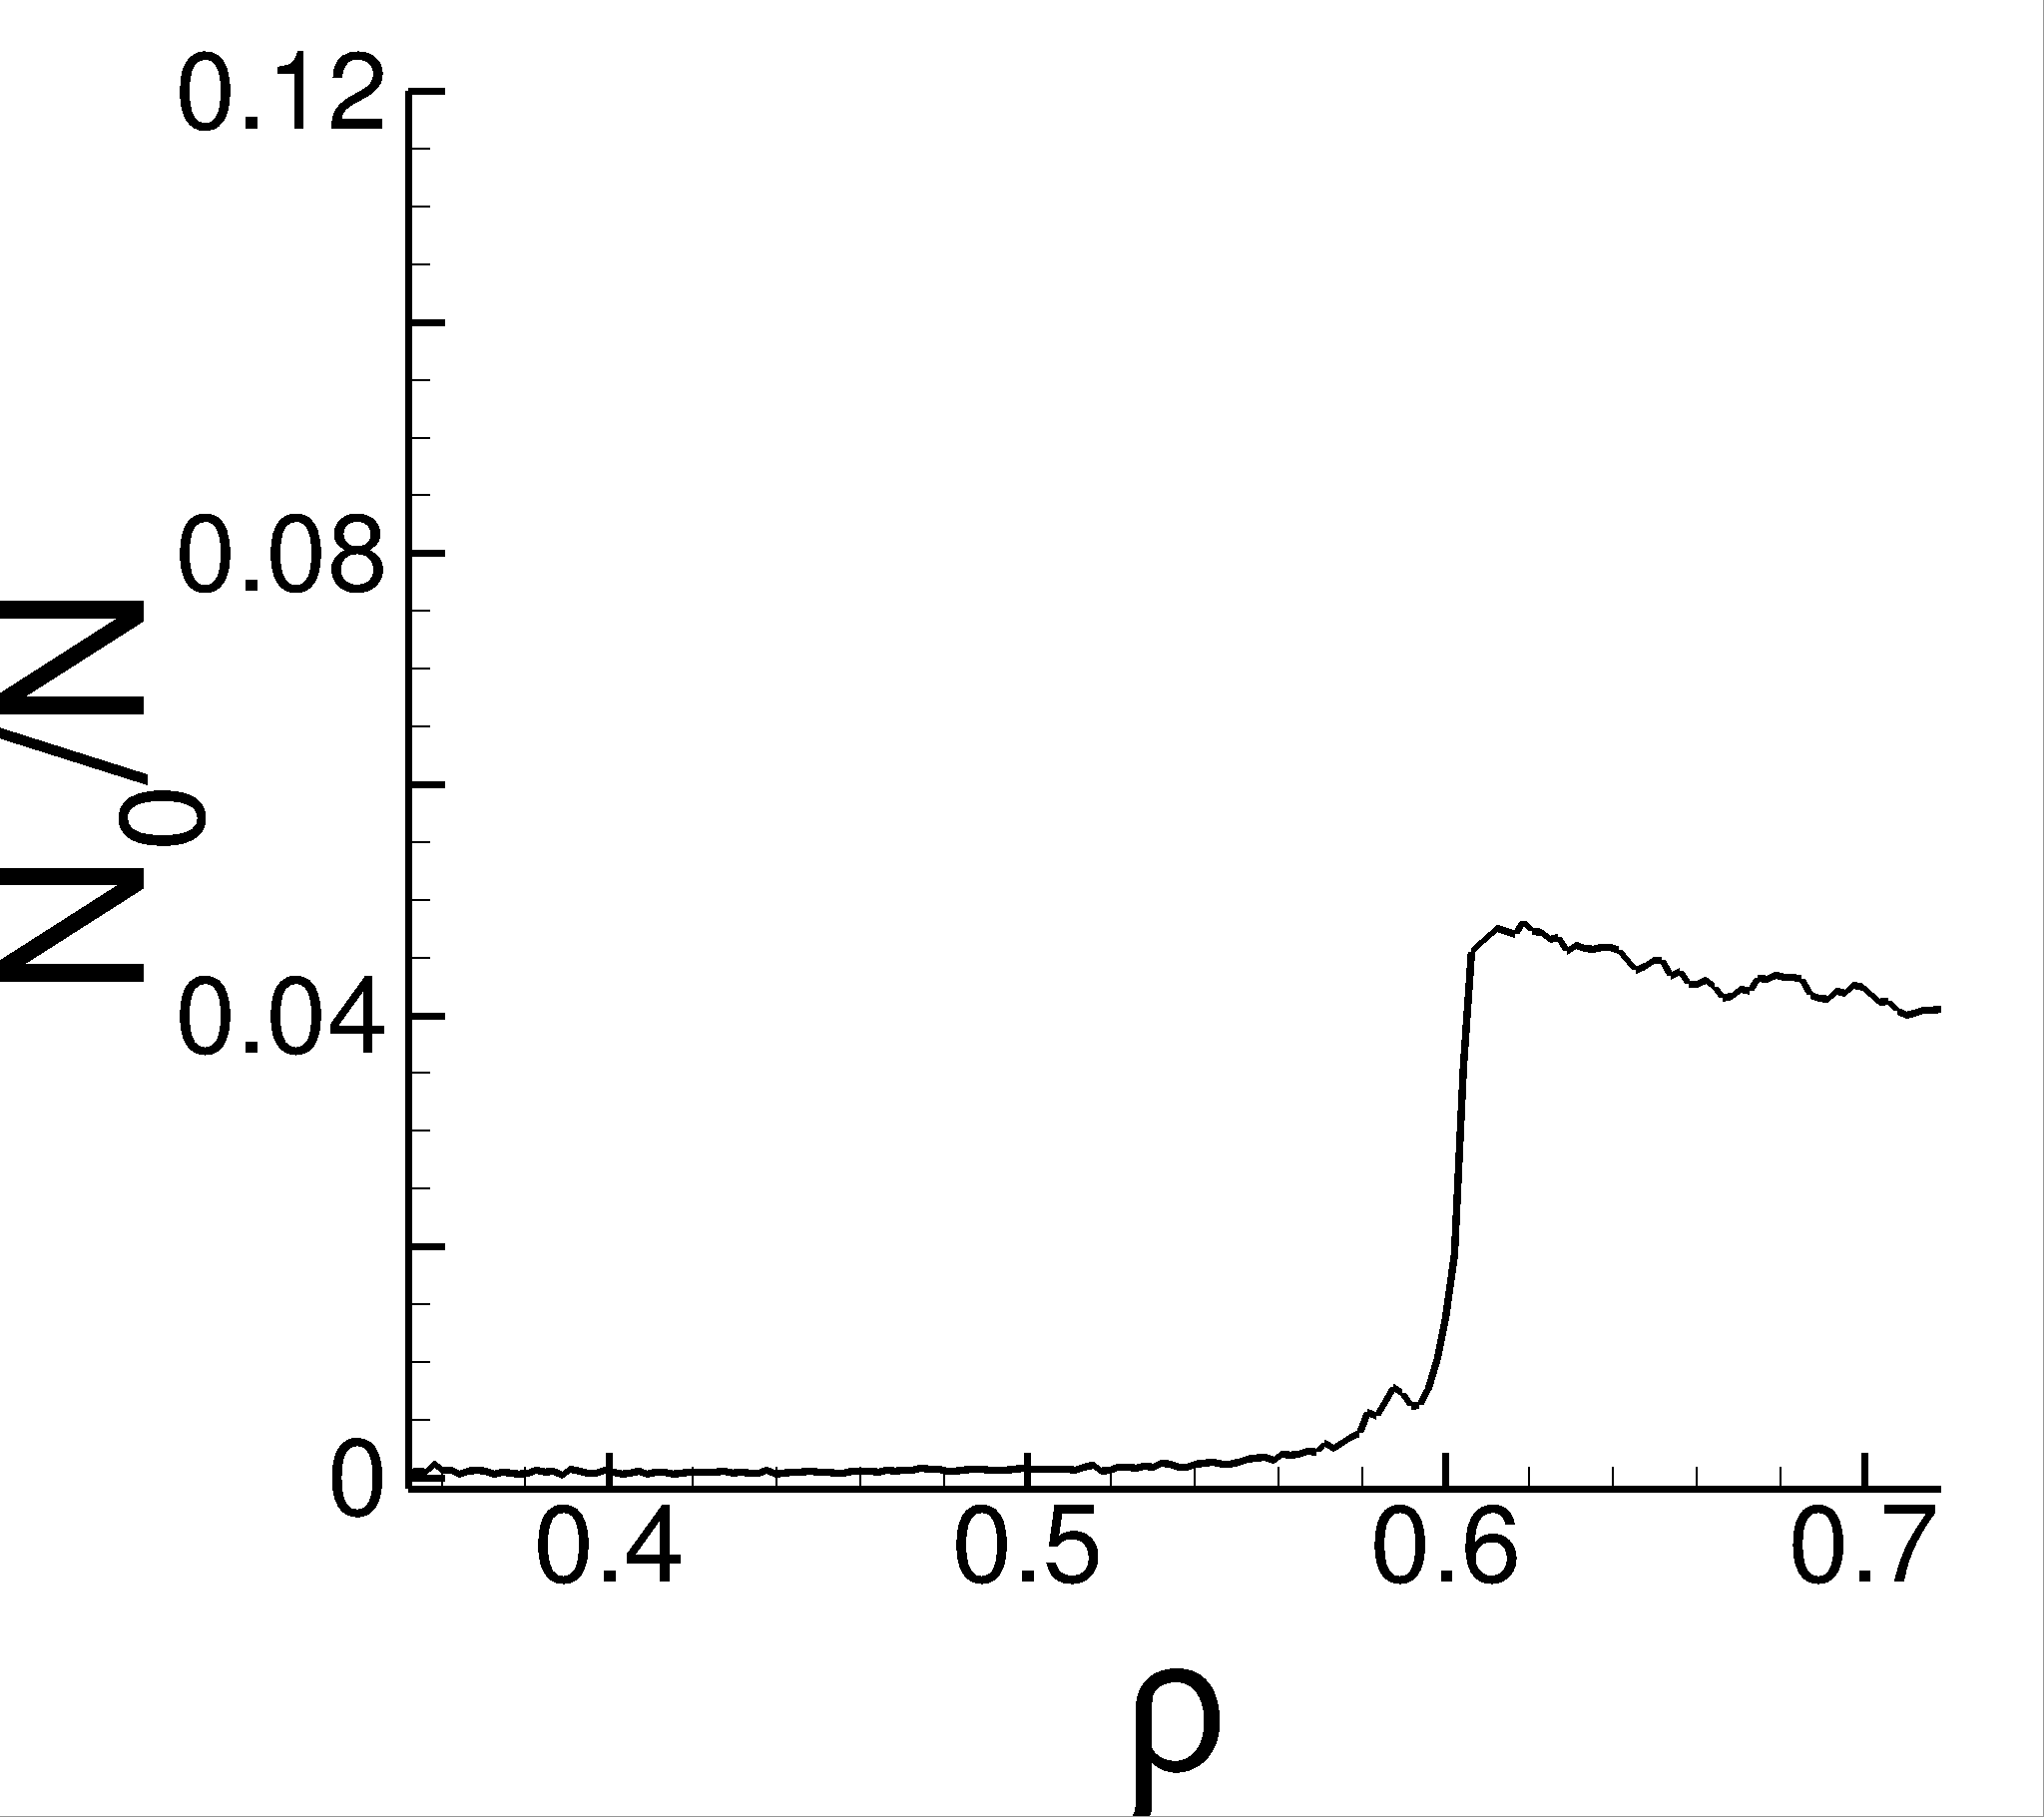
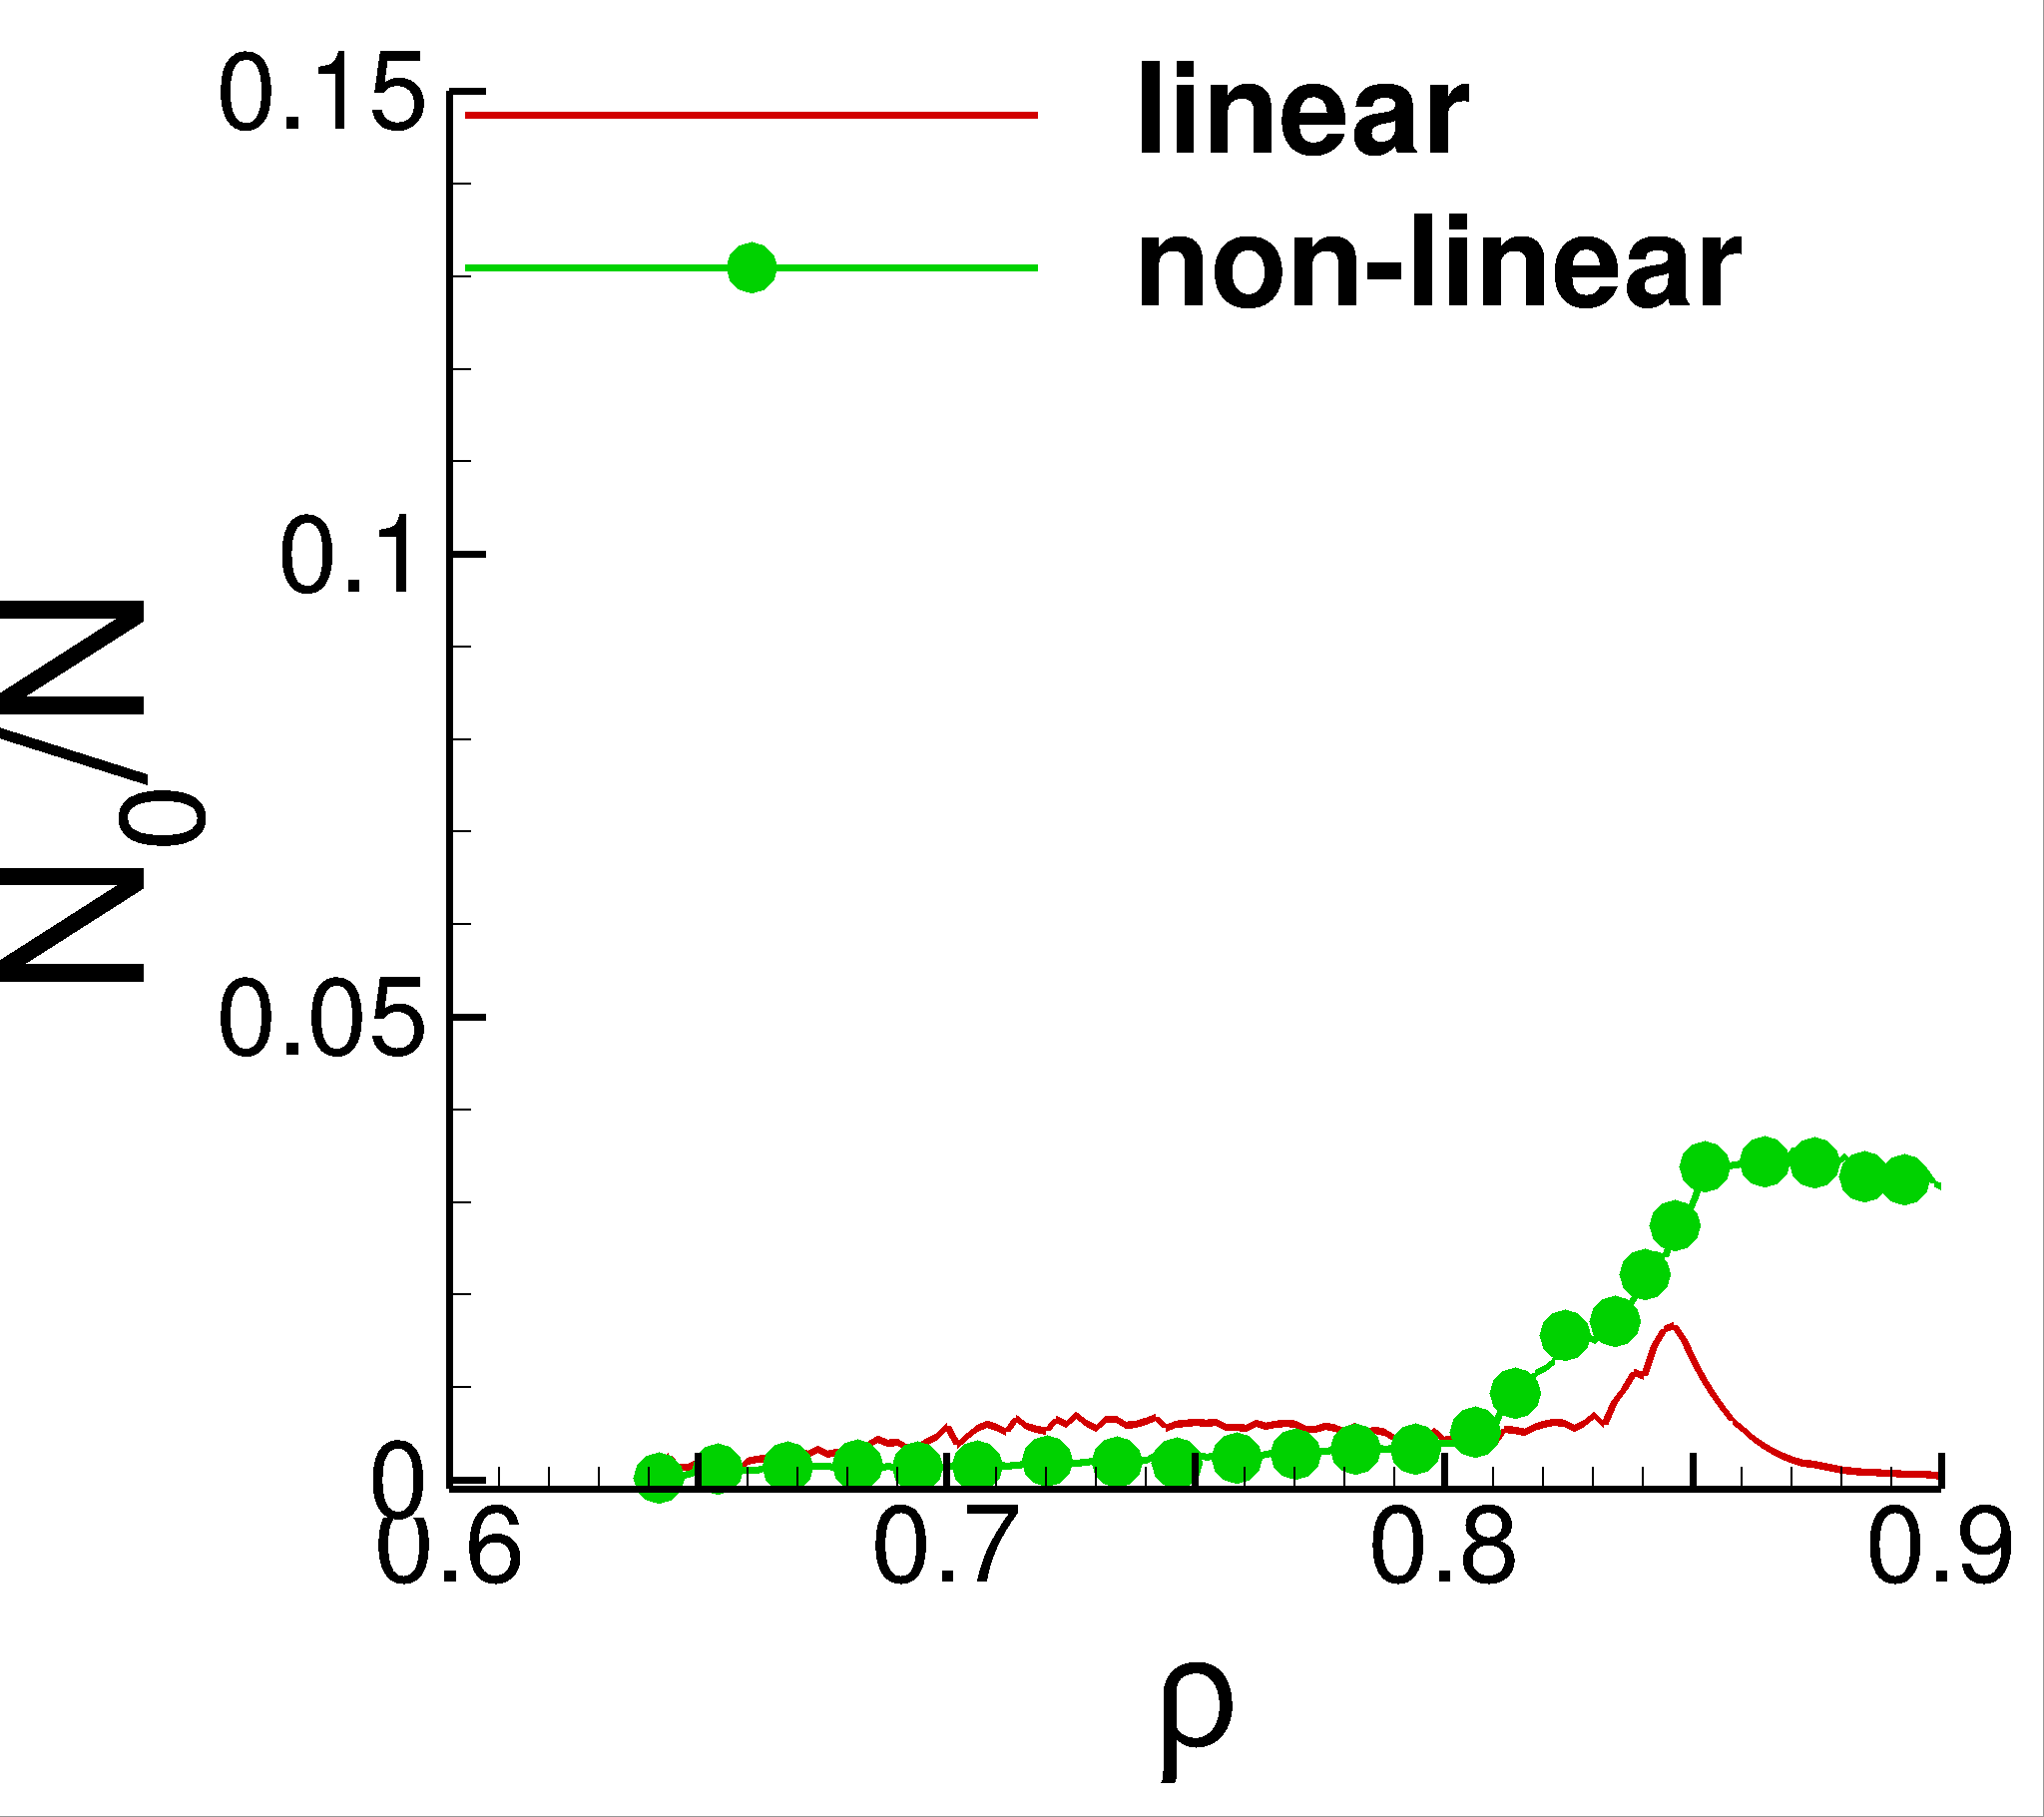
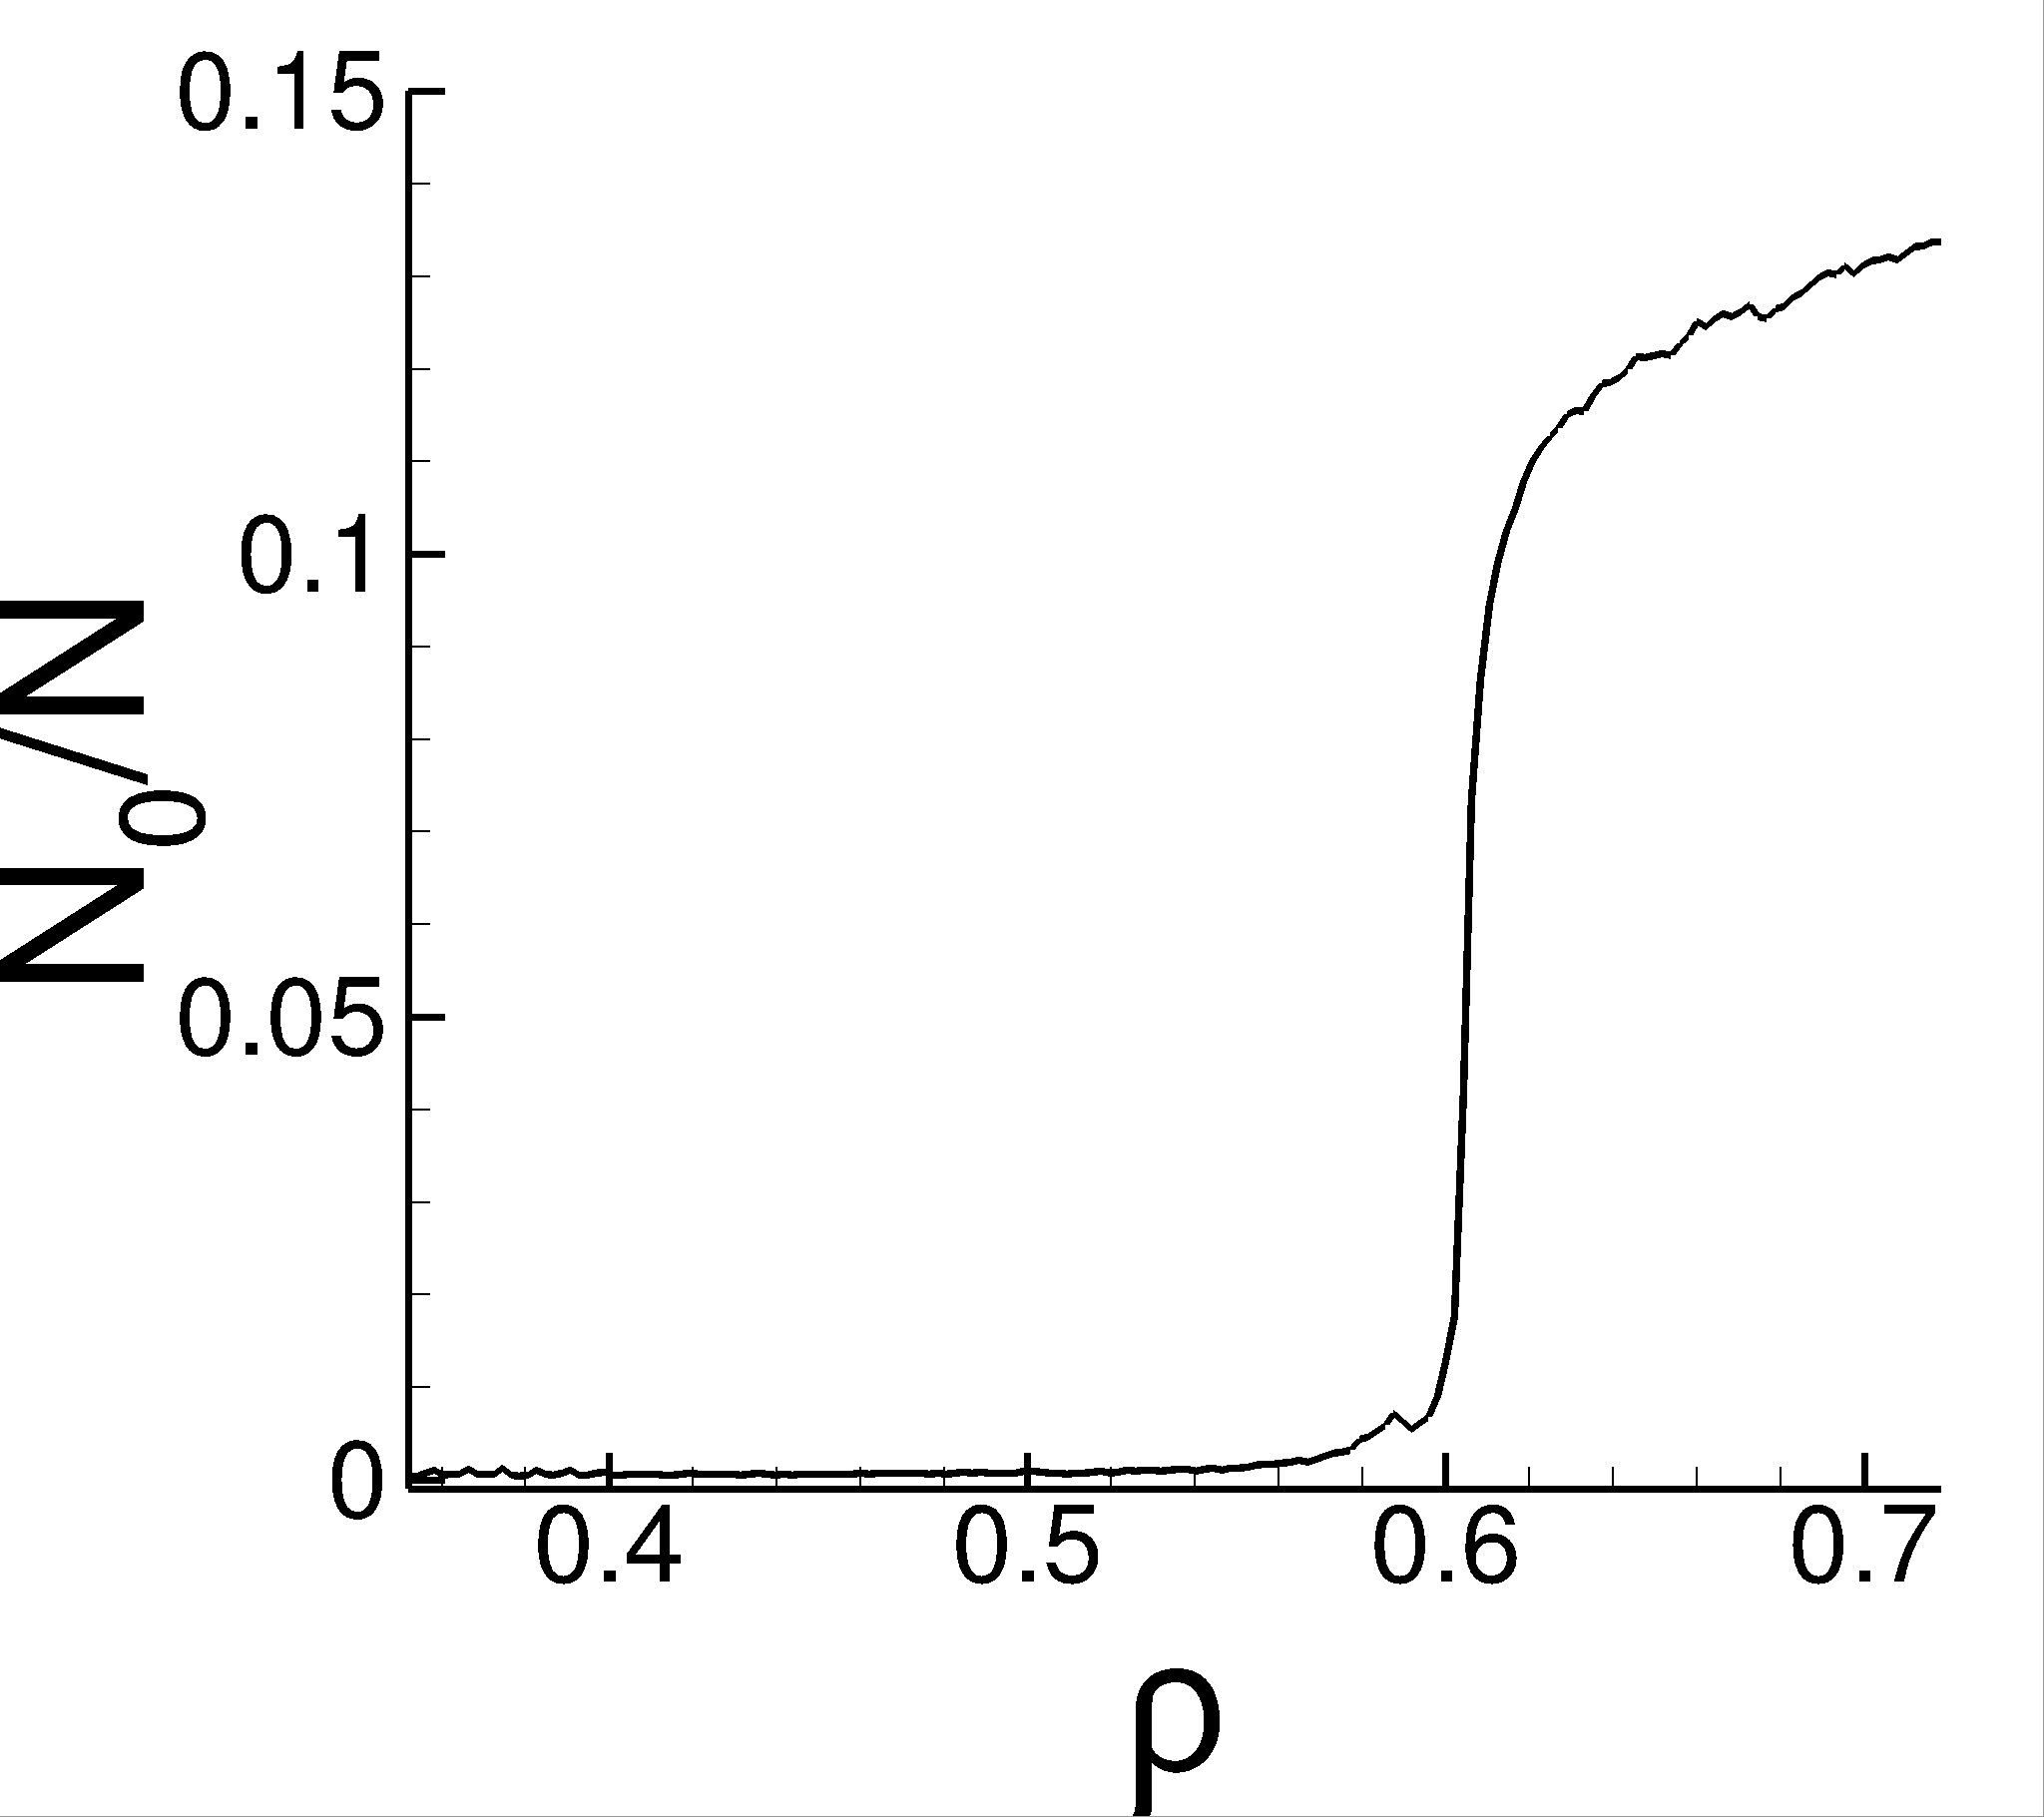
Figure 11 shows the average point count in all persistence bins for the D and D systems; denotes the average number of persistence points found in the specified category (recall that the results are averaged over realizations), and is the total number of particles.
To start the discussion of Fig. 11, we first comment on the results relevant to the bins for which the differences between considered systems are minor: rough and medium. Regarding the rough regime, Fig. 11(a) - (b), we observe that the roughness of the force network is very similar near jamming for all the systems. For the medium bin, see Fig. 11(e) - (f), we observe a sudden increase of the curves beyond jamming. For both rough and medium bins, we note a smaller number of points for the considered non-linear systems; we comment about this result in the case of medium bins further below.
The largest differences between the systems based on different force models can be observed for strong, Fig. 11(g) - (h) and weak, Fig. 11(c) - (d) bins. Considering first the strong bin, we note that the D system based on the linear force model develops a peak of during jamming, while for the non-linear systems such a peak is lacking, since these systems show large values of beyond jamming as well. Such a peak during jamming can be explained by strong collisions of the particles that form relevant clusters. For the system based on the linear force model, for , the majority of the clusters remain in the medium bin, see Fig. 11(e) (note that a similar behavior was observed for the D systems in continuously compressed systems pre13 ). However, for non-linear force model, the clusters formed by strong collisions remain in the strong bin as increases. Clearly, the softness of the non-linear interaction potential plays an important role and influences strongly the properties of the interaction networks as a system is compressed beyond jamming. One consequence of this difference between linear and non-linear systems is larger spread of forces for the non-linear systems for . Consistently, as already observed in Fig. 3, for , the PDF’s of the non-linear systems are wider compared to the linear case.
In contrast, Fig. 11(c) - (d) shows a pronounced peak in the weak force bin around jamming for the systems based on the non-linear interaction model, but not for the linear one. Recalling formation of the ridge in (viz. Fig. 6) for similar packing fractions, we conjecture that the ridge is formed by weak interaction that dominate the interaction network for .
Another measure based on the persistence diagrams is total persistence pre13 of a PD, defined as
where the sum ranges over all pairs corresponding to the points in the and persistence diagrams. For simplicity of notation, we refer to the total persistence for the clusters by TP0, and for the loops by TP1. The physical interpretation of these quantities could be best described by a landscape analogy: if we think of an interaction network as a landscape, then large TP0 implies a landscape containing a large number of prominent peaks and valleys, and large TP1 suggests well developed connectivity between the peaks (leading to loops). Note that the concept of force threshold is not relevant anymore here, since total persistence includes the information about all force thresholds at once.
Next, we discuss briefly TP0 and TP1 for the considered systems. A detailed discussion regarding TP2 is omitted since this measure is defined only in D. It suffices to mention that TP for and increases monotonously for .
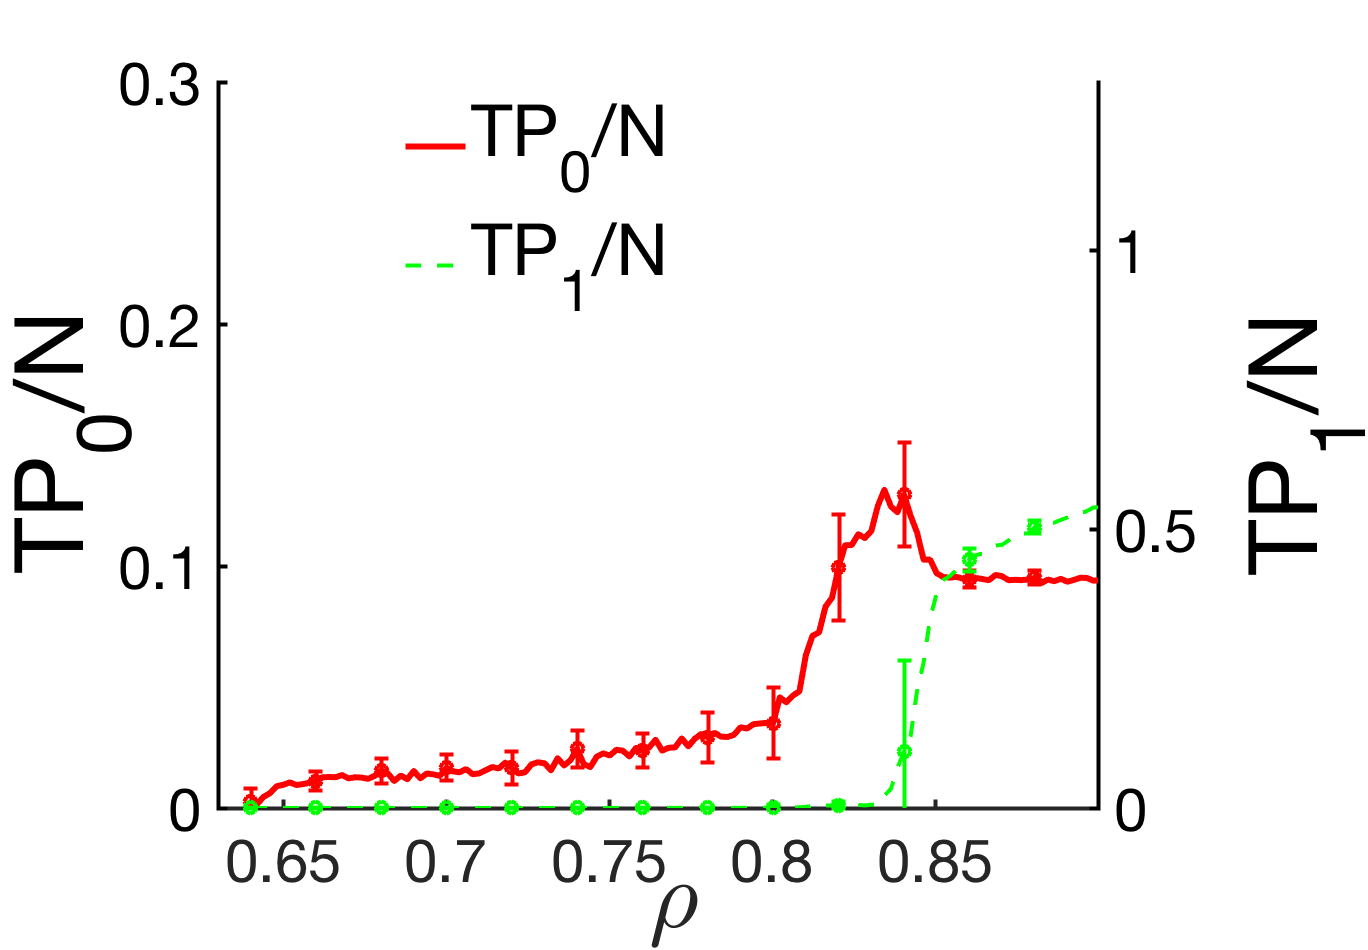
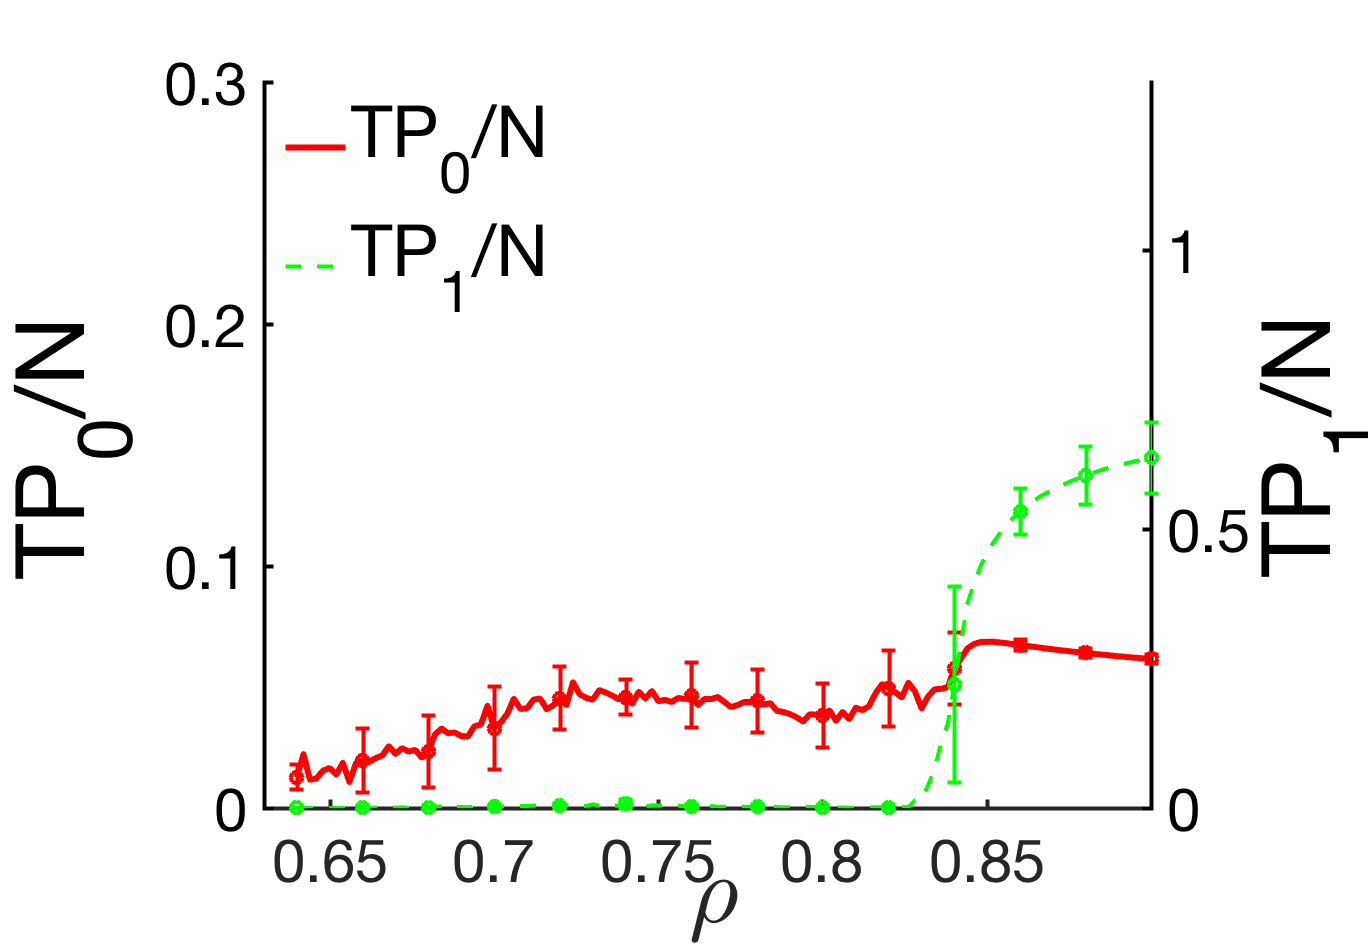
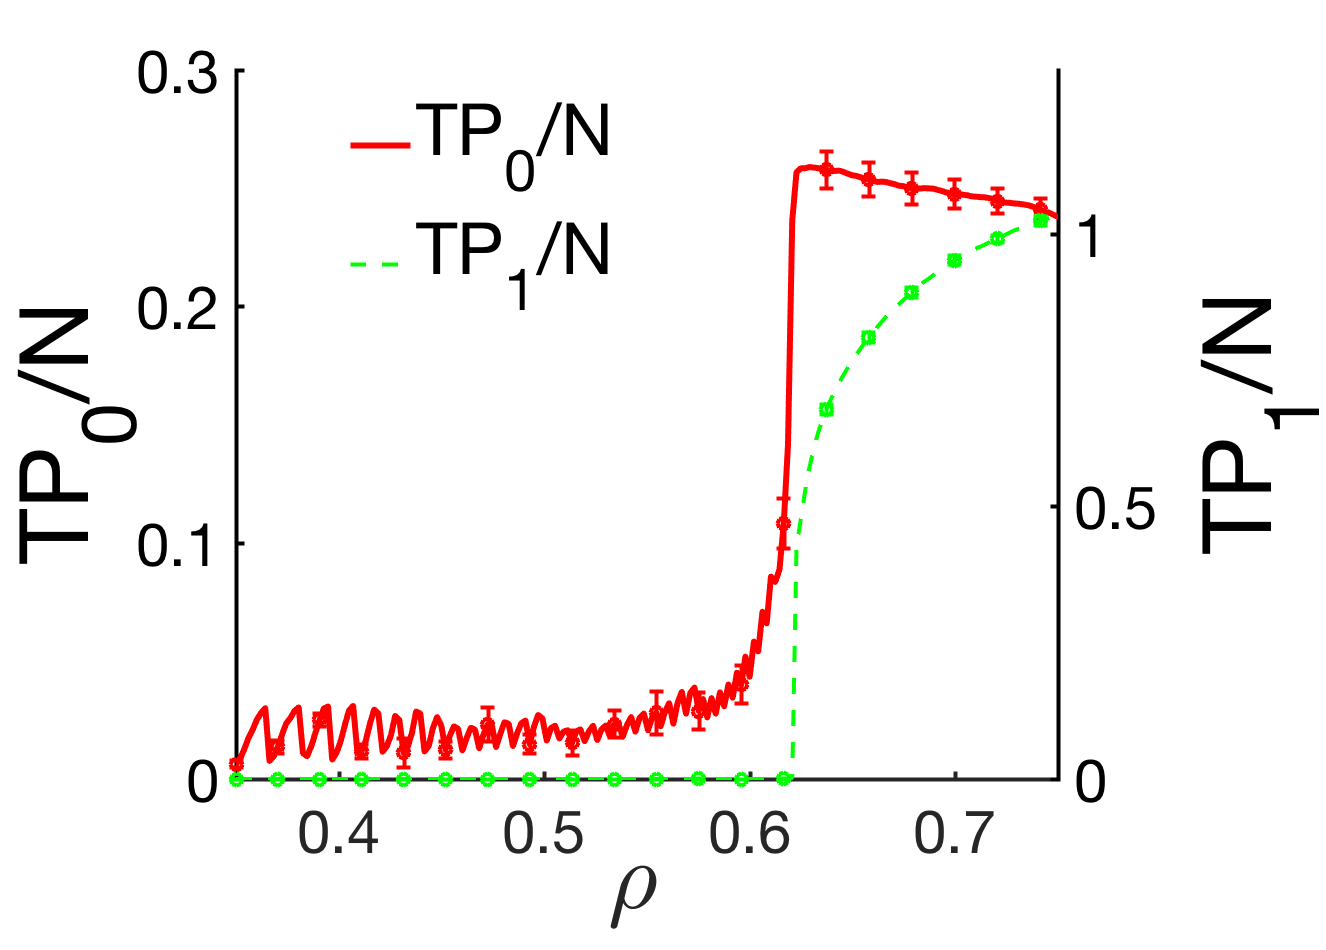
Figure 12 shows TP0 and TP1 for the considered D and D systems. The most obvious finding that is relevant to both TP0 and TP1 is a significantly more prominent increase of these measures close to for the D system, compared to the D ones. This result suggests that additional physical dimension leads to an increasingly complex force landscape that includes a larger number of prominent peaks and valleys. To understand this landscape more precisely, one needs to consider in more detail the relevant persistence diagrams. Such more in-depth analysis is left for future work.
To reiterate the findings discussed in this section, we find that both the number of physical dimensions and the force model play a role in determining the topology of interaction networks. The number of physical dimensions influences the behavior of the percolating cluster in the interaction network, and the results show that the force model is important when we consider small forces in our computations of interaction network properties. We also find that the properties of the interaction networks during jamming transition can be quantified by persistence diagrams and derived quantities, such as total persistence.
VI Conclusions
In this work, we analyze the properties of interaction networks with a focus on the influence of the number of physical dimensions and of the force model (linear vs. non-linear) describing particle interactions. The comparison of the force distribution reveals differences between the considered systems for a large range of packing fractions, . Specifically, the force distributions are found to be very different between D and D systems in the case of small ’s, despite consistent preparation and relaxation protocols. Beyond jamming, we find that the distribution of forces is wider for the non-linear systems regardless of the number of physical dimensions. This being said, we emphasize that our results were obtained mainly for one system size; while the general features of the results were found to hold as the system size was varied, no systematic analysis of the influence of system size on our results has been carried out.
The analysis of the percolating cluster and its size as the force threshold, , is varied for shows that a percolating cluster is composed of a significant number of particles in D (often at least the half of the total number of particles) at any time percolation occurs. On the other hand, in D, we find percolating clusters composed of a very small number of particles for the granular system close to jamming or when is large, typically for . For small force thresholds, we offer an explanation of this finding based solely on the number of physical dimensions.
Our force distribution and percolation analysis results suggest important structural and topological differences between the D and D systems, as well as between the systems that are based on different force models. This motivates the analysis of the average cluster size, , shape, , and the first two Betti numbers, and .
The average cluster size, , in an interaction network (not including the percolating cluster) shows a peak formation for small close to jamming transition. Such a peak occurs only for the granular systems based on non-linear interactions. The differences between D and D systems arise beyond jamming; for D there are larger clusters characterized by a larger interaction force (when normalized by the average force) compared to D.
One of the prominent results of this study is the formation of a pronounced ridge in the number of clusters at for the non-linear force models. The formation and the properties of this ridge, that becomes visible when considering weak interaction network, have been carefully analyzed using topological measures. Our conjecture is that the softness of non-linear interaction model plays a significant role in determining the properties of the interaction networks as the systems go through jamming. The consequence is that close to jamming, one could expect significantly different behavior of the systems involving particles interacting by different interaction laws. It should be pointed out that most of our conclusions were obtained by considering systems of a given size. While the main features of the results were found to be robust as the system size is moderately varied, detailed analysis of the influence of system size on the results remains to be carried out.
In conclusion, based on a well-defined set of measures, in this work we provide a precise and objective comparison of the interaction networks in finite size compressed granular systems. The main finding is that both the nature of the interactions between the constitutive particles, and the number of physical dimensions, play a significant role in determining the interaction networks’ properties. In contrast, the interaction networks are found to be only weakly influenced by friction between the particles. It remains to be seen to which degree these findings extend to more complex systems exposed to shear or other types of external influences.
Acknowledgements.
The initial stages of this work were carried out as a part of undergraduate Capstone class at NJIT capstone , and we thank to all the participating students for their help and contributions towards understanding of interaction networks in granular systems. This research was supported in part by the NSF Grant No. DMS-1521717, DARPA contract No. HR0011-16-2-0033, and ARO Grant No. W911NF1810184.References
- (1) R. Arévalo, I. Zuriguel, and D. Maza. Topological properties of the contact network of granular materials. Int. J. Bif. Chaos, 19(02):695–702, 2009.
- (2) R. Arévalo, I. Zuriguel, and D. Maza. Topology of the force network in jamming transition of an isotropically compressed granular packing. Phys. Rev. E, 81:041302, 2010.
- (3) Roberto Arévalo, Luis A. Pugnaloni, Iker Zuriguel, and Diego Maza. Contact network topology in tapped granular media. Phys. Rev. E, 87:022203, Feb 2013.
- (4) E. Azéma and F. Radjaï. Force chains and contact network topology in sheared packings of elongated particles. Phys. Rev. E, 85:031303, 2012.
- (5) S. Ardanza-Trevijano, Iker Zuriguel, Roberto Arévalo, and Diego Maza. Topological analysis of tapped granular media using persistent homology. Phys. Rev. E, 89:052212, May 2014.
- (6) L. Kondic, A. Goullet, C.S. O’Hern, M. Kramar, K. Mischaikow, and R.P. Behringer. Topology of force networks in compressed granular media. Europhys. Lett., 97:54001, 2012.
- (7) M. Kramár, A. Goullet, L. Kondic, and K. Mischaikow. Persistence properties of compressed granular matter. Phys. Rev. E, 87:042207, 2013.
- (8) M. Kramár, A. Goullet, L. Kondic, and K. Mischaikow. Quantifying force networks in particulate systems. Physca D., 283:37 – 55, 2014.
- (9) M. Kramár, A. Goullet, L. Kondic, and K. Mischaikow. Evolution of force networks in dense particulate media. Phys. Rev. E, 90:052203, 2014.
- (10) L.A. Pugnaloni, C.M. Carlevaro, M. Kramár, K. Mischaikow, and L. Kondic. Structure of force networks in tapped particulate systems of disks and pentagons. i. clusters and loops. Phys. Rev. E, 93:062902, 2016.
- (11) L. Kondic, M. Kramár, Luis A. Pugnaloni, C. Manuel Carlevaro, and K. Mischaikow. Structure of force networks in tapped particulate systems of disks and pentagons. ii. persistence analysis. Phys. Rev. E, 93:062903, Jun 2016.
- (12) L. Kondic, M. Kramar, L. Kovalcinova, and K. Mischaikow. Evolution of force networks in dense granular matter close to jamming. EPJ Web of Conferences, 140:15014, 2017.
- (13) J. A. Dijksman, L. Kovalcinova, J. Ren, R. P. Behringer, M. Kramár, K. Mischaikow, and L. Kondic. Characterizing granular networks using topological metrics. Phys. Rev. E, 97:042903, 2018.
- (14) T. Takahashi, Abram H. Clark, T. Majmudar, and L. Kondic. Granular response to impact: Topology of the force networks. Phys. Rev. E, 97:012906, 2018.
- (15) J. Zhang, T. S. Majmudar, A. Tordesillas, and R. P. Behringer. Statistical properties of a 2d granular material subjected to cyclic shear. Granul. Matter, 12:159–172, Apr 2010.
- (16) A. Tordesillas, D. M. Walker, and Q. Lin. Force cycles and force chains. Phys. Rev. E, 81:011302, 2010.
- (17) D.M. Walker and A. Tordesillas. Taxonomy of granular rheology from grain property networks. Phys. Rev. E, 85:011304, 2012.
- (18) J.P. Peters, M. Muthuswamy, J. Wibowo, and A. Tordesillas. Characterization of force chains in granular material. Phys. Rev. E, 72:041307, 2005.
- (19) Danielle S. Bassett, Eli T. Owens, Karen E. Daniels, and Mason A. Porter. Influence of network topology on sound propagation in granular materials. Phys. Rev. E, 86:041306, 2012.
- (20) Brian P. Tighe, Jacco H. Snoeijer, Thijs J. H. Vlugt, and Martin van Hecke. The force network ensemble for granular packings. Soft Matter, 6:2908–2917, 2010.
- (21) B. P. Tighe and J.H.T. Vlugt. Stress fluctuations in granular foce networks. J. Stat. Mech., 11:04002, 2011.
- (22) Sumantra Sarkar, Dapeng Bi, Jie Zhang, R. P. Behringer, and Bulbul Chakraborty. Origin of rigidity in dry granular solids. Phys. Rev. Lett., 111:068301, Aug 2013.
- (23) F. Radjai, M. Jean, J. J. Moreau, and S. Roux. Force distribution in dense two-dimensional granular systems. Phys. Rev. Lett., 77:274–277, 1996.
- (24) F. Radjai, D. E. Wolf, S. Roux, M. Jean, and J. J. Moreau. Force networks in dense granular media. In R. P. Behringer and J. T. Jenkins, editors, Powders & Grains 97, pages 211–214. Balkema, Rotterdam, 1997.
- (25) F. Radjai, J. J. Moreau, and S. Roux. Contact forces in a granular packing. Chaos, 9:544–550, 1999.
- (26) S. Ostojic, E. Somfai, and B. Nienhuis. Scale invariance and universality of force networks in static granular matter. Nature, 439:828–830, 2006.
- (27) L. Kovalcinova, A. Goullet, and L. Kondic. Scaling properties of force networks for compressed particulate systems. Phys. Rev. E, 93:042903, 2016.
- (28) S. Ostojic, T.J.H. Vlugt, and B. Nienhuis. Universal anisotropy in force networks under shear. Phys. Rev. E, 75(3):030301, 2007.
- (29) D. Stauffer and A. Aharonov. Introduction to Percolation Theory. Taylor & Francis, 2003.
- (30) L. Kovalcinova, A. Goullet, and L. Kondic. Percolation and jamming transitions in particulate systems with and without cohesion. Phys. Rev. E, 92:032204, 2015.
- (31) C.S. O’Hern, S.A. Langer, A.J. Liu, and S.R. Nagel. Force distributions near jamming and glass transitions. Phys. Rev. Lett., 86:111–114, 2001.
- (32) C. S. O’Hern, L. E. Silbert, A. J. Liu, and S. A. Langer. Jamming at zero temperature and zero applied stress: the epitome of disorder. Phys. Rev. E, 68:011306, 2003.
- (33) T. Shen, Corey S. O’Hern, and M. D. Shattuck. Contact percolation transition in athermal particulate systems. Phys. Rev. E, 85:011308–4, 2012.
- (34) R. Pastor-Satorras and M.-C. Miguel. Percolation analysis of force networks in anisotropic granular matter. J. Stat. Mech., 2012(2), 2012.
- (35) T. S. Majmudar and R. P. Behringer. Contact force measurements and stress-induced anisotropy in granular materials. Nature, 435:1079–1082, 2005.
- (36) Abram H. Clark, Lou Kondic, and Robert P. Behringer. Particle scale dynamics in granular impact. Phys. Rev. Lett., 109:238302, Dec 2012.
- (37) N. Brodu, J. Dijksman, and R.P. Behringer. Spanning the scales of granular materials through microscopic force imaging. Nat. Commun., 6:6361, 2015.
- (38) M. Saadatfar, A. P. Sheppard, T. J. Senden, and A. J. Kabla. Mapping forces in a 3d elastic assembly of grains. J. Mech. Phys. Solids, 60:55 – 66, 2012.
- (39) J. Brujić, S. F. Edwards, D. V. Grinev, I. Hopkinson, D. Brujić, and H. A. Makse. 3D bulk measurements of the force distribution in a compressed emulsion system. Faraday Discuss., 123:207–220, 2003.
- (40) R. C. Hurley, S. A. Hall, J. E. Andrade, and J. Wright. Quantifying interparticle forces and heterogeneity in 3d granular materials. Phys. Rev. Lett., 117:098005, Aug 2016.
- (41) Leonardo E. Silbert, Gary S. Grest, and James W. Landry. Statistics of the contact network in frictional and frictionless granular packings. Phys. Rev. E, 66:061303, 2002.
- (42) L. Papadopoulos, M. A Porter, K. E. Daniels, and D. S. Bassett. Network analysis of particles and grains. J Complex Networks, page 005, 2018.
- (43) Animation of the shear cycle.
- (44) F. Radjai, D. Wolf, S. Roux, M. Jean, and J. J. Moreau. Force networks in granular packings. In D. E. Wolf and P. Grassberger, editors, Friction, Arching and Contact Dynamics, Singapore, 1997. World Scientific.
- (45) V. Nanda. Perseus, 2012.
- (46) H. Adams, A. Tausz, and M. Vejdemo-Johansson. javaplex: A research software package for persistent (co)homology. In Hoon Hong and Chee Yap, editors, Mathematical Software – ICMS 2014, pages 129–136, Berlin, Heidelberg, 2014. Springer Berlin Heidelberg.
- (47) Ulrich Bauer, Michael Kerber, Jan Reininghaus, and Hubert Wagner. PHAT: Persistent homology algorithms toolbox. J. Symbolic Computation, 78:76 – 90, 2017.
- (48) GUDHI: Geometry understanding in higher dimensions. http://gudhi.gforge.inria.fr.
- (49) S. Ostojic, E. Somfai, and B. Nienhuis. Scale invariance and universality of force networks in static granular matter. Nature, 439(7078):828–830, Feb 16 2006.
- (50) L. Kondic. Dynamics of spherical particles on a surface: Collision-induced sliding and other effects. Phys. Rev. E, 60:751–770, 1999.
- (51) N. Brodu, J. A. Dijksman, and R. P. Behringer. Multiple-contact discrete-element model for simulating dense granular media. Phys. Rev. E, 91:032201, 2015.
- (52) Minor influence of different material properties of the particles could be due to particle - wall interaction, and, in the case of a nonlinear force model, due to weak dependence of the particle collision time on impact speed.
- (53) P. A. Cundall and O. D. L. Strack. A discrete numerical model for granular assemblies. Géotechnique, 29:47–65, 1979.
- (54) L. Brendel and S. Dippel. Lasting contacts in molecular dynamics simulations. In Physics of Dry Granular Media, page 313, Dordrecht, 1998. Kluwer Academic Publishers.
- (55) C. Goldenberg and I. Goldhirsch. Friction enhances elasticity in granular solids. Nature, 435:188, 2005.
- (56) S. Luding, E. Clément, A. Blumen, J. Rajchenbach, and J. Duran. Anomalous energy dissipation in molecular dynamics simulations of grains: The “detachment effect”. Phys. Rev. E, 50:4113, 1994.
- (57) K. Zhang, M. Wang, S. Papanikolaou, Y. Liu, J. Schroers, M. D. Shattuck, and C. S. O’Hern. Computational studies of the glass-forming ability of model bulk metallic glasses. J. Chem. Phys., 139(12):124503, 2013.
- (58) S. Miller and S. Luding. Cluster growth in two- and three-dimensional granular gases. Phys. Rev. E, 69(3 1):031305–1–031305–8, 2004.
- (59) T. Pöschel, N.V. Brilliantov, and T. Schwager. Transient clusters in granular gases. J. Phys. Condens. Matter, 17:S2705–S2713, 2005.
- (60) D. Bi, J. Zhang, B. Chakraborty, and R. P. Behringer. Jamming by shear. Nature, 480:355–358, 2011.
- (61) J. Zhang, T. S. Majmudar, M. Sperl, and R. P. Behringer. Jamming for a 2d granular material. Soft Matter, 6:2982–2991, 2010.
- (62) Vinutha H. A. and S. Luding. Disentagling the role of structure and friction in shear jamming. Nature Physics, 12:578 – 583, 2016.
- (63) S. Luding. So much for the jamming point. Nature Physics, 12:531–532, 2016.
- (64) N. H. Minh, Y. P. Cheng, and C. Thornton. Strong force networks in granular mixtures. Granul. Matter, 16:69–78, Feb 2014.
- (65) D. M. Mueth, H. M. Jaeger, and S. R. Nagel. Force distribution in a granular medium. Phys. Rev. E, 57(3):3164–3169, 1998.
- (66) F. Radjai, M. Jean, J.-J. Moreau, and S. Roux. Force distributions in dense two-dimensional granular systems. Phys. Rev. Lett., 77:274–278, 1996.
- (67) E. Azéma, F. Radjaï, R. Peyroux, and G. Saussine. Force transmission in a packing of pentagonal particles. Phys. Rev. E, 76:011301, 2007.
- (68) H A. Makse, D. L. Johnson, and L. M. Schwartz. Packing of compressible granular materials. Phys. Rev. Lett., 84:4160–4163, 2000.
- (69) R. Cohen and S. Havlin. Fractal dimensions of percolating networks. Physica A Stat. Mech. Appl., 336:6 – 13, 2004.
- (70) M. Newman. Networks: An Introduction. Oxford University Press, Inc., New York, NY, USA, 2010.
- (71) A.J. Liu and S.R. Nagel. The jamming transition and the marginally jammed solid. Ann. Rev. of Cond. Matt. Phys., 1:347–369, 2010.
- (72) M. van Hecke. Jamming of soft particles: geometry, mechanics, scaling and isostaticity. J. Phys. Condens. Matter, 22(3):033101, 2010.
- (73) S. Henkes, M. van Hecke, and W. van Saarloos. Critical jamming of frictional grains in the generalized isostaticity picture. EPL (Europhys. Lett.), 90(1):14003, 2010.
- (74) T. S. Majmudar, M. Sperl, S. Luding, and R. P. Behringer. The jamming transition in granular systems. Physical Review Letters, 98:058001–058004, 2007.
- (75) K. Shundyak, M. van Hecke, and W. van Saarloos. Force mobilization and generalized isostaticity in jammed packings of frictional grains. Phys. Rev. E, 75:010301, 2007.
- (76) L. Kondic. Capstone Laboratory Web Page, 2018.