Structure and superconductivity in the binary Re1-xMox alloys
Abstract
The binary Re1-xMox alloys, known to cover the full range of solid solutions, were successfully synthesized and their crystal structures and physical properties investigated via powder x-ray diffraction, electrical resistivity, magnetic susceptibility, and heat capacity. By varying the Re/Mo ratio we explore the full Re1-xMox binary phase diagram, in all its four different solid phases: hcp-Mg (), -Mn (), -CrFe (), and bcc-W (), of which the second is non-centrosymmetric with the rest being centrosymmetric. All Re1-xMox alloys are superconductors, whose critical temperatures exhibit a peculiar phase diagram, characterized by three different superconducting regions. In most alloys the is almost an order of magnitude higher than in pure Re and Mo. Low-temperature electronic specific-heat data evidence a fully-gapped superconducting state, whose enhanced gap magnitude and specific-heat discontinuity suggest a moderately strong electron-phonon coupling across the series. Considering that several -Mn-type Re alloys ( = transition metal) show time-reversal symmetry breaking (TRSB) in the superconducting state, while TRS is preserved in the isostructural Mg10Ir19B16 or Nb0.5Os0.5, the Re1-xMox alloys represent another suitable system for studying the interplay of space-inversion, gauge, and time-reversal symmetries in future experiments expected to probe TRSB in the Re family.
I Introduction
Time reversal and spatial inversion are two key symmetries which radically influence electron pairing in the superconducting state. Superconductors with a space-inversion center can host either even-parity spin-singlet (e.g., - or -wave) or odd-parity spin-triplet (e.g., -wave) pairing states. These strict symmetry requirements, however, are relaxed in non-centrosymmetric superconductors (NCSCs), where the antisymmetric spin-orbit coupling (ASOC) allows, in principle, the occurrence of parity-mixed superconducting states, whose mixing degree is related to the strength of the ASOC and to other microscopic parameters. E. and Sigrist (2012); Smidman et al. (2017) Because of the mixed pairing, NCSCs frequently display interesting properties. For instance, some NCSCs, such as CePt3Si,Bonalde et al. (2005) CeIrSi3,Mukuda et al. (2008) Li2Pt3B,Yuan et al. (2006); Nishiyama et al. (2007) K2Cr3As3,Pang et al. (2015); Adroja et al. (2015) and YBiPt Kim et al. (2018) exhibit line nodes in the gap, while others, such as LaNiC2 Chen et al. (2013) and (La,Y)2C3,Kuroiwa et al. (2008) show multiple-gap superconductivity. The external pressure drives CeIrSi3 into a gapless superconductivity, Landaeta et al. (2018) while a nodal behavior has been observed in LaNiC2 and Y2C3. Bonalde et al. (2011); Landaeta et al. (2017); Chen et al. (2011) Recently, many NCSCs,Sato and Fujimoto (2009, 2009); Tanaka et al. (2010); Chadov et al. (2010); Meinert (2016); Sun et al. (2015); Smidman et al. (2017); Kim et al. (2018); Ali et al. (2014) in particular YPtBi,Kim et al. (2018) BiPd, Sun et al. (2015) and PbTaSe2,Ali et al. (2014) have been closely investigated as possible models of topological superconductors.
Interestingly, numerous muon-spin relaxation/rotation (SR) studies have revealed that some NCSCs exhibit also time-reversal symmetry breaking (TRSB), concomitant with the onset of superconductivity. Examples include LaNiC2,Hillier et al. (2009) La7(Ir,Rh)3,Barker et al. (2015); Singh et al. (2018a) and several Re-based binary alloys Re(= transition metal, e.g., Ti, Zr, Nb, Hf).Singh et al. (2014, 2017a, 2018b); Shang et al. (2018a, b) In general, the breaking of time-reversal symmetry below and a lack of space-inversion symmetry of the crystal structure are independent events, not required to occur together. For instance, TRS is broken in several -Mn-type Re compounds and in the pure elementary Re, Shang et al. (2018b) yet it is preserved in the isostructural Mg10Ir19B16 or Nb0.5Os0.5,Aczel et al. (2010); Singh et al. (2018c) clearly suggesting that TRS breaking is most likely related to the presence of Re atoms, rather than to a generic lack of space-inversion symmetry. Indeed, by converse, the centrosymmetric Sr2RuO4, PrOs4Ge12, and LaNiGa2 also exhibit a broken TRS in the superconducting state.Luke et al. (1998); Aoki et al. (2003); Hillier et al. (2012)
To further study the TRSB in Re materials, one should identify a system that exhibits both centro- and non-centrosymmetric structures, while still preserving its basic stoichiometry. For instance, depending on synthesis protocol, Re3W can be either a centro- (hcp-Mg-type) or a non-centrosymmetric (-Mn-type) superconductor,Biswas et al. (2011) yet neither is found to break TRS.Biswas et al. (2012) On the other hand, other superconducting Re compounds, with = Ti, Zr, Nb, Hf, indeed break TRS, yet mostly adopt the same (-Mn-type) structure. Similar to the Re3W case, the Re1-xMox binary alloys discussed here represent another candidate system. For different Re/Mo ratios, depending on synthesis protocol, they adopt either centro- or non-centrosymmetric structures.Massalski et al. (1996) Although the superconductivity of several Re1-xMox alloys was reported decades ago, only recently the Mo-rich side was studied by different techniques.Roberts (1976); Shum et al. (1986); Okada et al. (2013); Ignatyeva and Velikodny (2004) To date, a systematic study of the full range of Re1-xMox solid solution is missing. In particular, due to synthesis difficulties, its Re-rich side remains largely unexplored. Yet, in view of the non-centrosymmetric structures adopted, it is precisely this part of the phase diagram to be the most interesting one.
In this paper, based on systematic physical-property measurements, we explore the full superconducting phase diagram of the Re1-xMox system. To this aim, polycrystalline Re1-xMox samples, with x , were successfully synthesized. Although samples with different Re/Mo ratios exhibit different crystal structures, they all become superconductors (whose highest reaches 12.4 K). All the relevant superconducting parameters, including gap values and symmetries, were determined by magnetometry, transport, and specific-heat measurements, thus allowing us to present the complete Re1-xMox superconducting phase diagram.
II Experimental details
Polycrystalline Re1-xMox () alloys were prepared by arc melting Re and Mo metals with different stoichiometric ratios in high-purity argon atmosphere. To improve the homogeneity, samples were flipped and remelted several times and, for some of them, the as-cast ingots were annealed at 900∘C for two weeks. The -CrFe phase (e.g, Re0.6Mo0.4) was obtained by interrupting the heating immediately after the melting of the precursors. Hence, all the measurements reported here for the -CrFe phase refer to as-cast samples. The extra phases were obtained by further annealing the as-cast samples. The -Mn phase with a non-centrosymmetric crystal structure (Re0.77Mo0.23) was stabilized by annealing the sample over one week at 1400∘C in argon or hydrogen atmosphere. Unlike the rather malleable Mo-rich alloys, their Re-rich counterparts turned out to be extremely hard. In addition, the Re0.77Mo0.23 alloy resulted fragile after annealing at 1400∘C. Previously, the same arc-melting processes were adopted to cover the whole range,Farzadfar et al. (2009); Yang et al. (2010) with the samples being annealed at 1200∘C and then quenched in water. However, these early attempts failed to produce clean -Mn phase.
The x-ray powder diffraction (XRD) patterns were measured at room temperature by using a Bruker D8 diffractometer with Cu K radiation. The atomic ratios of the Re1-xMox samples were measured by x-ray fluorescence spectroscopy (XRF) on an AMETEK Orbis Micro-XRF analyzer. The magnetic susceptibility, electrical resistivity, and specific-heat measurements were performed on a 7-T Quantum Design Magnetic Property Measurement System (MPMS-7) and a 9-T Physical Property Measurement System (PPMS-9).
III Key experimental results
III.1 Crystal structures
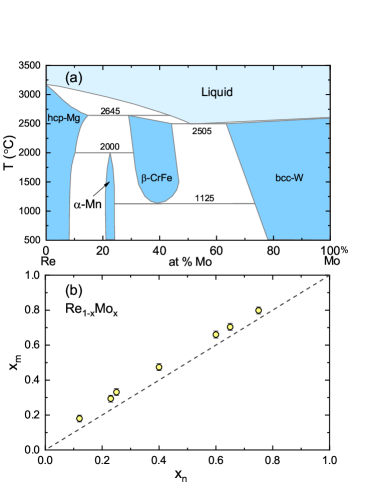
As shown in Fig. III.1(a), the Re1-xMox binary alloys exhibit a very rich phase diagram. While pure Mo and Re form body-centered-cubic (bcc) and hexagonal-close-packed (hcp) structures, respectively, at intermediate Re/Mo ratios two other phases appear, a tetragonal -CrFe and a cubic -Mn phase. By suitably combining arc melting and annealing processes, we could successfully synthesize pure-phase alloys representative of all four crystal structures. Although the Re1-xMox phase diagram has been studied before, most of the obtained samples contained at least two different solid phases, thus preventing a systematic study of their physical properties.Farzadfar et al. (2009); Yang et al. (2010) Conforming to the binary phase diagram, the bcc-W and hcp-Mg solid phases were easily obtained via arc melting of Re and Mo and resulted to be stable at 1400∘C. Two reactions take place during the solidifying process:
| liquid | |||
| liquid + hcp-Mg |
In order to synthesize the pure -CrFe phase, the first reaction was blocked by interrupting the heating imediately after the melting of both the Re and Mo metals. As for the -Mn phase, this cannot be synthesized via arc melting, since no such phase appears during the liquid-mixture cooling. Yet, two other reactions include this phase:
Since in both cases solid-state reactions are involved, the pure -Mn phase was obtained by annealing the melted Re and Mo metals at 1400∘C.
Subsequently, the Re/Mo atomic ratio was determined via EDX on polished samples. The estimated Mo (or Re) concentration vs. its nominal value is presented in Fig. III.1(b). For all the samples, the measured Re (Mo) concentration was slightly smaller (larger) than the nominal value, reflecting the preferential evaporation of Re during the arc melting process. For clarity, since typical deviations do not exceed ca. 12%, the nominal concentrations will be used hereafter.
| Sample | Re0.88Mo0.12 | Re0.77Mo0.23 | Re0.6Mo0.4 | Re0.4Mo0.6 |
|---|---|---|---|---|
| Structure | hexagonal hcp-Mg | cubic -Mn | tetragonal -CrFe | cubic bcc-W |
| Space group | (No. 194) | (No. 217) | (No. 136) | (No. 229) |
| (Å) | 2.76798(2) | 9.58476(3) | 9.58514(4) | 3.12627(10) |
| (Å) | 2.76798(2) | 9.58476(3) | 9.58514(4) | 3.12627(10) |
| (Å) | 4.48728(5) | 9.58476(3) | 4.97891(2) | 3.12627(10) |
| (Å3) | 29.7743(5) | 880.529(6) | 457.437(4) | 30.5549(17) |
Re0.88Mo0.12
Atom
Wyckoff
SOF
Re1
2
0.33330
0.66670
0.25000
0.88
Mo1
2
0.33330
0.66670
0.25000
0.12
Re0.77Mo0.23
Atom
Wyckoff
SOF
Mo1
8
0.3260(4)
0.3260(4)
0.3260(4)
1
Mo2
24
0.3593(2)
0.3593(2)
0.0409(3)
0.30(1)
Re1
2
0
0
0
1
Re2
24
0.3593(2)
0.3593(2)
0.0409(3)
0.70(1)
Re3
24
0.0911(2)
0.0911(2)
0.2839(2)
1
Re0.6Mo0.4
Atom
Wyckoff
SOF
Re1
2
0
0
0
0.69(1)
Re2
4
0.3994(2)
0.3994(2)
0
0.22(1)
Re3
8
0.4650(1)
0.1303(2)
0
0.52(1)
Re4
8
0.7418(2)
0.0655(2)
0
0.75(1)
Re5
8
0.1834(1)
0.1834(2)
0.25
0.60(1)
Mo1
2
0
0
0
0.31(1)
Mo2
4
0.3994(2)
0.3994(2)
0
0.78(1)
Mo3
8
0.4650(1)
0.1303(2)
0
0.48(1)
Mo4
8
0.7418(2)
0.0655(2)
0
0.25(1)
Mo5
8
0.1834(1)
0.1834(2)
0.25
0.40(1)
Re0.4Mo0.6
Atom
Wyckoff
SOF
Re1
2
0
0
0
0.4
Mo1
2
0
0
0
0.6
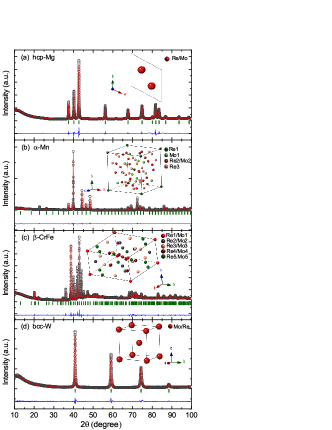
Figure III.1 shows four representative XRD patterns of polycrystalline Re1-xMox samples, with the other samples exhibiting similar diffractograms (not shown here). All the XRD patterns were analyzed using the FullProf Rietveld-analysis suite.Rodríguez-Carvajal (1993) No obvious impurity phases could be detected, indicating the high quality of the synthesized samples. As shown in Fig. III.1(a), on the Re-rich side, Re1-xMox alloys adopt a hexagonal hcp-Mg-type structure. According to our XRD refinements in Fig. III.1(a), all the samples with exhibit hcp-Mg-type structures [see inset in Fig. III.1(a)]. Following the binary phase diagram, for besides the hexagonal structure, a cubic -Mn-type structure can also be stabilized by sample annealing at 1400∘C [see Fig. III.1(b)]. Such cubic phase is the same as that adopted by other Re compounds, where TRSB and unconventional superconductivity have been frequently observed (see Sec. I). However, unlike in other Re binary alloys, in Re1-xMox the -Mn-type phase region is extremely narrow [see Fig. III.1(a)], i.e., . To exclude the hcp-Mg phase, the Re concentration was kept fixed at , i.e., at the center of the -Mn-phase region. By further increasing Mo concentration, the tetragonal -CrFe-type solid phase was synthesized via quenching. Its XRD refinement and crystal structure are presented in Fig. III.1(c). There are five different Re sites in the unit cell. Further on, in the Mo-rich side, the Re1-xMox alloys adopt a cubic bcc-W-type crystal structure. As an example, in Fig. III.1(d) we show the XRD refinement of the sample, along with its crystal structure (see inset). The crystal-structure information and atomic coordinates for all the four different solid phases are reported in Tables III.1 and III.1, respectively.
III.2 Electrical resistivity
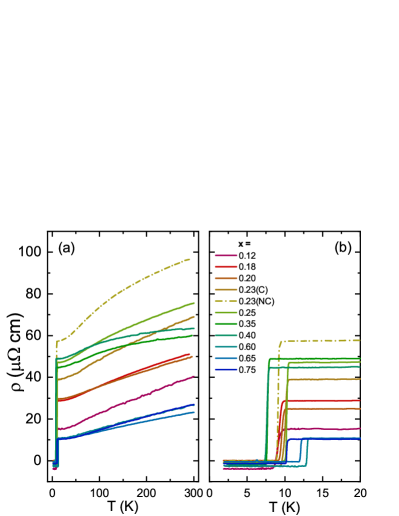
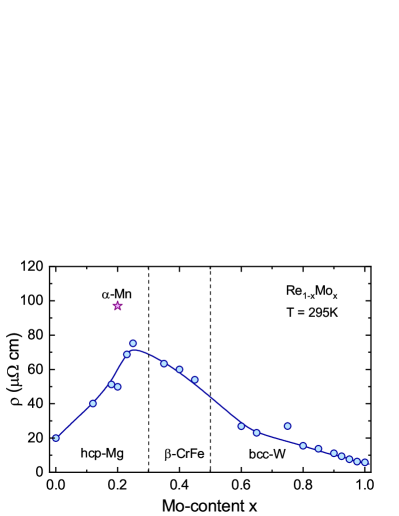
The temperature-dependent electrical resistivity of Re1-xMox () was measured from room temperature down to 2 K. As shown in Fig. III.2(a), all samples exhibit metallic behavior down to the lowest temperature. Apart from the superconducting transition, no anomaly associated with structural, magnetic, or charge-density-wave transitions could be detected. The room-temperature (295 K) electrical resistivities vs. Mo concentration are summarized in Fig. III.2. Upon increasing Mo content, the electrical resistivity also increases, before reaching the first phase boundary between hcp-Mg and -CrFe phases. We note that, for , a non-centrosymmetric -Mn-type sample (shown by a star in Fig. III.2) exhibits a 25% larger electrical resistivity compared to its centrosymmetric hcp-Mg-type counterpart. As is further increased beyond 0.3, the Re1-xMox alloys adopt the -CrFe phase and the electrical resistivity starts to decrease. On the Mo-rich side, i.e., in the bcc-W phase, electrical resistivity is much smaller than on the Re-rich side, thus demonstrating the better metallicity of this phase. Overall, these results clearly indicate a close relationship between the crystal structure and the electronic properties in the binary Re1-xMox alloys.
The electrical resistivity in the low-temperature region is plotted in Fig. III.2(b). Despite the varying s across the Re1-xMox series, all the samples exhibit a superconducting transition at low temperature. The values vary nonmonotonically with Re (or Mo) concentration, with the maximum K being achieved for . values resulting from electrical-resistivity data are summarized in Fig. IV (see below). Finally, the centrosymmetric specimen shows a K higher than the non-centrosymmetric one.
III.3 Magnetic susceptibility
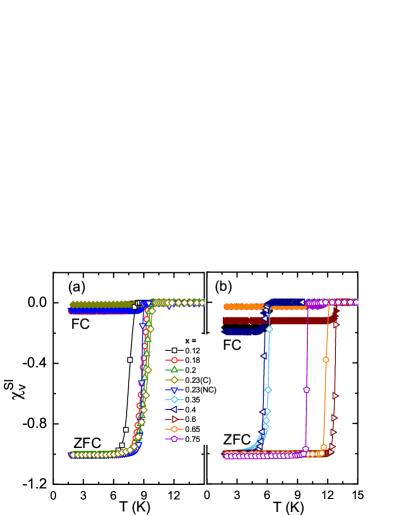
The bulk superconductivity of Re1-xMox alloys was further confirmed by magnetic susceptibility measurements. The temperature dependence of the magnetic susceptibility was measured using both field-cooled (FC) and zero-field-cooled (ZFC) protocols in an applied field of 1 mT. As shown in Fig. III.3(a)-(b), all the samples show superconducting transitions with differing s, consistent with the respective values determined from electrical resistivity [see Fig. III.2]. The splitting of the FC- and ZFC susceptibilities is a typical feature of type-II superconductors, where the magnetic-field flux is pinned once the material is cooled in an applied field. Since , the ZFC-susceptibility data indicate (almost ideal) bulk superconductivity below .
III.4 Specific heat
|
|
|
|
|
|
/ | |||||||||
|---|---|---|---|---|---|---|---|---|---|---|---|---|---|---|---|
| 0.00111Data from Refs. Rorer et al., 1965; Heiniger et al., 1966; Smith and Keesom, 1970; Sundar et al., 2015b, a. | 1.69 | 2.30 | 415.0 | 1.30 | 1.71 | 0.46 | 0.33 | 0.27 | 1.46 | ||||||
| 0.12 | 7.45 | 3.80 | 402.9 | 1.18 | 1.85 | 0.66 | 1.61 | 0.97 | 1.66 | ||||||
| 0.20 | 9.02 | 3.77 | 363.7 | 0.98 | 1.80 | 0.72 | 1.60 | 0.93 | 1.72 | ||||||
| 0.23222centrosymmetric | 9.43 | 3.53 | 333.0 | 1.07 | 1.80 | 0.77 | 1.50 | 0.85 | 1.77 | ||||||
| 0.23333non-centrosymmetric | 8.65 | 3.66 | 311.4 | 1.90 | 2.00 | 0.76 | 1.55 | 0.88 | 1.76 | ||||||
| 0.35 | 6.30 | 3.20 | 391.1 | 1.51 | 1.90 | 0.63 | 1.36 | 0.83 | 1.63 | ||||||
| 0.40 | 6.07 | 3.01 | 520.0 | 1.44 | 1.82 | 0.58 | 1.28 | 0.81 | 1.58 | ||||||
| 0.45 | 6.60 | 3.45 | 397.2 | 1.59 | 1.85 | 0.64 | 1.46 | 0.89 | 1.64 | ||||||
| 0.60 | 13.00 | 4.05 | 341.8 | 2.00 | 2.14 | 0.87 | 1.72 | 0.92 | 1.87 | ||||||
| 0.65 | 12.05 | 3.89 | 397.3 | 1.96 | 2.10 | 0.79 | 1.65 | 0.92 | 1.79 | ||||||
| 0.75 | 10.30 | 3.69 | 480.6 | 1.64 | 1.90 | 0.69 | 1.57 | 0.93 | 1.69 | ||||||
| 0.80111Data from Refs. Rorer et al., 1965; Heiniger et al., 1966; Smith and Keesom, 1970; Sundar et al., 2015b, a. | 8.50 | 3.65 | 420.7 | 1.51 | 1.87 | 0.68 | 1.55 | 0.92 | 1.68 | ||||||
| 0.85111Data from Refs. Rorer et al., 1965; Heiniger et al., 1966; Smith and Keesom, 1970; Sundar et al., 2015b, a. | 6.74 | 3.41 | 436.2 | 1.50 | 1.85 | 0.62 | 1.45 | 0.89 | 1.62 | ||||||
| 0.90111Data from Refs. Rorer et al., 1965; Heiniger et al., 1966; Smith and Keesom, 1970; Sundar et al., 2015b, a. | 3.02 | 2.39 | 429.9 | 1.35 | 1.80 | 0.51 | 1.01 | 0.66 | 1.51 | ||||||
| 1.00111Data from Refs. Rorer et al., 1965; Heiniger et al., 1966; Smith and Keesom, 1970; Sundar et al., 2015b, a. | 0.92 | 1.83 | 460.0 | 1.25 | 1.70 | 0.41 | 0.28 | 0.20 | 1.41 |
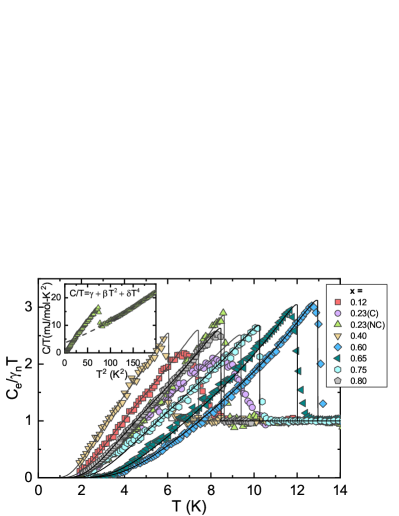
In the superconducting state, specific-heat data offer valuable insight into the superconducting properties, including the gap value and its symmetry. Hence, in the Re1-xMox series, we performed systematic zero-field specific-heat measurements down to 2 K. As shown in Fig. III.4, in all cases a clear specific-heat jump indicates a bulk superconducting transition. Again, the values determined by using the equal-entropy method are summarized in the superconducting phase diagram below. The electronic specific heat / was obtained by subtracting the phonon contribution from the experimental data. An example is shown in the inset of Fig. III.4, where the normal-state heat capacity of Re0.77Mo0.23 (NC) is fitted to , where is the normal-state-electronic contribution to heat capacity and is the phonon contribution to heat capacity. The specific heat of all the samples was fitted using the same formula and the derived and values (as listed in Table III.4) were then used to account for the phonon contribution in the superconducting state. The extrapolation to a zero intercept of the data close to 0 K (in the inset of Fig. III.4) indicates a fully superconducting volume fraction and a good sample quality. The Debye temperature can be calculated from values, by using = (12 /5)1/3, where JK-1mol-1 is the molar gas constant and is the number of atoms per formula unit. The and values of Re1-xMox alloys are summarized in Table III.4. The density of states (DOS) at the Fermi level was evaluated from the expression = /3, where and are the Boltzmann constant and the normal-state electronic-specific-heat coefficient.Kittel (2005) The electron-phonon coupling constant , a measure of the attractive interaction between electrons and phonons, can be further estimated from the and values by applying the semi-empirical McMillan formula:McMillan (1968)
| (1) |
The Coulomb pseudopotential , usually lying in the 0.09–0.18 range, is here fixed to 0.13, a commonly used value for the transition metals. As listed in Table III.4, the enhanced electron-phonon coupling of Re1-xMox (compared with pure Re or Mo) implies a moderate coupling strength of electrons in the superconducting state. Similar values have been found also in other non-centrosymmetric Re compounds.Karki et al. (2011); Lue et al. (2013); Khan et al. (2016); Singh et al. (2017b) Finally, the band-structure density of states (DOS) and the effective mass of quasiparticles can be estimated from the relations ) and ).Kittel (2005) Here we take = , where is the mass of free electrons. The calculated values for the Re1-xMox alloys are summarized in Table III.4. For the non-centrosymmetric Re0.77Mo0.23, the DOS is comparable to the values resulting from band-structure calculations on the similar Re ( = Zr, Nb, Ti) compounds.Khan et al. (2016); Winiarski (2014)
Below we discuss the Re1-xMox superconducting properties based on specific-heat data. The derived electronic specific heats divided by the normal-state electronic specific-heat coefficients, i.e., /, are shown in the main panel of Fig. III.4 as a function of temperature. The temperature-dependent superconducting-phase contribution to the entropy can be calculated by using the following equation:
| (2) |
where is the Fermi function, is the SC gap value at 0 K, and is the excitation energy of quasiparticles (i.e., their dispersion), with the electron energies measured relative to the chemical potential (Fermi energy). Padamsee et al. (1973); Tinkham (1996) Here .Carrington and Manzano (2003) Once the entropy is known, the temperature-dependent electronic specific heat in the superconducting state can be calculated from . The solid lines in Fig. III.4 represent fits with the above model and a single isotropic gap. The derived superconducting gap values are summarized in Table III.4. Except for the pure Re or Mo, the gap values of Re1-xMox alloys are slightly higher than the weak-copuling BCS value 1.763, thus indicating moderately-coupled superconducting pairs in Re1-xMox. The specific-heat discontinuities at , i.e., , are also summarized in Table III.4. As shown in Fig. III.4, Re1-xMox alloys with = 0.23 (NC), 0.40, 0.60, and 0.75, show a larger specific-heat discontinuity than the conventional BCS value of 1.43, whereas for , 0.20, and 0.23(C), the analogous discontinuity is reduced, most likely reflecting a broadening of the superconducting transition.
IV Phase diagram and discussion
Based on the above experimental data, in Fig. IV, we present the superconducting phase diagram of the Re1-xMox alloys as a function of the Re/Mo concentration. According to the binary phase diagram (Fig. III.1) and to XRD refinements (Fig. III.1), a change in the relative Re/Mo content induces up to four different solid phases: hcp-Mg (), -Mn (), -CrFe (), and bcc-W ().
As the Mo concentration increases, the varies nonmonotonically, giving rise to three distinct superconducting regions (see Fig. IV). The first superconducting region, with highest K, is achieved on the Re-rich part for and corresponds to samples adopting an hcp-Mg-type structure. Note that this is ca. 1 K lower than that of the corresponding -Mn-type non-centrosymmetric sample. Upon further increasing the Mo content, in the second superconducting region (for instance at ), the alloy adopts a -CrFe-type structure and exhibits a K, relatively lower than that of other phases. The third superconducting region has its onset at , with all the samples showing a bcc-W-type crystal structure and the highest reaching 12.4 K at . In all the regions, specific-heat data evidence a fully-gapped superconducting state with a single gap. Compared with the pure Re and Mo superconductors, as well as with the ideal BCS case (for which ), Re1-xMox alloys with exhibit larger superconducting gap values, thus indicating moderately coupled superconducting pairs in the latter.
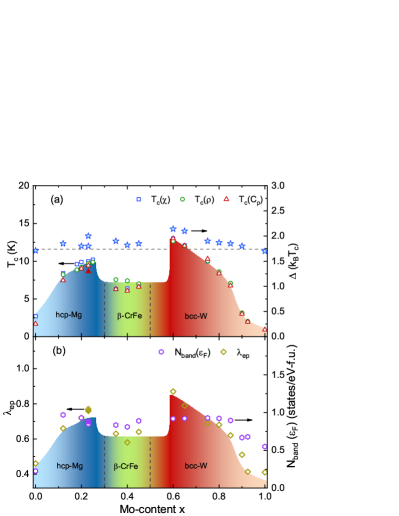
Figure IV(b) shows the calculated band-structure density of states (DOS) ) and the electron-phonon coupling constant versus the Re/Mo concentration (see Sec. III.4 for details). Interestingly, the follows closely the superconducting phase diagram shown in Fig. IV(a) and assumes its maximum values in correspondence with the highest in both the bcc-W- and hcp-Mg-phases. Compared to the pure Re or Mo cases, the enhanced again indicates a moderately coupled superconductivity in Re1-xMox alloys. The enhanced DOS in Re1-xMox, on either the Re- or Mo-rich side, may be ascribed to the filling of unoccupied bands by additional Mo or Re electrons. In any case, the different DOS values in Re1-xMox alloys seem closely related to their crystal structures.
Finally, we note that recent SR studies on non-centrosymmetric Re alloys indicate that TRS is consistently broken in their superconducting states. Since the TRSB occurrence in Re is independent of the particular transition metal, this points at the key role played by Re. To further confirm such conclusion, Re-containing samples with the same stoichiometry but with different crystal structures are ideal candidates. Considering their rich structural and electronic properties for different Re/Mo concentrations, here we could show that Re1-xMox alloys indeed represent such candidates. For example, for , samples with either non-centrosymmetric -Mn-type or centrosymmetric hcp-Mg-type (the same as pure Re) crystal structures can be prepared. Our results demonstrate an intimate relationship between electronic- and crystal structure in Re1-xMox alloys, which puts them forward as excellent systems for studying the interplay among the various symmetries in the superconducting state.
V Conclusion
To summarize, by combining arc melting and annealing processes, we managed to synthesize Re1-xMox binary alloys in a wide range of solid solutions. XRD patterns are consistent with four different solid phases, including hcp-Mg (), -Mn(), -CrFe(), and bcc-W (), of which -Mn and -CrFe have been among the most difficult to obtain to date. As established by electrical-resistivity, magnetic-susceptibility, and heat-capacity measurements, across the full range of solid solutions, Re1-xMox exhibits three superconducting regions, with the highest reaching 9.43 and 12.4 K in the hcp-Mg- and -CrFe-phases, respectively. The low-temperature electronic specific heat evidences a fully-gapped superconducting state, whose enhanced gap magnitude and specific-heat discontinuity suggest a moderately strong pairing, the latter being consistent with an enhanced electron-phonon coupling constant . The close correlation between , DOS, superconductivity, and crystal structure indicates that Re1-xMox alloys represent a very interesting system for studying the effects of structural symmetry on the electronic properties. The superconducting phase diagram reported here paves the way to future microscopic investigations, including the use of local-probe techniques such as NMR and SR. Forthcoming zero-field SR experiments will be essential to clarify the possible influence of structure on the occurrence of TRSB in the Re1-xMox family.
Acknowledgements.
The authors thank S. Ghosh, J. Quintanilla, P. Puphal, and I. Eremin for fruitful discussions. This work was supported by the Schweizerische Nationalfonds zur Förderung der Wissenschaftlichen Forschung, SNF (Grants no. 200021-169455 and 206021-139082).References
- E. and Sigrist (2012) Bauer E. and M. Sigrist, eds., Non-Centrosymmetric Superconductors, Vol. 847 (Springer Verlag, Berlin, 2012).
- Smidman et al. (2017) M. Smidman, M. B. Salamon, H. Q. Yuan, and D. F. Agterberg, “Superconductivity and spin–orbit coupling in non-centrosymmetric materials: A review,” Rep. Prog. Phys. 80, 036501 (2017).
- Bonalde et al. (2005) I. Bonalde, W. Brämer-Escamilla, and E. Bauer, “Evidence for line nodes in the superconducting energy gap of noncentrosymmetric CePt3Si from magnetic penetration depth measurements,” Phys. Rev. Lett. 94, 207002 (2005).
- Mukuda et al. (2008) H. Mukuda, T. Fujii, T. Ohara, A. Harada, M. Yashima, Y. Kitaoka, Y. Okuda, R. Settai, and Y. Onuki, “Enhancement of superconducting transition temperature due to the strong antiferromagnetic spin fluctuations in the noncentrosymmetric heavy-fermion superconductor CeIrSi3: A 29Si NMR study under pressure,” Phys. Rev. Lett. 100, 107003 (2008).
- Yuan et al. (2006) H. Q. Yuan, D. F. Agterberg, N. Hayashi, P. Badica, D. Vandervelde, K. Togano, M. Sigrist, and M. B. Salamon, “s-wave spin-triplet order in superconductors without inversion symmetry: Li2Pd3B and Li2Pt3B,” Phys. Rev. Lett. 97, 017006 (2006).
- Nishiyama et al. (2007) M. Nishiyama, Y. Inada, and G.-q. Zheng, “Spin triplet superconducting state due to broken inversion symmetry in Li2Pt3B,” Phys. Rev. Lett. 98, 047002 (2007).
- Pang et al. (2015) G. M. Pang, M. Smidman, W. B. Jiang, J. K. Bao, Z. F. Weng, Y. F. Wang, L. Jiao, J. L. Zhang, G. H. Cao, and H. Q. Yuan, “Evidence for nodal superconductivity in quasi-one-dimensional K2Cr3As3,” Phys. Rev. B 91, 220502 (2015).
- Adroja et al. (2015) D. T. Adroja, A. Bhattacharyya, M. Telling, Yu. Feng, M. Smidman, B. Pan, J. Zhao, A. D. Hillier, F. L. Pratt, and A. M. Strydom, “Superconducting ground state of quasi-one-dimensional K2Cr3As3 investigated using measurements,” Phys. Rev. B 92, 134505 (2015).
- Kim et al. (2018) H. Kim, K. Wang, Y. Nakajima, R. Hu, S. Ziemak, P. Syers, L. Wang, H. Hodovanets, J. D. Denlinger, P. M. R. Brydon, D. F. Agterberg, M. A. Tanatar, R. Prozorov, and J. Paglione, “Beyond triplet: Unconventional superconductivity in a spin- topological semimetal,” Sci. Adv. 4, eaao4513 (2018).
- Chen et al. (2013) J. Chen, L. Jiao, J. L. Zhang, Y. Chen, L. Yang, M. Nicklas, F. Steglich, and H. Q. Yuan, “Evidence for two-gap superconductivity in the non-centrosymmetric compound LaNiC2,” New J. Phys. 15, 053005 (2013).
- Kuroiwa et al. (2008) S. Kuroiwa, Y. Saura, J. Akimitsu, M. Hiraishi, M. Miyazaki, K. H. Satoh, S. Takeshita, and R. Kadono, “Multigap superconductivity in sesquicarbides La2C3 and Y2C3,” Phys. Rev. Lett. 100, 097002 (2008).
- Landaeta et al. (2018) J. F. Landaeta, D. Subero, D. Catalá, S. V. Taylor, N. Kimura, R. Settai, Y. Ōnuki, M. Sigrist, and I. Bonalde, “Unconventional superconductivity and quantum criticality in the heavy fermions CeIrSi3 and CeRhSi3,” Phys. Rev. B 97, 104513 (2018).
- Bonalde et al. (2011) I. Bonalde, R. L. Ribeiro, K. J. Syu, H. H. Sung, and W. H. Lee, “Nodal gap structure in the noncentrosymmetric superconductor LaNiC2 from magnetic-penetration-depth measurements,” New J. Phys. 13, 123022 (2011).
- Landaeta et al. (2017) J. F. Landaeta, D. Subero, P. Machado, F. Honda, and I. Bonalde, “Unconventional superconductivity and an ambient-pressure magnetic quantum critical point in single-crystal LaNiC2,” Phys. Rev. B 96, 174515 (2017).
- Chen et al. (2011) J. Chen, M. B. Salamon, S. Akutagawa, J. Akimitsu, J. Singleton, J. L. Zhang, L. Jiao, and H. Q. Yuan, “Evidence of nodal gap structure in the noncentrosymmetric superconductor Y2C3,” Phys. Rev. B 83, 144529 (2011).
- Sato and Fujimoto (2009) M. Sato and S. Fujimoto, “Topological phases of noncentrosymmetric superconductors: Edge states, Majorana fermions, and non-Abelian statistics,” Phys. Rev. B 79, 094504 (2009).
- Tanaka et al. (2010) Y. Tanaka, Y. Mizuno, T. Yokoyama, K. Yada, and M. Sato, “Anomalous Andreev bound state in noncentrosymmetric superconductors,” Phys. Rev. Lett. 105, 097002 (2010).
- Chadov et al. (2010) S. Chadov, X. Qi, J. Kübler, G. H. Fecher, C. Felser, and S. C. Zhang, “Tunable multifunctional topological insulators in ternary Heusler compounds,” Nat. Mater. 9, 541 (2010).
- Meinert (2016) M. Meinert, “Unconventional superconductivity in YPtBi and related topological semimetals,” Phys. Rev. Lett. 116, 137001 (2016).
- Sun et al. (2015) Z. X. Sun, M. Enayat, A. Maldonado, C. Lithgow, E. Yelland, D. C. Peets, A. Yaresko, A. P. Schnyder, and P. Wahl, “Dirac surface states and nature of superconductivity in noncentrosymmetric BiPd,” Nat. Commun. 6, 6633 (2015).
- Ali et al. (2014) M. N. Ali, Q. D. Gibson, T. Klimczuk, and R. J. Cava, “Noncentrosymmetric superconductor with a bulk three-dimensional Dirac cone gapped by strong spin-orbit coupling,” Phys. Rev. B 89, 020505 (2014).
- Hillier et al. (2009) A. D. Hillier, J. Quintanilla, and R. Cywinski, “Evidence for time-reversal symmetry breaking in the noncentrosymmetric superconductor LaNiC2,” Phys. Rev. Lett. 102, 117007 (2009).
- Barker et al. (2015) J. A. T. Barker, D. Singh, A. Thamizhavel, A. D. Hillier, M. R. Lees, G. Balakrishnan, D. McK. Paul, and R. P. Singh, “Unconventional superconductivity in La7Ir3 revealed by muon spin relaxation: Introducing a new family of noncentrosymmetric superconductor that breaks time-reversal symmetry,” Phys. Rev. Lett. 115, 267001 (2015).
- Singh et al. (2018a) D. Singh, M. S. Scheurer, A. D. Hillier, and R. P. Singh, “Time-reversal-symmetry breaking and unconventional pairing in the noncentrosymmetric superconductor La7Rh3 probed by SR,” arXiv preprint arXiv:1802.01533 (2018a).
- Singh et al. (2014) R. P. Singh, A. D. Hillier, B. Mazidian, J. Quintanilla, J. F. Annett, D. McK. Paul, G. Balakrishnan, and M. R. Lees, “Detection of time-reversal symmetry breaking in the noncentrosymmetric superconductor Re6Zr using muon-spin spectroscopy,” Phys. Rev. Lett. 112, 107002 (2014).
- Singh et al. (2017a) D. Singh, J. A. T. Barker, A. Thamizhavel, D. McK. Paul, A. D. Hillier, and R. P. Singh, “Time-reversal symmetry breaking in the noncentrosymmetric superconductor Re6Hf: Further evidence for unconventional behavior in the -Mn family of materials,” Phys. Rev. B 96, 180501 (2017a).
- Singh et al. (2018b) D Singh, K. P. Sajilesh, J. A. T. Barker, D. McK. Paul, A. D. Hillier, and R. P. Singh, “Time reversal symmetry breaking in noncentrosymmetric superconductor Re6Ti,” Phys. Rev. B 97, 100505 (2018b).
- Shang et al. (2018a) T. Shang, G. M. Pang, C. Baines, W. B. Jiang, W. Xie, A. Wang, M. Medarde, E. Pomjakushina, M. Shi, J. Mesot, H. Q. Yuan, and T. Shiroka, “Nodeless superconductivity and time-reversal symmetry breaking in the noncentrosymmetric superconductor Re24Ti,” Phys. Rev. B 97, 020502 (2018a).
- Shang et al. (2018b) T. Shang, M. Smidman, S. K. Ghosh, C. Baines, L. J. Chang, D. J. Gawryluk, J. A. T. Barker, R. P. Singh, D. Mck. Paul, G. Balakrishnan, E. Pomjakushina, M. Shi, M. Medarde, A. D. Hillier, H. Q. Yuan, J. Quintanilla, J. Mesot, and T. Shiroka, “Time-reversal symmetry breaking in Re-based superconductors,” Phys. Rev. Lett. 121, 257002 (2018b).
- Aczel et al. (2010) A. A. Aczel, T. J. Williams, T. Goko, J. P. Carlo, W. Yu, Y. J. Uemura, T. Klimczuk, J. D. Thompson, R. J. Cava, and G. M. Luke, “Muon spin rotation/relaxation measurements of the noncentrosymmetric superconductor Mg10Ir19B16,” Phys. Rev. B 82, 024520 (2010).
- Singh et al. (2018c) D. Singh, J. A. T. Barker, A. Thamizhavel, A. D. Hillier, D. McK. Paul, and R. P. Singh, “Superconducting properties and SR study of the noncentrosymmetric superconductor Nb0.5Os0.5,” J. Phys.: Condens. Matter 30, 075601 (2018c).
- Luke et al. (1998) G. M. Luke, Y. Fudamoto, K. M. Kojima, M. I. Larkin, J. Merrin, B. Nachumi, Y. J. Uemura, Y. Maeno, Z. Q. Mao, Y. Mori, H. Nakamura, and M. Sigrist, “Time-reversal symmetry-breaking superconductivity in Sr2RuO4,” Nature 394, 558 (1998).
- Aoki et al. (2003) Y. Aoki, A. Tsuchiya, T. Kanayama, S. R. Saha, H. Sugawara, H. Sato, W. Higemoto, A. Koda, K. Ohishi, K. Nishiyama, and R. Kadono, “Time-reversal symmetry-breaking superconductivity in heavy-fermion PrOs4Sb12 detected by muon-spin relaxation,” Phys. Rev. Lett. 91, 067003 (2003).
- Hillier et al. (2012) A. D. Hillier, J. Quintanilla, B. Mazidian, J. F. Annett, and R. Cywinski, “Nonunitary triplet pairing in the centrosymmetric superconductor LaNiGa2,” Phys. Rev. Lett. 109, 097001 (2012).
- Biswas et al. (2011) P. K. Biswas, M. R. Lees, A. D. Hillier, R. I. Smith, W. G. Marshall, and D. McK. Paul, “Structure and superconductivity of two different phases of Re3W,” Phys. Rev. B 84, 184529 (2011).
- Biswas et al. (2012) P. K. Biswas, A. D. Hillier, M. R. Lees, and D. McK. Paul, “Comparative study of the centrosymmetric and noncentrosymmetric superconducting phases of Re3W using muon spin spectroscopy and heat capacity measurements,” Phys. Rev. B 85, 134505 (2012).
- Massalski et al. (1996) T. B. Massalski, H. Okamoto, L. Kacprzak, and P. R. Subramanian, Binary alloy phase diagrams, 2nd ed. (ASM International, Materials Park, OH, 1996).
- Roberts (1976) B. W. Roberts, “Survey of superconductive materials and critical evaluation of selected properties,” J. Phys. Chem. Ref. Data 5, 581 (1976).
- Shum et al. (1986) D. P. Shum, A. Bevolo, J. L. Staudenmann, and E. L. Wolf, “Enhanced superconductivity by electron renormalization of a directly observed Brout-Visscher local phonon: Re in Mo1-xRex,” Phys. Rev. Lett. 57, 2987 (1986).
- Okada et al. (2013) M. Okada, E. Rotenberg, S. D. Kevan, J. Schäfer, B. Ujfalussy, G. M. Stocks, B. Genatempo, E. Bruno, and E. W. Plummer, “Evolution of the electronic structure in Mo1-xRex alloys,” New J. Phys. 15, 093010 (2013).
- Ignatyeva and Velikodny (2004) T. A. Ignatyeva and A. N. Velikodny, “Electronic topological transition in Mo1-xRex alloys and its influence on the temperature of the superconducting transition,” Low Temp. Phys. 30, 388 (2004).
- Farzadfar et al. (2009) S. A. Farzadfar, M. Levesque, M. Phejar, and J.-M. Joubert, “Thermodynamic assessment of the molybdenum–rhenium system,” Calphad 33, 502 (2009).
- Yang et al. (2010) Y. Yang, C. Zhang, S. L. Chen, D. Morgan, and Y. Austin Chang, “First-principles calculation aided thermodynamic modeling of the Mo-Re system,” Intermetallics 18, 574 (2010), and references therein.
- Rodríguez-Carvajal (1993) J. Rodríguez-Carvajal, “Recent advances in magnetic structure determination by neutron powder diffraction,” Physica B: Condens. Matter 192, 55 (1993).
- Naor et al. (2010) A. Naor, N. Eliaz, E. Gileadi, and S. R. Taylor, “Properties and applications of rhenium and its alloys,” AMMTIAC Quart. 5, 11 (2010).
- Holmwood and Glang (1965) R. A. Holmwood and R. Glang, “Resistivity and temperature coefficient of pure molybdenum.” J. Chem. Eng. Data 10, 162 (1965).
- Sundar et al. (2015a) S. Sundar, L. S. S. Chandra, M. K. Chattopadhyay, S. K. Pandey, D. Venkateshwarlu, R. Rawat, V. Ganesan, and S. B. Roy, “Strong electron-phonon coupling and multiband effects in the superconducting -phase Mo1-xRex alloys,” New. J. Phys. 17, 053003 (2015a).
- Rorer et al. (1965) D. C. Rorer, D. G. Onn, and H. Meyer, “Thermodynamic properties of molybdenum in its superconducting and normal state,” Phys. Rev. 138, A1661 (1965).
- Heiniger et al. (1966) F. Heiniger, E. Bucher, and J. Muller, “Low temperature specific heat of transition metals and alloys,” Phys. Kondens. Materie 5, 243 (1966).
- Smith and Keesom (1970) David R. Smith and P. H. Keesom, “Specific heat of rhenium between 0.15 and 4.0 K,” Phys. Rev. B 1, 188 (1970).
- Sundar et al. (2015b) S. Sundar, L. S. Sharath Chandra, M. K. Chattopadhyay, and S. B. Roy, “Evidence of multiband superconductivity in the -phase Mo1-xRex alloys,” J. Phys.: Condens. Matter 27, 045701 (2015b).
- Kittel (2005) C. Kittel, Introduction to Solid State Physics, 8th ed. (John Wiley & Sons, Hoboken, NJ, 2005).
- McMillan (1968) W. L. McMillan, “Transition temperature of strong-coupled superconductors,” Phys. Rev. 167, 331 (1968).
- Karki et al. (2011) A. B. Karki, Y. M. Xiong, N. Haldolaarachchige, S. Stadler, I. Vekhter, P. W. Adams, D. P. Young, W. A. Phelan, and J. Y. Chan, “Physical properties of the noncentrosymmetric superconductor Nb0.18Re0.82,” Phys. Rev. B 83, 144525 (2011).
- Lue et al. (2013) C. S. Lue, H. F. Liu, C. N. Kuo, P. S. Shih, J. Y. Lin, Y. K. Kuo, M. W. Chu, T. L. Hung, and Y. Y. Chen, “Investigation of normal and superconducting states in noncentrosymmetric Re24Ti5,” Supercond. Sci. Tech. 26, 055011 (2013).
- Khan et al. (2016) Mojammel A. Khan, A. B. Karki, T. Samanta, D. Browne, S. Stadler, I. Vekhter, Abhishek Pandey, P. W. Adams, D. P. Young, S. Teknowijoyo, K. Cho, R. Prozorov, and D. E. Graf, “Complex superconductivity in the noncentrosymmetric compound Re6Zr,” Phys. Rev. B 94, 144515 (2016).
- Singh et al. (2017b) D. Singh, A. D. Hillier, A. Thamizhavel, and R. P. Singh, “Superconducting properties of the noncentrosymmetric superconductor Re6Hf,” Phys. Rev. B 96, 064521 (2017b).
- Winiarski (2014) M. J. Winiarski, “Electronic structure of non-centrosymmetric superconductors Re24(Nb;Ti)5 by ab initio calculations,” J. Alloys. Compd. 616, 1 (2014).
- Padamsee et al. (1973) H. Padamsee, J. E. Neighbor, and C. A. Shiffman, “Quasiparticle phenomenology for thermodynamics of strong-coupling superconductor,” J. Low Temp. Phys. 12, 387 (1973).
- Tinkham (1996) M. Tinkham, Introduction to superconductivity, 2nd ed. (Dover Publications, Mineola, NY, 1996).
- Carrington and Manzano (2003) A. Carrington and F. Manzano, “Magnetic penetration depth of MgB2,” Physica C 385, 205 (2003).