Study of X-ray variability and coronae of Seyfert galaxies using NuSTAR
Abstract
The primary X-ray emission in active galactic nuclei (AGN) originates in a compact region called the corona located very close to the super-massive black hole and the accretion disk. The knowledge of the cut-off energy () of the primary X-ray continuum in an AGN is very important as it carries information on the physical characteristics of the hot X-ray emitting corona. We present here the results of our investigation on the spectral properties of a sample of 10 nearby AGN (0.005 0.037) observed with the Nuclear Spectroscopic Telescope Array (NuSTAR) . From fitting of the NuSTAR data of 10 sources, we derived clear values for the first time in 8 sources and a lower limit in one source, thereby, doubling the number of AGN with measurements from NuSTAR data. Broad Fe K line was noticed in 7 sources, while, excess emission in the energy range beyond 15 keV arising from Compton reflection was seen in all the sources. We also investigated the correlation of with various physical characteristics of the AGN such as black hole mass (), Eddington ratio () and X-ray photon index (). We found no correlation between and and between and , however, correlates with in a complex manner. Also, timing analysis of the 10 sources indicates that they all are variable with indications of more variations in the soft band relative to the hard band in some individual sources, however, considering all the sources together, the variations are indistinguishable between hard and soft bands.
keywords:
galaxies: active galaxies: Seyfert (galaxies:) quasars: general1 Introduction
Active Galactic Nuclei (AGN) are the most powerful and persistent extragalactic sources that emit radiation over a wide range of the accessible wavelengths from low energy radio to high energy gamma rays. Their luminosities range from 1040 erg s-1 to larger than 1047 erg s-1 (Fabian, 1999). They are believed to be powered by accretion of matter on to super-massive black holes (SMBHs) located at the centres of galaxies (Rees, 1984). The process of accretion leads to the formation of an optically thick, geometrically thin accretion disk (Shakura & Sunyaev, 1973) around the SMBH. Such an accretion disk with temperatures in the range of 104 105 K for a black hole of mass 106 109 M⊙ emits primarily in the optical/UV region of the electromagnetic spectrum and the observed big blue bump (BBB) in the broad band spectral energy distribution of an AGN is a signature of the accretion disk. The observed thermal emission from the standard accretion disk is a combination of several black bodies of different temperatures and it depends on the size of the emitting region, the accretion rate and the mass of the central SMBH. On the other hand, the observed primary X-ray continuum emission from AGN is thought to be due to the inverse Compton scattering of UV and optical photons from the accretion disk by hot electrons in a compact region called the corona (Haardt & Maraschi, 1991; Haardt et al., 1994, 1997). This inverse Compton scattering of UV/optical photons from the accretion disk by the coronal electrons produces a X-ray continuum with a power-law spectral shape and a high energy cut-off (Rybicki & Lightman, 1979). This high energy cut-off (Ecut) in the observed spectrum happens when the electrons in the corona are no longer able to add energy to the photon in the photon-electron interaction (Buisson et al., 2018). The shape of the power law continuum depends on various parameters such as the seed photon field, the coronal temperature (), the optical depth and the observers viewing angle, while the value of is determined by (Mushotzky et al., 1993).
| No. | Name | V (mag) | Type | OBSID | Date | Exposure | |||
|---|---|---|---|---|---|---|---|---|---|
| (1) | (2) | (3) | (4) | (5) | (6) | (7) | (8) | (9) | (10) |
| 1. | Mrk 348 | 00:48:47.2 | +31:57:25.0 | 0.014 | 14.59 | Sy1h | 60160026002 | 2015-10-28 | 21520 |
| 2. | Mrk 1040 | 02:28:14.4 | +31:18:41.0 | 0.016 | 14.74 | Sy1 | 60101002002 | 2015-08-12 | 62960 |
| 60101002004 | 2015-08-15 | 64252 | |||||||
| 3. | ESO 362G18 | 05:19:35.8 | -32:39:27.0 | 0.013 | 13.37 | Sy1.5 | 60201046002 | 2016-09-24 | 101906 |
| 4. | NGC 2992 | 09:45:42.0 | -14:19:35.0 | 0.008 | 13.78 | Sy1.9 | 60160371002 | 2015-12-02 | 20798 |
| 5. | NGC 3783 | 11:39:01.8 | -37:44:19.0 | 0.009 | 13.43 | Sy1.5 | 60101110002 | 2016-08-22 | 41271 |
| 60101110004 | 2016-08-24 | 42434 | |||||||
| 6. | 4U 134460 | 13:47:36.0 | -60:37:03.0 | 0.013 | 19.00 | Sy1 | 60201041002 | 2016-09-17 | 99464 |
| 7. | ESO141-G55 | 19:21:14.3 | -58:40:13.0 | 0.037 | 13.64 | Sy1.2 | 60201042002 | 2016-07-15 | 93011 |
| 8. | Mrk 509 | 20:44:09.7 | -10:43:24.0 | 0.035 | 13.12 | Sy1.5 | 60101043002 | 2015-04-29 | 165893 |
| 60101043004 | 2015-06-02 | 36475 | |||||||
| 9. | NGC 7172 | 22:02:01.9 | -31:52:08.0 | 0.009 | 13.61 | Sy2 | 60061308002 | 2014-10-07 | 32001 |
| 10. | NGC 7314 | 22:35:46.1 | -26:03:02.0 | 0.005 | 13.11 | Sy1h | 60201031002 | 2016-05-13 | 100424 |
X-ray reverberation studies indicate the corona to be located close to the accretion disk (Fabian et al., 2009; Kara et al., 2013) typically within 3 10 , where, is the gravitational radius defined as , and MBH is the mass of the SMBH. Rapid X-ray flux variability studies (McHardy et al., 2005), the observed small time scales of X-ray eclipses (Risaliti et al., 2005; Risaliti et al., 2011) and micro-lensing studies (Chartas et al., 2009) point to the small size of the X-ray corona of 510 . Exchange of energy happens between particles and photons in the compact corona, the compactness of which is parameterised by the dimensionless compactness parameter (Guilbert et al., 1983)
| (1) |
where and me are the masses of the proton and electron respectively, is the gravitational radius, is the size of the source, is the luminosity of the source, and is the Eddington luminosity defined as erg s-1, where is the Thomson scattering cross section. Also, the coronal electron temperature can be characterised by the dimensionless parameter as
| (2) |
Empirically, the electron temperature and Ecut are related as (Petrucci et al., 2001). In spite of several studies, the geometry of the corona is still not known. It could be in the form of a slab (Poutanen et al., 1997) or a sphere (Dove et al., 1997). Also, it is not known if the medium of the coronal plasma is continuous or patchy (Stern et al., 1995; Petrucci et al., 2013). In addition to the BBB and the primary power law X-ray continuum with a high energy cut off, a large fraction of AGN also show soft excess between 0.1 2 keV, broad ( 4 7 keV) Fe K line and a Compton reflection bump peaking between 20 30 keV. These features are well explained by reflection models (Fabian et al., 2002) where the coronal photons irradiate the accretion disk and Compton scatter off the disk.
| No. | Name | OBSID | 310 keV | 10 79 keV | 379 keV |
|---|---|---|---|---|---|
| (1) | (2) | (3) | (4) | (5) | (6) |
| 1. | Mrk 348 | 60160026002 | 0.0290.006 | 0.0290.008 | 0.0260.005 |
| 2. | Mrk 1040 | 60101002002 | 0.0890.005 | 0.0690.007 | 0.0810.004 |
| 60101002004 | 0.0990.005 | 0.0700.008 | 0.0900.004 | ||
| 3. | ESO 362G18 | 60201046002 | 0.2220.006 | 0.1500.008 | 0.1950.005 |
| 4. | NGC 2992 | 60160371002 | 0.0690.005 | 0.0640.008 | 0.0670.004 |
| 5. | NGC 3783 | 60101110002 | 0.0970.006 | 0.0410.009 | 0.0930.005 |
| 60101110004 | 0.0570.005 | 0.0170.006 | 0.0440.004 | ||
| 6. | 4U 134460 | 60201041002 | 0.1050.003 | 0.0940.004 | 0.1010.002 |
| 7. | ESO141G055 | 60201042002 | 0.0990.004 | 0.0750.006 | 0.0940.003 |
| 8. | Mrk 509 | 60101043002 | 0.0330.002 | 0.0440.003 | 0.0320.002 |
| 60101043004 | 0.0440.005 | 0.0850.008 | 0.0490.004 | ||
| 9. | NGC 7172 | 60061308002 | 0.0710.005 | 0.0710.006 | 0.0770.004 |
| 10. | NGC 7314 | 60201031002 | 0.2710.003 | 0.1950.005 | 0.2500.003 |
Determination of values from the X-ray spectra of AGN can provide important constraints on the temperature of the corona . However, measurements are difficult to obtain due to the requirement of X-ray data with high S/N beyond 10 keV. In spite of that, measurements for few nearby AGN are available via analysis of data from the Compton Gamma Ray Observatory (CGRO; Zdziarski et al. 2000, 1996; Johnson et al. 1997), BeppoSAX (Nicastro et al., 2000; Dadina, 2007), INTEGRAL (Malizia et al., 2014; Lubiński et al., 2010, 2016; Ricci et al., 2011), Swift/BAT (Vasudevan et al., 2013a; Ricci et al., 2017) and Suzaku (Tazaki et al., 2011). The launch of the Nuclear Spectroscopic Telescope Array (NuSTAR; Harrison et al. 2013) with its unique capability to focus hard X-rays and thereby providing good signal to noise ratio data in the 379 keV band has allowed us to get improved values of measurements for a growing number of AGN. As of today has been measured in less than two dozen AGN using NuSTAR (Brenneman et al., 2014; Baloković et al., 2015; Ballantyne et al., 2014; Matt et al., 2015; Ursini et al., 2015; Lohfink et al., 2015; Tortosa et al., 2016; Lanzuisi et al., 2016; Lohfink et al., 2017; Kara et al., 2017; Tortosa et al., 2018a; Porquet et al., 2018; Buisson et al., 2018; Rani & Stalin, 2018a, b). With the availability of more spectral measurements from NuSTAR, correlations between and various physical properties of the sources have been explored. From an analysis of 12 sources observed with NuSTAR, Rani & Stalin (2018b), found no correlation of with and . Also, Tortosa et al. (2018b) using 19 sources from NuSTAR, found no correlation between and . The number of measurements from NuSTAR is small to unambiguously know for the existence of correlation of with various physical properties of AGN. It is therefore very important to determine for more number of AGN. Recently, using Swift/BAT data for a sample of about 200 AGN, Ricci et al. (2018) found a statistically significant negative correlation between and Eddington ratio. However, observations from Swift/BAT are likely to be background dominated due to its survey mode of operation necessitating more measurements from NuSTAR to confirm the correlation noticed by Ricci et al. (2018).
To increase the number of AGN that have measurements, we are carrying out a systematic analysis of the spectra of few bright AGN observed with NuSTAR. In this paper we present the first time measurements of values for 10 AGN. In section 2 we give our sample and outline the reduction procedures. In Section 3, we describe the model fits to the extracted spectra as well as explore the existence of correlation between and various physical properties of AGN using an updated list of measurements from NuSTAR and summarize our findings in the final section. Through out the paper, we adopt a cosmology with = 71 km s-1 Mpc-1, = 0.73 and = 0.27.


| Name | OBSID | Slope | Intercept | P | R | |
|---|---|---|---|---|---|---|
| (1) | (2) | (3) | (4) | (5) | (6) | (7) |
| Mrk 348 | 60160026002 | 0.0000.028 | 0.5650.113 | 1.086 | 0.96 | 0.005 |
| Mrk 1040 | 60101002002 | 0.0390.015 | 0.4890.035 | 1.050 | 0.03 | 0.145 |
| 60101002002 | 0.0190.015 | 0.4410.031 | 0.907 | 0.52 | 0.043 | |
| ESO362G18 | 60201046002 | 0.1500.022 | 0.6460.023 | 0.980 | 1.20 10-8 | 0.285 |
| NGC 2992 | 60160371002 | 0.0040.010 | 0.4350.047 | 0.927 | 0.68 | 0.047 |
| NGC 3783 | 60101110002 | 0.0480.011 | 0.6580.040 | 1.205 | 0.20 | 0.099 |
| 60101110004 | 0.1470.024 | 0.9760.072 | 1.168 | 0.00 | 0.236 | |
| 4U 134460 | 60201041002 | 0.0170.006 | 0.4930.021 | 1.065 | 0.08 | 0.089 |
| ESO 141G055 | 60201042002 | 0.0330.012 | 0.4450.024 | 0.915 | 0.05 | 0.104 |
| Mrk 509 | 60101043002 | 0.0250.008 | 0.3050.028 | 1.089 | 0.65 | 0.018 |
| 60101043004 | 0.0740.018 | 0.1630.057 | 1.218 | 0.06 | 0.158 | |
| NGC 7172 | 60061308002 | 0.0220.010 | 0.4420.047 | 0.874 | 0.06 | 0.170 |
| NGC 7314 | 60201031002 | 0.0360.003 | 0.4670.009 | 1.088 | 7.02 10-28 | 0.530 |
| Name | OBSID | |||||
|---|---|---|---|---|---|---|
| (1) | (2) | (3) | (4) | (5) | (6) | (7) |
| Mrk 348 | 60160026002 | 1.76∗ | 2.20 | 1.570.02 | 2.310.13 | 1.25 |
| Mrk 1040 | 60101002002 | 7.23∗ | 1.630.37 | 1.860.02 | 9.97 | 0.79 |
| 60101002004 | 4.11∗ | 1.28 | 1.850.02 | 8.97 | 0.80 | |
| ESO 362G18 | 60201046002 | 1.76∗ | 2.20 | 1.570.02 | 2.310.13 | 1.25 |
| NGC 2992 | 60160371002 | 5.26∗ | 2.900.42 | 1.900.02 | 2.44 | 0.67 |
| NGC 3783 | 60101110002 | 8.26∗ | 2.120.35 | 1.720.02 | 1.250.05 | 0.88 |
| 60101110004 | 4.11∗ | 3.32 | 1.680.02 | 9.89 | 0.90 | |
| 4U 134460 | 60201041002 | 1.07∗ | 2.120.24 | 1.810.01 | 1.440.04 | 1.08 |
| ESO141G055 | 60201042002 | 5.11∗ | 0.700.33 | 1.880.02 | 8.71 | 0.91 |
| Mrk 509 | 60101043002 | 4.11∗ | 1.080.27 | 1.810.01 | 1.410.03 | 1.35 |
| 60101043004 | 4.11∗ | 1.22 | 1.770.02 | 1.190.06 | 1.13 | |
| NGC 7172 | 60061308002 | 1.65∗ | 9.950.44 | 1.830.02 | 2.34 | 0.82 |
| NGC 7314 | 60201031002 | 1.46∗ | 0.770.37 | 1.870.01 | 1.180.04 | 1.43 |
| Name | OBSID | (keV) | (keV) | Ecut (keV) | Npexrav | |||
|---|---|---|---|---|---|---|---|---|
| (1) | (2) | (3) | (4) | (5) | (6) | (7) | (8) | (9) |
| Mrk 348 | 60160026002 | — | — | 1.680.05 | 79 | 0.38 | 1.61 | 0.67 |
| Mrk 1040 | 60101002002 | 6.35 | 0.11 | 1.910.04 | 99 | 0.88 | 1.07 | 0.75 |
| 60101002004 | 6.44 | 0.30 | 1.940.04 | 114 | 0.95 | 0.99 | 0.76 | |
| ESO 362G18 | 60201046002 | 6.33 | 0.13 | 1.71 | 241 | 0.70 | 0.27 | 0.97 |
| NGC 2992 | 60160371002 | — | — | 1.840.04 | 150 | 0.07 | 2.28 | 0.67 |
| NGC 3783 | 60101110002 | 6.24 | 0.12 | 1.880.04 | 77 | 1.86 | 1.52 | 0.79 |
| 60101110004 | 6.30 | 0.00 | 1.870.04 | 63 | 2.46 | 1.250.08 | 0.80 | |
| 4U 134460 | 60201041002 | 6.36 | 0.12 | 1.950.03 | 91 | 1.54 | 1.710.06 | 0.92 |
| ESO141G055 | 60201042002 | 6.31 | 0.08 | 1.940.04 | 69 | 1.20 | 0.94 | 0.86 |
| Mrk 509 | 60101043002 | 6.40 | 0.14 | 1.830.02 | 160 | 0.27 | 1.460.04 | 1.10 |
| 60101043004 | 6.40 | 0.00 | 1.780.04 | 143 | 0.23 | 1.20 | 1.06 | |
| NGC 7172 | 60061308002 | — | — | 1.870.04 | 69 | 1.09 | 2.51 | 0.80 |
| NGC 7314 | 60201031002 | 6.36 | 0.50 | 2.030.03 | 1.02 | 1.400.05 | 1.05 |
| No. | Name | V | Type | MBH | Reference | ||||||
|---|---|---|---|---|---|---|---|---|---|---|---|
| (mag) | (keV) | ||||||||||
| 1 | Mrk 348 | 00:48:47.2 | 31:57:25.0 | 0.014 | 14.59 | Sy1h | 1.68 0.05 | 7.2 | 0.149 | This work | |
| 2 | Mrk 1040 | 02:28:14.4 | 31:18:41.0 | 0.016 | 14.74 | Sy1 | 1.91 0.04 | 6.4 | 1.030 | This work | |
| 3 | 3C 120 | 04:33:11.1 | 05:21:15.0 | 0.033 | 15.05 | Sy1.5 | 1.87 0.02 | 7.7 | 0.353 | A | |
| 4 | Ark 120 | 05:16:11.4 | 00:09:00.0 | 0.033 | 13.92 | Sy1 | 1.87 0.02 | 8.2 | 0.085 | C,J | |
| 5 | ESO 362G18 | 05:19:35.8 | 32:39:27.0 | 0.013 | 13.37 | Sy1.5 | 241 | 7.7 | 0.012 | This work | |
| 6 | MCG +8-11-11 | 05:54:53.6 | 46:26:21.0 | 0.020 | 14.62 | Sy1.5 | 1.77 0.04 | 7.2 | 0.754 | C,H | |
| 7 | NGC 2992 | 09:45:42.0 | 14:19:35.0 | 0.008 | 13.78 | Sy1.9 | 1.84 0.04 | 7.7 | 0.029 | This work | |
| 8 | MCG-5-23-16 | 09:47:40.2 | 30:56:54.0 | 0.008 | 13.69 | Syi | 1.85 0.01 | 7.8 | 0.031 | A | |
| 9 | NGC 3783 | 11:39:01.8 | 37:44:19.0 | 0.009 | 13.43 | Sy1.5 | 1.87 0.04 | 6.9 | 0.146 | This work | |
| 10 | NGC 4151 | 12:10:32.5 | 39:24:21.0 | 0.003 | 11.85 | Sy1.5 | 59 4.0 | 1.66 0.02 | 7.6 | 0.100 | B,K |
| 11 | PG 1247+268 | 12:50:05.7 | 26:31:07.0 | 2.042 | 15.92 | QSO | 8.9 | 0.024 | C,I | ||
| 12 | NGC 5273 | 13:42:08.3 | 35:39:15.0 | 0.003 | 13.12 | Sy1.9 | 6.8 | 1.10 | A | ||
| 13 | 4U 134460 | 13:47:36.0 | 60:37:03.0 | 0.013 | 19.00 | Sy1 | 1.95 0.03 | 8.2 | 0.014 | This work | |
| 14 | IC 4329A | 13:49:19.3 | 30:18:34.0 | 0.016 | 13.66 | Sy1.2 | 186 14 | 1.73 0.01 | 6.8 | 0.082 | A |
| 15 | NGC 5506 | 14:13:14.8 | 03:12:26.0 | 0.007 | 14.38 | Sy1i | 1.91 0.03 | 8.0 | 0.013 | A | |
| 16 | GRS 1734-292 | 17:37:28.3 | 29:08:02 | 0.021 | 21.0 | Sy1 | 1.65 0.05 | 8.5 | 0.033 | A | |
| 17 | 3C 382 | 18:35:03.4 | 32:41:47.0 | 0.058 | 15.39 | Sy1 | 9.2 | 0.109 | A | ||
| 18 | ESO 103-035 | 18:38:20.5 | 65:25:39.0 | 0.013 | 14.53 | Sy2 | 1.87 0.02 | 8.2 | 0.085 | D,G | |
| 19 | 3C 390.3 | 18:42:09.0 | 79:46:17.0 | 0.056 | 15.38 | Sy1.5 | 1.70 0.01 | 8.4 | 0.240 | A | |
| 20 | ESO141-G55 | 19:21:14.3 | 58:40:13.0 | 0.037 | 13.64 | Sy1.2 | 1.94 0.04 | 7.5 | 0.370 | This work | |
| 21 | NGC 6814 | 19:42:40.7 | 10:19:23 | 0.005 | 14.21 | Sy1.5 | 7.0 | 0.003 | C,H | ||
| 22 | 4C 74.26 | 20:42:37.3 | 75:08:02.0 | 0.104 | 15.13 | Sy1 | 9.6 | 0.037 | A | ||
| 23 | Mrk 509 | 20:44:09.7 | 10:43:24.0 | 0.035 | 13.12 | Sy1.5 | 1.78 0.04 | 7.9 | 0.215 | This work | |
| 24 | IGR 2124.7+5058 | 21:24:39.4 | 50:58:25.0 | 0.020 | 15.4 R | Sy1 | 1.59 0.02 | 7.5 | 0.400 | E,G | |
| 25 | J2127.4+5654 | 21:27:44.9 | 56:56:40 | 0.014 | 18.79 | Sy1n | 2.08 0.01 | 7.2 | 0.090 | A | |
| 26 | NGC 7172 | 22:02:01.9 | 31:52:08.0 | 0.009 | 13.61 | Sy2 | 1.87 0.04 | 8.3 | 0.004 | This work | |
| 27 | QSO B2202-209 | 22:05:09.9 | 01:55:18.0 | 1.770 | 17.50 | QSO | 1.82 0.05 | 9.1 | 1.150 | A | |
| 28 | NGC 7314 | 22:35:46.1 | 26:03:02.0 | 0.005 | 13.11 | Sy1h | 2.03 0.003 | 5.9 | 0.181 | This work | |
| 29 | Ark 564 | 22:42:39.3 | 29:43:32.0 | 0.025 | 14.16 | S3 | 42 3 | 2.27 0.08 | 6.4 | 1.100 | A |
| 30 | NGC 7469 | 23:03:15.6 | 08:42:26.0 | 0.017 | 13.04 | Sy1.5 | 1.78 0.02 | 7.0 | 0.300 | F |
2 Sample, Observation and reduction
Our sample of objects for the present study were selected from the archives of the High Energy Astrophysics Archive Research Center (HEASARC) 111https://heasarc.gsfc.nasa.gov/cgi-bin/W3Browse/w3browse.pl. We looked at the HEASARC archives for observations from NuSTAR that are open for use between the period June 2013 - June 2018. From this, we initially focussed on 10 nearby objects, that are also reasonably bright with net count rate in the 379 keV band greater than 0.1. The details of these 10 objects selected for this study are given in Table 1.
We reduced the data using NuSTAR Data Analysis Software package NuSTARDAS v1.6.0222https://heasarc.gsfc.nasa.gov/docs/nustar/analysis/nustar_swguide.pdf and CALDB version 20161207 distributed by HEASARC. We generated cleaned and screened event files using the nupipeline task, and also considering the passage of the satellite through the South Atlantic Anomaly(SAA). We extracted the spectra and corresponding response files using nuproducts task, with a circular region of at the peak of the source and radius circular background region away from the source on the same chip.
For spectral analysis, we fitted both the focal plane modules FPMA and FPMB spectra simultaneously allowing the cross normalization for both modules to vary. In this fitting process, the abundances of the elements were fixed to their solar values (Anders & Grevesse, 1989). We used XSPEC (version 12.9.0; Arnaud 1996) for the spectral fitting. The minimization technique in XSPEC was used to get the best model description of the data and all errors were calculated using = 2.71 criterion i.e. 90% confidence range for one parameter of interest.
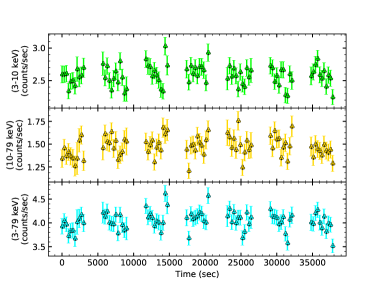
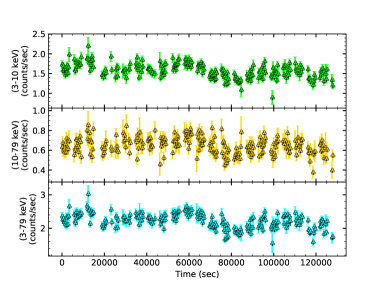
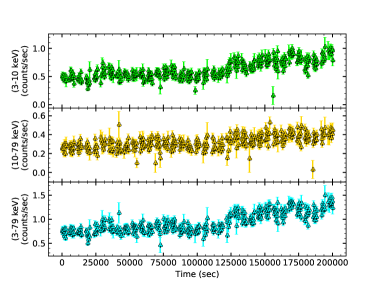
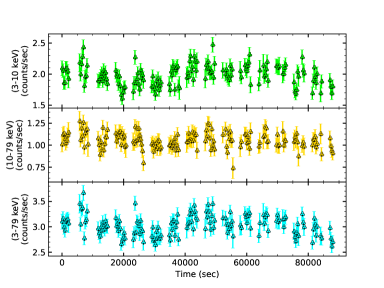
For timing analysis, we generated light curves in the energy ranges of 310 keV (soft-band), 1079 keV (hard band) and 379 keV (total band) in both the focal plane modules using a time bin of 300 seconds. The light curves from the two modules were them combined using the task lcmath available in FTOOLS V6.19.


3 Results
3.1 Timing analysis
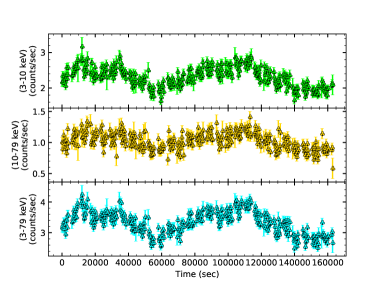
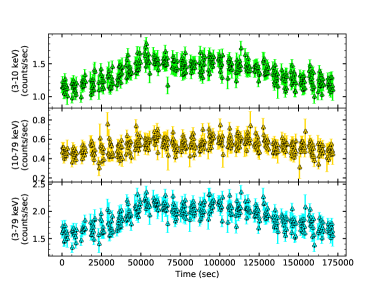
For timing analysis the light curves generated by the procedures outlined in Section 2 was used. They were visually inspected to see any outlier points and for points with very large error bars. To remove both outliers and those with large error bars, for further light curve analysis, the mean and standard deviation of the light curve as well as the mean and standard deviation of the errors were calculated. For each object, only those points satisfying the following two conditions were retained for further analysis, namely, (a) the error on each individual data points should be less than 5 times the standard deviation of the errors (b) the difference between a data point and the mean of the light curve should be less than 5 times the standard deviation of the light curve. The final light curves of the 10 objects studied here are given in Figures 1 3. Among the 10 objects, for three objects namely Mrk 1040, NGC 3783 and Mrk 509, we have two sets of observations (OBSIDs) each, while for the remaining 6 objects we have one OBSID each. Visual inspection of the light curves shown in Figures 1 3 clearly show the objects to be variable. To characterise variability we calculated the normalized excess variance (). (Edelson et al., 2002; Vaughan et al., 2003), gives the intrinsic variation of the source after removal of the measurement errors. Following Vaughan et al. (2003) we define as
| (3) |
where represents the sample variance, is the arithmetic mean of and represents the mean square error. and are given as
| (4) |
| (5) |
The uncertainty in is calculated as
| (6) |
The results of the variability analysis is given in Table 2. From Table 2 it is evident that all sources showed variability in the soft, hard and total bands. The flux variations in the soft band is found to be larger than that of the soft band in six sources. For three objects namely Mrk 348, NGC 7172, and NGC 2992, within error bars the flux variations in the soft and hard bands are similar. For Mrk 509, flux variations in the hard band is larger than the soft band in both the sets of observations. Considering all the sources together, the weighted mean variability amplitude in the soft, hard and total bands are 0.097 0.081, 0.077 0.050 and 0.090 0.064 respectively. Thus within error bars, the mean variability in all the bands are identical. Also, statistical analysis for similarities or differences in the Fvar between soft and hard bands for the whole sample was carried out using the non-parametric Mann-Whitney U test. The null hypothesis that was tested in this U-test is that the distribution of values of soft and hard bands are identical. At any given confidence level, the null hypothesis is rejected if U is less than the critical U-value (). For our sample, we found a U value of 65 and a critical U value of 45. At the = 0.05 significance, as U is greater than , the null hypothesis is not rejected. Thus, considering all the objects as a whole, there is no difference in the flux variability behaviour between soft and hard bands, but when sources are considered individually difference in the flux variations between soft and hard bands is noticed.
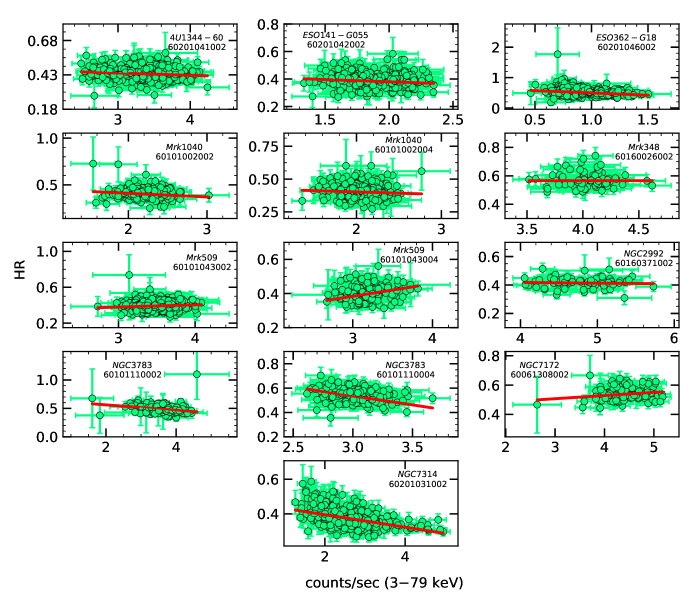
To check for spectral variability in any, we calculated the hardness radio (HR) and plotted it against the count rate in the total energy band of 379 keV. We define HR as HR = where, and are the count rates in the hard and soft bands respectively. The plots of HR v/s the total count rate are shown in Fig. 4. Over plotted on the observations are linear least squares fit the to the data using taking into account the errors in both HR and count-rate. There are indications of spectral variability, with most of the sources showing very weak but insignificant softer when brighter trend. Two sources namely Mrk 509 and NGC 7172 show very weak harder when brighter trend, but again it is insignificant. The only source that showed significant spectral variation is NGC 7314. Linear least squares fit to the data of NGC 7314 shows a mild softer when brighter trend following the relation HR = (0.036 0.003) F3-79keV + (0.467 0.009) with a linear correlation coefficient of 0.53. The softer when brighter trend inferred from timing analysis is also known from spectral studies of AGN, wherein the X-ray spectra of Seyfert galaxies are found to be softer when they are brighter (Ursini et al., 2016).
3.2 Spectral Analysis
Our motivation in this work is to increase the number of AGN with measurements and to check for correlations if any between values and other physical properties of the sources. Therefore, we employed two phenomenological model fits to the data.


3.2.1 Model-1
We first used the simple absorbed power law model TBabszTBabspowlaw to fit each of the AGN spectra. TBabs (Wilms et al., 2000) was used to model the Galactic absorption whereas zTBabs was used to consider the absorption due to host galaxy of the source. For this model, we used Anders & Grevesse (1989) set of solar abundances and the Balucinska-Church & McCammon (1992) photoelectric cross sections. The galactic neutral hydrogen column density was frozen to the value obtained from Dickey & Lockman (1990) for all the sources. In this model the free parameters were the photon index and the normalization. In some of the sources, we found evidence of iron K line and reflection component in the residuals, along with high energy turnover. The fitting results along with the galactic neutral hydrogen column density that was used and frozen during the fit are given in Table 4.
3.2.2 Model-2
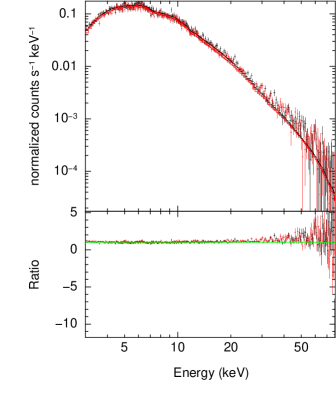
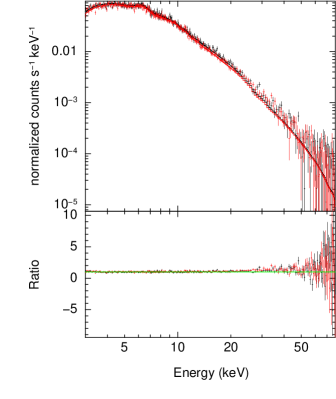
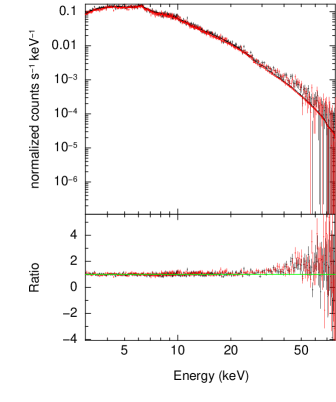
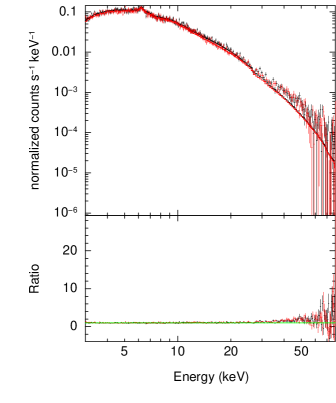
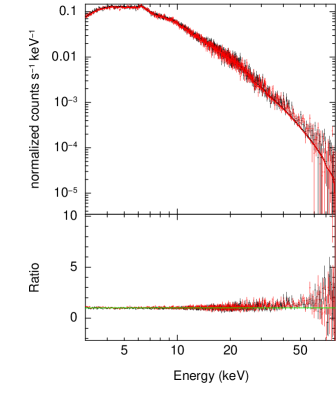
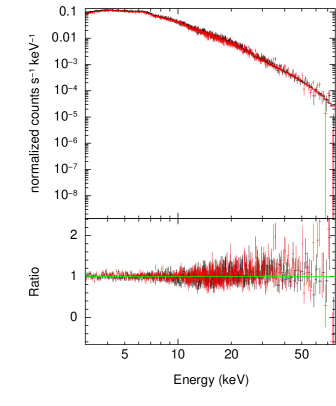
We noticed turnover in the residuals obtained by fitting the model TBabszTBabspowlaw to the data. This clearly suggested of the presence of cut-off in the spectrum. Also, in the residual spectra of simple power law model (model-1) fits to the data there were indications of the presence of the fluorescent Fe K line. This line is present in the X-ray spectra of most of the AGN (Mushotzky et al., 1993), consisting of both broad and narrow components. Therefore, Fe K component was included in the spectral analysis of the sources analysed here. From model-1 fits, we found that for three sources namely Mrk 348, NGC 2992 and NGC 7172, the Fe K line was not visibly in their observed spectra. Therefore, for those three sources, while fitting model-2, the Gaussian component to model the Fe K line was not used, while it was used in the other 7 sources. The parameters of the component that were extracted from the spectral analysis are the peak energy of the line, the width of the line and the normalization. Also, in the observed hard X-ray emission of AGN, both and reflection are believed to play an important role. Therefore to obtain , we replaced the powerlaw in model-1 with the Pexrav component and refitted each AGN spectra. Pexrav (Magdziarz & Zdziarski, 1995) includes both primary emission in the form of a power law with an exponential cut-off and the reflection component, wherein it calculates the spectrum of the X-ray source on reflection from an optically thick neutral slab. In this model, the output parameter , gives a measure of the reflection component present in the observed spectrum. If the source is isotropic, is related to the solid angle as and this value of depends on the angle of inclination between the perpendicular to the accretion disk and the line of sight to the observer. During the spectral fitting, we used the default value of the inclination angle of = 45∘ and abundances present in the model. As is fixed to the default value for all the fitting, the values of derived from the fit only gives an indication of the amplitude of reflection. The nH values for the zTBabs component of the model was frozen to the value obtained from model-1. The components that were left free during this model fit were , peak of the Fe K line, standard deviation of the Fe K line, reflection parameter and normalization for both zguass and pexrav components of the model. The model fit along with the residual spectrum are shown in Figure 5 8 and fitting results are given in Table 5.
In three out of the ten sources analysed here, namely, Mrk 348, NGC 2992 and NGC 7172 Fe K line is not seen. In the standard model of AGN, broad Fe K line is expected to be ubiquitously present in spectra of AGN, however, there are exceptions (Bhayani & Nandra, 2011). The apparent non-detection of Fe K line in the spectra of AGN could be due to them viewed at large angles to the line of sight to the observer subsequently leading to weaker reflection (Bhayani & Nandra, 2011), low signal-to-noise ratio (S/N) spectra, very high ionised accretion disk (Ross & Fabian, 1993; Zycki & Czerny, 1994) or a combination of the above. All the three sources for which Fe K line is not seen here are viewed at larger angles having classification of Sy1h, Sy1.9 and Sy2 in the Véron-Cetty & Véron (2010) catalog respectively. Thus, the apparent lack of Fe K line in them could be due to weaker reflection owing to larger viewing angle, however, more detailed spectral analysis is needed to clearly pin point the causes for the absence of Fe K line in these sources. As the aim of this work is to find , detailed spectral analysis of the sources are not attempted here.

3.2.3 Model-3
While the fits to the spectra using the model TBbszTbabs(zgauss+pexrav) is acceptable, we replaced the Gaussian component in Model-2 with the relativistic line emission model RELLINE (Dauser et al., 2010) and refit the spectra. The parameters obtained using RELLINE model are similar to that obtained using TBbszTbabs(zgauss+pexrav) model. There is negligible improvement in the parameters obtained with Model-2 suggesting little/no blurring. Hence, in all further discussions we consider the parameters obtained by the model TBbszTbabs(zgauss+pexrav).
3.2.4 Reflection parameter
All the 10 sources studied in this work are Seyfert galaxies, however based on Véron-Cetty & Véron (2010) they have varied classifications such as Sy1, Sy1.2, Sy1.5, Sy1.9 and Sy2. Clubbing all sources with classifications up to Sy1.5 as Sy1 galaxies and sources beyond Sy1.5 as Seyfert 2 galaxies, we found two Seyfert 2 galaxies and eight Seyfert 1 galaxies The unweighted mean value of R for the Seyfert 2 galaxies in our sample is 0.58 0.51, while that for the Seyfert 1 galaxy sample, we obtained an unweighted mean value of 1.05 0.66. Given the large error bars, both Sy1 and Sy2 galaxies have similar mean value, however, this large error bar is attributable to the small number statistics. Given this limitation, the mean value of R for Seyfert 2 galaxies points to have a lower value compared to the mean R value of Seyfert 1 galaxies. The decrease of reflection in Seyfert 2 relative to Seyfert 1 galaxies would be in agreement with the Unification scenario (Urry & Padovani, 1995). Reprocessing in AGN is from the accretion disk and for Seyfert 1 galaxies that are observed pole on, we are able to see more of the reprocessed radiation, while in Seyfert 2 galaxies that are observed edge on, the reprocessed component is expected to be less. From an analysis of Swift/BAT spectra for a large sample of AGN, Ricci et al. (2017) found obscured sources to have less values of compared to their counterparts that are seen pole on.Thus our results on , though suffer from small number statistics are in agreement with that found by Ricci et al. (2017) from an analysis of the spectra taken from Swift/BAT for a larger number of sources. However, from an analysis of the stacked Swift/BAT spectra, Vasudevan et al. (2013b) found that obscured sources have more reflection component than their unobscured counterparts. The origin of this difference between the values obtained from spectral analysis of individual sources and analysis of the stacked spectra of different categories of sources is not clear.
3.2.5 Photon index
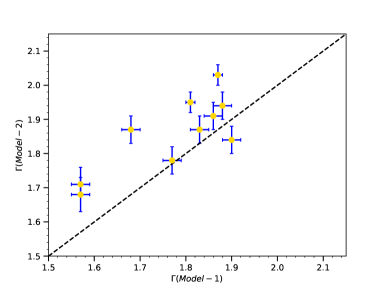
The photon indices obtained by both the model fits ranged between 1.57 to 2.03. Comparing the photon indices obtained from both the model fits, we noticed that the obtained by model-1 (a simple power law fit) is flatter than the obtained from model-2 for all the sources except 1, namely NGC 2992. The steeper obtained from model-2 is also consistent with the observations of the presence of high energy cut-off in most of the AGN. Unweighted mean values obtained from both model-1 and model-2 are 1.77 0.12 and 1.86 0.10 respectively. The plot of the obtained from model-1 against obtained from model-2 is shown in Fig. 9. Also, shown in the same figure is a line of unity slope. It is very clear from the Figure, that the from model-2 is steeper than the obtained from model-1.
3.2.6 Cut-off energy
Of the 10 sources analysed here, we obtained for 8 sources, for one source a lower limit is obtained while for one source, we could not constrain . For sources for which we were able to obtain , the obtained values range between 160 keV 63 keV. For 4 sources in our sample, the obtained values were less than 80 keV and is within the energy range for which NuSTAR is sensitive. For our sample of 8 sources, we found a mean value of 95 keV with a standard deviation of 32 keV. This is lower than that obtained by Malizia et al. (2014), who on analysis of 41 AGN found a mean value of 128 keV and a standard deviation of 46 keV. This comparison needs to be taken with caution as changes in the values, that reflect coronal temperature variations are also noticed for sources when observed at different times (Zoghbi et al., 2017; Zhang et al., 2018).
3.3 Correlation of with other parameters
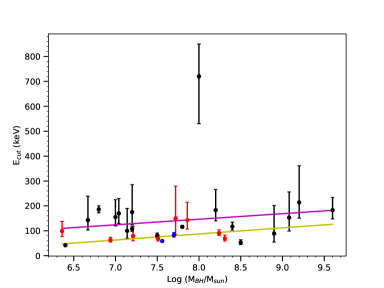
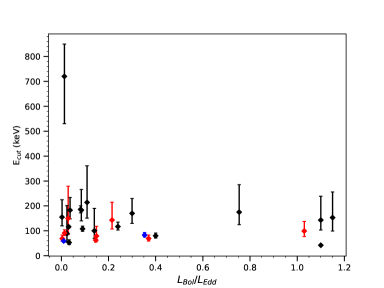
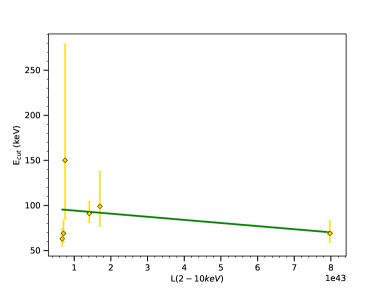
By modelling the observed X-ray spectra of 10 AGN using data from NuSTAR using an empirical description of the observations as a power law with an exponential cut-off, we were able to derive for 10 sources. Out of the 10 sources, we could obtain for 8 sources, and a lower limit for one source. Using these new measurements along with data for other sources culled from literature that has NuSTAR measurements, we could collect data for a total of 30 sources. The values for this enlarged complete sample, range from 1.6 to 2.4, while the take values lesser then 250 keV, except for one sources namely NGC 5506 having a value of . This range of from NuSTAR also lies in the range of values obtained from non-focussing instruments such as BeppoSAX and INTEGRAL. However, the values of from NuSTAR have low errors compared to the values obtained from earlier missions operating in the energy range similar to NuSTAR. This is likely due to the high sensitivity of NuSTAR compared to earlier missions. For these 30 sources with quality measurements from NusTAR, we tried to look for correlation if any between and various properties of the sources, such as , BH mass and Eddington ratio. We obtained a complicated pattern between and . This is shown in Fig. 10. For sources with less than 1.78, we found a positive correlation (correlation coefficient = 0.6) between and , while if we consider sources with 1.78 < < 2.0, we found a negative correlation (correlation coefficient = 0.6) between and . Beyond > 2.0, no trend of with is noticed, however, this apparent no-correlation is based on three sources. Thus this analysis gives indications of the existence of complicated correlation between and . Though the reasons for this complicated behaviour is not clear presently, the existence of it too needs to be confirmed from more precise measurements of on a larger number of sources. For the sources lying in the negative correlation line in the versus diagram, we plot in Fig. 11 the of those sources against their luminosity in the 210 keV band. We noticed a weak negative correlation with a correlation coefficient of 0.3 wherein sources with low have larger luminosity. This behaviour can be explained due to electrons in the corona being more effectively cooled via Comptonization in luminous sources, thereby leading to low as well as steeper (Zhang et al., 2018). From BeppoSAX measurement of nine sources, using data in the range of 0.1 200 keV, Perola et al. (2002) found for the first time a strong positive correlation between and . In their sample of nine sources, two have lower limits and some from the remaining seven have large error bars. From simulated Swift/BAT data Ricci et al. (2017) found a negative correlation between and while Tortosa et al. (2018b) using a sample of 19 sources, found no correlation between and . We also looked for correlation between and Eddington ratio ( = /). To estimate for our sources we calculated the intrinsic (absorption corrected and -corrected) continuum luminosity in 2 10 keV using the following relation
| (7) |
where is the absorption corrected 210 keV flux and is the luminosity distance. From , was calculated as (Vasudevan & Fabian, 2007). We did not find any correlation between and Eddington ratio. The correlation between and BH mass is shown in the top panel of Fig. 10. Also, shown in the same figure are unweighted linear least squares fit (magenta line) and weighted linear least squares fit (yellow line). There is an indication of a weak positive correlation.
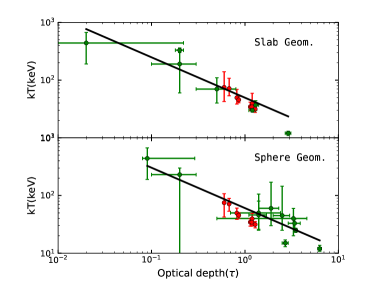
Recently, Tortosa et al. (2018b) found an anti-correlation between the coronal temperature and optical depth () from an analysis of a sample of Seyfert galaxies. We in this work have first time measurement of for eight Seyfert galaxies. We tried to investigate the location of our eight new sources in the plane and see if they lie on the trend found by Tortosa et al. (2018b). To calculate we used the approximation given by Pozdniakov et al. (1979) as
| (8) |
Similarly for , we used (Petrucci et al., 2001). We show in Fig. 12 the location of our sources in the versus plane both for slab and spherical geometry of the corona. Also, shown in the same figure are the sources with measurements from Tortosa et al. (2018b) as well as the relation found by Tortosa et al. (2018b) separately for the slab and spherical geometry. Our sources nicely lie in the trend found by Tortosa et al. (2018b).

.
3.4 Location of sources in the plane
We have Ecut measurements for eight sources. To plot the location of our sources in the - plane we converted out Ecut measurements to using Equation (2) given in Section 1, where we used = (Petrucci et al., 2001). Similarly for calculating we used Equation (1). Here, for the coronal radius we assumed a value of 10 (Fabian et al., 2015), as we do not have any measurement of the coronal size for our sources. For the luminosity of the sources, we used the absorption corrected 0.1200 keV flux obtained from our spectral fits and converted to luminosity using the luminosity distance. Black hole masses for the sources were taken from literature. We show in Fig. 13 the location of our sources in the plane. Also shown in the same diagram is the pair line for a slab geometry (Stern et al., 1995; Fabian et al., 2015). All the sources for which has been derived in this work lie within the theoretical pair line, similar to that found by Fabian et al. (2015) and Kamraj et al. (2018).
4 Summary and conclusion
We have carried out X-ray spectral and timing analysis of a sample of 10 sources, using data from NuSTAR. The aims of this work are two fold (a) to provide new measurements of in AGN and (b) look for correlations between values obtained only from NuSTAR data and other physical parameters of the sources. The results of this work are summarized below
-
1.
All the sources showed flux variations in, soft, hard and the total bands. For 6 out of 10 sources, the amplitude of flux variations in the soft band is larger than that of the hard band. Three sources, namely Mrk 348, NGC 2992 and NGC 7172 show similar variation in both hard and soft bands, while in one source, Mrk 509, the variation in the hard band is larger than that of the soft band. Though differences in flux variability between soft and hard bands were noticed in individual sources, for the complete sample analysed here statistically there is no difference between the flux variations in the hard and soft bands.
-
2.
The HR was used as a proxy to characterise the spectra of the sources. No correlation of the HR with flux variations in the total band was found for the sources, except one, indicating that the spectra were non-variable during NuSTAR observations. For NGC 7314, we found a softer when brighter trend with a correlation coefficient of 0.53.
-
3.
In seven out of 10 sources, FeK line was found, while for three sources, namely Mrk 348, NGC 2992 and NGC 7172, FeK line could not be seen in their spectra.
-
4.
Among the ten sources whose spectra were analysed, values were obtained for eight sources. For one sources, ESO 362-G18, a lower limit to the value was estimated, while for NGC 7314, our spectral fits did not yield any value.
-
5.
Using the new values obtained in this work along with those collected from literature, we could gather measurements for 30 sources. In this enlarged sample of 30 sources, we found no correlation between and and and . However, we noticed a complicated correlation between and . For values of less than 1.78, is positively correlated with , while for values between 1.78 and 2.0, is negatively correlated with .
Though there has been an increase in the number of AGN with measurements from NuSTAR, it is still insufficient. Therefore, to study various correlations and to put any constraints on the theory based on observations the number of measurements need to be increased. This also requires physical model fits to the observed data to infer many other parameters of the system, rather than phenomenological model fits, requiring high quality data from NuSTAR.
Acknowledgements
This research made use of data from the NuSTAR mission, a project led by the California Institute of Technology, managed by the Jet Propulsion Laboratory, and funded by NASA, XMM-Newton, an ESA science mission with instruments and contributions directly funded by ESA Member States and NASA. This research has made use of the NuSTAR Data Analysis Software (NuSTARDAS) jointly developed by the ASI Science Data Center (ASDC, Italy) and the California Institute of Technology (USA).
References
- Anders & Grevesse (1989) Anders E., Grevesse N., 1989, Geochimica Cosmochimica Acta, 53, 197
- Arnaud (1996) Arnaud K. A., 1996, in Jacoby G. H., Barnes J., eds, Astronomical Society of the Pacific Conference Series Vol. 101, Astronomical Data Analysis Software and Systems V. p. 17
- Ballantyne et al. (2014) Ballantyne D. R., et al., 2014, ApJ, 794, 62
- Baloković et al. (2015) Baloković M., et al., 2015, ApJ, 800, 62
- Balucinska-Church & McCammon (1992) Balucinska-Church M., McCammon D., 1992, ApJ, 400, 699
- Bhayani & Nandra (2011) Bhayani S., Nandra K., 2011, MNRAS, 416, 629
- Brenneman et al. (2014) Brenneman L. W., et al., 2014, ApJ, 781, 83
- Buisson et al. (2018) Buisson D. J. K., Fabian A. C., Lohfink A. M., 2018, MNRAS, 481, 4419
- Chartas et al. (2009) Chartas G., Kochanek C. S., Dai X., Poindexter S., Garmire G., 2009, ApJ, 693, 174
- Dadina (2007) Dadina M., 2007, A&A, 461, 1209
- Dauser et al. (2010) Dauser T., Wilms J., Reynolds C. S., Brenneman L. W., 2010, MNRAS, 409, 1534
- Dickey & Lockman (1990) Dickey J. M., Lockman F. J., 1990, ARA&A, 28, 215
- Dove et al. (1997) Dove J. B., Wilms J., Maisack M., Begelman M. C., 1997, ApJ, 487, 759
- Edelson et al. (2002) Edelson R., Turner T. J., Pounds K., Vaughan S., Markowitz A., Marshall H., Dobbie P., Warwick R., 2002, ApJ, 568, 610
- Fabian (1999) Fabian A. C., 1999, Proceedings of the National Academy of Science, 96, 4749
- Fabian et al. (2002) Fabian A. C., Ballantyne D. R., Merloni A., Vaughan S., Iwasawa K., Boller T., 2002, MNRAS, 331, L35
- Fabian et al. (2009) Fabian A. C., et al., 2009, Nature, 459, 540
- Fabian et al. (2015) Fabian A. C., Lohfink A., Kara E., Parker M. L., Vasudevan R., Reynolds C. S., 2015, MNRAS, 451, 4375
- Guilbert et al. (1983) Guilbert P. W., Fabian A. C., Rees M. J., 1983, MNRAS, 205, 593
- Haardt & Maraschi (1991) Haardt F., Maraschi L., 1991, ApJ, 380, L51
- Haardt et al. (1994) Haardt F., Maraschi L., Ghisellini G., 1994, ApJ, 432, L95
- Haardt et al. (1997) Haardt F., Maraschi L., Ghisellini G., 1997, ApJ, 476, 620
- Harrison et al. (2013) Harrison F. A., et al., 2013, ApJ, 770, 103
- Johnson et al. (1997) Johnson W. N., McNaron-Brown K., Kurfess J. D., Zdziarski A. A., Magdziarz P., Gehrels N., 1997, ApJ, 482, 173
- Kamraj et al. (2018) Kamraj N., Harrison F. A., Baloković M., Lohfink A., Brightman M., 2018, ApJ, 866, 124
- Kara et al. (2013) Kara E., Fabian A. C., Cackett E. M., Uttley P., Wilkins D. R., Zoghbi A., 2013, MNRAS, 434, 1129
- Kara et al. (2017) Kara E., Garcia J. A., Lohfink A., Fabian A. C., Reynolds C. S., Tombesi F., Wilkins D. R., 2017, preprint, (arXiv:1703.09815)
- Lanzuisi et al. (2016) Lanzuisi G., et al., 2016, Astron. Astrophys., 590, A77
- Lohfink et al. (2015) Lohfink A. M., et al., 2015, ApJ, 814, 24
- Lohfink et al. (2017) Lohfink A., et al., 2017, preprint, (arXiv:1704.03673)
- Lubiński et al. (2010) Lubiński P., Zdziarski A. A., Walter R., Paltani S., Beckmann V., Soldi S., Ferrigno C., Courvoisier T. J.-L., 2010, MNRAS, 408, 1851
- Lubiński et al. (2016) Lubiński P., et al., 2016, MNRAS, 458, 2454
- Magdziarz & Zdziarski (1995) Magdziarz P., Zdziarski A. A., 1995, MNRAS, 273, 837
- Malizia et al. (2014) Malizia A., Molina M., Bassani L., Stephen J. B., Bazzano A., Ubertini P., Bird A. J., 2014, ApJ, 782, L25
- Matt et al. (2015) Matt G., et al., 2015, MNRAS, 447, 3029
- McHardy et al. (2005) McHardy I. M., Gunn K. F., Uttley P., Goad M. R., 2005, MNRAS, 359, 1469
- Middei et al. (2018) Middei R., et al., 2018, A&A, 615, A163
- Mushotzky et al. (1993) Mushotzky R. F., Done C., Pounds K. A., 1993, ARA&A, 31, 717
- Nicastro et al. (2000) Nicastro F., et al., 2000, ApJ, 536, 718
- Perola et al. (2002) Perola G. C., Matt G., Cappi M., Fiore F., Guainazzi M., Maraschi L., Petrucci P. O., Piro L., 2002, A&A, 389, 802
- Petrucci et al. (2001) Petrucci P. O., et al., 2001, ApJ, 556, 716
- Petrucci et al. (2013) Petrucci P.-O., et al., 2013, A&A, 549, A73
- Porquet et al. (2018) Porquet D., et al., 2018, Astron. Astrophys., 609, A42
- Poutanen et al. (1997) Poutanen J., Svensson R., Stern B., 1997, in Winkler C., Courvoisier T. J.-L., Durouchoux P., eds, ESA Special Publication Vol. 382, The Transparent Universe. p. 401 (arXiv:astro-ph/9701168)
- Pozdniakov et al. (1979) Pozdniakov L. A., Sobol I. M., Siuniaev R. A., 1979, Pisma v Astronomicheskii Zhurnal, 5, 279
- Rani & Stalin (2018a) Rani P., Stalin C. S., 2018a, Journal of Astrophysics and Astronomy, 39, 15
- Rani & Stalin (2018b) Rani P., Stalin C. S., 2018b, ApJ, 856, 120
- Rees (1984) Rees M. J., 1984, ARA&A, 22, 471
- Ricci et al. (2011) Ricci C., Walter R., Courvoisier T. J.-L., Paltani S., 2011, A&A, 532, A102
- Ricci et al. (2017) Ricci C., et al., 2017, ApJS, 233, 17
- Ricci et al. (2018) Ricci C., et al., 2018, MNRAS, 480, 1819
- Risaliti et al. (2005) Risaliti G., Elvis M., Fabbiano G., Baldi A., Zezas A., 2005, ApJ, 623, L93
- Risaliti et al. (2011) Risaliti G., Nardini E., Salvati M., Elvis M., Fabbiano G., Maiolino R., Pietrini P., Torricelli-Ciamponi G., 2011, MNRAS, 410, 1027
- Ross & Fabian (1993) Ross R. R., Fabian A. C., 1993, MNRAS, 261, 74
- Rybicki & Lightman (1979) Rybicki G. B., Lightman A. P., 1979, Radiative processes in astrophysics
- Shakura & Sunyaev (1973) Shakura N. I., Sunyaev R. A., 1973, A&A, 24, 337
- Stern et al. (1995) Stern B. E., Poutanen J., Svensson R., Sikora M., Begelman M. C., 1995, ApJ, 449, L13
- Tazaki et al. (2010) Tazaki F., Ueda Y., Ishino Y., Eguchi S., Isobe N., Terashima Y., Mushotzky R. F., 2010, ApJ, 721, 1340
- Tazaki et al. (2011) Tazaki F., Ueda Y., Terashima Y., Mushotzky R. F., 2011, ApJ, 738, 70
- Tortosa et al. (2016) Tortosa A., et al., 2016, preprint, (arXiv:1612.05871)
- Tortosa et al. (2018a) Tortosa A., et al., 2018a, Monthly Notices of the Royal Astronomical Society, 473, 3104
- Tortosa et al. (2018b) Tortosa A., Bianchi S., Marinucci A., Matt G., Petrucci P. O., 2018b, Astron. Astrophys., 614, A37
- Urry & Padovani (1995) Urry C. M., Padovani P., 1995, PASP, 107, 803
- Ursini et al. (2015) Ursini F., et al., 2015, MNRAS, 452, 3266
- Ursini et al. (2016) Ursini F., et al., 2016, MNRAS, 463, 382
- Vasudevan & Fabian (2007) Vasudevan R. V., Fabian A. C., 2007, MNRAS, 381, 1235
- Vasudevan & Fabian (2009) Vasudevan R. V., Fabian A. C., 2009, MNRAS, 392, 1124
- Vasudevan et al. (2013a) Vasudevan R. V., Brandt W. N., Mushotzky R. F., Winter L. M., Baumgartner W. H., Shimizu T. T., Schneider D. P., Nousek J., 2013a, ApJ, 763, 111
- Vasudevan et al. (2013b) Vasudevan R. V., Mushotzky R. F., Gandhi P., 2013b, ApJ, 770, L37
- Vaughan et al. (2003) Vaughan S., Edelson R., Warwick R. S., Uttley P., 2003, MNRAS, 345, 1271
- Véron-Cetty & Véron (2010) Véron-Cetty M.-P., Véron P., 2010, A&A, 518, A10
- Wilms et al. (2000) Wilms J., Allen A., McCray R., 2000, ApJ, 542, 914
- Woo & Urry (2002) Woo J.-H., Urry C. M., 2002, ApJ, 579, 530
- Zdziarski et al. (1996) Zdziarski A. A., Johnson W. N., Magdziarz P., 1996, MNRAS, 283, 193
- Zdziarski et al. (2000) Zdziarski A. A., Poutanen J., Johnson W. N., 2000, ApJ, 542, 703
- Zhang et al. (2018) Zhang J.-X., Wang J.-X., Zhu F.-F., 2018, ApJ, 863, 71
- Zoghbi et al. (2017) Zoghbi A., et al., 2017, ApJ, 836, 2
- Zycki & Czerny (1994) Zycki P. T., Czerny B., 1994, MNRAS, 266, 653