Adhesive wear mechanisms in the presence of weak
interfaces:
Insights from an amorphous model system
Abstract
Engineering wear models are generally empirical and lack connections to the physical processes of debris generation at the nanoscale to microscale. Here, we thus analyze wear particle formation for sliding interfaces in dry contact with full and reduced adhesion. Depending on the material and interface properties and the local slopes of the surfaces, we find that colliding surface asperities can either deform plastically, form wear particles, or slip along the contact junction surface without significant damage. We propose a mechanism map as a function of material properties and local geometry, and confirm it using quasi-two-dimensional and three-dimensional molecular dynamics and finite-element simulations on an amorphous, siliconlike model material. The framework developed in the present paper conceptually ties the regimes of weak and strong interfacial adhesion together and can explain that even unlubricated sliding contacts do not necessarily lead to catastrophic wear rates. A salient result of the present paper is an analytical expression of a critical length scale, which incorporates interface properties and roughness parameters. Therefore, our findings provide a theoretical framework and a quantitative map to predict deformation mechanisms at individual contacts. In particular, contact junctions of sizes above the critical length scale contribute to the debris formation.
I Introduction
Contacting solids in relative motion wear, i.e., they gradually lose volume. Such volume loss is inextricably linked to the roughness and the details of the contact between the two surfaces Bowden and Tabor (1939); Rabinowicz and Tabor (1951); Burwell and Strang (1952); Archard (1953). In the case of adhesive wear, contacting surface asperities form a bond that leads to the detachment of wear particles during sliding, which are progressively evacuated from the system if they become loose Burwell and Strang (1952); Archard (1953); Rabinowicz (1958). While such wear particles and the debris layer they form (collectively called the third body Godet (1984, 1990)) were already observed experimentally a long time ago Godet (1984), the process of their creation is still under discussion. Such an understanding is essential, though, to establish predictive wear laws Aghababaei et al. (2017); Frérot et al. (2018); Molinari et al. (2018), which are currently still limited to empirical formulas that are not universally applicable Meng and Ludema (1995).
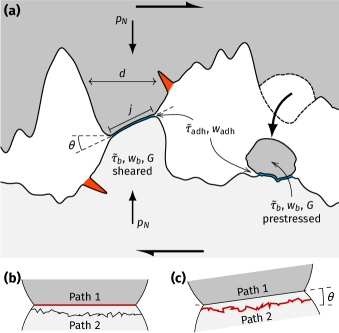
Rabinowicz proposed a scenario in which particles become detached from one of the surfaces and might stick to the other [Fig. 1(a) right], possibly growing and becoming fully loose later on Rabinowicz (1958, 1964, 1995). Similar to Griffith’s concept of a critical crack length for unstable crack propagation Griffith (1921), one can define a minimum size a wear particle needs to have before it can break off by fracture or detach from a surface it is sticking to. This theoretical argument, though, contains no notion of the asperity collision process and consequently does not describe a shearing process as pictured in Fig. 1(a) left. Furthermore, it ignores the process proposed by Holm Holm (1967), in which plastic deformation of the asperities is responsible for wear. Recently, these theories were combined and extended for the initial particle formation [Fig. 1(a) left], by formulating a critical length scale in terms of a competition between plastic deformation of an asperity under load and its breaking off Aghababaei et al. (2016). In addition to predicting a minimum size of wear particles, it also provides a way to understand surface roughness evolution Milanese et al. (2019): Purely plastic deformation of asperities has been found to mostly flatten the surfaces or lead to welding Sørensen et al. (1996); Spijker et al. (2011); Pastewka et al. (2011); Zhong et al. (2013); Sha et al. (2013); Stoyanov et al. (2014); De Barros Bouchet et al. (2015), while the breaking off of wear particles seems to be the ingredient to reroughen worked surfaces Milanese et al. (2019), although surface kinks due to dislocation plasticity have also been suggested as sources of roughness Venugopalan and Nicola (2019). The critical length scale is most generally defined as
| (1) |
where is the effective fracture energy and is the elastic energy density of an asperity with shear modulus when it is loaded to its elastic shear limit Aghababaei et al. (2016). The length refers to the diameter of spherical asperities, where asperities with deform plastically and those with form wear particles. The prefactor is a shape factor (see Appendix A), which includes information about the actual shape of the asperities and the geometry of the crack that leads to their detachment. The value of the effective fracture energy depends on the case. For the initial detachment [Fig. 1(a) left], two cracks in the material bulk are needed and thus , i.e., the bulk fracture energy. For the detachment of a sticking particle it is , which is the adhesive energy. The details of will be discussed in the course of the present paper.
This model, though, neglects the fact that the interface formed between asperities is usually mechanically weaker than the bulk. This might be because the junction can effectively be thought of as a grain boundary, or due to surface contamination and chemical passivation, or even the presence of lubricants. In such a case, it would seem reasonable that any fracture occurs along the weaker interface [path 1 in Fig. 1(b)], as has been pointed out before Rabinowicz (1995). Since that would preclude the formation of wear particles, several improvements of this simple picture were proposed: If the junction interface has a well-defined yield stress , it has been suggested Aghababaei et al. (2016) that one simply needs to insert it into Eq. 1 instead of the bulk yield stress , thereby just increasing . An alternative solution is to take into account that the junction interface is inclined with respect to the sliding direction in most cases Komvopoulos et al. (1985), which suggests that the resulting stress distribution might favor fracture in the bulk based on the inclination angle [Fig. 1(c)]. Indeed, some early work on macroscopic junction models supports the latter hypothesis Feng (1952); Green (1955); Greenwood and Tabor (1955), but is based on macroscale friction at the interface, which is not applicable on the relevant atomistic scales at junctions. Furthermore, the possibility of wear by atom-by-atom attrition has been found in some ultralow wear conditions Erdemir and Donnet (2006); Jacobs et al. (2010); Bhaskaran et al. (2010); Scharf and Prasad (2013); Zeng et al. (2016); Curry et al. (2018). It seems reasonable to assume that this process occurs when both wear particle formation and severe plastic deformation of the surface are suppressed and the surfaces just slip past each other, but this cannot be explained by the theory described above, since any adhesive contact in this framework either leads to wear particle formation or non-negligible plasticity. Ultralow wear can only take place when both of these mechanisms are disabled.
In the present paper, we therefore reevaluate the elemental processes of adhesive wear, by now considering both the strength of the interface and its local inclination , as well as add slip along the interface to the mechanism map. The competition between plastic deformation inside the asperities, wear particle formation, and slip can account for more realistic conditions with reduced wear, such as lubrication and surface passivation. We develop a simple stress-based model and test it using molecular dynamics (MD) and the finite-element method (FEM) in both plane-strain and full three-dimensional (3D) simulations. In particular, we consider the question of the nature of interface slip: Is it plasticlike with a defined yield strength or is it cracklike and activated by stress concentrations?
II Theoretical model
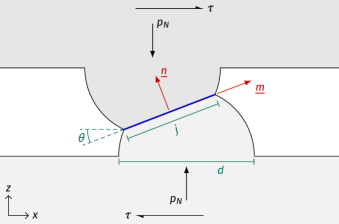
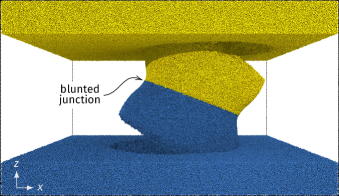
We consider the case of the initial detachment of a wear particle [Fig. 1(a) left], for which we assume a simplified geometry of spherical asperities as shown in Fig. 2. The basic idea of the critical length scale model Aghababaei et al. (2016) is that the surfaces keep sliding against each other, loading the asperities in shear, resulting in a shear stress . At some point either the yield stress of the material is reached and the asperity deforms plastically, or enough elastic energy is stored in the asperity to open a crack and detach a wear particle. This picture needs to be extended, though, in order to be able to describe slip events at the junction interfaces, which differ from the plastic deformation of the asperities by causing little damage in the material, and which might occur in lubricated or ultralow wear conditions. Furthermore, as shown in Fig. 1(b), it is not clear why fracture in the bulk should be preferred to slip along the weak interface, especially since the latter usually has a reduced adhesive energy.
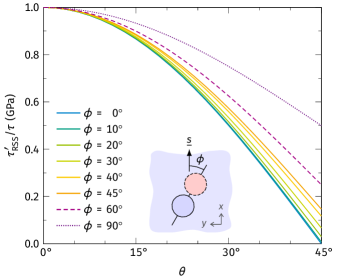
In order to model this, we keep the structure of Eq. 1, but will derive a more complete expression for the critical stress . As can be seen in Fig. 2, slip events will be limited to the plane with normal vector in a slip direction perpendicular to it. Thus, we have to consider a resolved shear stress on the interface, similar to a generalized Schmid factor Gottstein (2004). We assume that the asperities are loaded in shear by the sliding and that an additional normal stress is applied. This normal stress is generally not equal to the macroscopically applied load and depends on the actual, local contact solution. The stress state in the junction is then assumed to be
| (2) |
(Note that is compressive for asperities in contact and thus negative.) With
| (3) |
this results in a resolved shear stress of
| (4) |
A negative would mean that the asperities are driven to slide against the macroscopic sliding direction. In this case the sliding mechanism is not active because increases with the sliding distance while the asperities interlock and will thus increasingly compensate for any “backsliding” caused by , which is assumed to be constant. For , the slip mode is thus always disabled and the asperities interlock. Here, only plastic deformation in the bulk is expected. In fact, the switch from slippage to interlock occurs at a critical angle , which depends on the normal load and the material properties.
Of course, in a real contact, the normal vector of the junction is not constrained to the plane. Due to the imposed sliding direction, though, the slip direction is constrained in this manner. Hence, the effect on the resolved shear stress is relatively minor as long as the out-of-plane rotation is lower than , as shown in Appendix B. Higher rotation angles should rather be interpreted as asperities passing by each other.
II.1 The crossover angle
Usually, the strength of the adhesive interface is smaller than or equal to the bulk yield strength . Sliding will be preferred over bulk plasticity if . Thus, if the interface strength equals or exceeds the bulk strength, sliding is never possible. For all other cases, by solving Eq. 4 with and , we obtain the crossover angle
| (5) |
Using the “plus” sign gives positive angles. We do not discuss here, since asperity collisions during sliding are frontal. Such a case might nonetheless occur at the onset of sliding, or when the sliding direction changes, but then we expect the adhesive strength to dominate, especially since slip is aided by the normal load instead of suppressed.
II.2 A refined critical length scale
For the moment, we will assume that a well-defined yield strength for the interface exists. As such, we can retain Eq. 1 by using a modified critical strength to obtain an angle and load-dependent critical length scale
| (6a) | |||
| (6b) | |||
In some special cases is constant and Eq. 1 is recovered: For full adhesion (, noting that ), we always obtain . This means that the slip mechanism is disabled and we recover the originally proposed formula Aghababaei et al. (2016), where is independent of and . The same is true for . For , i.e., grazing incident, there is also no dependence on and the bulk shear strength is simply replaced by the interface shear strength.
III Verification using molecular dynamics simulations
III.1 Methods and atomistic model
We used MD simulations in order to test and refine the proposed model. We chose an amorphous model material, a siliconlike glass, since worn surfaces often exhibit amorphous top layers Scherge et al. (2003) and because we want to avoid the complications of crystal anisotropy for the present paper. Additionally, glasses plastically deform by shear banding Talati et al. (2009); Fusco et al. (2010); Falk and Langer (2011); Greer et al. (2013), which is known to have a well-defined yield strength that does not vary significantly in the presence of (flat) surfaces Cheng and Ma (2011); Albe et al. (2013). Dislocation nucleation, on the other hand, is very sensitive to the nature of interfaces and to size effects Gottstein (2004), making an exact yield strength less accessible for the complex geometry of asperities Venugopalan and Nicola (2019).
To be able to study a large number of geometries, we need to reduce the computational requirements and thus need a brittle material (small ); in our case a siliconlike model material. There is a large choice of potentials for silicon, but most of them suffer from an unphysical ductility Holland and Marder (1998a, b); Pastewka et al. (2008, 2012). State-of-the-art potentials fixing this problem exist in the form of screened bond-order potentials Pastewka et al. (2013), but in our testing the computational cost is at least an order of magnitude higher than Stillinger–Weber Stillinger and Weber (1985) or Tersoff-type Tersoff (1988) potentials. Instead, we opted for a modified Stillinger–Weber potential Holland and Marder (1998b), in which the three-body parameter (which governs the bond directionality or stiffness of bond angles) has been doubled from 21 to 42, improving the description of fracture at the cost of other properties Holland and Marder (1998b). While not suitable to accurately describe real silicon, the tunable brittleness of this model has proven useful to study fracture Holland and Marder (1998a, b); Hauch et al. (1999); Holland and Marder (1999), as well as the plastic behavior Fusco et al. (2010, 2014); Shi et al. (2014) and the vibrational properties of glasses Beltukov et al. (2016).
All our simulations were performed with lammps Plimpton (1995), using a timestep of for the integration of the equations of motion. Glass samples were prepared following the procedure in Ref. Fusco et al., 2010: The system was quenched under full periodic boundary conditions from the melt at down to at ambient pressure with a cooling rate of , after which energy minimization was performed, yielding a system of size with around 400,000 atoms. This initial preparation was performed with the Tersoff potential for silicon Tersoff (1988), since using the Stillinger–Weber potential during quenching is known to lead to a glass structure that is too liquidlike in comparison Ishimaru et al. (1997); Demkowicz and Argon (2005); Fusco et al. (2010). To obtain the final sample, the system was equilibrated at and ambient pressure for with the modified Stillinger–Weber potential. The resulting sample has a density of , Young’s modulus of , Poisson’s ratio of , shear modulus , and surface energy .
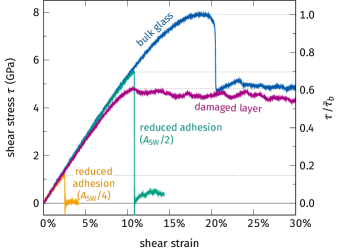
For reducing the interface strength, we considered two approaches. First, we used a modified potential for interactions between the two sliding bodies, in which we reduced the two-body Stillinger–Weber parameter to half or a quarter of its bulk value. This leads to a decreased adhesion energy and reduced yield strength under shear. Second, we randomly removed 20% of atoms in the interface in a layer of 1-nm thickness, leading to a disturbed short-range order as it would occur in a shear band Ritter and Albe (2012). We investigated the behavior of these interfaces by a shear test on a bulk sample under periodic boundary conditions with a shear rate of . Figure 3 shows the resulting stress–strain curves and snapshots are provided in Fig. S.1 sup . The bulk material deforms by shear banding, as expected, connected to the typical, rate-dependent stress overshoot Schuh et al. (2007). Reduction of the adhesive energy leads to a complete loss of shear strength at the onset of sliding, since the energetic cost of plasticity in the neighboring bulk is higher than for separation of the interfaces during slip (evidenced by a reduced coordination number of silicon atoms at the interface and a lack of plastic events in the bulk), leading to a relatively “brittle” stick-to-slip transition. The damaged layer, however, is close in its behavior to the unmodified bulk material after the onset of plasticity and shows only a slight softening. Since slip along interfaces can be thought of as shear banding, these shear curves can be used as an accurate description of the material behavior in the junctions of our asperity-contact geometries.
For the sliding simulations, we used the geometry of Fig. 2 in both quasi-two-dimensional (2D) plane-strain conditions and in three dimensions, while varying , , , and the interface. We kept the junction size fixed to , except for , where we chose to avoid overlap between the asperities and the opposite surface. The geometry was cut out of the bulk glass (repeated periodically as necessary) in order to allow for an intact short-range order in the interface. Boundary conditions in and were periodic. We ensured that the bulk part of the surfaces extended at least a length of from the asperities in all directions, except for the largest 3D simulations (), where we compromised system size for computational feasibility. The systems were equilibrated for at and then a normal force was applied to a top and bottom layer (width ) of atoms in the direction to obtain the desired at the junction. A sliding velocity of was chosen and applied at the top boundary, while the bottom boundary was kept fixed in and directions. Langevin thermostats at with a damping constant of were applied next to these boundary layers over a width of .
III.2 Results in plane strain
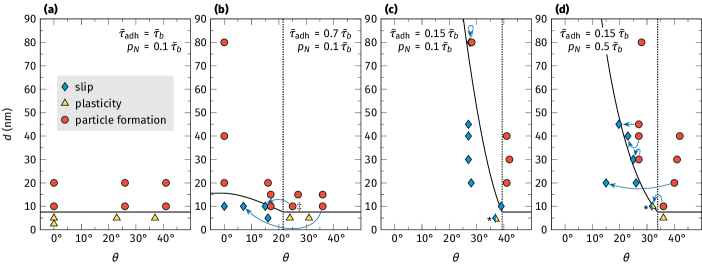
In a first step, we performed plane-strain simulations on cylindrical asperities in a quasi-2D geometry with a thickness of [see Fig. 4(a)]. While the critical length scale as defined by Eq. 6 contains no fit parameters, it was found in an earlier 2D study Aghababaei et al. (2016) that the shape factor is closer to than to the predicted value of . Therefore, we started by performing simulations with full adhesion for different . According to Eq. 6, we expect no influence of the contact angle, since and thus , meaning that no slip is expected. Indeed, as plotted in Fig. 5(a), we found for all that asperities smaller than deform plastically, while larger asperities detach to form wear particles. Since the fracture of the material is close to perfectly brittle [see Fig. 4(d)], we assume that . Together with the other material parameters and , and by using Eq. 6, we derive a value of , consistent with the earlier findings Aghababaei et al. (2016).
Subsequent simulations with reduced adhesion at the interface between asperities exhibit the three predicted mechanisms of slip, plastic deformation of the asperities, and detachment of wear particles [see Fig. 4(b)–(d)]. Slip occurs, as expected, without significant plasticity inside the two sliding bodies [Fig. 4(b)]. In the case of plasticity, only one of the asperities is damaged, while the other stays mostly intact. This was observed before in simulations of asperity collisions in diamondlike carbon von Lautz et al. (2016) and is a consequence of the shear softening and strain localization behavior of the material. In strain-hardening materials, a more even distribution of plastic strain would be expected.
Figure 5 shows that the observed mechanisms and the transitions between them are in accord with the model predictions of Eq. 6 for different angles, normal loads, and adhesion potentials. We differentiate between slip and plasticity inside the asperities by calculating the atomic shear strain and checking if plasticity is constrained to the interface or if it occurs in the bulk. As a criterion, we only consider significant, irreversible shape changes of the asperities to indicate bulk plasticity [compare Fig. 4(b) with Fig. 4(c), for example]. With this, we find that the critical angle is correctly predicted.
Note that in order to accurately compare the results to the model, we measured the inclination angle of the interface just before any nonelastic event occurred. We found that can be reduced by up to during the elastic deformation, although the large change is a consequence of the large elastic limit of our model material.
In several cases, we observe that the mechanism can switch, e.g., when a wear particle starts detaching, but the interface rotates to a low-angle plane and starts slipping before the crack propagation can fully unload the contacting asperities (Fig. S.2 sup ). Nevertheless, the angle at which the switch occurs is in accord with our theoretical model. This hints that the detachment of such asperities could be a fatigue-like process, since the precrack that is formed is not expected to heal completely and can possibly grow again more easily upon a following asperity collision.
Moreover, because we control by a constant force, the actual stress at the junction increases during slip. Therefore, we observe increased plasticity at the end of slip, see Fig. 4(b) and Fig. S.3 in the Supplemental Material sup . In cases close to , this plasticity can be significant. This emphasizes that the evolution of contacting surfaces is a highly complex and dynamic process, which is not fully predictable from the initial contact configuration. Our mechanism map, though, demonstrates that a simplified picture is not too far from reality and is useful to categorize and understand the asperity-level mechanisms of wear.
III.3 Results for the full 3D geometry
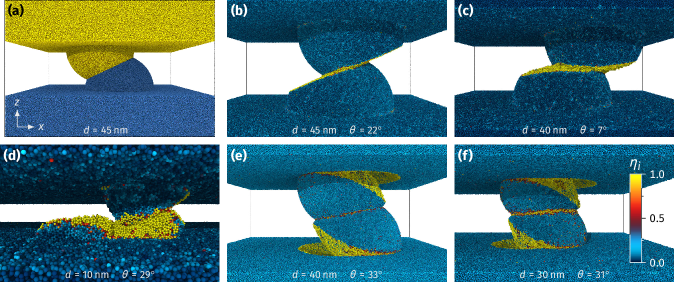
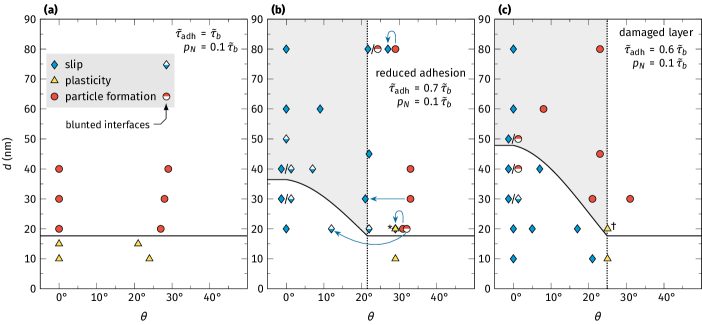
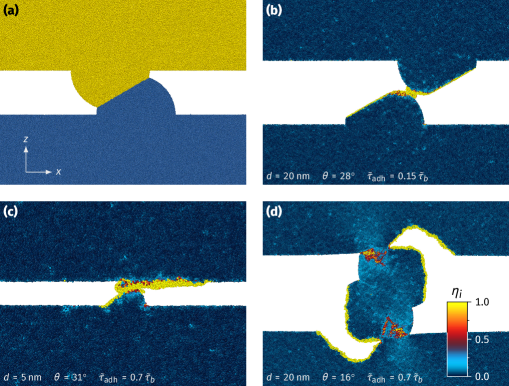
While the plane-strain simulations are useful to explore the possible mechanisms of adhesive wear and suggest that our model is predictive, they do not fully represent all aspects of real contact geometries. Thus, we extended the simulations to a full 3D geometry by considering hemispherical asperities [see Fig. 6(a)]. We again started from simulations with full adhesion and found independently of , which, together with the material parameters and Eq. 6, corresponds to a shape factor of . Figure S.5 sup shows that the same results are obtained if the interface is stronger than the bulk, as predicted. The shape factor of is in fact the expected factor for overlapping, hemispherical asperities (see Appendix A for the derivation), which means that Eq. 6 is fully predictive for wear particle formation in the 3D case under full adhesion conditions without any fit parameter.
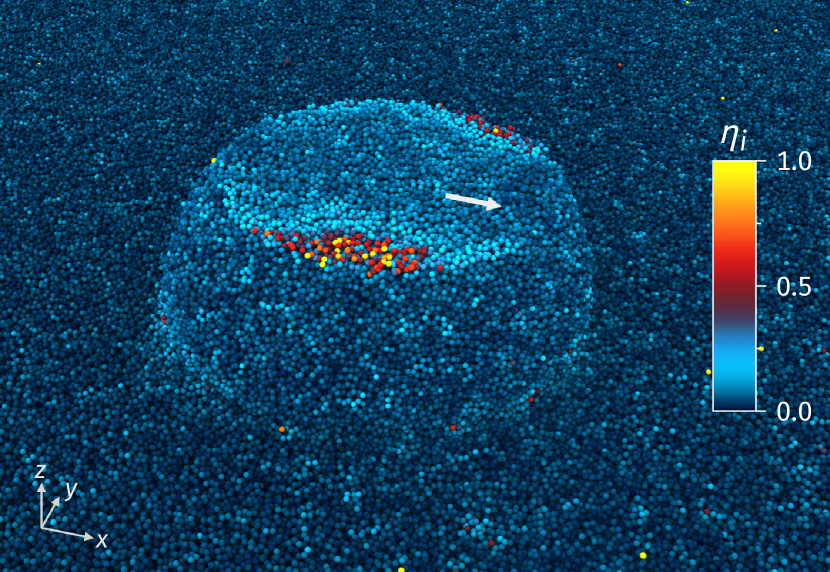
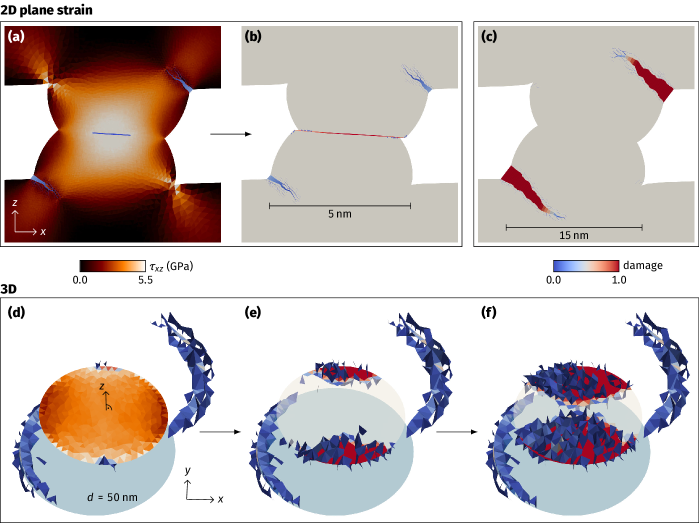
We then extended the simulations to junction interfaces with either reduced adhesion or a damaged layer. As for the plane-strain simulations, the three mechanisms of slip [Fig. 6(b)–(c)], plasticity [Fig. 6(d)], and particle detachment [Fig. 6(e)–(f)] were observed. As shown in Fig. 7, the mechanism map partly agrees with the model prediction, but we unexpectedly found that interfaces with either reduced adhesion or a damaged interface layer have a tendency for slip at small , even for large asperity sizes (light gray areas on the graphs). We thus repeated one of the simulations displaying slip while outputting data in smaller time increments. Figure 8 indicates that the start of slip occurs at edges lateral to the sliding direction, hinting at slip nucleation by a stress concentration.
In order to elucidate the reason for this difference in behavior between quasi-2D and full 3D simulations, we turned to finite-element modelling of our geometry using dynamically inserted cohesive elements. A detailed description of the setup and results is presented in Appendix C. While this model does not account for plasticity, it is useful to study the transition from interface slip to detachment of wear particles. We find that a shear stress concentration indeed necessarily arises in the same position as in the MD simulation, which leads to slip along the interface, even for . Given the existence of a stress concentration, this is not surprising if the fracture toughness of the junction is reduced compared to the bulk material: The competition between particle detachment and slip is not governed by an energetic criterion as in Eq. 6 anymore, but by a competition between stress intensity factors. If the junction has full adhesive strength, on the other hand, the mode I crack at the base of the asperity is always preferred over the mode II interface slip (see Fig. S.6 sup ). This also explains why the damaged layer in the MD simulations has a higher resistance towards interface slip: It does not weaken catastrophically upon slip and can therefore accommodate small deformations around the stress concentrator. In other words, it has a larger plastic zone size and therefore a higher fracture toughness than the interfaces with reduced adhesion potential (compare the area under the stress–strain curves in Fig. 3).
As such, the competition between slip and wear particle detachment depends on the details of fracture toughness and relative stress intensity factors of the two processes. Of course, the simulations considered until now always possessed sharp interfaces, while contacts might also exhibit blunted corners at the junction (e.g., due to diffusion). To explore if we can recover the original model formulation by reducing the stress concentration, we repeated several MD simulations with blunted corners around the junction as depicted in Fig. 9. We restricted ourselves to simulations around critical points in the mechanism map in order to reduce the computational demands. In the case of the reduced adhesion potential at the interface [Fig. 7(b)], no change of mechanism due to blunting could be observed for . This is most likely because the stress concentration is only reduced, but not removed by blunting the interface. Due to the rather abrupt stick-to-slip transition of this interface model, any onset of slip will be catastrophic. For the damaged layer, though, a well-defined yield strength and are recovered for all [Fig. 7(c)]. The value of for blunted interfaces with small inclination angles is slightly overestimated. It should be noted, though, that the damaged interface’s strength is subject to some uncertainty, since the exact damage depends on the somewhat random local short-range order of the glass.
A switch from wear particle detachment to slip due to rotation of the slip plane, as observed in the plane-strain case discussed above, is also present if the interface is “brittle” (reduced adhesion), but not if it is shear-band-like (damaged layer). This emphasizes again that these processes are ultimately controlled by the exact stress distributions and process zones that arise. A purely yield-strength-based argument as laid out in Section II can only apply if the junction interface behavior is bulklike, which most likely applies to mature junctions. Additionally, nanoscale roughness of the junction interface might also help to suppress the brittle slip behavior. If that does not apply, a competition between a mode II crack along the interface and a mode I crack that detaches the particle has to be considered for and (gray areas in Fig. 7).
Finally, for the derivation of our theoretical model in Section II, we assumed that a deviation of the sliding direction by an angle from the plane sketched in Fig. 2 does not change the mechanism map. In Appendix B, we show that this is reasonable for under the assumption that the slip of the junction will be constrained by the macroscopic sliding direction. In order to verify this, we repeated the simulations with a damaged interface, initial angle , and , , and and rotated the sliding direction by . As expected, no change in mechanism was observed, see Fig. S.7 in the Supplemental Material sup . This means that Eq. 6 is robust even for asperity collisions that are not perfectly frontal.
IV Discussion
The mechanism maps outlined above generally agree with the limited available literature. Simulations of asperity collisions in diamondlike carbon were interpreted in terms of the overlap of the asperities, transitioning from localized shear banding at the contact spot to a large plastic zone with increasing overlap von Lautz et al. (2016). Since the asperities were cylindrical and in general a slightly reduced adhesion due to mismatch of the short-range order can be assumed, the overlap can be reinterpreted as an angle of contact, in agreement with our results of transition from slip to bulk plasticity.
We equally expect the results to be transferable to crystalline materials, although some complexities have to be taken into account. Weak planes naturally exist in addition to interfaces in the form of preferential slip planes and depend on the local lattice orientation, adding some randomness. Furthermore, while glasses usually come close to their theoretical strength (if they do not fracture before) Cheng and Ma (2011); Greer et al. (2013), crystalline plasticity is size dependent and interfaces with small radii can be stronger than the bulk Hurtado and Kim (1999a, b). The relevant parameter is then the shear strength of the weakest part of the asperity, controlled by the density of preexisting defects.
Beyond the nanoscale, the present paper also has consequences for our understanding of wear at the engineering scale. First, large angles between the interface and the sliding direction lead to an increased probability of wear particle formation, meaning that a high root-mean-square roughness of the surface leads to more asperity interlock and more wear. Consequently, though, the roughness should reduce during running-in (by wearing off high and thin asperities), while the real contact area and the size of the individual contact spots increases and the wear rate decreases Blau (2005); Milanese et al. (2019). Without the slope-dependent slip mechanism, this effect cannot be explained, since increased contact spot sizes should lead to the formation of more and larger wear particles. Our results provide an answer: The local slopes will be flatter due to the change of roughness and thus the probability for slip increases, especially in lubricated conditions. Second, in a previous study Frérot et al. (2018), it was found that the wear coefficient cannot simply be derived only from the assumption that contact spots larger than a critical value form wear particles, while smaller ones deform plastically Aghababaei et al. (2016). Indeed, this view misses important complexities, such as interactions between contact spots Aghababaei et al. (2018), plastic deformations due to the normal load Persson (2001); Pei et al. (2005); Solhjoo and Vakis (2016); Venugopalan and Nicola (2019); Frérot et al. (2019), and, as the present paper indicates, slip. This slip depends on the strength of the adhesive bond and the sharpness of the interface, and as such is subject to time-dependent phenomena such as aging Li and Szlufarska (2018); Li et al. (2018); Dillavou and Rubinstein (2018) and interface creep Coble (1963); Ashby (1972); Arzt et al. (1983); Kalcher et al. (2017). With appropriate knowledge about the parameters of the interface, wear debris formation, surface deformation due to plasticity, and slip can now be treated quantitatively using our framework.
V Conclusion
In conclusion, we revised a criterion for the formation of wear particles in the adhesive wear regime Aghababaei et al. (2016) by not only considering the properties of the two bulk materials in contact but also investigating the interface in more detail. In experiment and application, weak interfaces between contacting bodies are often expected and here we find that the interface properties and orientation play a critical role for wear. For blunted interfaces with sufficient toughness—as would be expected at junctions that are sufficiently mature for diffusive processes to have acted—a well-defined interface shear strength exists. The junction strength in this case can be derived by a competition between the critical resolved interface shear stress (comparable to the concept of the Schmid factor) and the bulk shear strength. Weak interfaces, on the other hand, are very sensitive to stress concentrators, and will easily slip in preference to other mechanisms. This means that only high-angle asperity collisions can lead to wear particle formation. Finally, when the interface strength approaches the bulk strength, no slip occurs anymore and only plastic deformation and wear particle detachment are expected. As a result, flatter surfaces are in general more amenable to slip and low wear, as long as they are well lubricated and as long as the contact patches do not grow above a critical size, which is expected to be very large compared to the typical contact junction sizes in lubricated conditions. As soon as lubrication is lost and adhesion increases, the critical size for wear particle formation will drop drastically and severe adhesive wear is expected to set in. The present paper provides a theoretical framework and a quantitative map to predict these transitions.
Acknowledgments
The authors thank Fabian Barras and Mark O. Robbins for helpful discussions and Nicolas Richart for assistance with the FEM simulations. This work was supported by a grant from the Swiss National Supercomputing Centre (CSCS) under project ID s784, as well as by École polytechnique fédérale de Lausanne (EPFL) through the use of the facilities of its Scientific IT and Application Support Center.
Appendix A Shape factor
The shape factor in Eqs. 1 and 6 contains information about the actual shape of the asperities and the geometry of the cracks needed to detach a wear particle. In the case of a contact between two asperities, each of volume , the maximal stored elastic energy is . Two cracks with area are needed to form a particle, which requires a work of . Often, the assumption of hemispherical asperities with diameter and with a circular fracture area at their base is made Rabinowicz (1958, 1964); Aghababaei et al. (2016): and . The balance of the two energies gives and thus , as shown in earlier work 111Please note that in the original publication Aghababaei et al. (2016), the factor 2 in front of was moved into and included a factor 2 to account for the fact that two cracks are needed for particle formation. These differences to our formulation cancel out and we arrive at the same value of ..
In our simulations, the asperities are no longer perfectly hemispherical. Thus, in order to derive the exact shape factor for our 3D geometries, we first consider the volume of the asperities. Since they are overlapping hemispheres, each asperity can be described as a spherical segment (see Fig. 2). A spherical segment is a solid bounded by two parallel planes cutting through a sphere 222Note that while asperities with are not spherical segments, they have the same volume as long as the plane for cutting the junction is rotated around the sphere’s center and as long as the cuts do not intersect. Both conditions are true for all geometries we used., resulting in two circular surfaces of radii and separated by a height , and a volume of . Since one cut goes through the sphere’s center, . The second cut represents the junction, for which we chose a radius of . Together with the relation , we obtain a volume of
| (7) |
per asperity. We keep the assumption of a relatively flat crack path, corresponding to the circular base of the asperities. As above, we solve for the critical length by equating the potential energy with the work for crack propagation and obtain
| (8) |
The result of agrees with the data in Section III.3 without a fit parameter.
Finally, one can also attempt to define a critical size for a hemispherical wear particle sticking to one of the surfaces. Using the same arguments as before, we obtain a maximal stored elastic energy of and a total adhesive energy of , also resulting in . This mechanism, though, is not as well defined: Rabinowicz assumed that the detachment is due to residual compressive stress and thus used yield strength in tension and Young’s modulus instead of shear strength and shear modulus Rabinowicz (1958). But in this case the residual tensile stress is most likely smaller than the yield strength. Rabinowicz thus made a back-of-the-envelope estimation that the residual stress is around 10% of the yield strength and thereby arrived at , but did not justify this choice any further. Therefore, this mechanism is not yet fully understood, neither quantitatively nor qualitatively.
Appendix B Rotation of the junction interface normal vector out of the plane
In a 3D geometry, the derivation of resolved shear stress (Eqs. 2–4) is only valid if the normal vector of the slip plane remains in the plane. We will show below that a rotation out of this plane by an angle does not significantly change the resolved stress, as long as the slip direction remains in the plane. The latter is a reasonable assumption, since the sliding direction is macroscopically imposed.
The additional rotation can be included in the normal vector :
| (9) |
resulting in a resolved shear stress of
| (10) |
The term relating to is unchanged. Figure 10 shows that the change of with is minor and can mostly be ignored. As discussed in Section III.3 and shown in Fig. S.7 sup , this is confirmed by simulations with , which exhibit the same mechanisms as the simulations with . For , slip is preferred, which should be interpreted as asperities passing by each other.
Appendix C FEM simulations of slip at the junction
In order to elucidate the reason for the difference in the slip-to-fracture transition between quasi-2D and full 3D simulations, we turned to simplified finite-element modeling of our geometry. We used the software akantu Richart and Molinari (2015); Vocialta et al. (2017) to model a homogeneous, isotropic, linear elastic material with large deformations. Fracture was modeled using cohesive elements with the linear irreversible law by Snozzi and Molinari Snozzi and Molinari (2013). The simulations were performed with an explicit time-integration scheme, where the cohesive elements were inserted dynamically Vocialta et al. (2017). The geometry and the sliding velocity of match the MD simulations at . Visualization was performed with paraview Ahrens et al. (2005).
We chose parameters to match the model glass and the interface with reduced adhesion () in the MD simulations: For the linear elastic, isotropic bulk material, a density of , a Young’s modulus of , and a Poisson’s ratio of were used.
The cohesive elements inserted in the bulk of the material had a critical insertion stress (the shear yield strength of the glass) with a critical effective opening displacement of at which cohesion is lost. This corresponds to a fracture energy of , which was the same for mode I and mode II opening (see Ref. Snozzi and Molinari, 2013 for details). For cohesive elements inserted along the junction interface, we reduced the toughness by setting and for a fracture energy of .
While this model cannot account for plasticity, it is useful to study the transition from interface slip to detachment of wear particles.
Figures 11(a) and (b) show a 2D plane-strain simulation with . Clearly, the shear stress is maximal in the center of the contact junction, where a mode II crack nucleates and propagates, leading to slip. The cracks at the bottom of the asperity never fully form (damage much smaller than ). For [Fig. 11(c)], on the other hand, the interface never damages and a wear particle is detached.
The 3D case, though, shows a deviation from our initial assumptions. In Fig. 11(d), a shear stress concentration is visible at the junction, lateral to the sliding direction. Despite , interface slip starts at the stress concentration and propagates inwards. This matches the MD simulation with high time resolution shown in Fig. 8. When the modeled junction interface has the same properties as the bulk material, on the other hand, a wear particle detaches by fracture at the base of the asperities (see Fig. S.6 in the Supplemental Material sup ).
An analysis of the stress state in the junction shows the principal difference between the 2D and 3D case: In the plane, the free surfaces of the asperities require that
| (11) |
Since we can assume that , it follows that has to be zero. In the case of , even this assumption is not needed and is required to be exactly zero.
In the plane, though, no constraint is placed on :
| (12) |
Therefore, the sharp neck at the interface leads to a stress concentration. Here, the slip mode cannot be treated like plasticity with a defined shear strength, but slippage is cracklike. As demonstrated in Section III.3, a blunt interface can reduce the stress concentration and disable this cracklike mechanism in some cases.
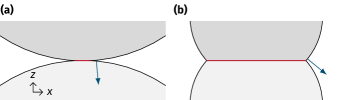
It should be noted that classical contact solutions—such as Cattaneo–Mindlin—predict a radially symmetric stress concentration at the edges of the contact instead of only a lateral one Johnson (1985), meaning that stress concentrations should be present in 2D and 3D geometries. The present case, though, violates the assumptions of such classical solutions. First, we do not have an incommensurate, frictional contact of spheres, but a commensurate, adhesive interface. More importantly, though, the contact radius is large compared to the radius of the sphere in our case. Figure 12(a) shows that the surfaces in the classical solution are approximately parallel at the edge of the contact area, which means that the free boundary condition used in Eq. 11 does not exist, while it is present for large contact radii [Fig. 12(b)]. Additionally, the nucleation of slip from the sides lateral to the macroscopic sliding direction has been observed before in rubber–glass contact Audry et al. (2012) and in atomistic contact simulations of crystalline lattices Sharp et al. (2016, 2017). The latter publications ascribe the asymmetry to nonlinear effects, i.e., that the screw dislocations nucleated at the lateral sides have a smaller core width and thereby increase the stress concentration there. We show here that even linear elasticity can lead to asymmetric slip nucleation, at least for large contact areas. Nonlinear effects might still be necessary for small ratios of contact area to sphere radius.
References
- Bowden and Tabor (1939) F. P. Bowden and D. Tabor, The area of contact between stationary and moving surfaces, Proc. R. Soc. Lond. A 169, 391 (1939).
- Rabinowicz and Tabor (1951) E. Rabinowicz and D. Tabor, Metallic transfer between sliding metals: an autoradiographic study, Proc. R. Soc. Lond. A 208, 455 (1951).
- Burwell and Strang (1952) J. T. Burwell and C. D. Strang, On the empirical law of adhesive wear, J. Appl. Phys. 23, 18 (1952).
- Archard (1953) J. F. Archard, Contact and rubbing of flat surfaces, J. Appl. Phys. 24, 981 (1953).
- Rabinowicz (1958) E. Rabinowicz, The effect of size on the looseness of wear fragments, Wear 2, 4 (1958).
- Godet (1984) M. Godet, The third-body approach: A mechanical view of wear, Wear 100, 437 (1984).
- Godet (1990) M. Godet, Third-bodies in tribology, Wear 136, 29 (1990).
- Aghababaei et al. (2017) R. Aghababaei, D. H. Warner, and J.-F. Molinari, On the debris-level origins of adhesive wear, Proc. Natl. Acad. Sci. U.S.A. 114, 7935 (2017).
- Frérot et al. (2018) L. Frérot, R. Aghababaei, and J.-F. Molinari, A mechanistic understanding of the wear coefficient: From single to multiple asperities contact, J. Mech. Phys. Solids 114, 172 (2018).
- Molinari et al. (2018) J.-F. Molinari, R. Aghababaei, T. Brink, L. Frérot, and E. Milanese, Adhesive wear mechanisms uncovered by atomistic simulations, Friction 6, 245 (2018).
- Meng and Ludema (1995) H. C. Meng and K. C. Ludema, Wear models and predictive equations: their form and content, Wear 181–183, 443 (1995).
- Rabinowicz (1964) E. Rabinowicz, Practical uses of the surface energy criterion, Wear 7, 9 (1964).
- Rabinowicz (1995) E. Rabinowicz, Friction and Wear of Materials, 2nd ed. (John Wiley & Sons, New York, USA, 1995).
- Griffith (1921) A. A. Griffith, VI. The phenomena of rupture and flow in solids, Phil. Trans. R. Soc. Lond. A 221, 163 (1921).
- Holm (1967) R. Holm, Electric Contacts: Theory and Application, 3rd ed. (Springer, Berlin, 1967).
- Aghababaei et al. (2016) R. Aghababaei, D. H. Warner, and J.-F. Molinari, Critical length scale controls adhesive wear mechanisms, Nat. Commun. 7, 11816 (2016).
- Milanese et al. (2019) E. Milanese, T. Brink, R. Aghababaei, and J.-F. Molinari, Emergence of self-affine surfaces during adhesive wear, Nat. Commun. 10, 1116 (2019).
- Sørensen et al. (1996) M. R. Sørensen, K. W. Jacobsen, and P. Stoltze, Simulations of atomic-scale sliding friction, Phys. Rev. B 53, 2101 (1996).
- Spijker et al. (2011) P. Spijker, G. Anciaux, and J.-F. Molinari, Dry sliding contact between rough surfaces at the atomistic scale, Tribol. Lett. 44, 279 (2011).
- Pastewka et al. (2011) L. Pastewka, S. Moser, P. Gumbsch, and M. Moseler, Anisotropic mechanical amorphization drives wear in diamond, Nat. Mater. 10, 34 (2011).
- Zhong et al. (2013) J. Zhong, R. Shakiba, and J. B. Adams, Molecular dynamics simulation of severe adhesive wear on a rough aluminum substrate, J. Phys. D: Appl. Phys. 46, 055307 (2013).
- Sha et al. (2013) Z.-D. Sha, V. Sorkin, P. S. Branicio, Q.-X. Pei, Y.-W. Zhang, and D. J. Srolovitz, Large-scale molecular dynamics simulations of wear in diamond-like carbon at the nanoscale, Appl. Phys. Lett. 103, 073118 (2013).
- Stoyanov et al. (2014) P. Stoyanov, P. A. Romero, R. Merz, M. Kopnarski, M. Stricker, P. Stemmer, M. Dienwiebel, and M. Moseler, Nanoscale sliding friction phenomena at the interface of diamond-like carbon and tungsten, Acta Mater. 67, 395 (2014).
- De Barros Bouchet et al. (2015) M. I. De Barros Bouchet, C. Matta, B. Vacher, T. Le-Mogne, J. M. Martin, J. von Lautz, T. Ma, L. Pastewka, J. Otschik, P. Gumbsch, and M. Moseler, Energy filtering transmission electron microscopy and atomistic simulations of tribo-induced hybridization change of nanocrystalline diamond coating, Carbon 87, 317 (2015).
- Venugopalan and Nicola (2019) S. P. Venugopalan and L. Nicola, Indentation of a plastically deforming metal crystal with a self-affine rigid surface: A dislocation dynamics study, Acta Mater. 165, 709 (2019).
- Komvopoulos et al. (1985) K. Komvopoulos, N. Saka, and N. P. Suh, The mechanism of friction in boundary lubrication, J. Tribol. 107, 452 (1985).
- Feng (1952) I.-M. Feng, Metal transfer and wear, J. Appl. Phys. 23, 1011 (1952).
- Green (1955) A. P. Green, Friction between unlubricated metals: a theoretical analysis of the junction model, Proc. R. Soc. Lond. A 228, 191 (1955).
- Greenwood and Tabor (1955) J. A. Greenwood and D. Tabor, Deformation properties of friction junctions, Proc. Phys. Soc. London, Sect. B 68, 609 (1955).
- Erdemir and Donnet (2006) A. Erdemir and C. Donnet, Tribology of diamond-like carbon films: recent progress and future prospects, J. Phys. D: Appl. Phys. 39, R311 (2006).
- Jacobs et al. (2010) T. D. B. Jacobs, B. Gotsmann, M. A. Lantz, and R. W. Carpick, On the application of transition state theory to atomic-scale wear, Tribol. Lett. 39, 257 (2010).
- Bhaskaran et al. (2010) H. Bhaskaran, B. Gotsmann, A. Sebastian, U. Drechsler, M. A. Lantz, M. Despont, P. Jaroenapibal, R. W. Carpick, Y. Chen, and K. Sridharan, Ultralow nanoscale wear through atom-by-atom attrition in silicon-containing diamond-like carbon, Nat. Nanotechnol. 5, 181 (2010).
- Scharf and Prasad (2013) T. W. Scharf and S. V. Prasad, Solid lubricants: a review, J. Mater. Sci. 48, 511 (2013).
- Zeng et al. (2016) G. Zeng, C.-K. Tan, N. Tansu, and B. A. Krick, Ultralow wear of gallium nitride, Appl. Phys. Lett. 109, 051602 (2016).
- Curry et al. (2018) J. F. Curry, T. F. Babuska, T. A. Furnish, P. Lu, D. P. Adams, A. B. Kustas, B. L. Nation, M. T. Dugger, M. Chandross, B. G. Clark, B. L. Boyce, C. A. Schuh, and N. Argibay, Achieving ultralow wear with stable nanocrystalline metals, Adv. Mater. 30, 1802026 (2018).
- Gottstein (2004) G. Gottstein, Physical Foundations of Materials Science, 1st ed. (Springer, Berlin, Germany, 2004).
- Scherge et al. (2003) M. Scherge, D. Shakhvorostov, and K. Pöhlmann, Fundamental wear mechanism of metals, Wear 255, 395 (2003).
- Talati et al. (2009) M. Talati, T. Albaret, and A. Tanguy, Atomistic simulations of elastic and plastic properties in amorphous silicon, Europhys. Lett. 86, 66005 (2009).
- Fusco et al. (2010) C. Fusco, T. Albaret, and A. Tanguy, Role of local order in the small-scale plasticity of model amorphous materials, Phys. Rev. E 82, 066116 (2010).
- Falk and Langer (2011) M. L. Falk and J. S. Langer, Deformation and failure of amorphous, solidlike materials, Annu. Rev. Condens. Matter Phys. 2, 353 (2011).
- Greer et al. (2013) A. L. Greer, Y. Q. Cheng, and E. Ma, Shear bands in metallic glasses, Mat. Sci. Eng. R 74, 71 (2013).
- Cheng and Ma (2011) Y. Q. Cheng and E. Ma, Intrinsic shear strength of metallic glass, Acta Mater. 59, 1800 (2011).
- Albe et al. (2013) K. Albe, Y. Ritter, and D. Şopu, Enhancing the plasticity of metallic glasses: Shear band formation, nanocomposites and nanoglasses investigated by molecular dynamics simulations, Mech. Mater. 67, 94 (2013).
- Holland and Marder (1998a) D. Holland and M. Marder, Ideal brittle fracture of silicon studied with molecular dynamics, Phys. Rev. Lett. 80, 746 (1998a).
- Holland and Marder (1998b) D. Holland and M. Marder, Erratum: Ideal brittle fracture of silicon studied with molecular dynamics [Phys. Rev. Lett. 80, 746 (1998)], Phys. Rev. Lett. 81, 4029 (1998b).
- Pastewka et al. (2008) L. Pastewka, P. Pou, R. Pérez, P. Gumbsch, and M. Moseler, Describing bond-breaking processes by reactive potentials: Importance of an environment-dependent interaction range, Phys. Rev. B 78, 161402(R) (2008).
- Pastewka et al. (2012) L. Pastewka, M. Mrovec, M. Moseler, and P. Gumbsch, Bond order potentials for fracture, wear, and plasticity, MRS Bull. 37, 493 (2012).
- Pastewka et al. (2013) L. Pastewka, A. Klemenz, P. Gumbsch, and M. Moseler, Screened empirical bond-order potentials for Si-C, Phys. Rev. B 87, 205410 (2013).
- Stillinger and Weber (1985) F. H. Stillinger and T. A. Weber, Computer simulation of local order in condensed phases of silicon, Phys. Rev. B 31, 5262 (1985).
- Tersoff (1988) J. Tersoff, Empirical interatomic potential for silicon with improved elastic properties, Phys. Rev. B 38, 9902 (1988).
- Hauch et al. (1999) J. A. Hauch, D. Holland, M. P. Marder, and H. L. Swinney, Dynamic fracture in single crystal silicon, Phys. Rev. Lett. 82, 3823 (1999).
- Holland and Marder (1999) D. Holland and M. Marder, Cracks and atoms, Adv. Mater. 11, 793 (1999).
- Fusco et al. (2014) C. Fusco, T. Albaret, and A. Tanguy, Rheological properties vs. local dynamics in model disordered materials at low temperature, Eur. Phys. J. E 37, 43 (2014).
- Shi et al. (2014) Y. Shi, J. Luo, F. Yuan, and L. Huang, Intrinsic ductility of glassy solids, J. Appl. Phys. 115, 043528 (2014).
- Beltukov et al. (2016) Y. M. Beltukov, C. Fusco, D. A. Parshin, and A. Tanguy, Boson peak and Ioffe-Regel criterion in amorphous siliconlike materials: The effect of bond directionality, Phys. Rev. E 93, 023006 (2016).
- Plimpton (1995) S. Plimpton, Fast parallel algorithms for short-range molecular dynamics, J. Comp. Phys. 117, 1 (1995), https://lammps.sandia.gov/.
- Ishimaru et al. (1997) M. Ishimaru, S. Munetoh, and T. Motooka, Generation of amorphous silicon structures by rapid quenching: A molecular-dynamics study, Phys. Rev. B 56, 15133 (1997).
- Demkowicz and Argon (2005) M. J. Demkowicz and A. S. Argon, Liquidlike atomic environments act as plasticity carriers in amorphous silicon, Phys. Rev. B 72, 245205 (2005).
- Ritter and Albe (2012) Y. Ritter and K. Albe, Chemical and topological order in shear bands of Cu64Zr36 and Cu36Zr64 glasses, J. Appl. Phys. 111, 103527 (2012).
- (60) See Supplemental Material at [URL will be inserted by publisher] for additional simulation snapshots.
- Schuh et al. (2007) C. A. Schuh, T. C. Hufnagel, and U. Ramamurty, Mechanical behavior of amorphous alloys, Acta Mater. 55, 4067 (2007).
- Stukowski (2010) A. Stukowski, Visualization and analysis of atomistic simulation data with OVITO – the open visualization tool, Modell. Simul. Mater. Sci. Eng. 18, 015012 (2010), https://ovito.org/.
- Shimizu et al. (2007) F. Shimizu, S. Ogata, and J. Li, Theory of shear banding in metallic glasses and molecular dynamics calculations, Mater. Trans. 48, 2923 (2007).
- von Lautz et al. (2016) J. von Lautz, L. Pastewka, P. Gumbsch, and M. Moseler, Molecular dynamic simulation of collision-induced third-body formation in hydrogen-free diamond-like carbon asperities, Tribol. Lett. 63, 26 (2016).
- Hurtado and Kim (1999a) J. A. Hurtado and K.-S. Kim, Scale effects in friction of single-asperity contacts. I. From concurrent slip to single-dislocation-assisted slip, Proc. R. Soc. Lond. A 455, 3363 (1999a).
- Hurtado and Kim (1999b) J. A. Hurtado and K.-S. Kim, Scale effects in friction of single-asperity contacts. II. Multiple-dislocation-cooperated slip, Proc. R. Soc. Lond. A 455, 3385 (1999b).
- Blau (2005) P. J. Blau, On the nature of running-in, Tribol. Int. 38, 1007 (2005).
- Aghababaei et al. (2018) R. Aghababaei, T. Brink, and J.-F. Molinari, Asperity-level origins of transition from mild to severe wear, Phys. Rev. Lett. 120, 186105 (2018).
- Persson (2001) B. N. J. Persson, Elastoplastic contact between randomly rough surfaces, Phys. Rev. Lett. 87, 116101 (2001).
- Pei et al. (2005) L. Pei, S. Hyun, J.-F. Molinari, and M. O. Robbins, Finite element modeling of elasto-plastic contact between rough surfaces, J. Mech. Phys. Solids 53, 2385 (2005).
- Solhjoo and Vakis (2016) S. Solhjoo and A. I. Vakis, Continuum mechanics at the atomic scale: Insights into non-adhesive contacts using molecular dynamics simulations, J. Appl. Phys. 120, 215102 (2016).
- Frérot et al. (2019) L. Frérot, M. Bonnet, J.-F. Molinari, and G. Anciaux, A Fourier-accelerated volume integral method for elastoplastic contact, Comput. Methods. Appl. Mech. Eng. 10.1016/j.cma.2019.04.006 (2019).
- Li and Szlufarska (2018) Z. Li and I. Szlufarska, Multiphysics model of chemical aging in frictional contacts, Phys. Rev. Materials 2, 063602 (2018).
- Li et al. (2018) Z. Li, L. Pastewka, and I. Szlufarska, Chemical aging of large-scale randomly rough frictional contacts, Phys. Rev. E 98, 023001 (2018).
- Dillavou and Rubinstein (2018) S. Dillavou and S. M. Rubinstein, Nonmonotonic aging and memory in a frictional interface, Phys. Rev. Lett. 120, 224101 (2018).
- Coble (1963) R. L. Coble, A model for boundary diffusion controlled creep in polycrystalline materials, J. Appl. Phys. 34, 1679 (1963).
- Ashby (1972) M. F. Ashby, A first report on deformation-mechanism maps, Acta Metall. 20, 887 (1972).
- Arzt et al. (1983) E. Arzt, M. F. Ashby, and R. A. Verrall, Interface controlled diffusional creep, Acta Metall. 31, 1977 (1983).
- Kalcher et al. (2017) C. Kalcher, T. Brink, J. Rohrer, A. Stukowski, and K. Albe, Interface-controlled creep in metallic glass composites, Acta Mater. 141, 251 (2017).
- Note (1) Please note that in the original publication Aghababaei et al. (2016), the factor 2 in front of was moved into and included a factor 2 to account for the fact that two cracks are needed for particle formation. These differences to our formulation cancel out and we arrive at the same value of .
- Note (2) Note that while asperities with are not spherical segments, they have the same volume as long as the plane for cutting the junction is rotated around the sphere’s center and as long as the cuts do not intersect. Both conditions are true for all geometries we used.
- Richart and Molinari (2015) N. Richart and J.-F. Molinari, Implementation of a parallel finite-element library: Test case on a non-local continuum damage model, Finite Elem. Anal. Des. 100, 41 (2015), https://akantu.ch.
- Vocialta et al. (2017) M. Vocialta, N. Richart, and J.-F. Molinari, 3D dynamic fragmentation with parallel dynamic insertion of cohesive elements, Int. J. Numer. Meth. Engng. 109, 1655 (2017).
- Snozzi and Molinari (2013) L. Snozzi and J.-F. Molinari, A cohesive element model for mixed mode loading with frictional contact capability, Int. J. Numer. Methods Eng. 93, 510 (2013).
- Ahrens et al. (2005) J. Ahrens, B. Geveci, and C. Law, ParaView: An end-user tool for large-data visualization, in Visualization Handbook, edited by C. D. Hansen and C. R. Johnson (Elsevier Butterworth–Heinemann, 2005) Chap. 36, pp. 717–731, https://www.paraview.org/.
- Johnson (1985) K. L. Johnson, Contact Mechanics (Cambridge University Press, Cambridge, UK, 1985).
- Audry et al. (2012) M. C. Audry, C. Fretigny, A. Chateauminois, J. Teissere, and E. Barthel, Slip dynamics at a patterned rubber/glass interface during stick-slip motions, Eur. Phys. J. E 35, 83 (2012).
- Sharp et al. (2016) T. A. Sharp, L. Pastewka, and M. O. Robbins, Elasticity limits structural superlubricity in large contacts, Phys. Rev. B 93, 121402(R) (2016).
- Sharp et al. (2017) T. A. Sharp, L. Pastewka, V. L. Lignères, and M. O. Robbins, Scale- and load-dependent friction in commensurate sphere-on-flat contacts, Phys. Rev. B 96, 155436 (2017).
See pages 1 of supplemental.pdf See pages 2 of supplemental.pdf See pages 3 of supplemental.pdf