A Fast Radio Burst with frequency-dependent polarization
detected during Breakthrough Listen observations
Abstract
Here, we report on the detection and verification of Fast Radio Burst FRB 180301, which occurred on UTC 2018 March 1 during the Breakthrough Listen observations with the Parkes telescope. Full-polarization voltage data of the detection were captured—a first for non-repeating FRBs—allowing for coherent de-dispersion and additional verification tests. The coherently de-dispersed dynamic spectrum of FRB 180301 shows complex, polarized frequency structure over a small fractional bandwidth. As FRB 180301 was detected close to the geosynchronous satellite band during a time of known 1–2 GHz satellite transmissions, we consider whether the burst was due to radio interference emitted or reflected from an orbiting object. Based on the preponderance of our verification tests, we find that FRB 180301 is likely of astrophysical origin, but caution that anthropogenic sources cannot conclusively be ruled out.
keywords:
radio continuum: transients – methods: data analysis – methods: observational1 Introduction
Fast Radio Bursts (FRBs), first reported by Lorimer et al. (2007), are a now-routinely detected—but nonetheless rare—class of transient radio sources of inferred extragalactic origin (e.g. Thornton et al., 2013; Caleb et al., 2017; Ravi, 2019); see FRBCAT111http://frbcat.org/ for an up-to-date catalogue (Petroff et al., 2016). Identifying the sources of FRBs and understanding their emission mechanisms is an area of active research within astronomy. Given their extreme luminosities (isotropic burst energies erg, Dolag et al. 2015), and their inferred cosmological distances, FRBs could be used as cosmological probes (Zhou et al., 2014; Deng & Zhang, 2014; Walters et al., 2018; Keane, 2018).
To unambiguously prove an extragalactic origin of an FRB, many surveys are focused on using interferometric arrays to localize the source to host galaxies at the time of detection (e.g. Law et al., 2015; Burke-Spolaor et al., 2016; Bannister et al., 2017; Caleb et al., 2017). Further strides towards understanding the nature of FRBs come from more complete sampling of frequency space (Chawla et al., 2017; CHIME/FRB Collaboration et al., 2018; Amiri et al., 2019a), and capturing high-time resolution voltage data of a detection (Farah et al., 2018).
To date, only two FRBs have been shown to repeat: FRB 121102 (Spitler et al., 2016), and FRB 180814.J0422+73 (Amiri et al., 2019b). The repetition of FRB 121102 allowed interferometric localization and host galaxy identification via follow-up observations (Chatterjee et al., 2017). These observations unambiguously showed FRB 121102 to be astrophysical in origin, at a distance . While FRB 121102 appears to have active and non-active phases, no underlying periodicity has been detected (Zhang et al., 2018). Efforts to localize the recently-discovered FRB 180814.J0422+73 are ongoing (Amiri et al., 2019b).
Nevertheless, it cannot yet completely be ruled out that some fraction of FRBs are false-positives from Radio-frequency Interference (RFI) as FRB-like RFI is known to exist. A subset of FRB-like signals, dubbed ‘perytons’, showed signs of near-field terrestrial origin (Burke-Spolaor et al., 2011); eventually, these signals were shown to be caused by an on-site interferer (Petroff et al., 2015b). A variety of of FRB-like RFI are presented in Foster et al. (2018), along with a verification framework aimed at limiting false positives. (In practice, all one can do is perform as many verification tests as the data allow.) The FRBs reported so far pass all of the tests that it has been possible to perform. However, as we collect increasingly rich information, we can be increasignly rigorous in our verification. This is important as the understanding of the diverse manifestations of RFI is incomplete.
FRBs display varying frequency and polarization characteristics that may be intrinsic or extrinsic to the emission mechanism. Several FRB events—including FRB 110523 (Masui et al., 2015), FRB 170827 (Farah et al., 2018), and FRB 121102 (Michilli et al., 2018; Gajjar et al., 2018)— show spectral modulation on scales of order 1 MHz. Shannon et al. (2018) recently reported 20 FRBs detected with the Australian Square-Kilometre Array Telescope Pathfinder (ASKAP), all of which exhibit spectral modulation. Similarly, spectral modulation is also apparent in the 13 bursts detected using the Canadian Hydrogen Intensity Mapping Experiment (CHIME, Amiri et al., 2019a). If intrinsic to the source, the frequency-modulated emission is distinctly different from the broadband emission associated with possible progenitors such as (young) pulsars and magnetars (Jankowski et al., 2018). In most cases, however, the modulated emission has been attributed to propagation effects, namely inter- and intra-galactic scintillation.
Polarization properties and Faraday Rotation Measure (RM) have also been measured for a number of FRBs (Caleb et al., 2018). Large polarization fractions imply the existence of strong magnetic fields in the progenitor or its immediate environment, while large RMs imply strong magnetic fields along the line of sight. A significant linear polarization fraction was reported for FRBs 110523, 150215, 150418, 150807, 151230 and 160102; circular polarization, while less common, is exhibited by FRB 140514, 150215, and 160102; see Table 1 of (Caleb et al., 2018) for a summary of polarization properties. Measurements of RMs (inconsistent with zero) are reported for FRBs 110523, 150807, and 160102. FRB 121102 remarkably exhibits an RM in excess of rad m-2 and appears to evolve with time (Michilli et al., 2018; Gajjar et al., 2018).
As the number of detected FRBs increases, it may become apparent that there are distinct classes, and that the broadly-varying burst characteristics are due to different emission mechanisms. Statistically robust relationships between observed quantities may also become apparent. For example, from analysis events detected with Parkes and of 20 FRB events detected with ASKAP, Shannon et al. (2018) report a relationship between dispersion and brightness. A relationship between dispersion and scattering also appears to hold (e.g. Amiri et al., 2019a).
Here, we report the detection of a highly-polarized FRB, henceforth FRB 180301. The FRB was detected during Breakthrough Listen bservations of the Galactic plane (Worden et al., 2017; Isaacson et al., 2017). The remainder of this paper is structured as follows. The detection of FRB 180301 is described in § 2, and its detailed verification in §3, following procedures set out in Foster et al. (2018). In particular, we consider evidence for the event being related to a geosynchronous satellite. Details of follow-up observations are given in § 4. In § 5 we discuss our findings, with conclusions drawn in § 6.
2 Observations
FRB 180301 was detected on UTC 2018 March 1 at 07:34:57.969 (MJD 58178.3159487, referenced at 1415 MHz) during Breakthrough Listen (BL) observations with the CSIRO Parkes 64-m radio telescope (see Appendix A for program details). The event occurred in beam 03 of the 21-cm multibeam receiver, the J2000 coordinates of the beam centre during the event were (06:12:43.4, 04:33:44.8), with corresponding Galactic coordinates (, ); the full-width half maximum width of the beam is 14.1 arcmin. After initial verification, an Astronomer’s Telegram was issued to allow for immediate follow-up by other facilities (Price et al., 2018b).
FRB 180301 was detected in real-time using the Berkeley-Parkes-Swinburne Recorder (BPSR) and HI-Pulsar (HIPSR) system (Keith et al., 2010; Price et al., 2016; Keane et al., 2018), which is configured to run in parallel with the BL digital recorder (Price et al., 2018a). Running BPSR is an addition to the original mode of operation, to allow commensal science during BL observations. BPSR records dynamic spectra with a time resolution of , and channel resolution of , spanning the receiver’s usable band 1.182–1.522 GHz. The BPSR system performs a brute-force incoherent de-dispersion search (Barsdell et al., 2012) in real-time, alerting observers via email to candidate FRB events. The BPSR and BL systems are fully independent, and were both recording data at the time of the event.
The BPSR incoherent search pipeline identified FRB 180301 as a candidate FRB event with a signal-to-noise Ratio (S/N) of 16 at a Dispersion Measure (DM) of 520 pc cm-3, using a 2.048 ms boxcar filter; a dynamic spectrum plot of this detection is shown in Figure 10 of Price et al. (2018a). Shortly after visual inspection of the candidate signal, we interrupted regular BL observations, and undertook follow-up observations and calibration procedures.
FRB 180301 was detected in data from both BPSR and the BL recorder; for the analysis presented in this paper, we primarily use BL data products. The BL data recorder system records complex voltage products over 308 MHz of bandwidth (1.2075–1.5155 GHz) to disk in GUPPI raw format (Ford & Ray, 2010), for each of the multibeam receiver’s 13 beams. The voltages are coarsely channelized into sub-bands of width 3.5 MHz using a critically-sampled polyphase filterbank (PFB); further instrument details may be found in Price et al. (2018a). The Parkes BL data recorder shares system design with the BL data recorder at the Green Bank telescope (MacMahon et al., 2018), used in the detection of FRB events from FRB 121102 over 4 to 8 GHz (Gajjar et al., 2018; Zhang et al., 2018).
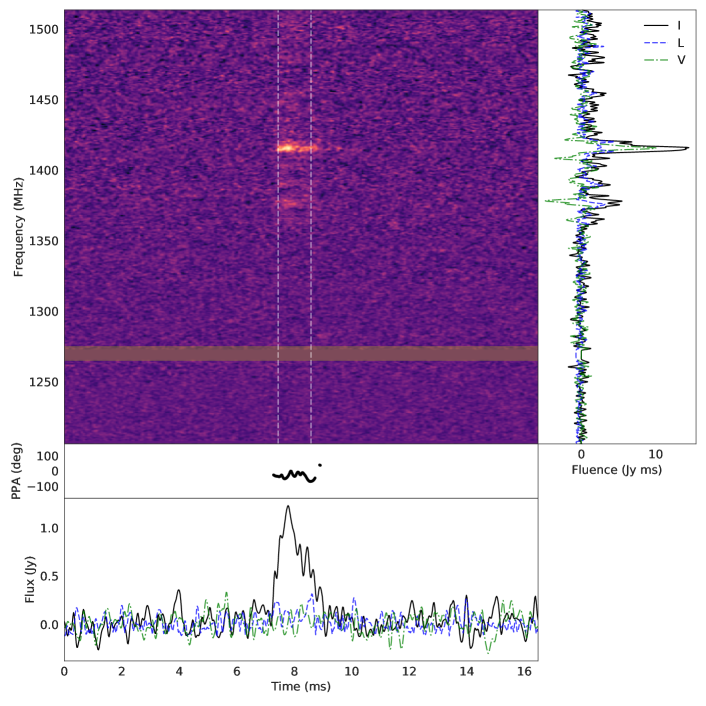
Nyquist-sampled dual-polarization voltage-level products were recorded for all receiver beams during the detection of FRB 180301. These data can be coherently de-dispersed to remove temporal smearing, increasing the S/N to 20, and allow finer control of the time and frequency resolution of derived dynamic spectrum. A coherently de-dispersed dynamic spectrum, with a time and frequency resolution of and kHz, is shown in Figure 1; a summary of the FRB 180301 detection and its derived properties is given in Table 1.
3 Analysis
Here, we detail observed burst characteristics, and apply the tests presented in Foster et al. (2018) as a framework to verify FRB 180301 as astrophysical. A heat map of these test results is shown in Figure 2, the individual tests are discussed throughout this section. Flux calibration was performed by observing calibrator PKS1934638 in each beam at the beginning of the observation, and polarization calibration was performed with noise diode reference observations. Beam 03 had a frequency-averaged System Equivalent Flux Density (SEFD) of 37 Jy. This is higher than the central beam which typically has an SEFD of 30 Jy, predominantly due to dish optics (Staveley-Smith et al., 1996). Assuming the pulse occurred near the centre of beam 03, the frequency-averaged profile has a peak flux of Jy. This is more than twice the originally reported peak flux since using coherent de-dispersion has reduced smearing and allowed for the main pulse to be time resolved.
| Property | Value |
|---|---|
| Identifier | FRB 180301 |
| UTC Date | 2018-03-01 |
| UTC Time | 07:34:57.969 |
| Local Time (AEDT) | 18:34:57.969 |
| Modified Julian Date | 58178.3159487 |
| Telescope / Receiver | Parkes 21-cm multibeam |
| Observing Band | – GHz |
| Local Coords (alt, az) | , |
| Celestial (J2000) () | , |
| Galactic (, ) | , |
| Detection S/N | 16 |
| Optimal S/N | 20 |
| Peak flux density (Jy) | 1.2 |
| DM (pc cm-3) | |
| DM index | |
| Pulse width (W10) (ms)† | |
| Pulse width (W10) (ms)‡ | |
| (ms)‡ | |
| RM (rad m-2)⋆ |

3.1 Radio-Frequency Interference
To assure the quality of the detection, we investigated the state of the telescope and RFI environment. At the beginning of the observation, calibrator source PKS1934-638 was observed in each beam at the expected S/N. The local time during detection was early evening, meaning that the visitor’s centre is closed, and visitor-related RFI sources are fewer. The overall RFI was low during the time of the detection; the Parkes RFI monitor222https://www.narrabri.atnf.csiro.au/observing/rfi/monitor/rfi_monitor.html#parkes, which operates over 0.4–3.0 GHz, does not show any notable RFI events during the observation period. Persistent RFI associated with Global Navigation Satellite System (GNSS) transmitters around 1207 MHz, 1246 MHz, and 1270 MHz regularly seen in Parkes data were present, and removed during calibration. As flux of the pulse was not seen in the lower half of the band, there is no expectation that this RFI is the progenitor of the observed pulse. Following the suggestions in Foster et al. (2018), a DM-trial search from to pc cm-3 (DM step size of 10 pc cm-3) during the time of detection revealed no significant RFI events.
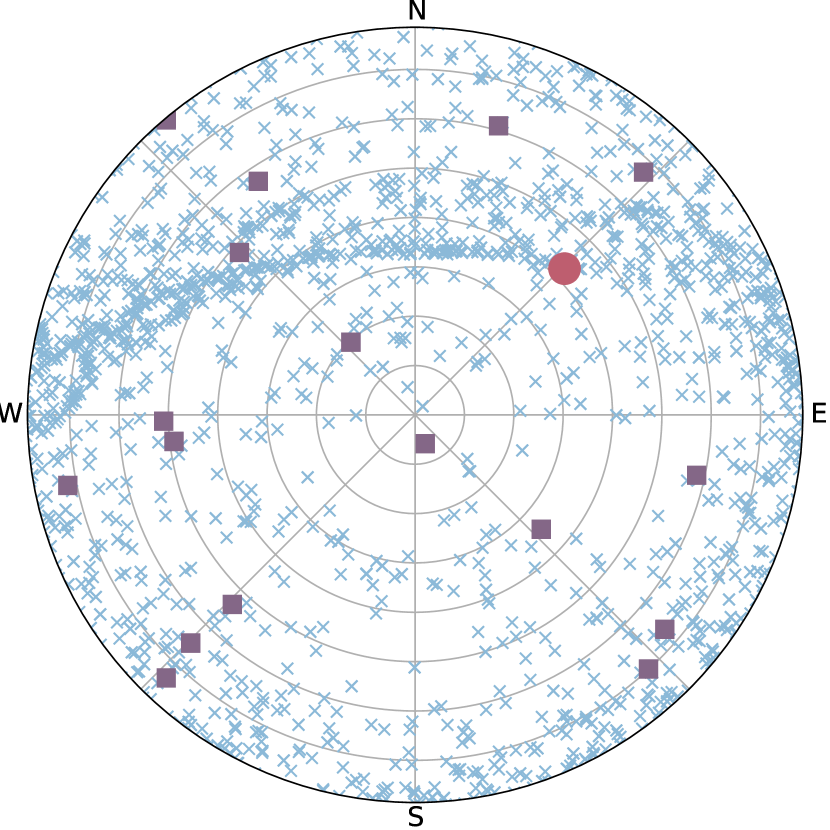
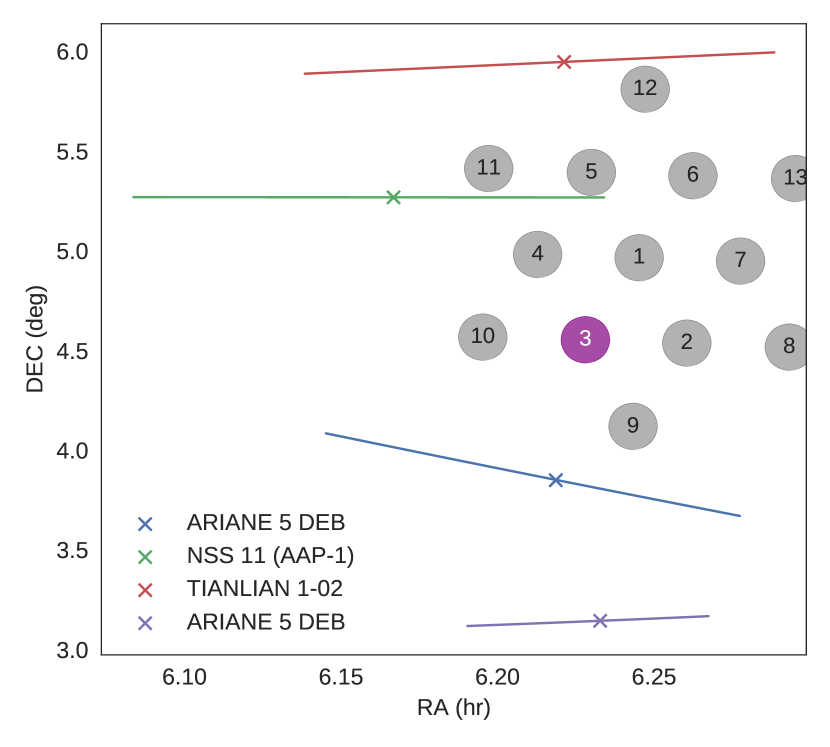
As the telescope was pointed in the region of the sky where geosynchronous satellites operate (declinations ) (Anderson et al., 2015), we extended the low-altitude pointing test in Foster et al. (2018) to also check for the presence of satellites near the beam (within a few degrees). Though commercial satellites are not known to transmit at the frequency of the detected pulse, we still investigated if the source of the event could be due to a satellite. Using public Two-Line Element Set (TLE) orbital parameters of tracked satellites we found geosynchronous satellites (NSS-11, TIANLIAN 1-02) and debris from an Ariane 5 rocket—a European satellite launch vehicle–near the beams at the time of the detection (Figure 3(b)). NSS-11 is a Ku-band broadcast satellite333https://www.ses.com/our-coverage/satellites/355 (12–18 GHz), and Tianlian 1-02 is a Chinese data relay satellite444https://nssdc.gsfc.nasa.gov/nmc/spacecraftOrbit.do?id=2011-032A; neither is known to transmit in the 1 to 2 GHz band. It is possible the event is related to a government satellite —for example military satellites are known to use L-band frequencies— but a complete record of such satellites is not made available publicly.
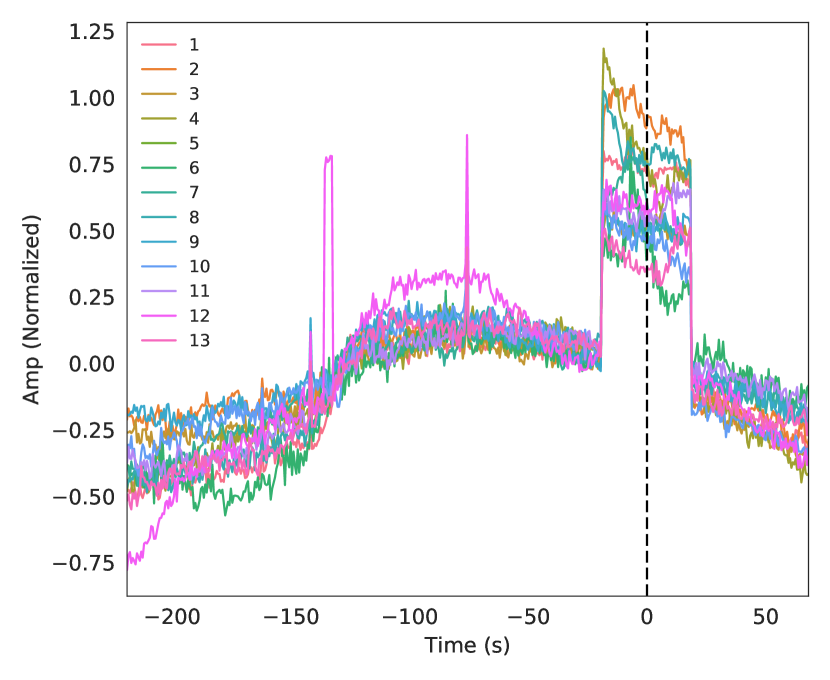
One of the bright regions of the FRB 180301 dynamic spectrum overlaps with the Global Positioning System (GPS) L3 band ( MHz), operated by the United States Air Force (USAF). The L3 band is used as part of the nuclear detection system payload present on every GPS satellite. The detection systems are tested quarter-yearly by the USAF 555https://science.nrao.edu/facilities/gbt/observer-alerts/gps-l3-1381-05-2-5-mhz-test-times. During the detection of FRB 180301 such tests were occurring throughout the satellite constellation (antenna monitor W8 at the Karl G. Jansky Very Large Array (VLA) detected use of this band throughout the day666http://www.vla.nrao.edu/cgi-bin/rfi.cgi). The detection of FRB 180301 occurred at approximately the mid-point of a 30-second period associated with GPS L3 signal transmission (Figure 4). While the total power in Figure 4 increases during transmission, the L3 signal remains within its specified band, and is too faint to appear in the Parkes RFI monitor data. GPS satellites are in Medium Earth Orbit (MEO) and use high-power, wide-beam transmitters. Though a GPS satellite was not near the beams (Figure 3(b)), a satellite tens of degrees off from the pointing centre is still sufficiently powerful to be detected in the side-lobes of all the beams. We note that this satellite emission could possibly go undetected if the spectra had been normalized and re-quantized or if only a short period of time around the burst was examined. We are not able to determine if this L3 transmission is related to the detected burst, or merely coincident in time.
We attempted to further localize the FRB by cross-correlating the complex voltages from each beam with beam 03 to check for beam side-lobe detections, but no detections were made. Additionally, a low-S/N search of the others beams resulted in a non-detection. The brightest spectral structure has a S/N of , non-detection of this emission in the neighboring beams indicates the burst occurred near to the centre of beam 03, or that the intrinsic flux was very large but occurred in an advantageous far side-lobe of the beam (Macquart & Ekers, 2018). Non-detection in adjacent beams indicates the source is likely in the far-field of the dish ( km). Detection occurred when the telescope was locally positioned at azimuth and altitude (). This mid-altitude pointing is far from the horizon that the pulse is not likely associated with a fixed-position RFI source in the far-field.
To summarize, the GPS L3 emission was detected in all beams with similar amplitude (Figure 4), presumably through far-beam side-lobes, whereas the FRB was detected only in beam 03, likely near the beam centre. This supports the model that the burst is not directly related to the GPS L3 emission.
3.2 Dispersion Measure
The peak S/N dispersion measure was fit by performing a coherent de-dispersion at the original detected dispersion measure of 520 pc cm-3, then incoherently de-dispersing over a range of pc cm-3 in increments. A 2-D Gaussian was fit to this trial DM vs. time space to find a peak at pc cm-3. The voltage data was then coherently de-dispersed at this dispersion measure.
A dispersion relation model () was fit to the dispersed pulse resulting in a best fit relation of . The error in the DM and the dispersion relation fit range are larger than other FRBs detected at Parkes, due to the band-limited nature of the pulse. As a point of compariosn, FRBs 110220 and 110703 follow and , respectively (Thornton et al., 2013); FRB 140504 follows (Petroff et al., 2015a).
The line-of-sight Galactic DM contribution is 150 pc cm-3 using the NE2001 model (Cordes & Lazio, 2002) and 252 pc cm-3 using the YWM16 model (Yao et al., 2017). The average of these DM model values results in an excess dispersion of pc cm-3. An upper limit on the distance to the host can be determined by assuming the excess dispersion is due to only the Intergalactic Medium (IGM). Using the Inoue (2004) model results in a distance assuming an average line of sight through the IGM. However, there is a large uncertainty in the IGM dispersion measure contribution. FRB 121102, which appears to be in a dense plasma environment (Michilli et al., 2018), has an estimated host DM contribution of pc cm-3 and a corresponding distance of (Marcote et al., 2017). Assuming the same distance to the host galaxy of FRB 180301 would imply a host DM contribution of pc cm-3.
3.3 Pulse Profile and Scattering Models
Modelling the pulse profile (Figure 1, lower plot) as a Gaussian results in a fit width (at 10% of the peak, W10) of ms. The fluence over the W10 width is Jy ms. This simple model results in a poor fit to the profile, indicating a more complex model, such as a multi-component or scattered profile model, may be necessary. We find a best-fit two-component Gaussian with widths ms and ms separated by ms. Alternatively fitting the (frequency averaged) profile as a Gaussian scattered by an isotropic screen model (Geyer et al., 2017) results in a significantly narrower pulse width (W10) of ms with a scattering timescale of ms at 1.4 GHz. Comparing the residuals of these two models to normal distributions, by means of a Kolmogorov-Smirnov (KS) test, we conclude that the lower-order scattering model performs best (KS-test p-values of 0.89 and 0.46 respectively).
We performed the same model fit for three regions (of comparable S/N) within the spectrum: 1370–1410 MHz, across the bright spectral structure around 1415 MHz and at a higher frequency interval of 1420–1480 MHz (see Table 2). We find no evidence of a frequency-dependent scattering timescale. As there is no clearly preferred pulse profile model, it is possible that FRB 180301 is intrinsically asymmetric.
| (MHz) | W10 (s) | (s) |
|---|---|---|
| 1370 – 1480 | ||
| 1370 – 1410 | ||
| 1410 – 1420 | ||
| 1420 – 1480 |
3.4 Spectro-temporal Structure
The pulse spectrum (Figure 1, right plot) is band- limited with narrow frequency features, potentially due to scintillation. The primary feature of the spectrum is centered around 1415 MHz, this 10 MHz wide feature accounts for a third of the total flux. The spectrum shows lower intensity spectral structures between 1350 MHz and the upper edge of the band at 1500 MHz. There is no apparent flux below 1350 MHz. Due to the complex structure of the spectrum no spectral index model was fit.
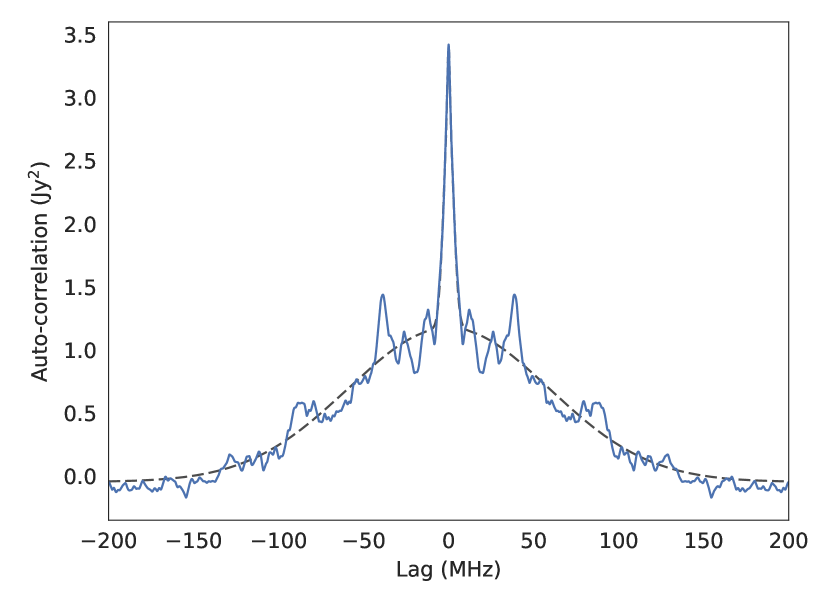
Figure 5 shows the Auto-Correlation Function (ACF) of the time-averaged spectrum over the extent of the W10 pulse width (Figure 1, right plot). A two Gaussian component model is fit to the ACF. The central peak Full-Width at Half-Maximum (FWHM) is MHz which is the characteristic frequency scale of the bright structures seen in the spectrum. The band extent of the observed pulse is MHz determined by the FWHM of the second model component. The fit scattering timescale indicates a scintillation bandwidth of kHz (Cordes & Rickett, 1998), a much smaller scale compared to the measured characteristic size of the spectral structures. The NE2001 line of sight model (Cordes & Lazio, 2002) predicts a scattering timescale of and scintillation bandwidth of 50 kHz, two orders of magnitude off from the fit size scales. The spectrum structure could be intrinsic to the source or due to a complex intervening medium, but we are cautious not to over-interpret this result. A single pulse provides insufficient information to build a scintillation model.
3.5 Polarization and Rotation Measure
The frequency-integrated pulse profile (Figure 1, bottom plot) shows little to no polarization structure but the spectrum (Figure 1, right plot) contains features with significant linear and circular polarization.
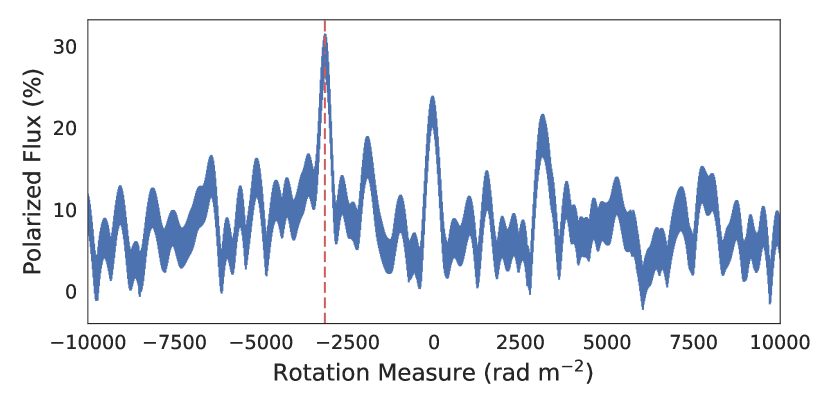
We attempt to fit a Faraday rotation model to the spectrum to account for the observed linear polarization. We used the rotation measure fitting tool rmfit from PSRCHIVE (Hotan et al., 2004) to find the peak linear polarization at a rotation measure of rad m-2. Figure 6 shows the linear polarization flux as a function of rotation measure. There are significant peaks at rad m-2 and rad m-2 indicating Faraday rotation is possibly not a good model to the observed frequency-dependent polarization response.
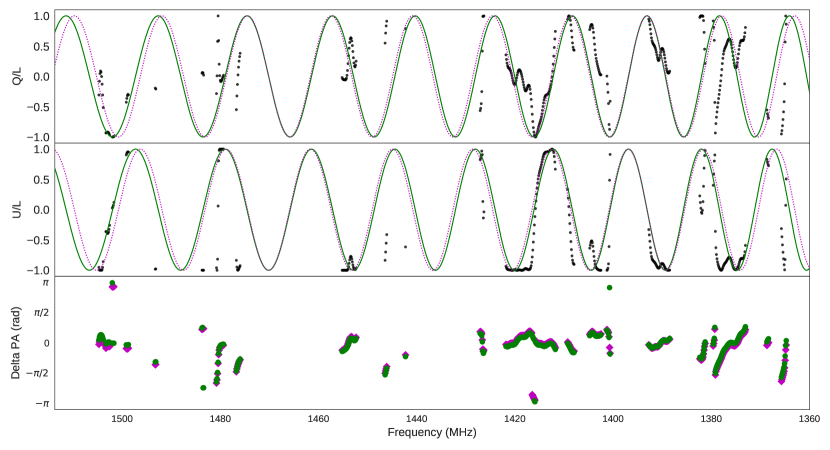
We explored the Faraday rotation model further by performing a similar QU-fitting analysis as that presented in Michilli et al. (2018). We used a Faraday rotation model , and the normalized Q and U values were fit for simultaneously. For reference, a lower order model that scales linearly with wavelength, , was also fit. Figure 7 shows the optimal fit for a Faraday rotated model (green) and a simple –relation (magenta). Only regions of the spectrum where the Stokes I exceeds an S/N of 5 were used for the fitting. A brute-force fit of the parameters in both models was performed, resulting in a Faraday rotation model fit of and a linear modal fit of . Both models result in residuals that are within of each other. The residual polarization angle across the band (bottom plot) shows that neither model completely accounts for the observed polarization structure. It is likely the polarization structure is not due to Faraday rotation alone.
We consider if this frequency-dependent structure is due to a poor polarization calibration. Polarization calibration was performed by using a noise diode reference observation, a standard process when observing with Parkes. We found no frequency-dependent polarization excess. This polarization calibration assumes an ideal feed model for a source detected at the beam centre. Since the location of the detection in the beam was unknown this polarization structure could be due to a frequency-dependent instrumental polarization leakage. Carozzi & Woan (2011) note Parkes has low polarization leakage across a portion of the multibeam band that was measured, but again, this was only reported for the beam centre. If the frequency-dependent polarization structure is instrumental this would indicate the source was located far from the beam centre. The multibeam receiver far side-lobes are not well modelled, as such, we are uncertain if they would induce such a characteristic frequency-dependent structure.
3.6 Cyclostationary analysis
Modulation schemes employed in modern communication exhibit cyclostationary features (Gardner et al., 2006). To search for evidence of signal modulation that would suggest terrestrial origin—or indeed, emission from a technologically advanced extraterrestrial civilization—we performed cyclic spectroscopy (Antoni, 2007, 2009) on the coherently de-dispersed pulse. To maximize S/N, we extracted 10 ms of data around the FRB event from the brightest 3.5 MHz coarse channel (1459.5–1463 MHz). We then computed the cyclic spectral density for the Y-polarization, in which the signal was strongest. No cyclic features were apparent.
To verify this approach, we simulated a transient Binary Phase-Shift Keying (BPSK) signal at the apparent S/N of the FRB, and repeated the analysis. No cyclic features were seen, which suggests that the S/N of the FRB is not high enough to preclude communication emissions exhibiting cyclostationary features. At higher S/N (+20 dB, i.e. 100x), the cyclic features are indeed apparent.
4 Follow-up Observations
After post-detection calibration procedures, we observed FRB 180301 for a further 82 minutes to search for repeated bursts. The BPSR real-time detection system did not report any burst candidates during this period. In order to perform a deeper search, we generated Stokes-I filterbank files from the BL data with time and frequency resolution of and 0.435 MHz. We then searched for pulses over 1207.5–1361.5 MHz and also over 1361.5–1515.5 MHz, with DM range 1–2000 pc cm-3 using the Heimdall package (Barsdell et al., 2012). We visually inspected dynamic spectra surrounding each candidate event with a S/N (8661 candidates), but found no significant events similar to FRB 180301.
As reported in Xin et al. (2018), we also performed optical follow-up observations of FRB 180301 with the 1.35–m SkyMapper telescope in – and –band (Keller et al., 2007) using an email-based triggering mechanism. SkyMapper has a wide field-of-view (5.7 square degrees) that fully covers the Parkes localization region of FRB 180301 (14 arcmin beam size). This automatic response resulted in a sequence of ten 100-second exposures initiated about 3.2 hours after the burst. The first image was obtained at 10:48:28 UTC on 2018 March 1 and the subsequent nine images were slightly dithered to fill in the gaps between CCDs.
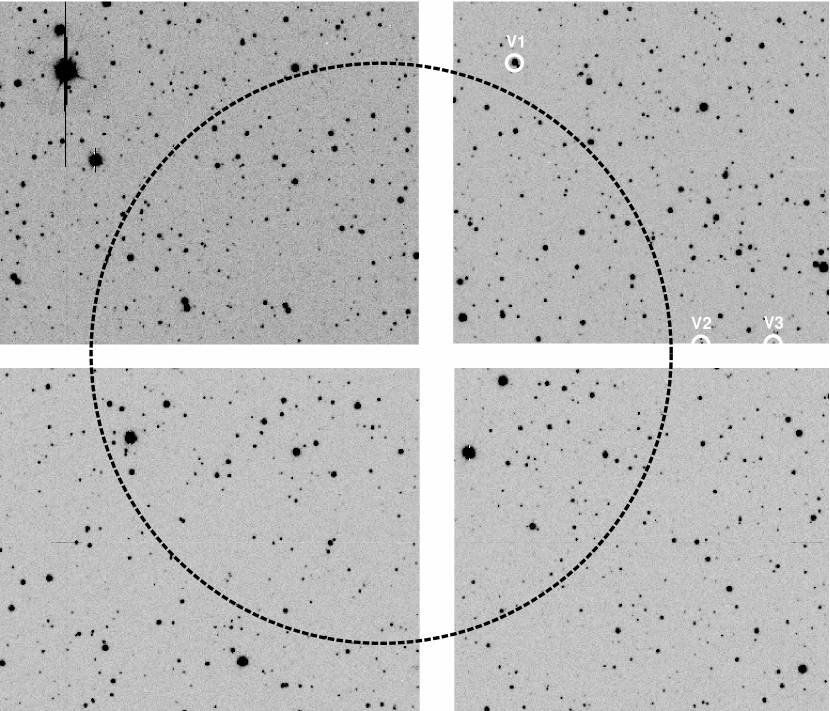
We searched for optical transient candidates within the 14 arcmin Parkes beam using the SkyMapper transient detection pipeline described in Scalzo et al. (2017). A deeper, co-added reference image was taken on 2018 March 9, in order to carry out image subtraction in an optimal manner. Since there is as yet no available calibration sources from the first data release of the SkyMapper Southern Survey (Wolf et al., 2018), we use the APASS catalogue (AAVSO Photometric All Sky Survey: Henden et al. 2016) to estimate 95%–confidence magnitude limits, resulting in point sources detected down to and mag, which is limited by sky brightness from the moon. We find no transient or variable sources within a 7–arcmin radius of the Parkes beam center in any of the resultant images (see Fig. 8).
We triggered observations at the position of FRB180301 in the bands with the Las Cumbres Observatory (Brown et al., 2013) 1–meter telescope network at 13:22 UTC on 2018 March 1. The first images were obtained at 18:06 UTC on 2018 March 1 with one of the 1–meter telescopes at the South African Astronomical Observatory. We find no new sources in the images when performing a visual comparison to archival Digitized Sky Survey images. The images are available for download through the LCO Archive777http://archive.lco.global by searching for object ‘FRB180301’.
Several follow-up observations of FRB 180301 were reported by other facilities. Anumarlapudi et al. (2018) report no evidence for any hard X-ray transient within the energy range of 20–200 keV. Savchenko et al. (2018) report no significant GRB counterpart, estimating a 3-sigma upper limit on the 75–2000 keV fluence of 4.0 erg cm2 for a sub-second with a characteristic short GRB spectrum occurring within 300 s of the FRB 180301 detection.
5 Discussion
FRB 180301 does not fit the prototypical model of an FRB, as shown in the verification heat map (Figure 2). Aside from concerns on the RFI environment, the polarization structure is unusually complex, the pulse appears band limited, we find no preferred pulse profile model, and given the complex spectral structure a spectral index model cannot be fit. Given the ambiguity and atypical features exhibited by FRB 180301, we discuss some concerns, and potential anthropogenic mechanisms, below.
5.1 Anthropogenic or Astrophysical?
The presence of GPS L3 emission during the period of the burst, along with the complex frequency and polarization structure of the pulse, give ambiguous evidence for either an astrophysical or anthropogenic origin.
Also of concern is that three other FRB events, FRB 180309 (Oslowski et al., 2018a), FRB 180311 (Oslowski et al., 2018b), and FRB 180318 (Oslowski, p.c.) were detected with Parkes within 17 days of FRB 180301, which is statistically anomalous. Based on an event rate of events sky-1 day-1 above a 2 Jy ms fluence (Bhandari et al., 2018), we calculate an expectation value of 0.06–0.25 events over the 140 hours of FRB observations during MJD 58178–58196. The corresponding Poissonian probability is . Nevertheless, while the bunching of events is improbable, one cannot conclusively state that one or more of these bursts is spurious.
An anthropogenic pulse origin does potentially solve some open questions. The band-limited pulse is consistent with an antenna transmission model. The complex polarization structure, which does not appear to follow a Faraday model, could be due to signal modulation. The non-repeating nature is explained as a satellite would be moving and these transmissions are rare. The scattering and scintillation time-scale discrepancy is thus explained as the signal is neither scattered nor scintillating.
Nevertheless, there are several arguments against FRB 180301 being GPS-related RFI. Firstly, the GPS transmission bands are well defined, and do not extend over the band of the detected pulse (although it could be a low-power emission from a malfunctioning or unreported sub-system). Unlike radar systems, GPS satellites are not known to emit chirped pulses that could be mistaken for dispersion. Secondly, the L3 emission was detected in all beams, while FRB 180301 was only detected in a single beam. GPS satellites are ubiquitous, so one might further expect such a signal to have been detected previously, or previous detections have been erroneously reported as FRBs. Finally, the pulse is dispersed, which could be due to a radar system, but no such system is present on GPS satellites.
One possible explanation to FRB 180301’s origin is that it is a ground-based L-band (1–2 GHz) wavelength radar reflection used for range-finding during the GPS L3 emission testing. Air Route Surveillance Radar (ARSR) (Niamsuwan et al., 2006; Wang et al., 2012), military radar and telemetry is known to operate at L-band frequencies. GPS was originally a USAF technology developed for military use. A wide-band pulse is common in long-distance range finding; as the observed pulse is band-limited, its duration is consistent with a maximal-power transfer from a ground-based mono-static radar to an object in mid-Earth orbit. Wide-band, dispersed pulses are known to exist and have been previously detected in FRB search pipelines (Foster et al., 2018). The reflected pulse would appear much weaker than the L3 emission, but still dispersed.
Any anthropogenic explanation also needs to explain the frequency-dependent polarization evident in FRB 180301. Polarimetric imaging radar uses polarized pulses to measure the characteristic of surfaces based on scattering, and L-band polarimetric imaging radar systems are known to exist (e.g. Gray et al., 2011).
Katz (2016) argues that space-based radar is unlikely to be the origin of FRBs since the broad range of dispersion measures and pulse characteristics would suggest an implausible number of space-based radar systems (or systems with a peculiar variety of chirp rates), but does not discuss reflections from ground-based radars. We note that the variety in pulse characteristics could be due to deliberate signal obfuscation. Also, the existence of a population of FRB events with broadly ranging characteristics does not mean that one or more events are spurious, as is the case of the simulated pulses and the events detected by the 25-m Nanshan Telescope reported in (Foster et al., 2018).
Kulkarni et al. (2014) note that the chance reflection of a solar flare off a satellite or the Moon could potentially produce an FRB-like event. Using the solar activity database of Sadykov et al. (2017), we searched for coincident solar flare events; no flares were found, and as such we discount this possibility.
5.2 Instrumental or intrinsic polarization?
Faraday rotation can not account for the observed circular polarization in the spectrum. Assuming the pulse is astrophysical, the frequency-dependent circular polarization structure indicates either there is significant instrumental polarization leakage, or that the source is intrinsically polarized.
If the source was detected far from the beam centre, it is possible that instrumental polarization leakage is introducing the frequency-dependent structure. However, measurements of the beam response show the first side-lobe level to be below -25 dB (Macquart & Ekers, 2018), and as such the intrinsic luminosity of the source would be over two orders of magnitude higher than if located the beam centre, closer to the luminosities for ASKAP FRBs as reported in Shannon et al. (2018). However, no detection is made in inter-beam correlations, meaning that a particularly advantageous (and unlikely) side-lobe response in beam 03 is required. If instrumental polarization leakage is introducing a frequency-dependent structure, then a rotation measure fit is not possible without knowledge of where in the beam the event occurred, and an accurate model for the beam response at that point.
If the source occurred in the primary lobe, then the frequency-dependent polarization structure is likely intrinsic to the source. In this case, the polarization structure may provide information about the underlying emission mechanism of the source. However, as no other FRB reported to date has exhibited similar polarization structure, we caution against over interpretation. Whatever the origin, an observer should be careful when applying a Faraday rotation model when the location of the detection in the beam is unknown.
5.3 Comparisons with other FRBs
If FRB 180301 is astrophysical and the polarization structure is primarily due to Faraday rotation, then it bares similarity to FRB 121102 with its complex spectrum and large RM. Though, the fit RM is significantly smaller than that of FRB 121102, no other FRB has a similarly large RM. The magnetic field strength can be estimated to be along the line of sight using Eq. 4 of Han et al. (2006). This is larger than the mean measured large-scale Galactic field strength, but consistent with a high DM source, indicating it is not embedded in a similar environment to FRB 121102 (Michilli et al., 2018).
FRB 180301 has similar spectral characteristics to FRB 170827 (Farah et al., 2018) in that a single, narrow-band component is the dominant contributor to the flux, with lower flux structure spread over a portion of the band. Additionally, there is similar fine structure in the spectrum. Nonetheless, the FRB 180301 profile is wider than FRB 170827, and the events are detected at different frequencies. As only a single polarization was recorded for FRB 170827, its polarization properties are unknown.
FRB 180301, along with FRB 170827 and FRB 121102, are the only events for which complex-voltage data have been captured and reported upon thus far. As other detections used incoherent dedispersion, and in many cases were discovered in 2-bit data products, it could be the case that most FRBs do indeed have a complex spectrum intrinsic to the source and/or due to scintillation, which is only now becoming apparent with our ability to capture voltage data and perform coherent de-dispersion. Alternatively, it could be that there are multiple observational classes of FRBs: one class that fits the prototypical model without complex frequency structure (Foster et al., 2018), and another class that exhibits complex structure. Repeating sources may also turn out to be a distinct class of event.
6 Conclusion
We have reported on the detection of FRB 180301, a highly-polarized FRB that exhibits complex frequency structure. Other than FRB 121102, the detection of FRB 180301 is the most complete in terms of addition information for an FRB captured to date. This has allowed a detailed analysis of the coherently dedispersed pulse and its polarization characteristics.
We performed a rigorous set of tests to verify FRB 180301 as astrophysical, but we are unable to definitively state that FRB 180301 is not related to human activity. Applying coherent de-dispersion to the signal has revealed complex structure, but it is unclear that this structure should be attributed to astrophysical origin. Of particular concern in this instance is the proximity of the event to the geosynchronous orbit belt, and that a GPS testing campaign is known to have been conducted during the day. While circumstantial, the statistically unlikely detection of four FRBs at Parkes within a 17-day period is also troublesome.
While we approach our classification of FRB 180301 with caution that it may be RFI, we do not suggest that all FRBs are anthropogenic. Observations of FRB 121102 have shown, unequivocally, that its emission is astrophysical. The existence of a population of FRBs, detected at multiple telescopes, all displaying astrophysical characteristics, remains strong evidence that FRBs are genuinely an astrophysical phenomena. Nevertheless, as our analysis shows, without precise localization capabilities, conclusive verification of a single event remains challenging.
Interferometric and multi-site detection are essential to rule out satellites as FRB progenitors. Arrays with Fresnel zones farther out than Geosynchronous Orbit (GEO) orbits (36000 km)—which at 1.4 GHz corresponds to 2 km baselines—will be capable of precluding satellites, or chance reflections off space debris, as sources of FRB-like RFI. ASKAP, MeerKAT, and other upcoming instruments meet this criterion.
The complex voltage data and intermediate data products are publicly hosted at the Breakthrough Listen data center. Jupyter notebooks with our analysis are hosted on our public git repository888https://github.com/griffinfoster/frb180301-analysis.
Acknowledgements
We thank Jim Cordes, Jason Hessels, Simon Johnston, Dan Mertely, and Allison Rung for their comments and help. Breakthrough Listen is managed by the Breakthrough Initiatives, sponsored by the Breakthrough Prize Foundation. The Parkes radio telescope is part of the Australia Telescope National Facility which is funded by the Australian Government for operation as a National Facility managed by CSIRO. SkyMapper is owned and operated by The Australian National University’s Research School of Astronomy and Astrophysics; national facility capability is funded through Australian Research Council LIEF grant LE130100104. Parts of this project were conducted by the Australian Research Council Centre of Excellence for All-sky Astrophysics (CAASTRO), through project number CE110001020. Support for IA was provided by NASA through the Einstein Fellowship Program, grant PF6-170148.
References
- Amiri et al. (2019b) Amiri M., et al., 2019b, Nature
- Amiri et al. (2019a) Amiri M., et al., 2019a, Nature
- Anderson et al. (2015) Anderson P. V., McKnight D. S., Pentino F., Schaub H., 2015, in 66th International Astronautical Congress, IAC-15 A. p. 7
- Antoni (2007) Antoni J., 2007, Mechanical Systems and Signal Processing, 21, 597
- Antoni (2009) Antoni J., 2009, Mechanical Systems and Signal Processing, 23, 987
- Anumarlapudi et al. (2018) Anumarlapudi A., Aarthy E., Arvind B., Bhalerao V., Bhattacharya D., Rao A. R., Vadawale S., 2018, The Astronomer’s Telegram, 11417, 1
- Bannister et al. (2017) Bannister K. W., et al., 2017, ApJ, 841, L12
- Barsdell et al. (2012) Barsdell B. R., Bailes M., Barnes D. G., Fluke C. J., 2012, MNRAS, 422, 379
- Bhandari et al. (2018) Bhandari S., et al., 2018, MNRAS, 475, 1427
- Brown et al. (2013) Brown T. M., et al., 2013, PASP, 125, 1031
- Burke-Spolaor et al. (2011) Burke-Spolaor S., Bailes M., Ekers R., Macquart J.-P., Crawford III F., 2011, ApJ, 727, 18
- Burke-Spolaor et al. (2016) Burke-Spolaor S., et al., 2016, ApJ, 826, 223
- CHIME/FRB Collaboration et al. (2018) CHIME/FRB Collaboration et al., 2018, ApJ, 863, 48
- Caleb et al. (2017) Caleb M., et al., 2017, MNRAS, 468, 3746
- Caleb et al. (2018) Caleb M., et al., 2018, MNRAS, 478, 2046
- Carozzi & Woan (2011) Carozzi T. D., Woan G., 2011, IEEE Transactions on Antennas and Propagation, 59, 2058
- Chatterjee et al. (2017) Chatterjee S., et al., 2017, Nature, 541, 58
- Chawla et al. (2017) Chawla P., et al., 2017, ApJ, 844, 140
- Cordes & Lazio (2002) Cordes J. M., Lazio T. J. W., 2002, arXiv e-prints, pp astro–ph/0207156
- Cordes & Rickett (1998) Cordes J. M., Rickett B. J., 1998, ApJ, 507, 846
- Deng & Zhang (2014) Deng W., Zhang B., 2014, ApJ, 783, L35
- Dolag et al. (2015) Dolag K., Gaensler B. M., Beck A. M., Beck M. C., 2015, MNRAS, 451, 4277
- Enriquez et al. (2017) Enriquez J. E., et al., 2017, ApJ, 849, 104
- Farah et al. (2018) Farah W., et al., 2018, MNRAS, 478, 1209
- Ford & Ray (2010) Ford J., Ray J., 2010, Fourth International Workshop on High-Performance Reconfigurable Computing Technology and Applications, pp 1–7
- Foster et al. (2018) Foster G., et al., 2018, MNRAS, 481, 2612
- Gajjar et al. (2018) Gajjar V., et al., 2018, ApJ, 863, 2
- Gardner et al. (2006) Gardner W. A., Napolitano A., Paura L., 2006, Signal Process., 86, 639
- Geyer et al. (2017) Geyer M., et al., 2017, MNRAS, 470, 2659
- Gray et al. (2011) Gray D., et al., 2011, in 2011 3rd International Asia-Pacific Conference on Synthetic Aperture Radar (APSAR). pp 1–4
- Han et al. (2006) Han J. L., Manchester R. N., Lyne A. G., Qiao G. J., van Straten W., 2006, ApJ, 642, 868
- Henden et al. (2016) Henden A. A., Templeton M., Terrell D., Smith T. C., Levine S., Welch D., 2016, VizieR Online Data Catalog, 2336
- Hotan et al. (2004) Hotan A. W., van Straten W., Manchester R. N., 2004, Publ. Astron. Soc. Australia, 21, 302
- Inoue (2004) Inoue S., 2004, MNRAS, 348, 999
- Isaacson et al. (2017) Isaacson H., et al., 2017, PASP, 129, 054501
- Jankowski et al. (2018) Jankowski F., van Straten W., Keane E. F., Bailes M., Barr E. D., Johnston S., Kerr M., 2018, MNRAS, 473, 4436
- Katz (2016) Katz J. I., 2016, ApJ, 818, 19
- Keane (2018) Keane E. F., 2018, Nature Astronomy, 2, 865
- Keane et al. (2018) Keane E. F., et al., 2018, MNRAS, 473, 116
- Keith et al. (2010) Keith M. J., et al., 2010, MNRAS, 409, 619
- Keller et al. (2007) Keller S. C., et al., 2007, Publ. Astron. Soc. Australia, 24, 1
- Kulkarni et al. (2014) Kulkarni S. R., Ofek E. O., Neill J. D., Zheng Z., Juric M., 2014, ApJ, 797, 70
- Law et al. (2015) Law C. J., et al., 2015, ApJ, 807, 16
- Lorimer et al. (2007) Lorimer D. R., Bailes M., McLaughlin M. A., Narkevic D. J., Crawford F., 2007, Science, 318, 777
- MacMahon et al. (2018) MacMahon D. H. E., et al., 2018, PASP, 130, 044502
- Macquart & Ekers (2018) Macquart J.-P., Ekers R. D., 2018, MNRAS, 474, 1900
- Marcote et al. (2017) Marcote B., et al., 2017, ApJ, 834, L8
- Masui et al. (2015) Masui K., et al., 2015, Nature, 528, 523
- Michilli et al. (2018) Michilli D., et al., 2018, Nature, 553, 182
- Niamsuwan et al. (2006) Niamsuwan N., Guner B., Johnson J., 2006, in 2006 IEEE International Symposium on Geoscience and Remote Sensing. pp 2285–2288, doi:10.1109/IGARSS.2006.591
- Oslowski et al. (2018a) Oslowski S., et al., 2018a, The Astronomer’s Telegram, 11385, 1
- Oslowski et al. (2018b) Oslowski S., et al., 2018b, The Astronomer’s Telegram, 11396, 1
- Petroff et al. (2015a) Petroff E., et al., 2015a, MNRAS, 447, 246
- Petroff et al. (2015b) Petroff E., et al., 2015b, MNRAS, 451, 3933
- Petroff et al. (2016) Petroff E., et al., 2016, Publ. Astron. Soc. Australia, 33, e045
- Price et al. (2016) Price D. C., Staveley-Smith L., Bailes M., Carretti E., Jameson A., Jones M. E., van Straten W., Schediwy S. W., 2016, Journal of Astronomical Instrumentation, 5, 1641007
- Price et al. (2018a) Price D. C., et al., 2018a, Publ. Astron. Soc. Australia, 35
- Price et al. (2018b) Price D. C., et al., 2018b, The Astronomer’s Telegram, 11376, 1
- Ravi (2019) Ravi V., 2019, MNRAS, 482, 1966
- Sadykov et al. (2017) Sadykov V. M., Kosovichev A. G., Oria V., Nita G. M., 2017, The Astrophysical Journal Supplement Series, 231, 6
- Savchenko et al. (2018) Savchenko V., et al., 2018, The Astronomer’s Telegram, 11386, 1
- Scalzo et al. (2017) Scalzo R. A., et al., 2017, Publ. Astron. Soc. Australia, 34, e030
- Shannon et al. (2018) Shannon R. M., et al., 2018, Nature, 562, 386
- Siemion et al. (2015) Siemion A., et al., 2015, in Advancing Astrophysics with the Square Kilometre Array (AASKA14). p. 116 (arXiv:1412.4867)
- Spitler et al. (2016) Spitler L. G., et al., 2016, Nature, 531, 202
- Staveley-Smith et al. (1996) Staveley-Smith L., et al., 1996, Publ. Astron. Soc. Australia, 13, 243
- Thornton et al. (2013) Thornton D., et al., 2013, Science, 341, 53
- Walters et al. (2018) Walters A., Weltman A., Gaensler B. M., Ma Y.-Z., Witzemann A., 2018, ApJ, 856, 65
- Wang et al. (2012) Wang J., Brookner E., Cornwell P., Gerecke M., Farr J., 2012, IEEE Transactions on Aerospace Electronic Systems, 48, 103
- Wolf et al. (2018) Wolf C., et al., 2018, Publ. Astron. Soc. Australia, 35, e010
- Worden et al. (2017) Worden S. P., et al., 2017, Acta Astronautica, 139, 98
- Xin et al. (2018) Xin L., Wang J., Wei J., 2018, The Astronomer’s Telegram, 11438, 1
- Yao et al. (2017) Yao J. M., Manchester R. N., Wang N., 2017, ApJ, 835, 29
- Zhang et al. (2018) Zhang Y. G., Gajjar V., Foster G., Siemion A., Cordes J., Law C., Wang Y., 2018, ApJ, 866, 149
- Zhou et al. (2014) Zhou B., Li X., Wang T., Fan Y.-Z., Wei D.-M., 2014, Phys. Rev. D, 89, 107303
Appendix A Breakthrough Listen
BL is a ten-year initiative directed at detecting technosignatures that would indicate the presence of advanced life beyond Earth (Worden et al., 2017). The initial BL program uses the 100-m Robert C. Byrd Green Bank telescope in West Virginia, USA, and the 64-m CSIRO Parkes radio telescope to observe a selection of 1709 nearby stars and 100 nearby galaxies, along with surveying the Galactic plane (Isaacson et al., 2017; Enriquez et al., 2017). In addition, the 2.4-m Automated Planet Finder optical telescope is also being used, to conduct a search for narrow-band optical transmissions from targets within the 1709-star sample. Combined, the observations from these telescopes constitutes the most comprehensive search for technosignatures to date.
In the initial years of the program, 25% of the total observing time of the Parkes telescope is assigned for BL activities. Observations are typically scheduled for 10-11 hours per day, up to 4-5 times per week. A major component of the BL program at Parkes is a 21-cm wavelength Galactic plane survey, which utilizes the Parkes multibeam receiver (Staveley-Smith et al., 1996). The survey covers Galactic latitudes over the range of Galactic longitudes accessible with Parkes, . Similar to the High-Time Resolution Universe (HTRU) survey (Keith et al., 2010), a step-and-stare approach with 5-minute pointings is employed. Each beam of the multibeam receiver is separated by 14 arcmin in one plane, and arcmin in the other plane. As the FWHM beamwidth of the receiver is 14 arcmin at 21-cm wavelength, interleaved pointings allow for the survey area to be efficiently covered with tessellated pointings (see Figure 2 of Keith et al. 2010).
While the BL survey follows a similar observational strategy to the HTRU and SUrvey for Pulsars and Extragalactic Radio Bursts (SUPERB) surveys (Keane et al., 2018), technosignature searches require a far higher spectral resolution ( Hz, Siemion et al. 2015) than that available in archival data products from the HTRU/SUPERB surveys ( kHz). As such, new digital recorder systems have been installed at both the Parkes and Green Bank observatories to allow voltage capture to disk across the full bandwidth of the available receivers (MacMahon et al., 2018; Price et al., 2018a).