Gas bubble evolution on microstructured silicon substrates †
Peter van der Linde, Pablo Peñas-López, Álvaro Moreno Soto, Devaraj van der Meer,c Detlef Lohse,c Han Gardeniers,a and David Fernández Rivas ∗a
The formation, growth and detachment of gas bubbles on electrodes are omnipresent in electrolysis and other gas-producing chemical processes. To better understand their role in the mass transfer efficiency, we perform experiments involving successive bubble nucleations from a predefined nucleation site which consists of a superhydrophobic pit on top of a micromachined pillar. The experiments on bubble nucleation at these spots permit the comparison of mass transfer phenomena connected to electrolytically generated H2 bubbles with the better-understood evolution of CO2 bubbles in pressure-controlled supersaturated solutions. In both cases, bubbles grow in a diffusion-dominated regime. For CO2 bubbles, it is found that the growth rate coefficient of subsequent bubbles always decreases due to the effect of gas depletion. In contrast, during constant current electrolysis the bubble growth rates are affected by the evolution of a boundary layer of dissolved H2 gas near the flat electrode which competes with gas depletion. This competition results in three distinct regimes. Initially, the bubble growth slows down with each new bubble in the succession due to the dominant depletion of the newly-formed concentration boundary layer. In later stages, the growth rate increases due to a local increase of gas supersaturation caused by the continuous gas production and finally levels off to an approximate steady growth rate. The gas transport efficiency associated with the electrolytic bubble succession follows a similar trend in time. Finally, for both H2 and CO2 bubbles, detachment mostly occurs at smaller radii than theory predicts and at a surprisingly wide spread of sizes. A number of explanations are proposed, but the ultimate origin of the spreading of the results remains elusive.
1 Introduction
Hydrogen is a promising energy carrier that can be obtained via zero CO2 emission techniques1, 2, 3 such as solar-driven water splitting.4, 5, 6, 7 However, the chemical reactions involved in such processes result in bubble generation. Such bubbles can block the reacting surfaces and decrease the process efficiency.8, 9
The formation of bubbles on liquid-immersed surfaces is relevant for many gas-producing processes such as boiling,10 catalysis11, 12 and electrolysis.13, 14 More specifically, the formation of bubbles during chemical processes may be either beneficial due to increased heat and mass transfer induced by convection upon bubble detachment,15 or detrimental due to overpotentials caused by blocked active sites on the electrodes.16, 17, 18
Bubbles preferably nucleate in small defects such as pits or crevices, where gas can be easily entrapped and the energy barrier is smallest.19 A certain control over the location at which bubbles are prone to nucleate can be achieved by modifying the topography of the solid surface with suitable microstructures that act as preferential nucleation sites. The robustness of this concept has been demonstrated during pressure pulse propagation,20 ultrasound exposure,21 turbulent boiling 22 and under liquid flow conditions.23 For this purpose, pillars are fabricated as preferential nucleation sites for bubbles, as shown in Figure 1D, following a long-term line of research in our group with the aim of understanding and controlling the bubble evolution as a function of gas diffusion.24, 25, 26, 27
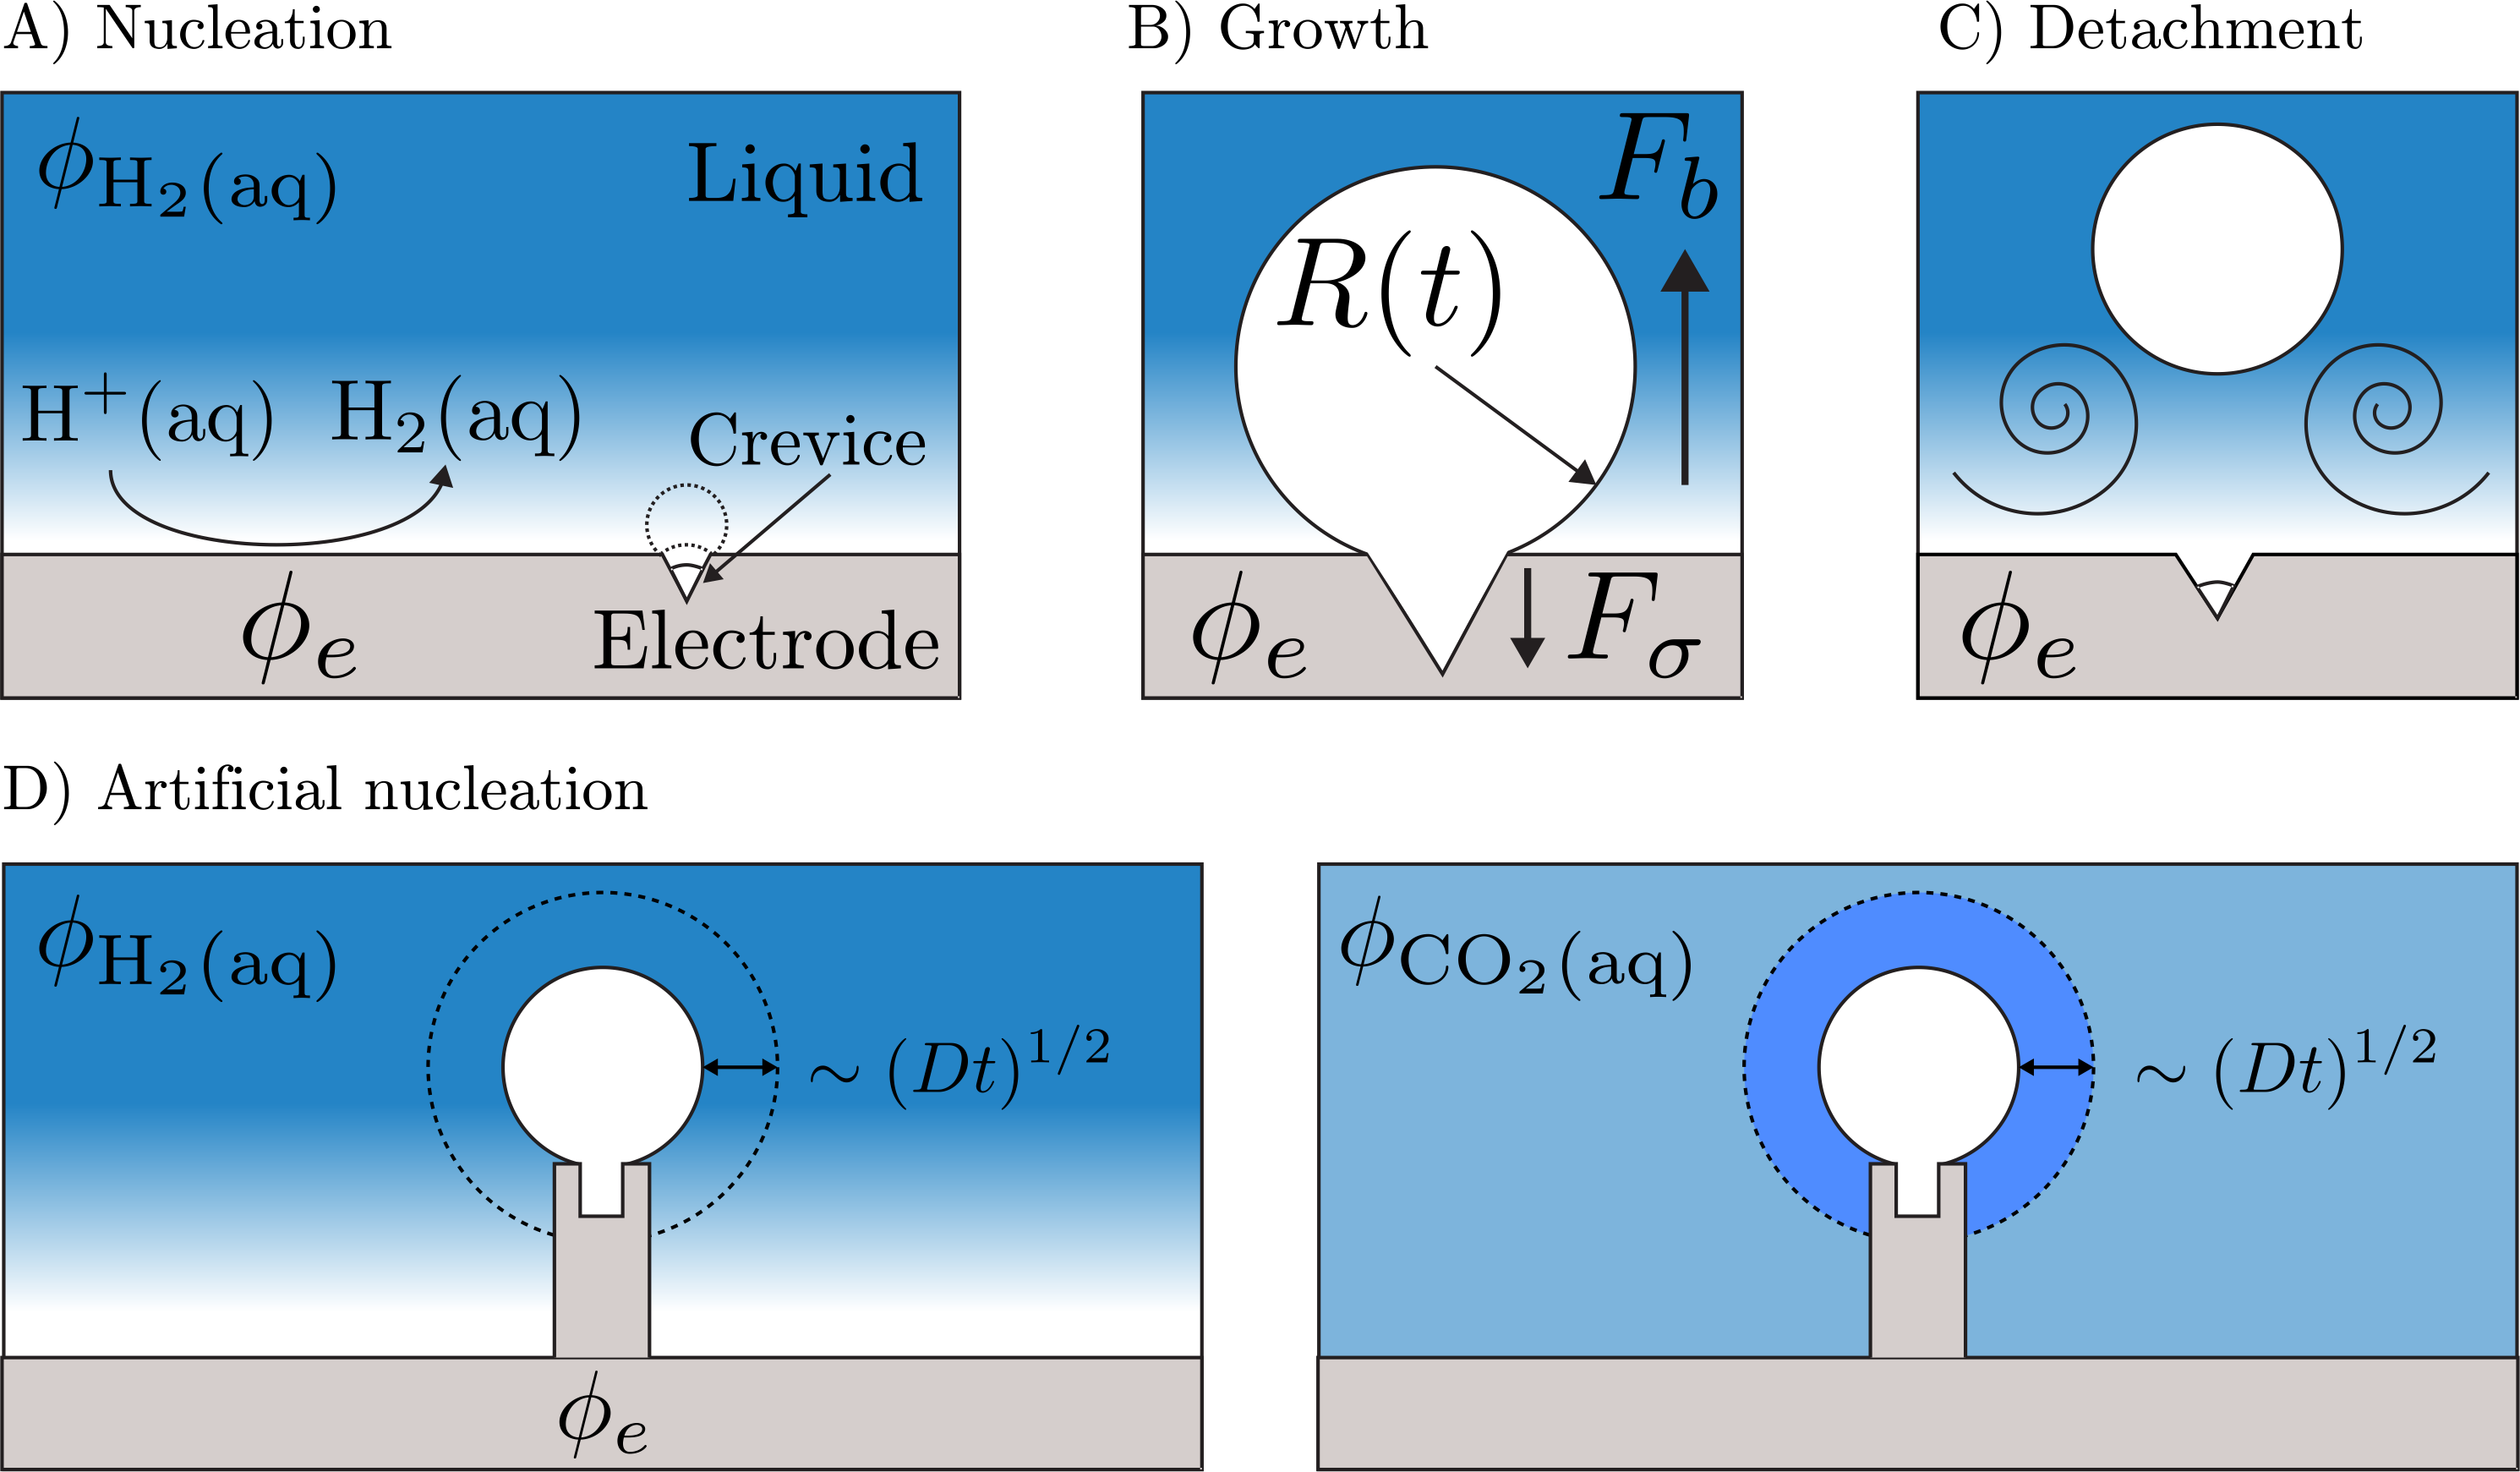
Three different phases can be distinguished during bubble evolution as shown in Figure 1: bubble nucleation at the surface (Figure 1A), growth (Figure 1B) and detachment (Figure 1C). In this study, we provide an in-depth comparative analysis between bubble evolution on a single pillar during electrolysis and the better-understood bubble evolution in pressure-controlled CO2 supersaturated solutions on the same geometry, working out similarities and differences between the two processes. Our ultimate goal is to increase energy conversion efficiencies of solar-driven water splitting systems by controlling the gas bubble evolution on micromachined electrodes.
1.1 Outlook
In this fundamental study, we have investigated the isolated bubble evolution on artificial nucleation sites micromachined on electrodes. The knowledge achieved with our experimental and theoretical work can certainly assist in the design of novel devices in the future. These future works could use nucleation sites to prevent the crossover of species in configurations in which the electrodes could be used to drive the bubbles to different streams 28 or to facilitate buoyancy driven separation mechanisms.29 Artificial nucleation sites could also be used to evolve bubbles in predefined locations, a scenario which has been suggested to give rise to increased flexibility in device design, optimization and operation.30 The use of multiple nucleation sites on electrodes permits the definition of areas on the electrodes where bubbles are generated such that they do not compete for evolved gas as well as areas where they do. This could determine areas on the electrode surface where bubbles do not form, and dedicated areas where bubbles do form and would allow for controlled bubble formation at higher current densities. Major advantages could lie in designing electrodes where the catalytic surface is kept free from bubbles.
2 Materials and methods
2.1 Microfabrication of silicon substrates
Micropillars on the surface of the electrode increase the active area and contact with the liquid phase, ultimate characteristics which are desirable in photolysis applications.31, 32 This approach encourages the construction of small and dense structures which work as light-harvesting areas. With the aim of understanding the fundamentals of bubble evolution on pillars, we focus on a single pillar microstructure of radius m to study the succession of single bubbles generated on them. A superhydrophobic pit on top of the micropillar serves as the nucleation site.19
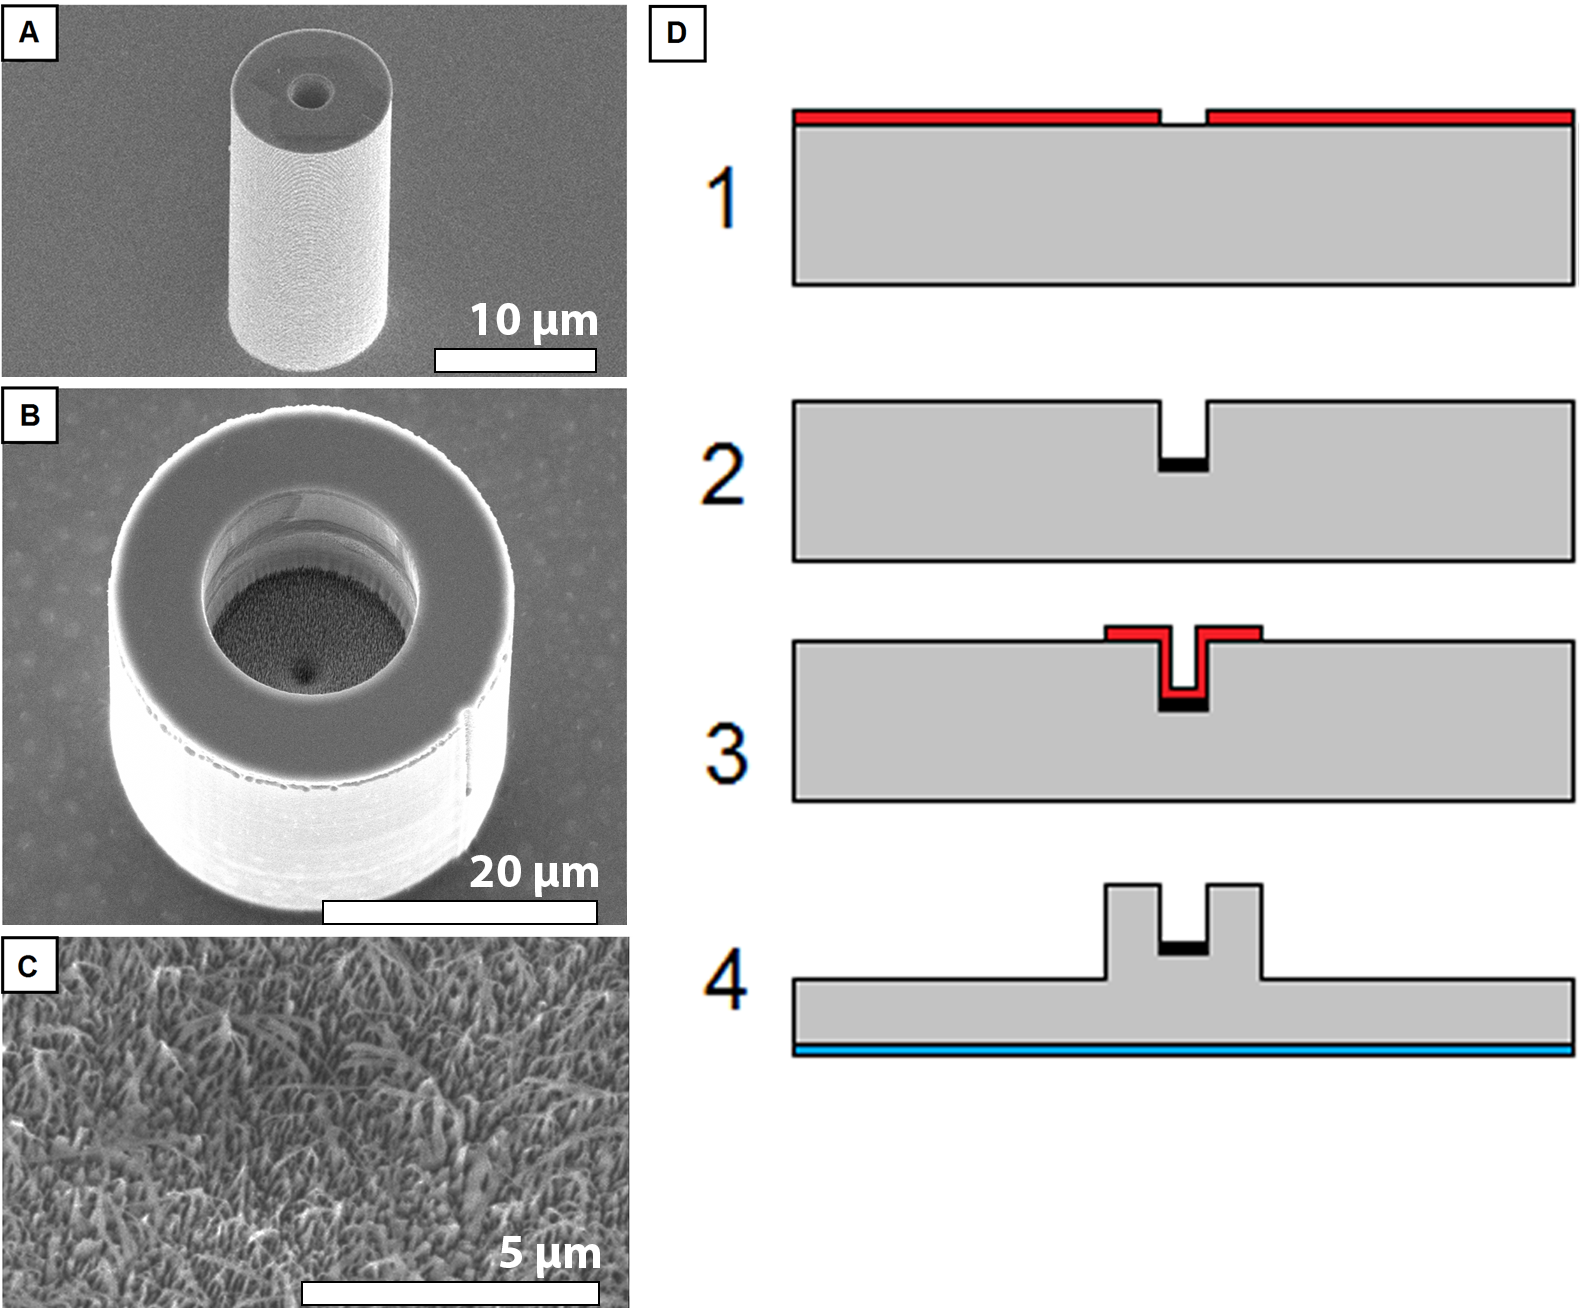
Boron-doped silicon wafers with (100) crystal orientation, resistivity in the range of 0.01 cm – 0.025 cm, thickness of 525 m and single side polished, were covered by 1.7 m Olin OiR 907-17 resist. Using photolithography, circular regions ranging m in radius were defined, as shown in step 1 in Figure 2D. The circular regions were etched with a deep reactive ion etching (DRIE) Bosch process (Adixen AMS100SE) to a depth of 20 m. Black silicon was formed at the bottom of the pits with DRIE, as shown in step 2 in Figure 2D. Black silicon is an important structure that allows for better gas trapping while immersing the substrates in liquid. Afterwards, additional fluorocarbons were deposited ( 40 nm/min) inside the pits, turning them superhydrophobic.33 The deposition times varied per set of samples between 7 s to 60 s.
The pillar radii were defined with photolithography as shown in step 3 in Figure 2D. These pillars were etched with DRIE to various heights in the range of 0 m – 60 m. An aluminium contact was created via DC-sputtering with a thickness of 100 nm (99 Al, 1 Si) at the bottom of the substrate, as shown in step 4 in Figure 2D. An ultrasound (VWR Ultrasonic Cleaner USC-THD, 45 kHz) acetone bath was used to remove the resist. Afterwards, the wafers were diced (Disco DAD 321) into mm mm square substrates. Prior to the measurements, the samples were cleaned with another ultrasound acetone bath step. Figure 2A-B shows SEM images of fabricated micropillars and Figure 2C shows the black silicon inside the superhydrophobic pit.
2.2 Experimental set-ups for bubble evolution
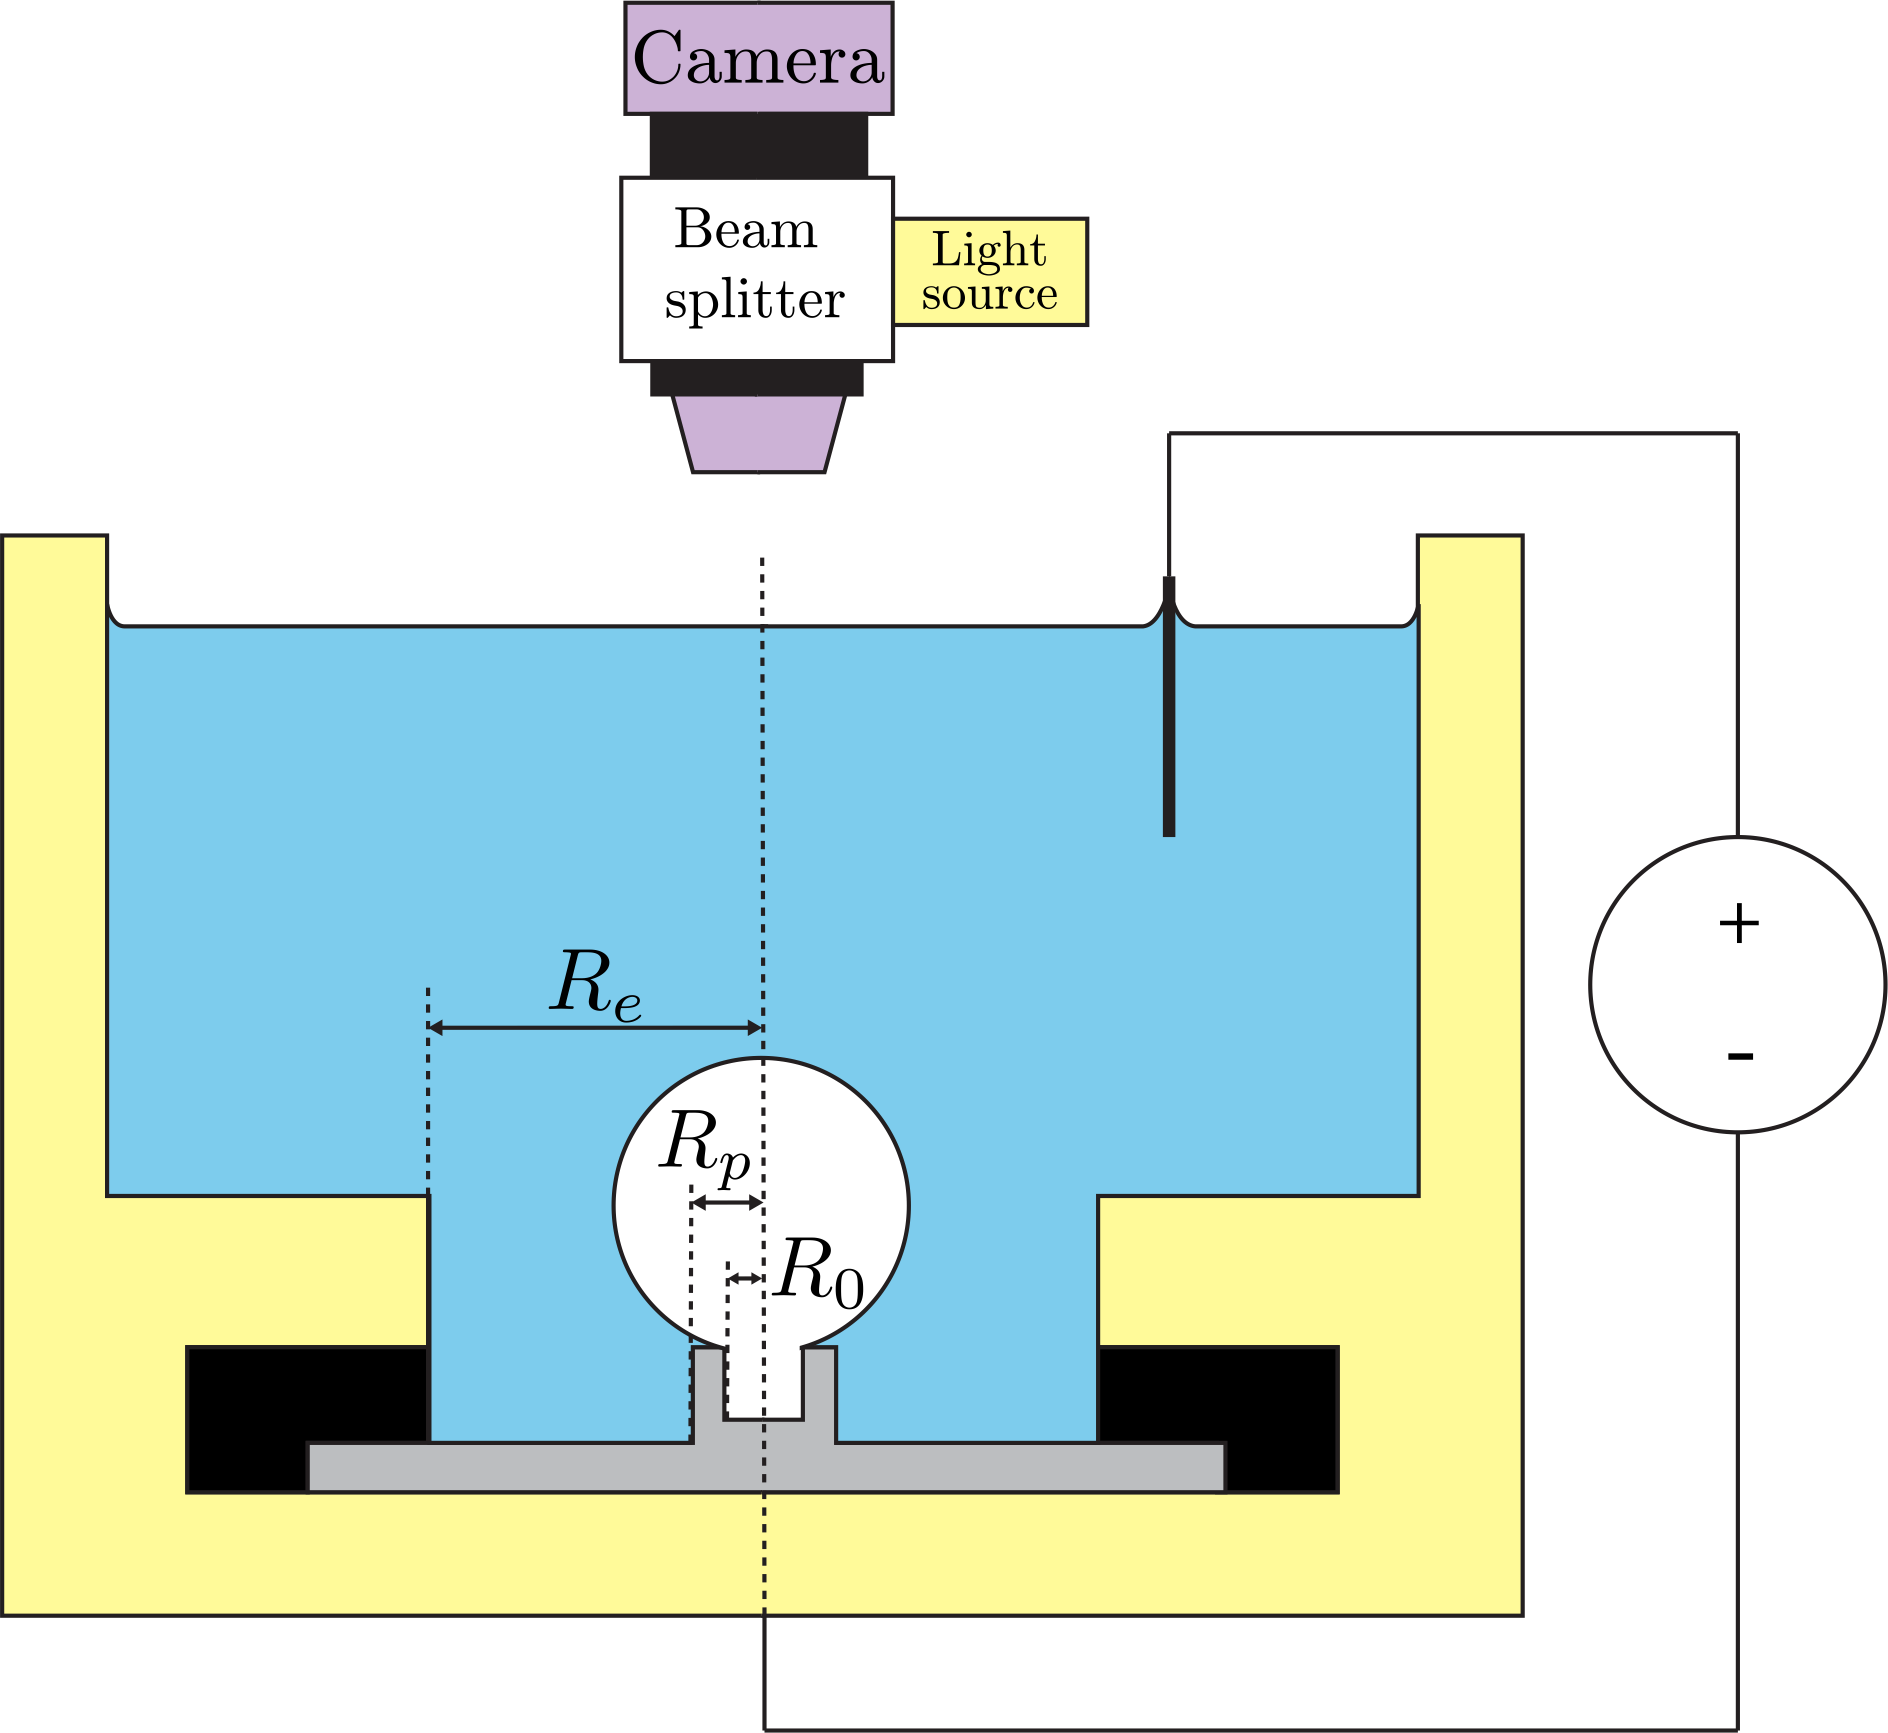
Figure 3 shows the electrolysis set-up, consisting of a custom-made acrylic holder, a camera and a power source. The acrylic holder is designed to keep the substrate in place, to hold a platinum wire counter electrode far away from the growing bubble and to contain the electrolyte. A circular area of the silicon substrate with radius mm and sealed to the holder with a Teflon ring is in contact at all times with the electrolyte. This radius is approximately ten times the maximum bubble radius and, therefore, we can assume that the holder walls do not play any significant role during bubble growth on the pillars. The substrate contains an electrical contact at the bottom aluminium layer through which the current is supplied (not shown in Figure 3 for simplicity). A Keithley 2410 power source is used to drive the constant-current electrolysis. For optical imaging, a Flea®3 Monochrome Camera, (optical resolution of 1.1 m/pixel) is coupled to a 50/50 Beam-splitter Cube. For illumination, a Galvoptics KL2500 LCD 230V light source is used.
At the beginning of each experiment, the holder is filled with 20 mL of fresh electrolyte. The electrolyte consists of a solution of non-degassed Milli-Q water with 10 mM \ceNa2SO4 salt and a pH 3 buffer of 1 mM anhydrous sodium acetate and 0.1 M acetic acid. The temperature remains constant at all times, ∘C. During each experiment, a constant current in the range of 10 A – 600 A is supplied. The resulting current density falls in the range of 0.3 A/m2 – 15 A/m2. The potentials during experiments were measured within a range of 1.8 V to 4.9 V.
To compare the evolution of H2 bubbles generated by electrolysis with that of CO2 bubbles growing in an initially uniformly supersaturated solution, identical silicon substrates are placed within a pressurized test chamber (pressure bar) that is filled with carbonated water previously saturated at the same pressure. By lowering the pressure to approximate values of bars, a supersaturation of is achieved following Henry’s law (at constant temperature) and, consequently, bubbles nucleate and grow on the predefined spots. A detailed description of this experimental set-up and procedure can be found elsewhere.24, 26
3 Results and discussion
3.1 Bubble nucleation on a superhydrophobic pit
The superhydrophobic pit entraps a gas pocket upon submersion in a liquid20 and hence acts as a site for heterogeneous nucleation. The interfacial or equilibrium concentration of dissolved gas at a liquid-gas interface can be written as according to Henry’s law, where is Henry’s constant (a decreasing function of temperature specific to each gas-liquid pair) and is the partial pressure of the gas acting on the liquid surface.34 For a pit with a circular opening of radius , the pressure threshold at which bubbles begin to grow is given by the condition33
| (1) |
where is the liquid vapor pressure, is the liquid pressure and N/m is the liquid-gas interfacial tension (for simplification, we assume a constant value for both H2 and CO2 cases). The radius in the Laplace pressure term (last term in (1)) is justified since, at the nucleation stage, the bubble can be assumed to be a hemispherical cap of radius growing from the pit with the same radius. Equation (1) reflects that the pressure inside the bubble must overcome the forces resulting from the liquid pressure and surface tension to achieve bubble growth. If a multicomponent solution of volatile ideal gas species is considered, the condition for growth in (1) can be approximated as:35
| (2) |
where is the supersaturation of the dissolved gas species (in general, position and time dependent), with being the gas concentration in mol/m3. With this equation, we can calculate the critical minimum supersaturation level required to overcome the energy barrier due to surface tension.
For the electrolysis case, we perform experiments at ∘C and bar. Under these conditions, the water vapour pressure can be neglected since (the effect of dissolved gases on the vapour pressure has been considered negligible since their mole fraction is small enough to assume that there is no appreciable change in the boiling point of water). H2 gas bubbles grow in a binary solution of \ceH2 and air since the electrolyte is not degassed (this condition is similar to that present in real electrolyzer applications) and it is permanently exposed to ambient air throughout its preparation, subsequent storage and finally during experiments. Therefore, it is reasonable to assume that it is air equilibrated, i.e. (assuming that air is a single component entity). Consequently and according to (2), the minimum supersaturation of H2 required to trigger growth for a typical pit radius m corresponds to
| (3) |
In practical terms, the negative value above means that the presence of other dissolved species, i.e. air (which consists of a mixture of N2, O2 and other gases), makes bubble nucleation easier and, consequently, it is possible to achieve bubble nucleation shortly after initiating the electrolysis. We can anticipate that somewhat higher concentrations are required in practice. There are many other factors that can inhibit bubble nucleation and growth. Those will be discussed later in the text.
In contrast, the experiments with CO2 bubbles growing from pressure-controlled supersaturated carbonated water within a pressurized chamber are performed at a liquid pressure bars and isolated from the outside. The preparation procedure ensures that in the experimental chamber there are no other gas species present within the liquid apart from CO2. Therefore, the minimum supersaturation required for nucleation is
| (4) |
Note that in this case a positive minimum supersaturation value is necessary. Supersaturation levels below were tried and resulted in no bubble generation. The lowest supersaturation for which we experimentally achieved bubble growth was indeed .
3.2 Bubble nucleation times
In constant-current electrolysis and in the absence of bubbles, the (molar) concentration of H2 near the electrode can be estimated as
| (5) |
which is an increasing function of time obtained by solving the 1D diffusion equation in a semi-infinite domain with a constant flux boundary condition.36, 27 Here, denotes the time after the start of electrolysis, is the current density, is the valency of the H2 evolution reaction, C/mol is Faraday’s constant and m2/s is the diffusivity of H2 in water. Combining Henry’s law, (3) and (5), we obtain the theoretical minimum time for a bubble nucleation after the start of electrolysis as a function of the current density:
| (6) |
Here mol/Nm. It stands to reason that as increases, the gas formation rate also increases and, therefore, the minimum time to nucleate a bubble is achieved faster. There is evidence that the concentration at which the first bubble nucleates on a gas-evolving electrode also depends on the value of the current density.36 Tawfik and Diez 36 reported that the nucleation time does not depend on a constant concentration , but rather on the applied current density , with increasing as increases. They proposed the following empirical relation for the nucleation time of the first bubble spontaneously growing on a flat electrode in a presumably non-degassed electrolyte:
| (7) |
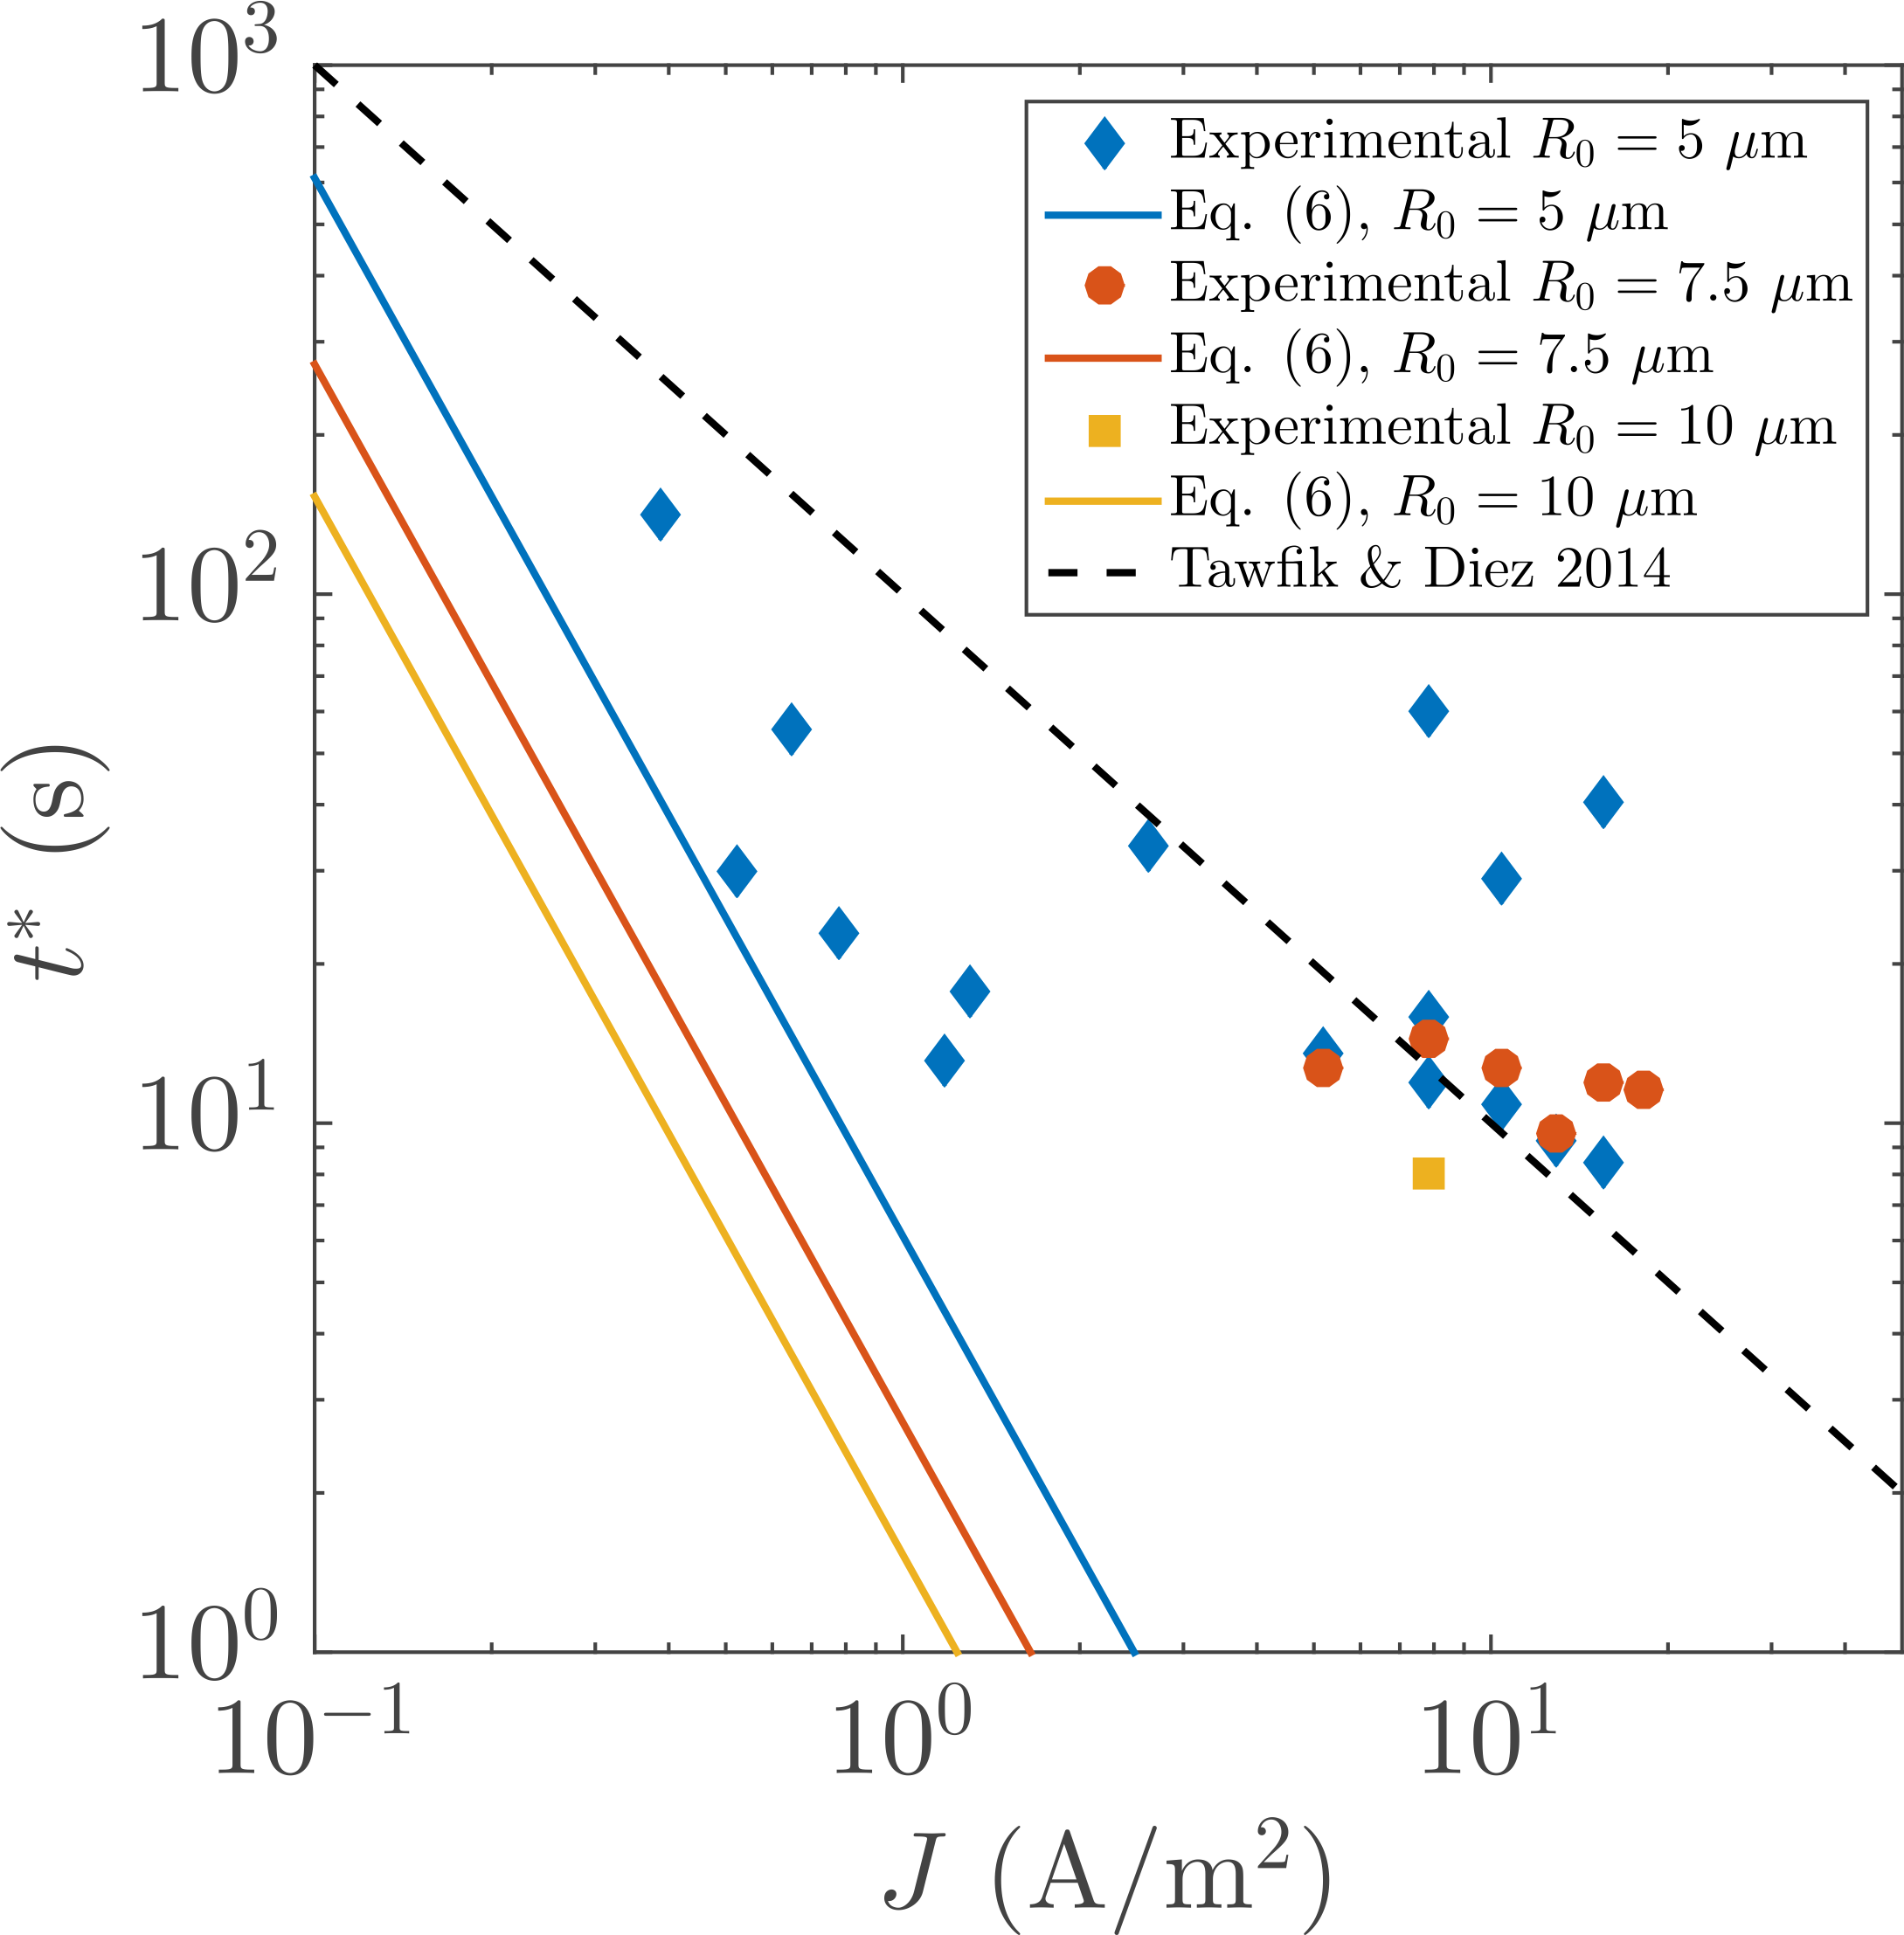
with a fitting constant. The nucleation times of the first H2 bubble in the succession on the predefined pits are plotted vs the current density in Figure 4 and compared to the theoretical prediction in (6) with , and m, and the empirical relation in (7). The times are measured from the start of the electrolysis up to a threshold radius of 25 m, following the method used by Tawfik and Diez.36 The nucleation time, , appears to generally decrease with ; however, no clear trend can be appreciated. The significant variability in our experimental measurements can be attributed to three possible causes:
-
(1)
The pit topography is different from sample to sample. We measured deviations from the ideal circular pit opening in the radial direction of several hundreds of nanometers (refer to the Electronic Supplementary Information). Fluorocarbons within the pit may hinder mass transport of dissolved gas towards the gas pocket or enforce pinning at different contact angles and, thus, affect the effective value of .
- (2)
-
(3)
The electrolyte contains air, partially composed of O2. Oxygen reduction competes with H2 formation. This implies that the net current density available for H2 formation is less than the actually applied current density. By definition, the standard potential for H2 formation is 0 V, whereas O2 reduction occurs at V. Consequently, higher current densities result in both more H2 production and O2 reduction. This fact means that H2 is not efficiently produced (not all of the applied current is used for its generation) and, thus, the bubble nucleation time seems not to follow a clear decreasing trend with increasing . Furthermore, this may be a cause of the scattering in Figure 4, since O2 levels at the start of each experiment may not be the same (although a fresh solution was employed for each experiment). The levelling off of the nucleation time at higher current densities in the same figure could be attributed to the influence of the dissolved O2 reduction, the unequal distribution of gas production, the time required for the diffusion of the gases through the liquid towards the artificial nucleation site and the stochastic nature of nucleation. In addition to the influence of the parameters mentioned above, other factors unknown to us may play a rather significant role in the measured deviation between the nucleation times of the bubbles and of the predicted theoretical values.
Moreover, the empirical prefactor in (7) may correct for the growth of the bubble to the threshold size of 25 m, even though the time needed to reach that threshold may be negligible compared to the time necessary to achieve nucleation. However, no such correction is performed in (6). Surface tension reduction due to dissolved gases in the solution can also explain why the experimental nucleation times differ from those predicted by theory.38 For electrolysis, the nucleation times for the various applied currents in this research fall within the order of tenths of seconds. In comparison, the nucleation of CO2 bubbles in carbonated water is observed to occur at or below the order of seconds after the pressure was reduced below the saturation value.26 The differences may rely then on the different ways of bubble generation and not on the substrate surface properties.
3.3 Bubble growth
Bubble growth can be described as , with denoting the bubble radius, the time after nucleation and the time exponent.39 For diffusive bubble growth, ,40 whereas for reaction limited growth .41, 39
In electrolysis, diffusion-limited growth occurs when the characteristic time of the diffusive transport of the evolved gas across the electrode, (where is the diffusion coefficient), is much larger than that of the diffusive gas transport to the bubble, . The relation between this two characteristic diffusive times can be associated to the Damköhler number, which is defined as and can be interpreted as the ratio of the diffusive transport across the characteristic electrode size and across the characteristic bubble size. Here, mm is the electrode radius and mm is the bubble experimental mean detachment radius of all experiments at all current densities, which results in . Therefore, our research focuses on bubble growth during electrolysis controlled by diffusion.
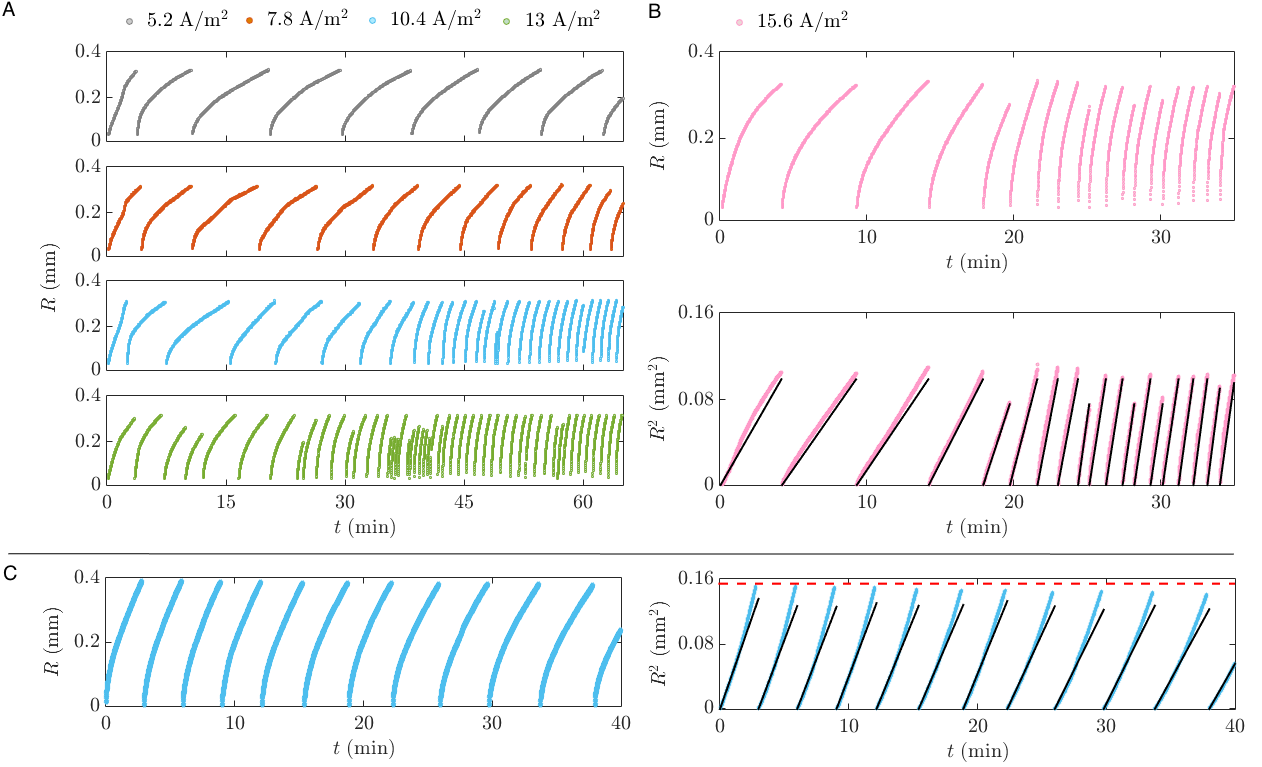
Figure 5A and 5B (top plot) show the evolution of bubble radii over time of five series of successive H2 bubbles produced at constant-current electrolysis. Each series corresponds to a different current density. At the beginning, each successive bubble evolves slower than the previous one approximately up to the 4th bubble, when the growth rate becomes faster. This acceleration is attributed to the evolution of the diffusive concentration boundary layer in which the bubbles grow 27 and the most-probable complete reduction of the dissolved O2 in the electrolyte (see item (3) in the discussion above). With increasing current densities, the growth rates at the beginning of each succession increase due to the larger gas production, but the evolution trend remains unaltered since the early bubbles in the succession deplete the diffusive concentration boundary layer around them.
The unsteady nature of the electrolytic bubble growth becomes more apparent upon comparison with the bubble growth in pressure-controlled supersaturated carbonated liquid (Figure 5C). In this figure, we present a succession of CO2 bubbles in supersaturated water at . The growth in this case continuously slows down with the successive bubble detachment due to the active depletion of the total amount of CO2 gas available.26 In contrast, for the electrolytically-generated bubbles, after the early depletion the H2 gas concentration near the substrate continues to increase over time due to the continuous water splitting reaction resulting in a faster growth of the H2 bubbles.27
Both H2 and CO2 bubbles evolve via pure diffusive growth, namely
| (8) |
where is the dimensionless growth coefficient.27 The straight slopes observed in plotted against time in Figures 5B (bottom plot) and C (right plot) corroborate this behaviour. A short movie showing a succession of single H2 bubbles during electrolysis can be found on-line along this article (Movie 1).
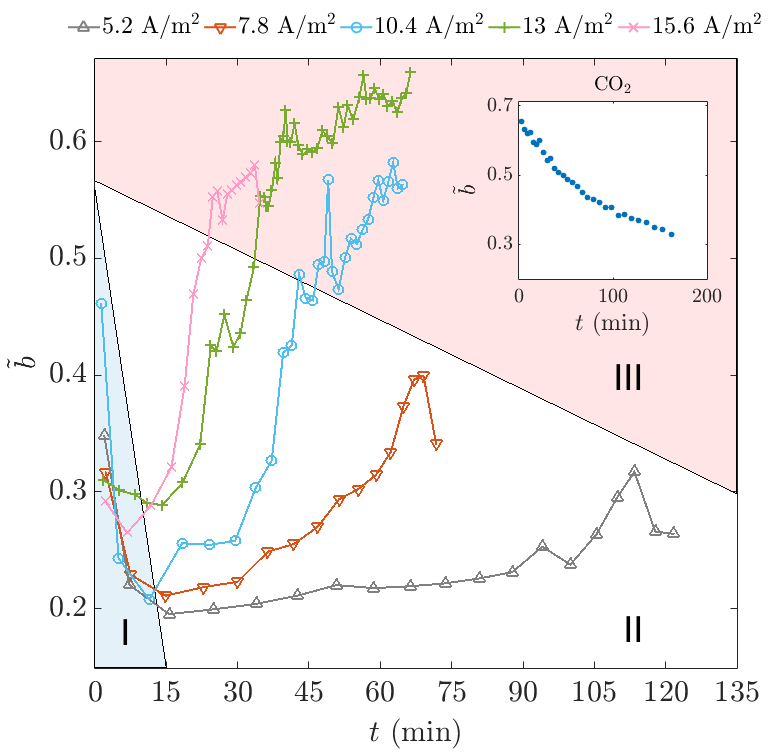
The gas boundary layer evolution during electrolysis results in three different growth regimes, which are further elucidated by taking a closer look at the growth coefficient . Figure 6 shows the evolution of with time since the start of electrolysis calculated from the data in Figure 5A and the top plot in 5B. Note that each experimental point corresponds to the growth coefficient of a particular bubble in the succession. Initially, decreases as a consequence of the initial bubble locally depleting the boundary layer of gas, behaviour referred to as the ‘stagnation’ regime (I). Successive bubbles keep growing in a mildly supersaturated liquid until the boundary layer overcomes the depletion losses due to the constant gas production and evolves to higher gas concentrations. The accompanying increase in characterises regime II, in which bubbles grow faster. The transition between regimes depends on the applied current density: the higher the current density, the earlier the onset of increasing . Finally, regime III shows a stabilization in the growth rate for successive bubbles, reflected by increasing in small increments. In contrast, the growth coefficients corresponding to the CO2 bubble succession in Figure 5C always decrease due to gas depletion,26 inset in Figure 6, similar to the early H2 bubbles in electrolysis (regime I). In this case, there is no influx of new gas which can counteract this depletion effect, resulting in a continuous smaller growth rate. The pillar height does not have any influence on the bubble growth coefficients.27 For a more in-depth discussion on the different growth regimes and the influence that the boundary layer and its depletion have on the bubble growth dynamics, the interested reader is referred to van der Linde et al.27
During both H2 and CO2 measurements, successive bubble growth could suddenly stop because of spurious pit deactivation. This may occur once liquid enters the pit during bubble detachment: the interface of the gas pocket in the pit can form a jet which can wet the surface inside the pit, displacing the air.33 We found no consistency in how long bubbles can be generated before pit deactivation. The fastest deactivation in the measurements occurred after the growth and detachment of a single bubble.
3.4 Bubble detachment
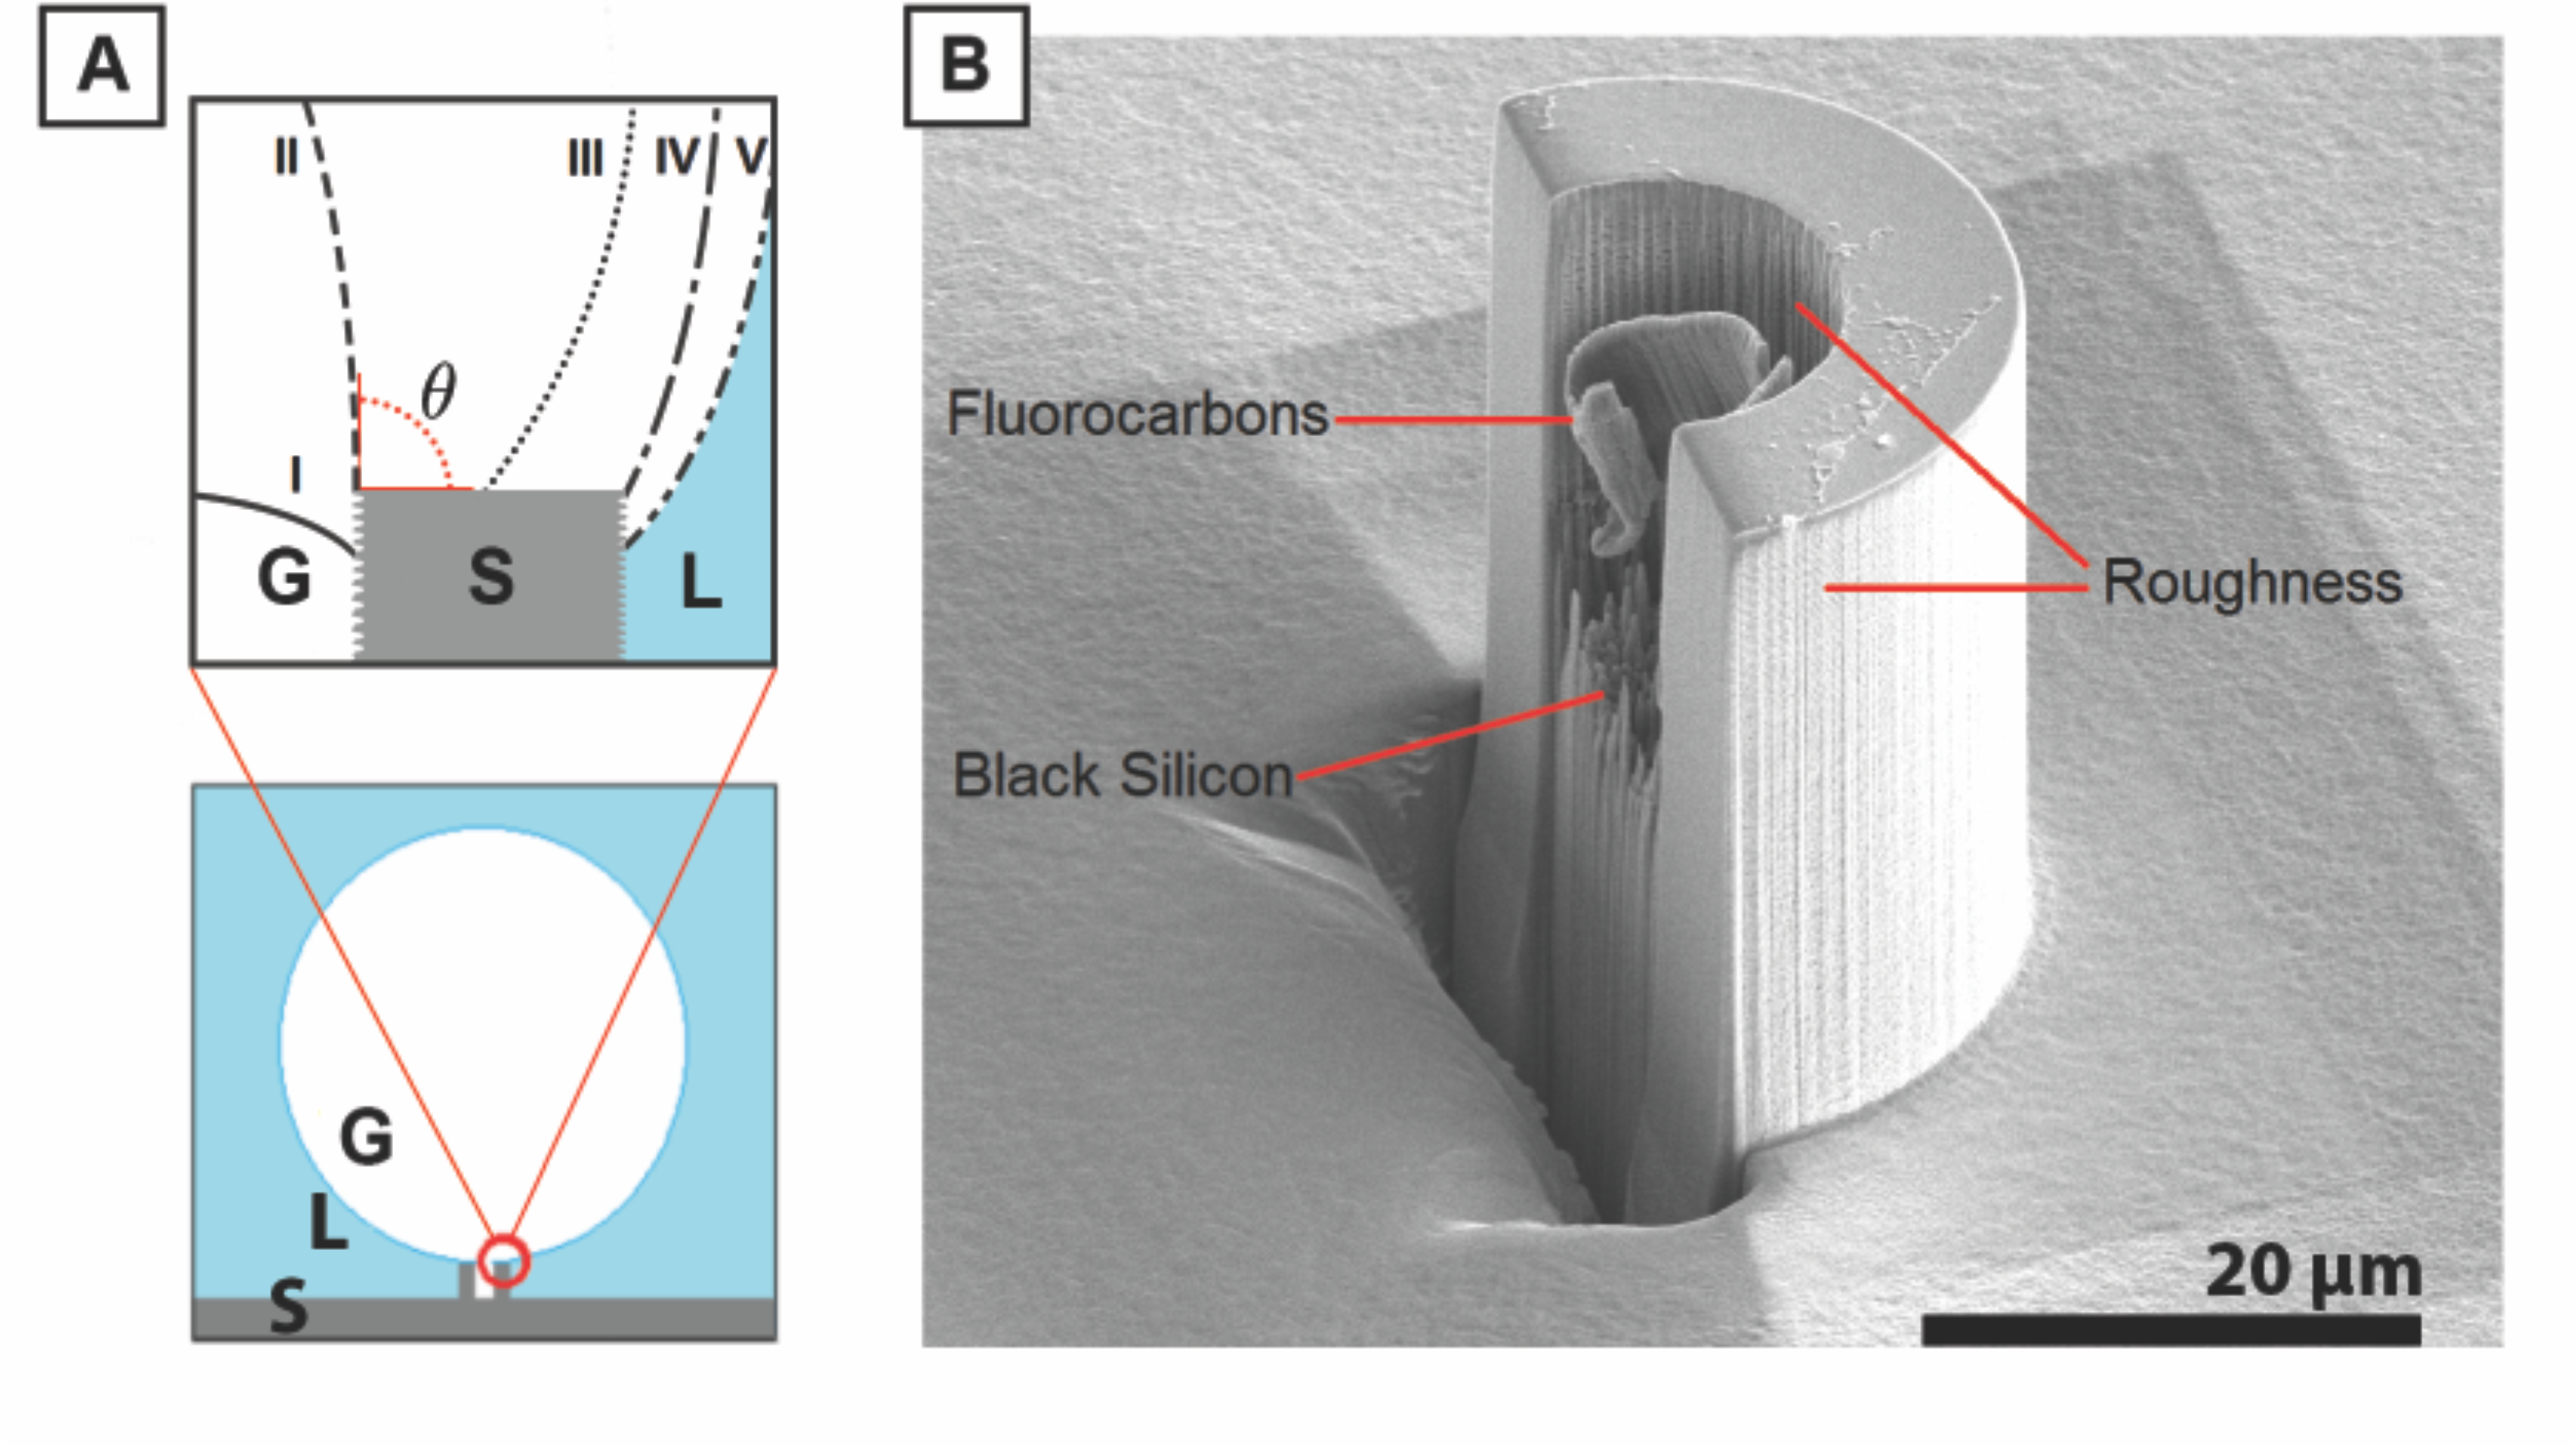
The position of the triple contact line on the pit-pillar microstructure and the contact angle dynamics determine the size at which the bubbles detach from the microstructure.42, 43 Since optical access to the contact line was not possible, we speculate on five probable pinning positions during the bubble evolution process, sketched in Figure 7A. The inner surface of the pit contains several artifacts as a result of the fabrication process that can pin the bubble interface. As shown in Figure 7B, needle-like structures of black silicon are present at the bottom of the pit, whereas the inner surface contains vertical and horizontal scallops resulting from the Bosch etching process.44 Additionally, the fluorocarbon (FC) layer deposited for enhanced hydrophobicity can facilitate pinning. Typically, the FC layer will adhere to the pit wall; however, in Figure 7B the layer detached prior to the FIB milling process (a video can be found on-line along this article) as observed with optical microscopy and SEM. This event could provide unpredictable pinning positions during the experiments and, consequently, end up in a different detachment radius. However, we have evidence that for the majority of the bubbles, the pinning is most likely to occur inside the pit (position I) throughout their whole lifetime, forming a bridging neck between the gas trapped in the pit and the bubble growing outside.26
As the bubble grows and attains its detachment size, it is possible that the bubble contact line moves from position I up to V,45 as sketched in Figure 7A. The departure size is an indirect way of estimating the position of the contact line. The maximum theoretical value of the bubble detachment radius growing from a pit of radius is given by Fritz’s formula,46
| (9) |
with the difference in density between the liquid and gas phases and m/s2 the gravitational acceleration. Equation (9) can be derived from the balance between buoyancy and capillary forces, assuming that the contact line is at position II with a contact angle of 90∘ with respect to the horizontal at the moment of detachment, as sketched in Figures 1B and 7A. Net charges present on bubbles due to the solvent pH or absorbed species, such as surfactants, 47 may affect the pinning position of the bubble to the pit and consequently, its final detachment radius. Our electrolysis experiments are carried out in a medium with a pH 3 buffer and with no absorbent species to ensure a point of zero charge on the bubble. We can thus exclude electrostatic forces from the detachment force balance.
Figure 8 shows the detachment radius for electrolysis at various current densities. The measured radii are smaller than what equation (9) predicts, as one would expect from the contact line pinned somewhere inside the pit (position I) and a potential necking process.26 Histograms of the detachment radii per current density applied to the same sample are included in Figure 8B. The detachment radius does not seem to be affected by the current density. The inset in Figure 8A likewise shows that the detachment radii of successive CO2 bubbles always fall below the theoretical value. Moreover, the measured radii slightly decrease with each successive bubble formed due to the onset of buoyancy-driven convection near the bubbles.25 However, in general terms, bubble detachment radii remain stable and reproducible, especially in the short term (below hour).26
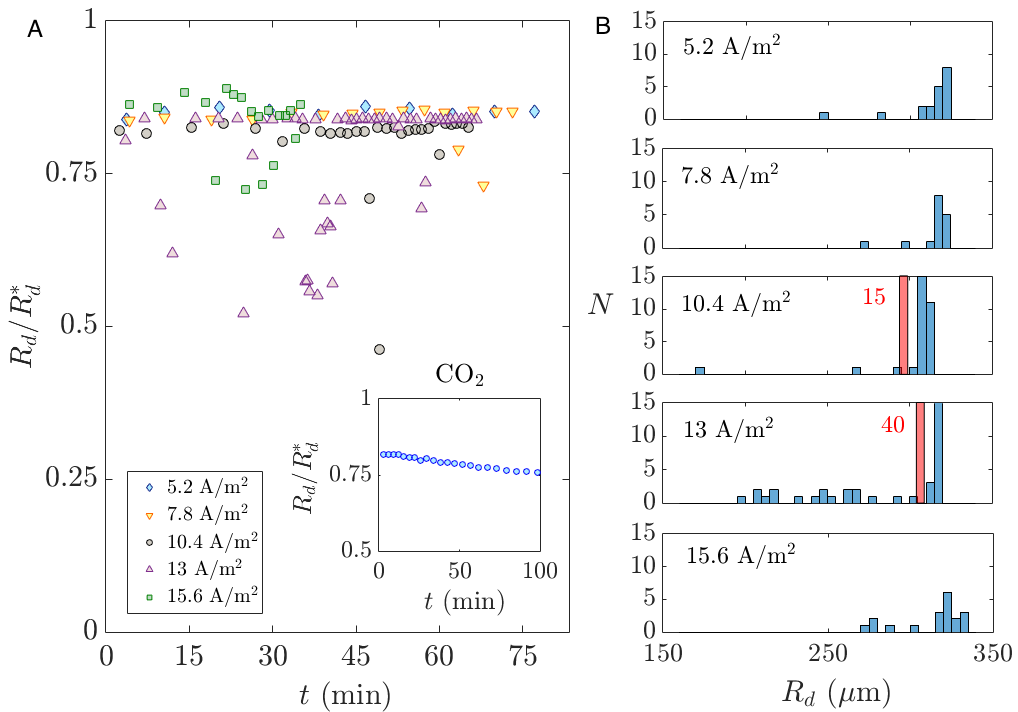
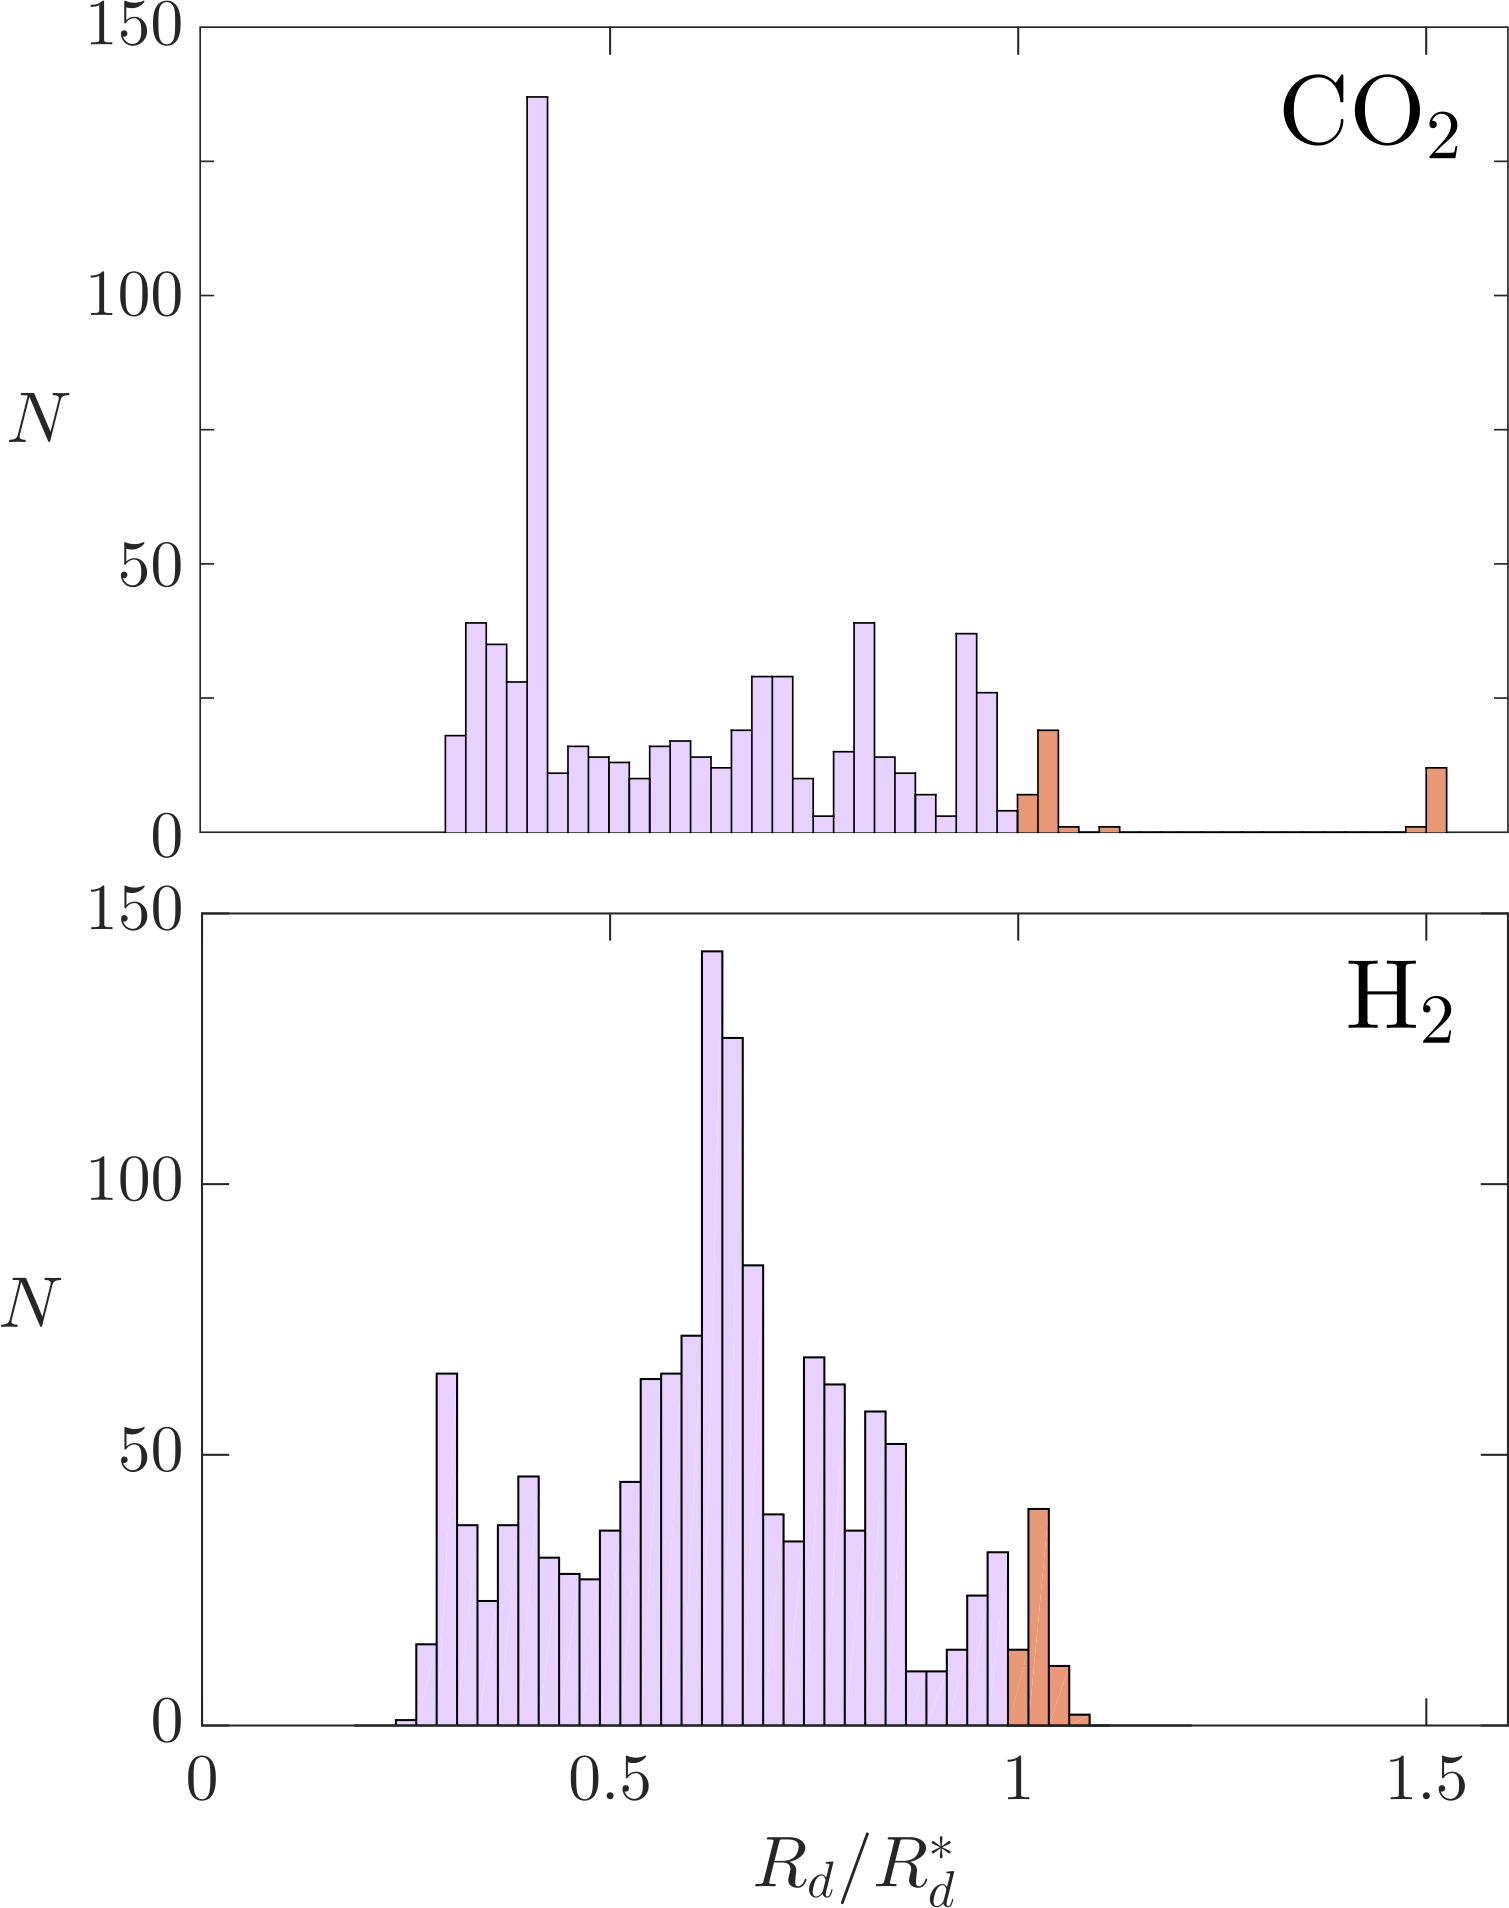
Figure 9 shows two histograms of the detachment radii normalized with the theoretical maximum detachment radius . The top histogram shows that the detachment radii of CO2 bubbles spread over a range with a mean value of . The lower histogram shows a peaked distribution for the H2 bubble detachment radii, also with a mean value of . The same mean range of for the H2 and CO2 measurements is not accidental since both scenarios make use of similar microstructures with the same pit-pillar configuration. The spread in the measured radii must arise from the fact that the contact line may differ from experiment to experiment, and thus the necking before pinch-off occurs differently. Preferred adhesion sites or defects within the pit or on the pillar could be responsible for this. Since roughness of flat electrodes has been shown to influence the detachment radii of bubbles,48, 49, 50 we expect that pit roughness might play a role in the detachment radii of evolving bubbles. We measured the roughness in radial direction but found no apparent correlation between the detachment radii and the radial roughness (see the Electronic Supplementary Information). For some bubbles, , probably due to the fact that the bubbles were not pinned to the pit (positions I or II in Figure 7A) but rather to defects on the pillar or the outer rim (position III, IV or V in Figure 7A). In our experiments, we have measured detachment radii up to , especially for the case of the smallest pit to pillar radii ratio. This case is particularly interesting, since such a small ratio could be used for future designs of pillars in which the pit functions as the gas trapping source and the pillar as the outer pinning geometry for the bubble. Convective forces, electrostatic charges induced by local pH changes, and the dependency of surface tension and liquid density with concentration of dissolved gases may also influence the force balance and final detachment radius in a complex way. Although we provide several possible scenarios and parameters which could cause the deviation between the measured detachment radii and theory, the influence of other unknown factors can not be excluded. Nonetheless, a full analysis of the force balance and other factors influencing detachment is beyond the scope of this study.
3.5 Gas transport efficiency
The efficiency of gas transported away from the electrode surface by the bubbles can be quantified as the ratio between the amount of gas moles within each bubble after detaching from the nucleation site, , and the total amount of electrolytically produced moles of H2, . Note that this efficiency is not constant in time since it changes as the subsequent bubbles grow at different rates and depends on the amount of dissolved O2 which is reduced at the electrode. The efficiency after the -th bubble in the succession has detached is thus calculated as
| (10) |
Here, denotes the detachment radius of the -th bubble, is the internal pressure of the -th bubble, F C/mol, is the valency of the H2 evolution reaction, is the total electric charge supplied at the detachment time of the -th bubble , J/Kmol is the universal gas constant and K the absolute temperature. Note that this definition of the efficiency is limited to the gas transported away in each bubble and, therefore, does not consider the gas transport from the electrode in the form of convective plumes caused by bubble detachment or in the form of parasitic bubbles growing in other spots within the set-up.
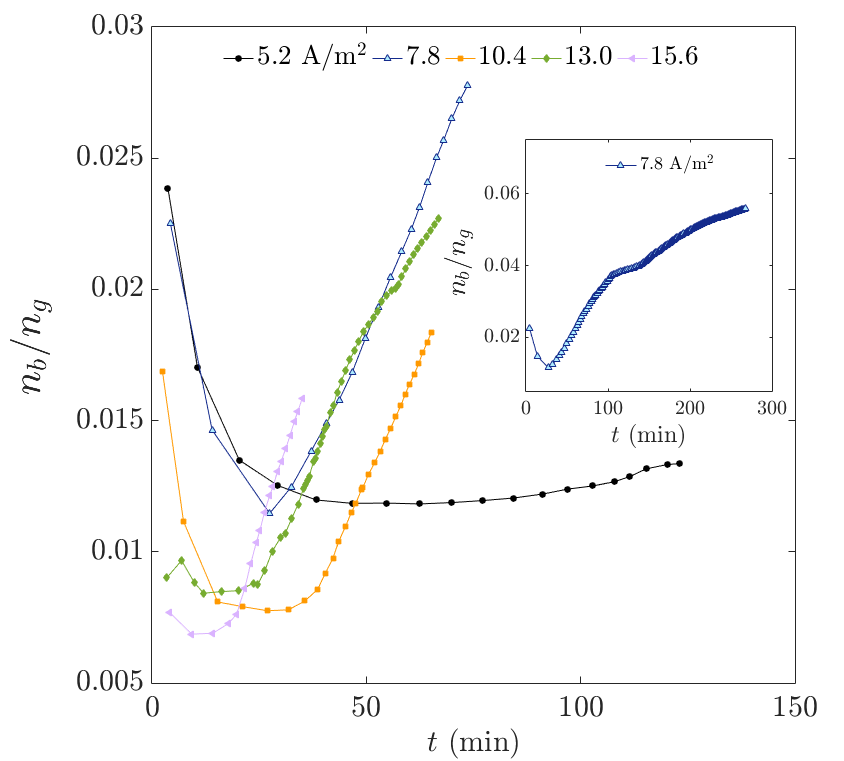
Figure 10 shows the H2 transport efficiency of the bubble succession as a function of time. A single substrate is used for the measurements of the various current densities. The efficiency evolves as a parabola in time for all current densities, i.e. a similar trend as that of in time, Figure 6. This originates from the definition of the transport efficiency, equation (10), which fundamentally corresponds to a discrete integral of in time. Consequently, the efficiency initially decreases due to the effect of depletion during the stagnation regime, region I in Figure 6. During the stagnation, the efficiency is surprisingly higher for lower current densities. This may originate from larger depletion losses caused, for instance, by the formation of parasitic bubbles. However, the efficiency becomes larger with increasing current densities as the concentration boundary layer evolves with time to higher gas concentrations. This is expected since the current density is directly proportional to the generation rate of molecular hydrogen. The produced gas does not diffuse fast enough into the bulk electrolyte, but accumulates instead around the bubble and electrode, increasing the local supersaturation. This results in faster bubble formation frequencies and higher transport rates. We find the highest experimental efficiency (5.7 %) for a current density of 7.8 A/m2 after 270 minutes of constant electrolysis operation. A general optimal efficiency value could not be determined due to the eventual pit deactivation or parasitic bubble formation blocking optical access.
Future designs of electrodes with multiple nucleation sites may increase the amount of gas that is transported away by the bubbles, resulting in higher transport efficiencies. The size of the nucleation sites and the spacing over the surface would be crucial since they determine to what degree the bubbles compete for gas and how the gas concentration boundary layer evolves with time.
4 Conclusions
The microfabrication of artificial nucleation sites (in the form of pillar-pit microstructures on flat silicon substrates) allowed us to experimentally study bubbles evolving in water. By observing the succession of single bubbles, we compared the differences between the pressure-controlled supersaturated CO2 and electrolytic H2 bubbles, focusing on the evolution of the concentration boundary layer and its effect on the bubble growth rate, the detachment radius and the gas transport efficiency.
The time taken for the first H2 bubble to nucleate after the start of electrolysis at various current densities coincides with previous electrolysis nucleation studies and covers a wide spread ranging from the order of seconds to tens of seconds (most probably affected by the presence of dissolved O2 at the beginning of the experiment) whereas the CO2 nucleation occurs generally in the order of seconds once the carbonated solution becomes supersaturated. By studying the growth coefficient , we determine that a system with a finite amount of gas available will experience continuously slower bubble evolution over time due to gas depletion, whereas in the case of electrolytically generated bubbles, their growth experiences different phases depending on the concentration of available gas as a function of time. The height of the pillars does not seem to play any significant role during bubble evolution in any of the cases studied here.
Bubble detachment usually occurs around 60% of the maximum theoretical radius (see equation (9)) for both cases. This fact indicates that bubble detachment is mainly governed by the pillar-pit geometry. The smaller detachment value originates from the structural imperfections of the pits that lead to random adhesion sites of the contact line. The contact angle, the force balance and the neck formation of the bubbles are thus affected. For CO2 bubbles, detachment occurs at slightly decreasing radii over time because of the onset of density driven convection 25 and a neck formation between the trapped gas in the pit and the growing bubble on top.26 In electrolysis, the detachment of H2 bubbles does not follow any clear trend.
Finally, the gas evolution efficiency follows a parabolic trend with time. A matching trend is observed for the bubble growth rates. We conclude that the efficiency first decreases due to depletion losses, and then increases after a certain supersaturation is achieved and the dissolved O2 is reduced. Surprisingly, during the stagnation regime the efficiency is higher for lower current densities. This effect is counteracted later in time, such that higher current densities imply higher efficiencies. The maximum efficiencies range from 1 to 5 %, values which could be further increased with the use of multiple nucleation sites and flow conditions, closer to real life applications where continuous flow reactors are desirable. The aspects of nucleation, growth, and detachment considered here certainly warrant future studies toward higher transport efficiencies of (photo)electrolytic devices.
Conflicts of interest
There are no conflicts to declare.
Acknowledgements
We would like to thank S. Schlautmann for the discussion and fabrication of the experimental substrates, and R. P. G. Sanders for the discussions regarding the electrolysis set-up. We would further like to extend our thanks to H. A. G. M van Wolferen for the FIB milling and SEM imaging and the MESA+ Nanolab for the use of their facilities. This work was supported by the Netherlands Center for Multiscale Catalytic Energy Conversion (MCEC), an NWO Gravitation programme funded by the Ministry of Education, Culture and Science of the government of the Netherlands.
References
- Fujishima and Honda 1972 A. Fujishima and K. Honda, Nature, 1972, 238, 37–38.
- Barelli et al. 2008 L. Barelli, G. Bidini, F. Gallorini and S. Servili, Energy, 2008, 33, 4 , 554–570.
- Chattanathan et al. 2012 S. A. Chattanathan, S. Adhikari and N. Abdoulmoumine, Renewable Sustainable Energy Rev., 2012, 16, 5, 2366–2372.
- Maeda et al. 2005 K. Maeda, T. Takata, M. Hara, N. Saito, Y. Inoue, H. Kobayashi and K. Domen, J. Am. Chem. Soc., 2005, 127, 8286–8287.
- Maeda and Domen 2007 K. Maeda and K. Domen, in Theoretical and computational chemistry, ed. P. B. Balbuena and J. M. Seminario, Elsevier B. V., 2007, vol. 18, ch. Nano-particulate photocatalysts for overall water splitting under visible light, pp. 12, 301–315.
- Jain 2009 I. P. Jain, Int. J. Hydrogen Energy, 2009, 34, 17, 7368–7378.
- Reece et al. 2011 S. Y. Reece, J. A. Hamel, K. Sung, T. D. Jarvi, A. J. Esswein, J. J. H. Pijpers and D. G. Nocera, Science, 2011, 334, 6056, 645–648.
- Zhang and Zeng 2012 D. Zhang and K. Zeng, Ind. Eng. Chem. Res., 2012, 51, 13825–13832.
- Dorfi et al. 2017 A. E. Dorfi, A. C. West and D. V. Esposito, J. Phys. Chem. C, 2017, 121, 26587–26597.
- Westwater 1958 J. W. Westwater, in Advances in chemical engineering, ed. T. B. Drew and J. W. Hoopes Jr., Elsevier Inc., 1958, vol. 2, ch. Boiling of liquids, pp. 1–31.
- Somorjai and Li 2010 G. A. Somorjai and Y. Li, Introduction to surface chemistry and catalysis, John Willey and Sons, Inc., Hoboken, New Jersey, 2nd edn, 2010.
- Chen et al. 2014 Q. Chen, L. Luo, H. Faraji, S. W. Feldberg and H. S. White, J. Phys. Chem. Lett., 2014, 5, 20, 3539–3544.
- Dapkus and Sides 1986 K. V. Dapkus and P. J. Sides, J. Colloid Interface Sci., 1986, 111, 1, 133–151.
- Lv et al. 2017 P. Lv, H. Le The, J. Eijkel, A. van den Berg, X. Zhang and D. Lohse, J. Phys. Chem. C, 2017, 121, 20769–20776.
- Zhang et al. 2011 X. Zhang, A. Kumar and P. J. Scales, Langmuir, 2011, 27, 6, 2484–2491.
- Sillen 1983 C. W. M. P. Sillen, PhD thesis, Technische Universiteit Eindhoven, 1983.
- Dukovic and Tobias 1987 J. Dukovic and C. W. Tobias, J. Electrochem. Soc., 1987, 134, 2, 331–343.
- Eigeldinger and Vogt 2000 J. Eigeldinger and H. Vogt, Electrochim. Acta, 2000, 45, 27, 4449–4456.
- Jones et al. 1999 S. F. Jones, G. M. Evans and K. P. Galvin, Adv. Colloid Interface Sci., 1999, 80, 1, 27–50.
- Bremond et al. 2006 N. Bremond, M. Arora, C.-D. Ohl and D. Lohse, Phys. Rev. Lett., 2006, 96, 224501, 1–4.
- Fernandez Rivas et al. 2010 D. Fernandez Rivas, A. Prosperetti, A. G. Zijlstra, D. Lohse and H. J. G. E. Gardeniers, Angew. Chem. Int. Ed., 2010, 49, 50, 9699–9701.
- Narezo Guzman et al. 2016 D. Narezo Guzman, Y. Xie, S. Chen, D. Fernandez Rivas, C. Sun, D. Lohse and G. Ahlers, J. Fluid Mech., 2016, 787, 331–366.
- Groß et al. 2018 T. F. Groß, J. Bauer, G. Ludwig, D. Fernandez Rivas and P. F. Pelz, Exp. Fluids, 2018, 59, 12, 1–10.
- Enríquez et al. 2013 O. R. Enríquez, C. Hummelink, G.-W. Bruggert, D. Lohse, A. Prosperetti, D. van der Meer and C. Sun, Rev. Sci. Instrum., 2013, 84, 065111, 1–8.
- Enríquez et al. 2014 O. R. Enríquez, C. Sun, D. Lohse, A. Prosperetti and D. van der Meer, J. Fluid Mech., 2014, 741, R1, 1–9.
- Moreno Soto et al. 2017 Á. Moreno Soto, A. Prosperetti, D. Lohse and D. van der Meer, J. Fluid Mech., 2017, 831, 474–490.
- van der Linde et al. 2017 P. van der Linde, Á. Moreno Soto, P. Peñas-López, J. Rodríguez-Rodríguez, D. Lohse, H. Gardeniers, D. van der Meer and D. Fernández Rivas, Langmuir, 2017, 33, 12873–12886.
- Hashemi et al. 2015 S. M. H. Hashemi, M. A. Modestino and D. Psaltis, Energy Environ. Sci., 2015, 8, 2003–2009.
- Davis et al. 2018 J. T. Davis, J. Qi, X. Fan, J. C. Bui and D. V. Esposito, Int. J. Hydrogen Energy, 2018, 43, 1224–1238.
- Ardo et al. 2018 S. Ardo, D. Fernandez Rivas, M. A. Modestino, V. Schulze Greiving, F. F. Abdi, E. Alarcon Llado, V. Artero, K. Ayers, C. Battaglia, J.-P. Becker, D. Bederak, A. Berger, F. Buda, E. Chinello, B. Dam, V. Di Palma, T. Edvinsson, K. Fujii, H. Gardeniers, H. Geerlings, S. M. H. Hashemi, S. Haussener, F. Houle, J. Huskens, B. D. James, K. Konrad, A. Kudo, P. Patil Kunturo, D. Lohse, B. Mei, E. L. Miller, G. F. Moore, J. Muller, K. L. Orchad, T. E. Rosser, F. H. Saadi, J.-W. Schüttauf, B. Seger, S. W. Sheehan, W. A. Smith, J. Spurgeon, M. H. Tang, R. van de Krol, P. C. K. Vesborg and P. Westerik, Energy Environ. Sci., 2018.
- Elbersen et al. 2015 R. Elbersen, R. M. Tiggelaar, A. Milbrat, G. Mul, H. Gardeniers and J. Huskens, Adv. Energy Mater., 2015, 5, 1401745, 1–8.
- Esposito et al. 2017 D. V. Esposito, Y. Lee, H. Yoon, P. M. Haney, N. Y. Labrador, T. P. Moffat, A. Alec Talin and V. A. Szalai, Sustainable Energy Fuels, 2017, 1, 154–173.
- Borkent et al. 2009 B. M. Borkent, S. Gekle, A. Prosperetti and D. Lohse, Phys. Fluids, 2009, 21, 102003 , 1–9.
- Henry 1803 W. Henry, Philos. Trans. R. Soc. London, 1803, 93, 29–42+274–276.
- Tucker and Ward 1975 A. S. Tucker and C. A. Ward, J. Appl. Phys., 1975, 46, 11, 4801–4808.
- Tawfik and Diez 2014 M. E. Tawfik and F. J. Diez, Electrochim. Acta, 2014, 146, 792–797.
- Svetovoy et al. 2013 V. B. Svetovoy, R. G. P. Sanders and M. C. Elwenspoek, J. Phys.: Condens. Matter, 2013, 25, 184002, 1–12.
- Lubetkin 2003 S. D. Lubetkin, Langmuir, 2003, 19, 7, 2575–2587.
- Brandon and Kelsall 1985 N. P. Brandon and G. H. Kelsall, J. Appl. Electrochem., 1985, 15, 4 , 475–484.
- Epstein and Plesset 1950 P. S. Epstein and M. S. Plesset, J. Chem. Phys., 1950, 18, 11, 1505–1509.
- Verhaart et al. 1980 H. F. A. Verhaart, R. M. de Jonge and S. J. D. van Stralen, Int. J. Heat Mass Transfer, 1980, 23, 3, 293–299.
- Dettre and Johnson, Jr. 1965 R. H. Dettre and R. E. Johnson, Jr., in Contact angle hysteresis, 1965, vol. 69, ch. Contact angle hysteresis. IV. Contact angle measurements on heterogeneous surfaces, pp. 136–144.
- De Gennes 1985 P. G. De Gennes, Rev. Mod. Phys., 1985, 57, 3, 827–863.
- Park et al. 2003 W. J. Park, J. H. Kim, S. M. Cho, S. G. Yoon, S. J. Suh and D. H. Yoon, Surf. Coat. Technol., 2003, 171, 290–295.
- Ramos and Tanguy 2006 S. Ramos and A. Tanguy, Eur. Phys. J. E, 2006, 19, 4, 433–440.
- Fritz 1935 W. Fritz, Phys. Z., 1935, 36, 379–388.
- Brandon et al. 1985 N. P. Brandon, G. H. Kelsall, S. Levine and A. L. Smith, J. Appl. Electrochem., 1985, 15, 4, 485–493.
- Baum et al. 1998 T. Baum, J. Satherley and D. J. Schiffrin, Langmuir, 1998, 14, 10 , 2925–2928.
- Barker et al. 2002 G. S. Barker, B. Jefferson and S. J. Judd, Chem. Eng. Sci., 2002, 57, 4 , 565–573.
- Krasowska and Malysa 2007 M. Krasowska and K. Malysa, Int. J. Miner. Process., 2007, 81, 205–216.