These authors contributed equally to this work \altaffiliationThese authors contributed equally to this work \altaffiliationPresent address: University of York, United Kingdom
High-Resolution Nuclear Magnetic Resonance Spectroscopy With Picomole Sensitivity by Hyperpolarisation On A Chip
Abstract
We show that high-resolution NMR can reach picomole sensitivity for micromolar concentrations of analyte by combining parahydrogen induced hyperpolarisation (PHIP) with a high-sensitivity transmission line micro-detector. The para-enriched hydrogen gas is introduced into solution by diffusion through a membrane integrated into a microfluidic chip. NMR microdetectors, operating with sample volumes of a few L or less, benefit from a favourable scaling of mass sensitivity. However, the small volumes make it very difficult to detect species present at less than millimolar concentrations in microfluidic NMR systems. In view of overcoming this limitation, we implement parahydrogen-induced polarisation (PHIP) on a microfluidic device with 2.5 detection volume. Integrating the hydrogenation reaction into the chip minimises polarisation losses to spin-lattice relaxation, allowing the detection of picomoles of substance. This corresponds to a concentration limit of detection of better than , unprecedented at this sample volume. \cbstartThe stability and sensitivity of the system allows quantitative characterisation of the signal dependence on flow rates and other reaction parameters and permits homo- (1H-1H) and heteronuclear (1H-13C) 2D NMR experiments at natural 13C abundance. \cbend

1 Introduction
High-resolution NMR spectroscopy is a superbly versatile method which provides detailed and quantitative information on chemical composition and structure. It is widely used to follow the progress of chemical reactions 1, *Foley:2014kpa, *Oosthoek-deVries:2019:ir, as well as metabolic processes in living systems 4, *Gottschalk:2008ixa, *CuperlovicCulf:2010vc, *shintuMetabolomicsonaChipPredictiveSystems2012a. However, NMR suffers from inherently low sensitivity, which is due in part to the very weak polarisation of nuclear spins along the magnetic field for samples in thermal equilibrium at ambient conditions. Conventional high-resolution NMR therefore requires nanomole quantities of sample. Many important problems require detection of analytes at low micromolar concentrations, such as transient reaction intermediates, or metabolic species. Despite the comparatively higher mass sensitivity of NMR for small sample volumes 8, 9, conventional micro-NMR systems around 1 achieve mass limits of detection of no better than10 1 nmol, corresponding to a concentration limit of detection of 1 . An increase of several orders of magnitude in sensitivity is therefore required to enable NMR studies of mass-limited samples at micromolar concentrations.
Microfluidic lab-on-a-chip devices are finding increasing applications in chemistry and the life sciences. They provide detailed control over the experimental conditions at a much smaller length scale than conventional reactors, and allow integration of synthesis, separation, and analytical steps on a single platform 11, *Theberge:2012iq, *Hoang:2011du, *Ohno:2008da, *Zhou:2004id, *Fang:2018ib, *Hoang:2011ee, *Gunther:2006vd. The small size also affords the possibility of high experimental throughput. In the life sciences, microfluidic devices are increasingly used as sophisticated culture platforms for cells, cell assemblies, tissues, and small organisms 19, *Whitesides:2006vi, *ElAli:2006ci, *West:2008jd, *Neuzil:2012gc, *Gracz:2015co. The integration of NMR with microfluidics 25, 26, 27, 10, 28 is promising, as it enables in-situ, non-invasive monitoring of chemical and metabolic processes in lab-on-a-chip systems.
The usefulness of microfluidic NMR could therefore be significantly enhanced if the following conditions could be met: (i) sample volumes around 1 L or less; (ii) a concentration limit of detection near 1 ; and (iii) spectral resolution of better than 0.01 ppm to allow distinction and identification of chemical species.
Although exquisitely sensitive NMR detection schemes exist at low magnetic fields, approaching even single-spin detection in favourable cases 29, *Rugar:2004bc, *Mamin:2007ff, *Poggio:2010jf, *Maze:2008cs, *Staudacher:2013kn, *Rugar:2015by, *McDermott:2002hp, *Budker:2007hz, *Xu:2006kg, *Blanchard:2013gs, they lack spectral resolution. While a recent study has demonstrated resolution of couplings using a nitrogen-vacancy (NV) centre magnetometer40, none of these alternative detection schemes are compatible with high (several Tesla) magnetic fields, which are essential to produce spectral dispersion by chemical shifts. So far, no method has been demonstrated with the combination of high spectral resolution, high chemical dispersion, and high sensitivity for small volumes required for advanced microfluidic NMR measurements significantly below the 1 mM concentration scale.
Hyperpolarisation methods generate substances which exhibit a transiently high level of nuclear spin polarisation, much larger than thermal equilibrium. As a result, hyperpolarised substances can give NMR signals that are enhanced by more than 4 orders of magnitude 41. Hyperpolarisation methods can be combined \cbendwith micro-NMR detectors and microfluidic systems 42, 43, 44, 45, 46, 47, 48, 49. One such method involves the chemical reaction of the singlet spin isomer of molecular hydrogen, and is called parahydrogen-induced hyperpolarisation (PHIP) 50, 51, 52, 53.
While most studies have so far brought the reaction liquid in direct contact with hydrogen gas either through bubbling or by atomisation of the liquid in a hydrogen-filled chamber 54, 55, 56, 57, 58, 59, 60,\cbstartliquid-gas interfaces (and bubbles in particular) \cbendpose difficulties in the context of microfluidic devices, since they tend to alter the flow properties, and can block fluid transport altogether. Continuous delivery of parahydrogen by diffusion through gas-permeable membranes has been demonstrated at conventional size scales 61, 62. It has been shown that silicone elastomer membranes can be used to deliver parahydrogen directly to a flowing liquid in a microfluidic device 48. Bordonali et al49 have recently combined a microfluidic NMR probe system with a gas exchange chip based on a silicone elastomer membrane to implement the SABRE (signal enhancement by reversible exchange) variant of parahydrogen-induced polarisation, but achieved only small signal enhancement factors (3 to 4).
In distinction from previous work 54, 55, 56, 57, 58, 59, 60, 62, we integrate the hydrogenation reactor into the chip itself, which greatly reduces the polarisation losses due to spin-lattice relaxation. As shown below, we achieve a signal enhancement factor over thermal polarisation of about 1800, allowing detection of a picomole quantity of analyte in a sample volume of , while maintaining the full resolution of conventional NMR spectroscopy.
This is accomplished by letting the parahydrogen gas diffuse through a silicone elastomer membrane 62 to come into contact with a solution flowing through the chip at a constant rate. The solution contains a precursor, which is hydrogenated through a homogeneous catalyst also present in the solution. The microfluidic device is held in the bore of a conventional NMR magnet using a purpose-built transmission line NMR probe. This yields a continuous on-chip stream of hyperpolarised material. As shown in the following, in addition to very high detection sensitivities, this also results in a continuous and highly stable operation of the system, making it possible to perform hyperpolarised two-dimensional NMR experiments 61, 63, 64, 65. By replacing the hyperpolarised gas feed with hydrogen gas at thermal equilibrium, it is possible to gain kinetic information on the hydrogenation process, as well as to calibrate the intensity of the hyperpolarised NMR signals. This allows accurate assessment of the achieved polarisation levels, something that has been notoriously difficult in the context of parahydrogen-induced polarisation.
2 Experimental
The microfluidic chips were constructed from three layers of cell cast poly(methyl methacrylate) (PMMA) sheet material (Weatherall Equipment). The sheet thickness was 200 m for the top and bottom layers, and 500 m for the middle layer. The fluid and gas channels were designed on AutoCAD and cut into the PMMA using a laser cutter (HPC Laser L3040) to a width and depth of 150 m. The layers were subsequently bonded together with a plasticiser (2.5% v/v dibutyl phthalate in isopropyl alcohol) under heat and pressure (358 K, 3.5 tonnes) 66. The total internal fluid volume is 4 L, and the sample chamber is 2.5 L.
The device also employs a poly(dimethyl siloxane) (PDMS) membrane (Shielding Solutions) to facilitate para-H2 transport, of 1 mm thickness with laser-cut screw holes. The parahydrogen polarisation lifetime in the PDMS after O2 removal was measured to be ~4 h (see supplementary information). The PMMA chip and PDMS membrane layer are sealed with a pair of screw-tightened 3D printed (Accura Xtreme, Proto Labs) holders, with fluid and gas in/out ports (to fit Kinesis UK NanoPorts).
The assembled microfluidic device was put in a transmission line based home-built probe 28. The device sits between the two detector planes with the sample chamber of the device aligned with the sensitive area of the detector. All NMR experiments were performed at a field strength of 11.7 T with an AVANCE III console. Nutation frequencies for RF pulses were 100 kHz for protons, and 20 kHz for carbon in the case of the HMQC spectrum. 16k data points were acquired over 1.2 s for proton 1D spectra. Saturation recovery experiments used a train of 512 pulses separated by a delay of 0.1 ms, followed by a recovery delay, and a excitation pulse. The PH-TOCSY spectrum was acquired using the States-TPPI method, with 256 increments, averaging 8 transients per increment. 2048 complex data points in 0.2 s were acquired for each increment. The PH-HMQC experiment was acquired using the States method, with 128 increments, averaging 8 transients with 2048 complex points over 0.2 s. 1D spectra were processed using MestreNova (Mestrelab, Italy). 2D spectra were processed using scripts written in Julia 67.
To generate parahydrogen gas at 50% para enrichment, hydrogen gas (purity 99.995%) was passed through a home-built parahydrogen generator containing an iron (III) oxide catalyst cooled to 77 K using liquid nitrogen.
The solution before reaction contained 20 mM propargyl acetate 2 and 5 mM 1,4-bis(diphenylphosphino)butane(1,5-cyclooctadiene)rhodium tetrafluoroborate 3 in methanol-d4. In an attempt to avoid possible spin relaxation or chemical side-reaction effects, dissolved oxygen from the atmosphere was removed by 5 minutes of vigorous helium bubbling.
The parahydrogen gas was delivered through a PTFE tube (1/16 inch O.D., 1/32 inch I.D.) into the 3D printed chip holder, and out via a second PTFE line, using a mass flow controller (Cole-Parmer) to limit the flow to 20 mL min-1 at an overpressure of 5 bar. Although most of the parahydrogen gas passes directly through the system, some amount dissolves into the PDMS layer, which in terms of H2 solubility behaves similarly to other organic solvents. The solution was loaded into a 3.5 mL plastic syringe with a Luer lock connection to in-flow PEEK tubing (1/16 inch O.D., 0.007 inch I.D.) leading to the chip. The same tubing was used for the solution out-flow into a container exposed to a back pressure of 1.5 bar of nitrogen gas, to prevent formation of hydrogen bubbles in the chip. Solution flow into the chip was controlled with a syringe pump (Cole-Parmer).
3 Results and Discussion
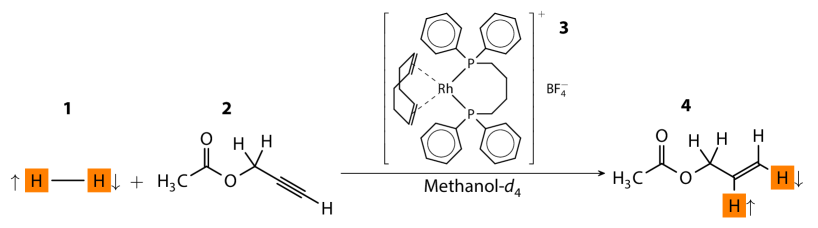
The hydrogenation reaction system employed in the present work is shown in Fig. 1. Parahydrogen-enriched hydrogen gas was allowed to react with propargyl acetate , in the presence of a rhodium catalyst . The substrate was chosen in view of future studies based on side-arm hydrogenation 58, 59, 68.
Fig. 2 \cbdeleteshows the microfluidic device used for the present study. It consists of a chip made from PMMA, which houses a sample chamber of 2.5 volume that aligns with the transmission line detector of a home-built NMR probe assembly, which was fitted inside of an 11.7 T NMR magnet. \cbstartFluid is flowed through the chip by means of a syringe pump \cbendinstalled outside of the magnet bore; connections are made through threaded ports in the two 3D-printed holders shown in Fig. 2b. Para-enriched H2 gas at 5 bar above ambient pressure flows through a second channel in the chip\cbdelete, which runs in the immediate vicinity of the liquid channel (a depiction of the set-up is given in the SI).
The chip consists of three laser-cut layers of poly methylmethacrylate (PMMA) bonded together, as shown in Fig. 2b.\cbdelete Channels in the left part of the chip, where it is clamped between the holders, are cut through the top layer, while they are scored into the middle layer of the chip (and hence sealed from the outside) in the free part of the device. Within the clamps, the exposed channels are sealed by means of a PDMS membrane. The flowing liquid as well as the pressurised hydrogen gas are therefore exposed to the PDMS layer, which serves as a diffusion bridge for the hydrogen. The holders, made by 3D printing, keep the membrane and the chip aligned, and maintain mechanical pressure to ensure sealing. Channels inside the holders guide the fluid and gas to and from the four access points at the top end of the chip, as shown in Fig. 2b. The PDMS membrane acts both as a diffusion conduit for hydrogen gas and as a fluid seal. In a crucial difference to the otherwise similar geometry of the hydrogenation chip used by Bordonali et al49, the gas and liquid channels are arranged side by side, and molecular \cbstarthydrogen diffuses through the bulk of the PDMS material rather than across the membrane. \cbendClamping the PDMS membrane onto the chip using the holders, this makes it possible to use large gas pressures (up to 5 bar in the present experiments). This would be difficult to achieve \cbdeleteif the liquid and gas channels were arranged on opposite sides of the membrane.
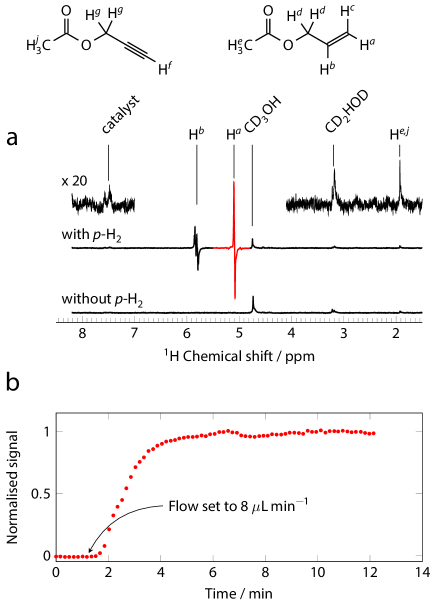
Fig. 3a shows a single-scan proton NMR spectrum obtained from a steady-state PHIP@chip experiment (top trace), compared to the spectrum obtained without parahydrogen (bottom trace). The hyperpolarised spectrum is dominated by an antiphase doublet, centred at 5.17 ppm, and an antiphase multiplet at 5.92 ppm, corresponding to protons in the and positions of the hydrogenation product 4. The PDMS membrane is equilibrated with para-enriched hydrogen gas, which is supplied from an aluminium storage tank at a regulated pressure of 5 bar. The gas flow rate is kept constant at 20 by means of a mass flow controller placed after the chip. This ensures that the gas channel always contains fresh para-enriched hydrogen gas at the design pressure of 5 bar. The fluid channel of the chip is pre-filled with a solution of 20 mM precursor and 5 mM catalyst in methanol-. NMR spectra are acquired every 30 s, using a excitation pulse. The fluid channel is connected to a syringe pump situated outside the NMR magnet. The liquid flow is started by setting the target flow rate on the syringe pump to 8 (marked by an arrow Fig. 3b). The NMR signal intensity begins to rise about 30 s later, and reaches a steady state after about two minutes. \cbend
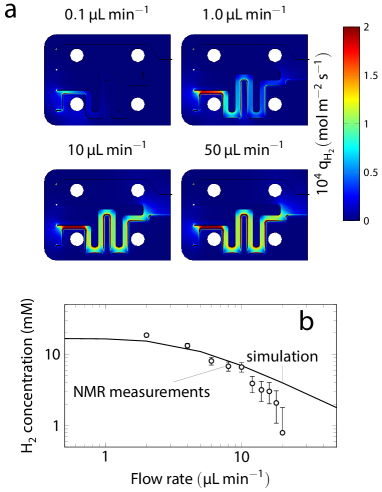
The hydrogen transport through the membrane and its uptake into the flowing liquid was simulated using two coupled finite element models: a dilute species diffusion model for hydrogen gas in the PDMS membrane, and a dilute species diffusion and convection model for hydrogen dissolved in the flowing liquid. The hydrogen partial pressures at the liquid/PMDS interface are constrained to be equal, and the hydrogen partial pressure at the gas/PDMS interface was set to a fixed value of 5 bar. Fig. 4a shows the diffusive flux of hydrogen through the PDMS membrane. Since the gas/PDMS interface acts as a source, and the liquid/PDMS interface as a sink for hydrogen, the flux is strongest where the two channels are in close proximity. At the lowest flow rate, significant transport only takes place in a very small area, and the liquid is saturated with hydrogen within the first few mm of the path which is in contact with the PDMS. The higher the flow rate, the further the area of significant flux extends downstream. At about 10 , the hydrogen flux covers the entire length of the area between the liquid and gas channel interfaces. The finite element model also predicts the resulting concentration of hydrogen in the liquid (methanol) as a function of flow rate. This is shown by the solid line in Fig. 4b. The circles represent NMR measurements. At flow rates between 2 and 10 , experimental results are in good agreement with the simulation. At higher flow rates, however, the experimentally observed hydrogen concentrations are significantly lower than the predictions. It is currently unclear what causes this discrepancy; possibly high flow rates lead to deformation of the PDMS layer over the liquid channel and thus change the uptake geometry. At flow rates below 10, the simulation and experiments both indicate that the flowing solvent is nearly saturated with hydrogen. Detailed information on the finite element simulations, as well as data on parahydrogen partial pressure throughout the chip is given in the supporting information.
Clearly, the steady-state signals observed at constant flow rate are the result of a dynamic equilibrium between the rate of hydrogenation, the rate of transport of the hydrogenated product to the sample chamber and its removal from it, and spin-lattice relaxation. In order to probe the interplay of these factors, the NMR signal was suppressed by saturating the spin populations with a train of 512 pulses separated by 100 s delays. The signal intensity was then measured as a function of the delay between the end of the saturation train and the NMR excitation pulse. Fig. 5a shows an example of the data thus obtained at a flow rate (results for other flow rates are given in the SI). The signal increases rapidly after saturation, reaching steady-state levels after about 10 s.

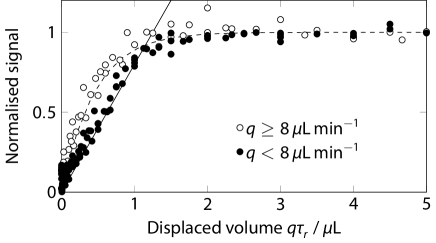
The intensity of the steady-state NMR signal exhibits a clear maximum with flow rate (Fig. 5b), reflecting a balance between hydrogen uptake, reaction kinetics, and spin-lattice relaxation. The optimum, with the largest signal at saturation, is reached at a flow rate of 8 . The nature of the stationary state established in the system at each flow rate becomes clearer if the saturation recovery data is plotted in terms of the volume displaced during the saturation recovery time , rather than the recovery time itself, and normalised to the steady-state signal intensity at each flow rate, as shown in Fig. 6. At flow rates below the intensity maximum at (solid circles), \cbdeletethe data points collapse onto a curve that shows an initial linear increase up to a displaced volume of about 1 L, followed by rapid saturation to the steady-state value. This \cbdelete behaviour clearly indicates that the signal recovery in this regime is dominated by the convective fluid transport. At these flow rates, a constant concentration of hyperpolarised material is established in the flowing liquid upstream of the sample chamber, and is simply carried back into view of the NMR detector after the saturation pulses end. \cbdeleteThe maximum signal is reached after a volume of about 1.5 L has been displaced. This is less than the capacity of the sample chamber, reflecting the uneven velocity distribution inside it. At flow rates above the optimum (), a somewhat different behaviour is observed. The initial recovery rate is faster (Fig. 6, open circles), and appears to follow an exponential rather than linear shape. This suggests that at these flow rates, the stationary state is not yet established at the point where the liquid enters the sample chamber, and therefore, the observed recovery is dominated by the ongoing hydrogenation reaction. A detailed kinetic analysis of these processes is beyond the present scope, but is underway in our laboratory, and will be reported on a later occasion.
In order to determine the sensitivity of detection of the hydrogenation product at the optimum flow rate, the experiment was repeated using normal hydrogen. In this case, the signal from protons and of the hydrogenation product 4 are too weak to be observed above the noise in a single scan. \cbstartFig. 7 compares the hyperpolarised signal (a) to the averaged signal of 512 transients obtained with hydrogen in thermal equilibrium (b).
Since the methyl group in the precursor and the hydrogenation product contribute to the same signal at 2.05 ppm (signal labelled in Fig. 3a), \cbendthis signal can be used as a calibration standard, with a concentration of 20 mM which is unaffected by the hydrogenation reaction. By comparing this integral to that of the signal from the protons, the concentration of hydrogenated product can be quantified. At a flow rate of 8 , an allyl acetate (product) concentration of was found, corresponding to a total of in the sample volume.

This quantity can be used to determine the limit of detection of the hyperpolarised product. The signal/noise ratio (SNR) in the spectrum shown in Fig. 7a is 400(), and the line width is . The normalised limit of detection is given by
| (1) |
where is the amount of sample and is the signal bandwidth. In the present case, one finds . Limits of detection in this range have so far only been reported in very limited circumstances, including chemically-induced dynamic nuclear polarisation (CIDNP) 69, or by making use of unconventional low-field detection systems such as force-detected magnetic resonance or optical detection methods29, *Rugar:2004bc, *Mamin:2007ff, *Poggio:2010jf, *Maze:2008cs, *Staudacher:2013kn, *Rugar:2015by, *McDermott:2002hp, *Budker:2007hz, *Xu:2006kg, *Blanchard:2013gs. In the present case, we are using conventional inductive detection, and retain the full resolution and specificity that make \cbstarthigh-field \cbendproton NMR spectroscopy such a powerful analytical tool.
The mass limit of detection (LOD) for protons at a magnetic field of 14.1 T (corresponding to a proton Larmor frequency of 600 MHz) in state-of-the-art commercial NMR probes with a conventional sample volume of 0.5 mL is approximately 100 . Microfluidic NMR systems can make use of miniaturised NMR detectors, which benefit from a favourable scaling of the mass sensitivity with detection volume 8, 26, 70. At a size scale of 2.5 , a mass sensitivity around has been reported 10. However, due to the limited volume in such systems, the concentration sensitivity is very poor, such that only compounds present at mM levels can be quantified in microfluidic NMR systems. This situation gets worse as the detector volume decreases. By contrast, many samples of interest, such as metabolites in microfluidic culture systems, are only present at M levels. In the present case, the concentration limit of detection is
| (2) |
From the ratio of the signal intensities in the thermal and hyperpolarised spectra shown in Fig. 7a and b, it is possible to estimate the polarisation levels. In the thermal spectrum, the SNR is about 5:1, whereas it is 400:1 in the hyperpolarised spectrum. The thermal spectrum is obtained from 512 transients, therefore the single transient thermal SNR would be . This leads to a signal enhancement factor of .
This can be compared to the expected signal enhancement given the enrichment level of para-hydrogen used in the experiment. The ideal enhancement factor is given by \cbstart
| (3) |
where is the mole fraction of parahydrogen in the feed gas, is the magnetogyric ratio, is the magnetic field, and and are Planck’s and Boltzmann’s constants, respectively. The factor reflects the use of a pulse for the hyperpolarised experiment. At a temperature of K and a magnetic field of T, and with , this yields , which is a factor of 3.3 larger than the experimentally observed enhancement factor. We can therefore conclude that about 2/3 of the theoretically available spin order is lost to relaxation under the present experimental conditions. \cbend
A great advantage of the continuously operating microfluidic PHIP system is the ability to acquire many transients in succession under virtually unchanged conditions. This is difficult to achieve with bubbling hydrogen through a solution. As a consequence, hyperpolarised multi-dimensional NMR spectra71, 63, 61, 64, 65, 72 have been recorded either using automated reactors combined with NMR flow probes,64, 65 or using ultrafast acquisition techniques71, 63, 72.
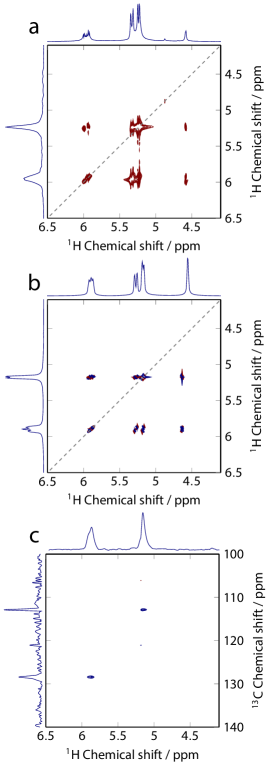
The PHIP@chip setup allows straightforward acquisition of 2D spectra, using conventional incrementation. To demonstrate this, we have taken 2D TOCSY (Total Correlation Spectroscopy) and HMQC (Heteronuclear Multiple Quantum Coherence) NMR spectra of the reaction mixture at a flow rate of 8 . \cbstartThe conventional pulse sequences were modified by replacing the initial /2 pulse with a pulse; we refer to these experiments as “PH-TOCSY” (parahydrogen TOCSY) and “PH-HMQC” (parahydrogen HMQC).
A PH-TOCSY spectrum acquired in 20 min is shown in Fig. 8a. A thermal equilibrium TOCSY spectrum of this compound would be expected to contain diagonal peaks connecting the identical nuclear spins in the two acquisition dimensions, and off-diagonal peaks connecting J-coupled spins. In the PH-TOCSY experiment, the diagonal peaks only appear for the two parahydrogen proton signals, because they are the only spins significantly polarised in the indirect dimension. The other protons are only polarised during the isotropic spin-mixing step of the pulse sequence, and hence do not appear in the indirect dimension. These protons only produce off-diagonal peaks, connecting them to the parahydrogen pair. As shown in Fig. 8b, the simulated spectrum closely corresponds to the experimentally observed one.
A PH-HMQC spectrum acquired in 60 min is shown in Fig. 8c. It contains two peaks, linking the parahydrogen protons to the 13C spins to which they have a direct 1JCH coupling. An experiment of this kind, in which signals are detected at full natural abundance of the 13C spins (about 1%) in a 2.5 L detection volume, is only possible due to both the high polarisation levels and stability of the system. \cbstartThe sensitivity of the HMQC spectrum is limited by noise, due to imperfect cancellation of the signals from molecular sites without 13C. To some extent, this may stem from residual instability of the flow conditions, as well as temperature fluctuations in the system. It may therefore be possible to improve the sensitivity further by optimising the setup. \cbend
The results in Fig. 8 show that the hyperpolarised spin order can be spread to other protons in the molecule by the application of the isotropic mixing sequence MLEV-17 73, *baxMLEV17basedTwodimensionalHomonuclear1985 prior to 1D signal acquisition. \cbendThis simple trick allows one to hyperpolarise any protons that are J-coupled to the parahydrogen pair, which makes the technique more general.
Much ongoing research in the field of hyperpolarisation is motivated by in vivo applications, where hyperpolarised compounds are used as magnetic resonance imaging contrast agents 50. Mostly, this involves transferring the nuclear spin polarisation after hydrogenation to other nuclei (13C, 15N, 31P) with lower magnetogyric ratios, where spin-lattice relaxation times are longer. 75, 76, 58 Many of these approaches use zero or very low magnetic fields for hydrogenation and polarisation transfer. This has the advantage that near magnetic equivalence between the two added protons is maintained through the reaction, leading to longer lifetimes 54, 55, 56, 57, 58, 59, 77, 78. The present work opens a complementary strategy, in that the hydrogenation is done at high field. Deleterious effects of relaxation are minimised by the proximity of the site of hydrogenation to the point of use. Arguably, this approach has advantages in the context of microfluidic systems, where only small quantities of hyperpolarised agents are needed. \cbstartIt may also be possible to adapt the present approach to the SABRE variant of parahydrogen-induced hyperpolarisation49. In this context, microfluidic recirculation may enable hyperpolarisation of very small total sample volumes. \cbend
4 Conclusions
The combination of a highly efficient transmission-line NMR micro detector with parahydrogen-induced hyperpolarisation leads to an unprecedented sensitivity in inductively detected NMR, with a mass limit of detection around 2.2 . This corresponds to a concentration sensitivity of less than 1 , which, to our knowledge, has not previously been reached at the volume scale of 2.5 L. This opens the perspective to be able to study chemical processes involving low-abundance species in mass-limited samples. Obviously, such applications require preparation of a hyperpolarised reactant. As the foregoing study shows, the necessary chemistry can be integrated in a microfluidic system. It should be noted that we have used parahydrogen enriched to 50% (compared to 25% at thermal equilibrium); the sensitivity could easily be boosted by a factor of three by using pure parahydrogen. Microfluidic systems hold great potential in combination with hyperpolarised NMR. All hyperpolarisation techniques require coordinated manipulation of fluids and spin transformations. The results shown in the foregoing demonstrate that in the case of parahydrogen-induced polarisation, this can be assisted considerably by integrating some of the necessary chemical steps on a microfluidic chip. Parahydrogen can be delivered to a reactive solution through a PDMS membrane at sufficient rate to achieve significant levels of hyperpolarisation; dissolution and transport of hydrogen in PDMS does not appear to lead to significant ortho-para equilibration. The highly stable continuous operation of the PHIP@chip system allows quantitative studies of the hydrogenation kinetics, and the relevant relaxation processes. This is demonstrated by the dependence of the steady-state signal intensity on flow rate and the recovery of the hyperpolarised signal after saturation (Fig. 5). Detailed kinetic and transport models, taking into account the deprotection of the catalyst, hydrogen dissolution in the flowing liquid, the hydrogenation reaction, and spin-lattice relaxation, are currently being developed in our laboratory and will be reported on a separate occasion.
The successful demonstration of PHIP on a chip opens important perspectives. Conditions can be optimised for continued production of hyperpolarised metabolites, which opens the possibility to conduct in-situ metabolic studies in microfluidic cultures of cells, tissues, and organisms. While the hyperpolarised compound used here, allyl acetate, is not a metabolite per se, the production of hyperpolarised metabolic species through PHIP has been demonstrated before 59, 57, 79, 80, 81, 50. Some metabolites, such as fumarate, can be generated directly by hydrogenation of an unsaturated precursor 80. Aime et al. have proposed a more generally applicable method 79, which relies on the metabolite bound to an alkyne sidearm through an ester linkage. After hydrogenation, the polarisation is transferred to a 13C nucleus in the metabolic moiety, and the sidearm is cleaved. PHIP@chip opens the possiblity of implementing these additional production steps on the same chip. \cbstartWhile previous demonstrations of sidearm hydrogenation have been carried out at low magnetic field, it may be possible to adapt recently developed efficient methods for heteronuclear polarisation transfer at high field60 to this purpose. \cbendIn turn, this may enable integration of the hyperpolarised metabolite generation with an on-chip culture of cells or other biological systems. Thanks to its stability, the setup provides a convenient means to optimise pulse sequences and reaction conditions for producing hyperpolarised targets.
This work has been supported by the UK Engineering and Physical Sciences Research Council (EPSRC) and Bruker UK Ltd. in the the form of a CASE conversion studentship for JE. Parts of the work presented here were supported by the European Union Horizon 2020 Future and Emerging Technologies programme (TISuMR project, grant number 737043).
The supporting information contains a schematic of the PHIP@chip setup, a fully assigned spectrum (obtained with thermal H2), data on the ortho-para conversion of Hydrogen dissolved in PDMS, details of the finite element simulations, the saturation recovery data at all flow rates, and phase-sensitive plots of the simulated and experimental PH-TOCSY spectra.
References
- Maiwald et al. 2004 Maiwald, M.; Fischer, H. H.; Kim, Y.-K.; Albert, K.; Hasse, H. Quantitative high-resolution online NMR spectroscopy in pharmaceutical reaction and process monitoring. J. Magn. Reson. 2004, 166, 135–146
- Foley et al. 2014 Foley, D. A.; Bez, E.; Codina, A.; Colson, K. L.; Fey, M.; Krull, R.; Piroli, D.; Zell, M. T.; Marquez, B. L. NMR Flow Tube for Online NMR Reaction Monitoring. Analytical chemistry 2014, 86, 12008–12013
- Oosthoek-de Vries et al. 2019 Oosthoek-de Vries, A. J.; Nieuwland, P. J.; Bart, J.; Koch, K.; Janssen, J. W. G.; van Bentum, P. J. M.; Rutjes, F. P. J. T.; Gardeniers, H. J. G. E.; Kentgens, A. P. M. Inline Reaction Monitoring of Amine-Catalyzed Acetylation of Benzyl Alcohol Using a Microfluidic Stripline Nuclear Magnetic Resonance Setup. Journal of the American Chemical Society 2019, 141, 5369–5380, PMID: 30864795
- Wishart 2008 Wishart, D. S. Quantitative metabolomics using NMR. TrAC Trends in Analytical Chemistry 2008, 27, 228–237
- Gottschalk et al. 2008 Gottschalk, M.; Ivanova, G.; Collins, D. M.; Eustace, A.; O’Connor, R.; Brougham, D. F. Metabolomic studies of human lung carcinoma cell lines using in vitro H-1 NMR of whole cells and cellular extracts. NMR in Biomedicine 2008, 21, 809–819
- Cuperlovic-Culf et al. 2010 Cuperlovic-Culf, M.; Barnett, D. A.; Culf, A. S.; Chute, I. Cell culture metabolomics: applications and future directions. Drug Discovery Today 2010, 15, 610–621
- Shintu et al. 2012 Shintu, L.; Baudoin, R.; Navratil, V.; Prot, J.-M.; Pontoizeau, C.; Defernez, M.; Blaise, B. J.; Domange, C.; Péry, A. R.; Toulhoat, P.; Legallais, C.; Brochot, C.; Leclerc, E.; Dumas, M.-E. Metabolomics-on-a-Chip and Predictive Systems Toxicology in Microfluidic Bioartificial Organs. Analytical Chemistry 2012, 84, 1840–1848
- Olson et al. 1995 Olson, D.; Peck, T.; Webb, A.; Magin, R.; Sweedler, J. High-Resolution Microcoil1̂H-NMR for Mass-Limited, Nanoliter-Volume Samples. Science 1995, 270, 1967–1970
- Bart et al. 2009 Bart, J.; Kolkman, A. J.; Oosthoek-de Vries, A. J.; Koch, K.; Nieuwland, P. J.; Janssen, H. J. W. G.; van Bentum, P. J. M.; Ampt, K. A. M.; Rutjes, F. P. J. T.; Wijmenga, S. S.; Gardeniers, H. J. G. E.; Kentgens, A. P. M. A Microfluidic High-Resolution NMR Flow Probe. J Am Chem Soc 2009, 131, 5014–5015
- Finch et al. 2016 Finch, G.; Yilmaz, A.; Utz, M. An optimised detector for in-situ high-resolution NMR in microfluidic devices. Journal of Magnetic Resonance 2016, 262, 73–80
- Wang et al. 2006 Wang, J.; Sui, G.; Mocharla, V. P.; Lin, R. J.; Phelps, M. E.; Kolb, H. C.; Tseng, H.-R. Integrated Microfluidics for Parallel Screening of an In Situ Click Chemistry Library. Angew. Chem. 2006, 118, 5402–5407
- Theberge et al. 2012 Theberge, A. B.; Mayot, E.; El Harrak, A.; Kleinschmidt, F.; Huck, W. T. S.; Griffiths, A. D. Microfluidic platform for combinatorial synthesis in picolitre droplets. Lab Chip 2012, 12, 1320–1326
- Hoang et al. 2011 Hoang, P. H.; Nguyen, C. T.; Perumal, J.; Kim, D.-P. Droplet synthesis of well-defined block copolymers using solvent-resistant microfluidic device. Lab Chip 2011, 11, 329–335
- Ohno et al. 2008 Ohno, K. i.; Tachikawa, K.; Manz, A. Microfluidics: Applications for analytical purposes in chemistry and biochemistry. Electrophoresis 2008, 29, 4443–4453
- Zhou et al. 2004 Zhou, X.; Cai, S.; Hong, A.; You, Q.; Yu, P.; Sheng, N.; Srivannavit, O.; Muranjan, S.; Rouillard, J. M.; Xia, Y. Microfluidic PicoArray synthesis of oligodeoxynucleotides and simultaneous assembling of multiple DNA sequences. Nucleic acids research 2004, 32, 5409–5417
- Fang et al. 2018 Fang, H.; Sun, Y.; Wang, X.; Sharma, M.; Chen, Z.; Cao, X.; Utz, M.; Tian, Z. Probing the kinetics in supramolecular chemistry and molecular assembly by microfluidic-NMR spectroscopy. Sci. China Chem. 2018, 61, 1460–1464
- Hoang et al. 2011 Hoang, P. H.; Park, H.; Kim, D.-P. Ultrafast and Continuous Synthesis of Unaccommodating Inorganic Nanomaterials in Droplet- and Ionic Liquid-Assisted Microfluidic System. J Am Chem Soc 2011, 133, 14765–14770
- Günther and Jensen 2006 Günther, A.; Jensen, K. Multiphase microfluidics: from flow characteristics to chemical and materials synthesis. Lab Chip 2006, 6, 1487–1503
- Manz et al. 1990 Manz, A.; Graber, N.; WIDMER, H. Miniaturized Total Chemical-Analysis Systems - a Novel Concept for Chemical Sensing. Sensor Actuat B-Chem 1990, 1, 244–248
- Whitesides 2006 Whitesides, G. M. The origins and the future of microfluidics. Nature 2006, 442, 368–373
- El-Ali et al. 2006 El-Ali, J.; Sorger, P. K.; Jensen, K. F. Cells on chips. Nature 2006, 442, 403–411
- West et al. 2008 West, J.; Becker, M.; Tombrink, S.; Manz, A. Micro Total Analysis Systems: Latest Achievements. Analytical chemistry 2008, 80, 4403–4419
- Neužil et al. 2012 Neužil, P.; Giselbrecht, S.; Länge, K.; Huang, T. J.; Manz, A. Revisiting lab-on-a-chip technology for drug discovery. Nature Reviews Drug Discovery 2012, 11, 620–632
- Gracz et al. 2015 Gracz, A. D.; Williamson, I. A.; Roche, K. C.; Johnston, M. J.; Wang, F.; Wang, Y.; Attayek, P. J.; Balowski, J.; Liu, X. F.; Laurenza, R. J.; Gaynor, L. T.; Sims, C. E.; Galanko, J. A.; Li, L.; Allbritton, N. L.; Magness, S. T. A high-throughput platform for stem cell niche co-cultures and downstream gene expression analysis. Nature Cell Biology 2015, 17, 340–349
- Ryan et al. 2012 Ryan, H.; Song, S.-H.; Zaß, A.; Korvink, J.; Utz, M. Contactless NMR Spectroscopy on a Chip. Anal. Chem 2012, 84, 3696–3702
- Badilita et al. 2012 Badilita, V.; Meier, R. C.; Spengler, N.; Wallrabe, U.; Utz, M.; Korvink, J. G. Microscale nuclear magnetic resonance: a tool for soft matter research. Soft Matter 2012, 8, 10583–10597
- Spengler et al. 2014 Spengler, N.; Moazenzadeh, A.; Meier, R. C.; Badilita, V.; Korvink, J. G.; Wallrabe, U. Micro-fabricated Helmholtz coil featuring disposable microfluidic sample inserts for applications in nuclear magnetic resonance. J. Micromech. Microeng. 2014, 24, 034004
- Sharma and Utz 2019 Sharma, M.; Utz, M. Modular Transmission Line Probes for Microfluidic Nuclear Magnetic Resonance Spectroscopy and Imaging. Journal of Magnetic Resonance 2019, 303, 75–81
- Rugar et al. 1992 Rugar, D.; Yannoni, C. S.; Sidles, J. Mechanical detection of magnetic resonance. Nature 1992, 360, 563–566
- Rugar et al. 2004 Rugar, D.; Budakian, R.; Mamin, H. J.; Chui, B. W. Single spin detection by magnetic resonance force microscopy. Nature 2004, 430, 329–332
- Mamin et al. 2007 Mamin, H. J.; Poggio, M.; Degen, C. L.; Rugar, D. Nuclear magnetic resonance imaging with 90-nm resolution. Nature Nanotech 2007, 2, 301–306
- Poggio and Degen 2010 Poggio, M.; Degen, C. L. Force-detected nuclear magnetic resonance: recent advances and future challenges. Nanotechnology 2010, 21, 342001
- Maze et al. 2008 Maze, J. R.; Stanwix, P. L.; Hodges, J. S.; Hong, S.; Taylor, J. M.; Cappellaro, P.; Jiang, L.; Dutt, M. V. G.; Togan, E.; Zibrov, A. S.; Yacoby, A.; Walsworth, R. L.; Lukin, M. D. Nanoscale magnetic sensing with an individual electronic spin in diamond. Nature 2008, 455, 644–647
- Staudacher et al. 2013 Staudacher, T.; Shi, F.; Pezzagna, S.; Meijer, J.; Du, J.; Meriles, C. A.; Reinhard, F.; Wrachtrup, J. Nuclear Magnetic Resonance Spectroscopy on a (5-Nanometer)3 Sample Volume. Science 2013, 339, 561–563
- Rugar et al. 2015 Rugar, D.; Mamin, H. J.; Sherwood, M. H.; Kim, M.; Rettner, C. T.; Ohno, K.; Awschalom, D. D. Proton magnetic resonance imaging using a nitrogen–vacancy spin sensor. Nature Nanotech 2015, 10, 120–124
- McDermott et al. 2002 McDermott, R.; Trabesinger, A. H.; Mück, M.; Hahn, E. L.; Pines, A.; Clarke, J. Liquid-State NMR and Scalar Couplings in Microtesla Magnetic Fields. Science 2002, 295, 2247–2249
- Budker and Romalis 2007 Budker, D.; Romalis, M. Optical magnetometry. NATURE PHYSICS 2007, 3, 227–234
- Xu et al. 2006 Xu, S.; Yashchuk, V. V.; Donaldson, M. H.; Rochester, S. M.; Budker, D.; Pines, A. Magnetic resonance imaging with an optical atomic magnetometer. Proceedings of the National Academy of Sciences 2006, 103, 12668–12671
- Blanchard et al. 2013 Blanchard, J. W.; Ledbetter, M. P.; Theis, T.; Butler, M. C.; Budker, D.; Pines, A. High-Resolution Zero-Field NMR J-Spectroscopy of Aromatic Compounds. J Am Chem Soc 2013, 135, 3607–3612
- Glenn et al. 2018 Glenn, D. R.; Bucher, D. B.; Lee, J.; Lukin, M. D.; Park, H.; Walsworth, R. L. High-resolution magnetic resonance spectroscopy using a solid-state spin sensor. Nature 2018, 555, 351–354
- Münnemann and Spiess 2011 Münnemann, K.; Spiess, H. W. Nuclear magnetic resonance: The art of signal enhancement. Nature Physics 2011, 7, 522
- McDonnell et al. 2005 McDonnell, E.; Han, S.; Hilty, C.; Pierce, K.; Pines, A. NMR analysis on microfluidic devices by remote detection. Anal. Chem 2005, 77, 8109–8114
- Desvaux et al. 2009 Desvaux, H.; Marion, D. J. Y.; Huber, G.; Berthault, P. Nuclear Spin-Noise Spectra of Hyperpolarized Systems. Angewandte Chemie International Edition 2009, 48, 4341–4343
- Telkki et al. 2010 Telkki, V.-V.; Zhivonitko, V. V.; Ahola, S.; Kovtunov, K. V.; Jokisaari, J.; Koptyug, I. V. Microfluidic Gas-Flow Imaging Utilizing Parahydrogen-Induced Polarization and Remote-Detection NMR. Angewandte Chemie International Edition 2010, 49, 8363–8366
- Paciok and Blümich 2011 Paciok, E.; Blümich, B. Ultrafast Microscopy of Microfluidics: Compressed Sensing and Remote Detection. ANGEWANDTE CHEMIE-INTERNATIONAL EDITION IN ENGLISH- 2011, 50, 5258–5260
- Jiménez-Martínez et al. 2014 Jiménez-Martínez, R.; Kennedy, D. J.; Rosenbluh, M.; Donley, E. A.; Knappe, S.; Seltzer, S. J.; Ring, H. L.; Bajaj, V. S.; Kitching, J. Optical hyperpolarization and NMR detection of ¡sup¿129¡/sup¿Xe on a microfluidic chip. Nature Communications 2014, 5, 3908
- Causier et al. 2015 Causier, A.; Carret, G.; Boutin, C.; Berthelot, T.; Berthault, P. 3D-printed system optimizing dissolution of hyperpolarized gaseous species for micro-sized NMR. Lab Chip 2015, 15, 2049–2054
- Hale et al. 2018 Hale, W.; Eills, J.; Rossetto, M.; Levitt, M.; Utz, M. PHIP on a Chip - Hyperpolarisation in microfluidic NMR. Oral presentation, Euromar conference, Nantes. 2018
- Bordonali et al. 2019 Bordonali, L.; Nordin, N.; Fuhrer, E.; MacKinnon, N.; Korvink, J. G. Parahydrogen based NMR hyperpolarisation goes micro: an alveolus for small molecule chemosensing. Lab Chip 2019, 19, 503–512
- Hövener et al. 2018 Hövener, J.-B.; Pravdivtsev, A. N.; Kidd, B.; Bowers, C. R.; Glöggler, S.; Kovtunov, K. V.; Plaumann, M.; Katz-Brull, R.; Buckenmaier, K.; Jerschow, A.; Reineri, F.; Theis, T.; Shchepin, R. V.; Wagner, S.; Bhattacharya, P.; Zacharias, N. M.; Chekmenev, E. Y. Parahydrogen-Based Hyperpolarization for Biomedicine. Angewandte Chemie International Edition 2018, 57, 11140–11162
- Duckett and Mewis 2012 Duckett, S. B.; Mewis, R. E. Application of Para hydrogen Induced Polarization Techniques in NMR Spectroscopy and Imaging. Accounts of chemical research 2012, 45, 1247–1257
- Glöggler et al. 2013 Glöggler, S.; Colell, J.; Appelt, S. Para-hydrogen perspectives in hyperpolarized NMR. Journal of Magnetic Resonance 2013, 235, 130–142
- Green et al. 2012 Green, R. A.; Adams, R. W.; Duckett, S. B.; Mewis, R. E.; Williamson, D. C.; Green, G. G. The theory and practice of hyperpolarization in magnetic resonance using parahydrogen. Progress in nuclear magnetic resonance spectroscopy 2012, 1–48
- Bhattacharya et al. 2007 Bhattacharya, P.; Chekmenev, E. Y.; Perman, W. H.; Harris, K. C.; Lin, A. P.; Norton, V. A.; Tan, C. T.; Ross, B. D.; Weitekamp, D. P. Towards hyperpolarized 13C-succinate imaging of brain cancer. Journal of magnetic resonance 2007, 186, 150–155
- Chekmenev et al. 2008 Chekmenev, E. Y.; Hövener, J.; Norton, V. A.; Harris, K.; Batchelder, L. S.; Bhattacharya, P.; Ross, B. D.; Weitekamp, D. P. PASADENA hyperpolarization of succinic acid for MRI and NMR spectroscopy. Journal of the American Chemical Society 2008, 130, 4212–4213
- Chekmenev et al. 2009 Chekmenev, E. Y.; Norton, V. A.; Weitekamp, D. P.; Bhattacharya, P. Hyperpolarized 1H NMR employing low nucleus for spin polarization storage. Journal of the American Chemical Society 2009, 131, 3164–3165
- Shchepin et al. 2014 Shchepin, R. V.; Coffey, A. M.; Waddell, K. W.; Chekmenev, E. Y. Parahydrogen Induced Polarization of 1-13C-Phospholactate-d2 for Biomedical Imaging with 30,000,000-fold NMR Signal Enhancement in Water. Analytical chemistry 2014, 86, 5601–5605
- Reineri et al. 2015 Reineri, F.; Boi, T.; Aime, S. ParaHydrogen Induced Polarization of 13C carboxylate resonance in acetate and pyruvate. Nature Communications 2015, 6, 5858
- Cavallari et al. 2018 Cavallari, E.; Carrera, C.; Sorge, M.; Bonne, G.; Muchir, A.; Aime, S.; Reineri, F. The 13C hyperpolarized pyruvate generated by ParaHydrogen detects the response of the heart to altered metabolism in real time. Scientific reports 2018, 8, 8366
- Eills et al. 2017 Eills, J.; Stevanato, G.; Bengs, C.; Glöggler, S.; Elliott, S. J.; Alonso-Valdesueiro, J.; Pileio, G.; Levitt, M. H. Singlet order conversion and parahydrogen-induced hyperpolarization of 13C nuclei in near-equivalent spin systems. Journal of Magnetic Resonance 2017, 274, 163–172
- Roth et al. 2010 Roth, M.; Kindervater, P.; Raich, H. P.; Bargon, J.; Spiess, H. W.; Münnemann, K. Continuous 1H and 13C Signal Enhancement in NMR Spectroscopy and MRI Using Parahydrogen and Hollow-Fiber Membranes. Angew. Chem. 2010, 122, 8536–8540
- Lehmkuhl et al. 2018 Lehmkuhl, S.; Wiese, M.; Schubert, L.; Held, M.; Küppers, M.; Wessling, M.; Blümich, B. Continuous hyperpolarization with parahydrogen in a membrane reactor. Journal of Magnetic Resonance 2018, 291, 8–13
- Giraudeau et al. 2009 Giraudeau, P.; Shrot, Y.; Frydman, L. Multiple Ultrafast, Broadband 2D NMR Spectra of Hyperpolarized Natural Products. J Am Chem Soc 2009, 131, 13902–13903
- Lloyd et al. 2012 Lloyd, L. S.; Adams, R. W.; Bernstein, M.; Coombes, S.; Duckett, S. B.; Green, G. G. R.; Lewis, R. J.; Mewis, R. E.; Sleigh, C. J. Utilization of SABRE-Derived Hyperpolarization To Detect Low-Concentration Analytes via 1D and 2D NMR Methods. J Am Chem Soc 2012, 134, 12904–12907
- Eshuis et al. 2015 Eshuis, N.; Aspers, R. L. E. G.; van Weerdenburg, B. J. A.; Feiters, M. C.; Rutjes, F. P. J. T.; Wijmenga, S. S.; Tessari, M. 2D NMR Trace Analysis by Continuous Hyperpolarization at High Magnetic Field. Angew. Chem. 2015, 127, 14735–14738
- Yilmaz and Utz 2016 Yilmaz, A.; Utz, M. Characterisation of oxygen permeation into a microfluidic device for cell culture by in situ NMR spectroscopy. Lab Chip 2016, 16, 2079–2085
- Bezanson et al. 2017 Bezanson, J.; Edelman, A.; Karpinski, S.; Shah, V. B. Julia: A Fresh Approach to Numerical Computing. SIAM Rev. 2017, 59, 65–98
- Cavallari et al. 2015 Cavallari, E.; Carrera, C.; Boi, T.; Aime, S.; Reineri, F. Effects of magnetic field cycle on the polarization transfer from parahydrogen to heteronuclei through long-range J-couplings. The Journal of Physical Chemistry B 2015, 119, 10035–10041
- Mompeán et al. 2018 Mompeán, M.; Sánchez-Donoso, R. M.; Hoz, A.; Saggiomo, V.; Velders, A. H.; Gomez, M. V. Pushing nuclear magnetic resonance sensitivity limits with microfluidics and photo-chemically induced dynamic nuclear polarization. Nature communications 2018, 9, 108
- Zalesskiy et al. 2014 Zalesskiy, S. S.; Danieli, E.; Blümich, B.; Ananikov, V. P. Miniaturization of NMR Systems: Desktop Spectrometers, Microcoil Spectroscopy, and “NMR on a Chip” for Chemistry, Biochemistry, and Industry. Chem. Rev 2014, 114, 5641–5694
- Mishkovsky and Frydman 2008 Mishkovsky, M.; Frydman, L. Progress in Hyperpolarized Ultrafast 2D NMR Spectroscopy. Chemphyschem 2008, 9, 2340–2348
- Kiryutin et al. 2019 Kiryutin, A. S.; Sauer, G.; Tietze, D.; Brodrecht, M.; Knecht, S.; Yurkovskaya, A. V.; Ivanov, K. L.; Avrutina, O.; Kolmar, H.; Buntkowsky, G. Ultrafast Single-Scan 2D NMR Spectroscopic Detection of a PHIP-Hyperpolarized Protease Inhibitor. Chemistry - A European Journal 2019, 32, 211–7
- Levitt et al. 1982 Levitt, M. H.; Freeman, R.; Frenkiel, T. Supercycles for Broadband Heteronuclear Decoupling. Journal of Magnetic Resonance (1969) 1982, 50, 157–160
- Bax and Davis 1985 Bax, A.; Davis, D. G. MLEV-17-Based Two-Dimensional Homonuclear Magnetization Transfer Spectroscopy. Journal of Magnetic Resonance (1969) 1985, 65, 355–360
- Goldman et al. 2005 Goldman, M.; Johannesson, H.; Axelsson, O.; Karlsson, M. Hyperpolarization of 13C through order transfer from parahydrogen: A new contrast agent for MRI. Magn Reson Imaging 2005, 23, 153–157
- Goldman et al. 2006 Goldman, M.; Johannesson, H.; Axelsson, O.; Karlsson, M. Design and implementation of 13C hyper polarization from para-hydrogen, for new MRI contrast agents. Comptes Rendus Chimie 2006, 9, 357–363
- Ripka et al. 2018 Ripka, B.; Eills, J.; Kouřilová, H.; Leutzsch, M.; H. Levitt, M.; Münnemann, K. Hyperpolarized Fumarate via Parahydrogen. Chemical Communications 2018, 54, 12246–12249
- Roy et al. 2018 Roy, S. S.; Appleby, K. M.; Fear, E. J.; Duckett, S. B. SABRE-Relay: A Versatile Route to Hyperpolarization. The journal of physical chemistry letters 2018, 9, 1112–1117
- Reineri et al. 2015 Reineri, F.; Boi, T.; Aime, S. Parahydrogen induced polarization of 13C carboxylate resonance in acetate and pyruvate. Nature communications 2015, 6, 5858
- Ripka et al. 2018 Ripka, B.; Eills, J.; Kouřilová, H.; Leutzsch, M.; Levitt, M. H.; Münnemann, K. Hyperpolarized fumarate via parahydrogen. Chem. Commun. 2018, 54, 12246–12249
- Korchak et al. 2018 Korchak, S.; Yang, S.; Mamone, S.; Glöggler, S. Pulsed Magnetic Resonance to Signal-Enhance Metabolites within Seconds by utilizing para-Hydrogen. ChemistryOpen 2018, 7, 344–348