Magnetic field driven complex phase diagram of antiferromagnetic heavy-fermion superconductor Ce3PtIn11
Abstract
We present the results of our comprehensive investigation on the antiferromagnetic heavy-fermion superconductor Ce3PtIn11 carried out by means of electrical transport, heat capacity and ac magnetic susceptibility measurements, performed on single-crystalline specimens down to 50 mK in external magnetic fields up to 9 T. Our experimental results elucidate a complex magnetic field – temperature phase diagram which contains both first- and second-order field-induced magnetic transitions and highlights the emergence of field stabilized phases. Remarkably, a prominent metamagnetic transition was found to occur at low temperatures and strong magnetic fields. In turn, the results obtained in the superconducting phase of Ce3PtIn11 corroborate an unconventional nature of Cooper pairs formed by heavy quasiparticles. The compound is an almost unique example of a heavy fermion system in which superconductivity may coexist microscopically with magnetically ordered state.
I Introduction
Investigation of anomalous physical properties at quantum critical point (QCP) in heavy fermion (HF) systems has been at the forefront of contemporary condensed matter research as it may enlighten the fascinating physics involved with these unusual observations at this precarious point of instability Gegenwart ; Si ; Kuchler ; Steglich1 . QCP is associated with continuous quantum phase transition (QPT) which, unlike classical phase transition, is driven by tuning non-thermal parameters Coleman ; Sachdev . In this framework, Ce based HF systems are of particular interest as some of them exhibit superconductivity along with enhanced quasiparticle effective mass, known as heavy fermion superconductors (HFSC) Mathur ; Steglich2 ; White ; Steglich3 ; Petrovic ; Bauer1 ; Kaczorowski , where the pairing mechanism is believed to be mediated by magnetic fluctuations rather than phonons as in case of conventional superconductors Monthoux . In addition, due to unstable nature of orbitals, magnetic ordering in these systems can be tuned by controlling parameters of non-thermal origin, like pressure, chemical doping or magnetic field, leading the system to a QCP where various unusual features such as non-Fermi liquid (NFL) behavior, unconventional superconductivity, etc., are witnessed Ohashi ; Paglione ; Dong ; Kaluarachchi . The majority of the vast number of Ce based HF systems reported in the literature, posses just one position for Ce ions in their crystallographic unit cell. The ground states in these compounds basically result from the interplay between two competitive interactions, namely Ruderman-Kittel-Kasuya-Yosida (RKKY) and Kondo interactions, which can qualitatively be understood in terms of the Doniach phase diagram Doniach . However, the scenario does not appear trivial when there are more than one Ce sites in the crystal structure. The theoretical study by Benlagra et al. on the interplay between two different Kondo effects originating from two inequivalent Kondo sublattices dictates that in different ranges of the conduction-band filling these interactions can be competitive or cooperative, which leads to a fairly complex phase diagram Benlagra .
Investigation of novel Ce based compounds hosting multiple inequivalent Ce sites has received considerable attention from the scientific research community in recent times, as they showcase diverse unusual ground state properties at low temperatures. Different local environment of Ce ions leads to different hybridization strengths, which spark the possibility of having distinctly different ground states for each individual inequivalent Ce ion. For instance, separate AFM orderings of two Ce sublattices has been reported in Ce5Ni6In11 Tang , while Ce9Ru4Ga5 contains three independent Ce sites where two of them order antiferromagnetically at =3.7 K and a third one exhibits valence fluctuations dk . Most remarkably, in the compounds Ce3TIn11 (T = Pt and Pd), bearing two inequivalent Ce sites, a coexistence of AFM order and HFSC has recently been discovered Prokle ; Custers2 ; Kratochv , which set a new playground for comprehensive studies on mutual relationship between magnetism and superconductivity in Ce-based HF systems.
The compound Ce3PtIn11 belongs to the homologous series of phases CenTmIn3n+2m (T stands for -electron transition metal), which encompasses a large variety of intriguing materials including CeCoIn5 Petrovic , CeRhIn5 Park , Ce2PdIn8 Kaczorowski ; Kaczorowski2 ; Kaczorowski3 , Ce2CoIn8 Chen . It crystallizes in a tetragonal structure with space group P, which harbors two inequivalent Ce sites Tursina . Interestingly, Ce3PtIn11 exhibits two successive AFM phase transitions at = 2.2 K and = 2 K, followed by a superconducting transition at = 0.32 K Prokle ; Custers2 . It was arguably speculated that the magnetic ordering is associated with one of the Ce sublattices, while the other one is responsible for HF behavior and superconductivity Custers2 . Remarkably, under hydrostatic pressure the compound exhibits a quantum critical behavior with QCP located at a critical pressure = 1.3 GPa, where 0 and becomes maximum, with normal state electrical resistivity showing NFL behavior Custers2 .
The spectacular low-temperature properties of Ce3PtIn11 motivated us to study the effect of applied magnetic field on the complex AFM ordering and the superconducting state. In particular, our research was aimed to explore field effect on the two AFM transitions and construct a relevant magnetic phase diagram. Electrical transport and thermodynamic measurements were performed on single crystalline specimens at temperatures down to 50 mK. Here, we report the results of our investigations on Ce3PtIn11, which conjointly indicate a complex phase diagram and unconventional SC state coexisting with the AFM ordering.
II Results and discussions
II.1 Crystal structure
We carried our a comprehensive investigation to determine the precise crystal structure of Ce3PtIn11 using an anisotropic model. Even though the crystal structure of this compound was reported previouslyKratochvilova , here we present the results of our X-ray diffraction measurements performed on a tiny crystal which offers very little absorption and high transmission factors of the X-ray beam. This allowed us to reach a high refinement quality of the observed pattern. The crystallographic data are presented in Table 1. The lattice parameters are in good agreement with the previous studyKratochvilova . The anisotropic displacement parameters (see Table 2) indicated that the structure is well defined. The atomic positions and interatomic distances are presented in Table 2 and 3, respectively.
| Empirical formula | Ce3PtIn11 |
|---|---|
| Formula weight | 1878.47 |
| Temperature | 295(2) K |
| Wavelength | 0.71073 Å |
| Crystal system | Tetragonal |
| Space group | P |
| Unit cell dimensions | = 4.6977(2) Å, = 16.8813(13) Å |
| Volume | 372.54(4) Å3 |
| Z | 1 |
| Density (calculated) | 8.373 Mg/m3 |
| Absorption coefficient | 34.904 mm-1 |
| F(000) | 791 |
| Crystal size | 0.066 0.031 0.020 mm3 |
| Theta range for data collection | 3.621 to 26.697∘. |
| Index ranges | -5h5, -5k5, -21l21 |
| Reflections collected | 10014 |
| Independent reflections | 294 [R(int) = 0.0674] |
| Completeness to theta = 25.242∘ | 98.8% |
| Absorption correction | Gaussian |
| Max. and min. transmission | 0.583 and 0.290 |
| Refinement method | Full-matrix least-squares on F2 |
| Data / restraints / parameters | 294 / 0 / 21 |
| Goodness-of-fit on F2 | 1.133 |
| Final R indices [I 2(I)] | R1 = 0.0313, wR2 = 0.0717 |
| R indices (all data) | R1 = 0.0345, wR2 = 0.0732 |
| Largest diff. peak and hole | 2.104 and -1.775 e.Å-3 |
| U11 | U22 | U33 | U23 | U13 | U12 | x | y | z | U(eq) | |
|---|---|---|---|---|---|---|---|---|---|---|
| Ce(1) | 8(1) | 8(1) | 10(1) | 0 | 0 | 0 | 0 | 0 | 0.2776(1) | 9(1) |
| Ce(2) | 10(1) | 10(1) | 10(1) | 0 | 0 | 0 | 0 | 0 | 0 | 10(1) |
| Pt(1) | 12(1) | 12(1) | 13(1) | 0 | 0 | 0 | 0 | 0 | 0.5 | 12(1) |
| In(1) | 9(1) | 19(1) | 11(1) | 0 | 0 | 0 | 0.5 | 0 | 0.4117(1) | 13(1) |
| In(2) | 10(1) | 10(1) | 20(1) | 0 | 0 | 0 | 0.5 | 0.5 | 0.2778(1) | 13(1) |
| In(3) | 10(1) | 18(1) | 12(1) | 0 | 0 | 0 | 0.5 | 0 | 0.1379(1) | 13(1) |
| In(4) | 11(1) | 11(1) | 18(1) | 0 | 0 | 0 | 0.5 | 0.5 | 0 | 13(1) |
| Ce(1)-In(1) | 3.2623(12) |
|---|---|
| Ce(1)-In(2) | 3.32177(14) |
| Ce(1)-In(3) | 3.3287(12) |
| Ce(2)-In(3) | 3.3065(9) |
| Ce(2)-In(4) | 3.32177(14) |
| Pt(1)-In(1) | 2.7821(7) |
| In(1)-In(1)2 | 2.982(2) |
| In(1)-In(2) | 3.2591(15) |
| In(1)-In(1)1 | 3.32177(15) |
| In(2)-In(1)1 | 3.2590(15) |
| In(2)-In(3) | 3.3320(15) |
| In(3)-In(4) | 3.3065(9) |
| In(3)-In(3)1 | 3.32177(15) |
| 1-y,x,z; 2-x+1,-y,-z+1 |
II.2 AFM ordering
In order to have an in-depth understanding of the complex AFM ordering in Ce3PtIn11, we performed heat capacity measurements, , in different magnetic fields applied along the crystallographic direction in the tetragonal unit cell. Fig. 1a displays the temperature evolution of taken in zero field, which manifests two successive AFM transitions at = 2.08 K and = 1.93 K. It is worth noting that both critical temperatures are slightly lower than those reported by Prokleška et al. Prokle . We tentatively anticipate that this discrepancy could be associated with very tiny structural features, like atomic disorder, vacancies, local distortion, which may affect the electronic state of the Ce ion (labeled in Ref. Custers2 as Ce2) responsible for the AFM ordering in Ce3PtIn11. Another important remark that should be highlighted is the absence of any anomaly in at 10 K (see Fig. 1a), which proves that the sample investigated was free from CeIn3 impurity phase.
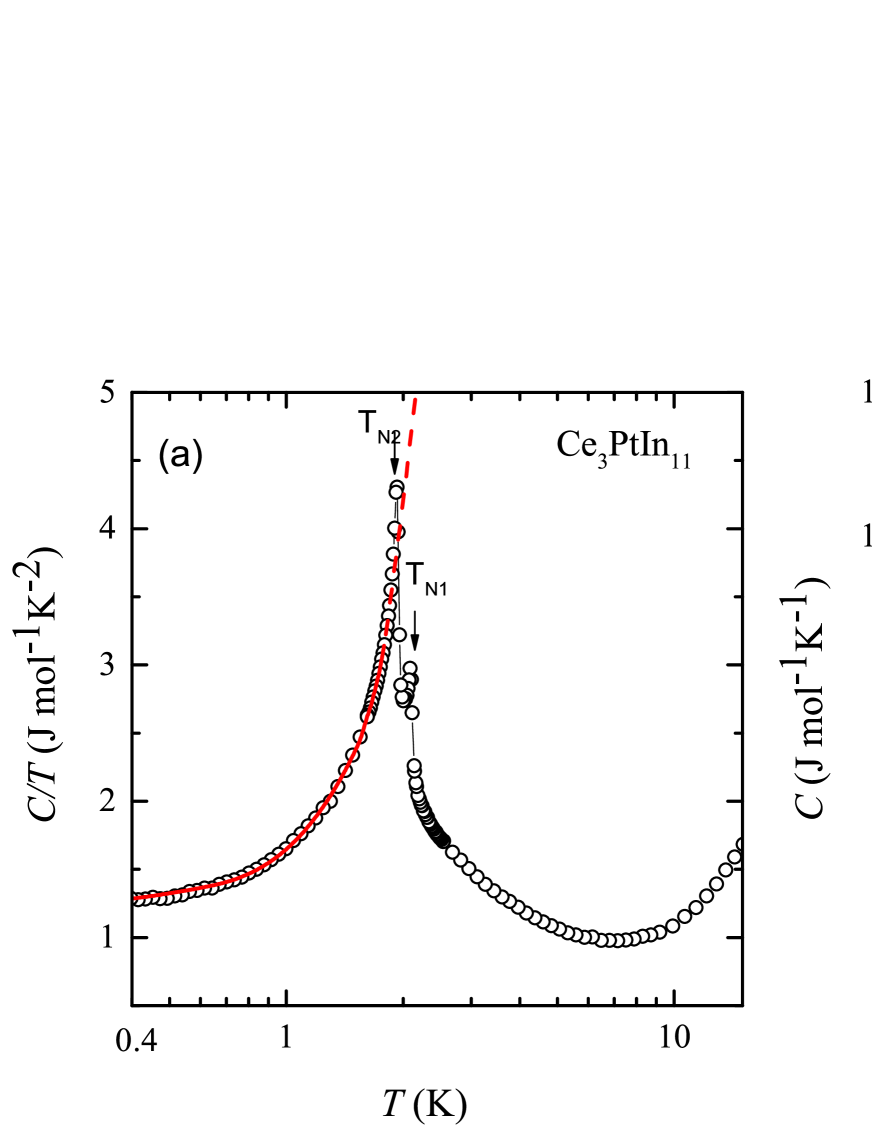
The heat capacity of antiferromagnetic Kondo lattices in the ordered state is often modeled by the formula Medeiros ; Continentino
| (1) |
where the first term signifies the contribution from the heavy quasi-particles and the second term represents AFM magnons contribution with being the gap in the spin wave spectrum. The approach assumes a spin wave dispersion relation of the form , where is the spin wave stiffness. The coefficient in Eq. 1 is related to as Medeiros ; Continentino . The least-squares fitting of the above formula to the experimental data of Ce3PtIn11 measured below is shown in Fig. 1a by the red solid line. The so-obtained parameters are = 1.33(1) J/mol K2, = 76(2) mJ/mol K4 and = 5.9(2) K. The value of is in fairly good agreement with that of estimated by Custers ( = 7.35 K Custers2 ). Furthermore, this gap value is comparable with the energy scale of the critical field ( 4.8 T) of the metamagnetic transition at 0.5 K (see below), which is coming out to be 3.6 K.
As can be inferred from Fig. 1b, with increasing magnetic field the two transitions first shift towards lower temperatures, elucidating AFM nature of the ordering. Remarkably, in a field of about 4 T, these two lambda-type features merge into a single sharp peak of a first-order character, that appears at a temperature which is decreasing with ramping field up to 5 T. In stronger fields, the latter singularity again splits into two anomalies at temperatures which continue to decrease with increasing field. In addition to the sharp anomalies seen, we observed another very broad anomaly near 1.4 K in the specific heat data measured in an applied field of 5.5 T. This feature can be associated with the metamagnetic transition (see below).
The temperature dependence of the electrical resistivity, , of Ce3PtIn11, measured with the current flowing within the basal plane of the tetragonal unit cell of the compound, is presented in Fig. 2a. In the interval 30-100 K, the resistivity decreases with increasing temperature in a logarithmic manner signifying the dominance of Kondo type spin-flip scattering processes. At higher temperatures, forms a broad minimum, and susequently an increase of the resistivity with rising is seen. This feature is most likely a direct consequence of phonon contribution competing with the Kondo interactionsCoqblin ; Kaczorowski4 . Near 15 K, forms a broad maximum that can be attributed to a crossover from incoherent to coherent Kondo regime that is a generic feature of Ce-based Kondo lattices, including the phases CenTmIn3n+2m. For instance, similar feature has been seen in CeCoIn5 ( = 1 and = 1) Petrovic , Ce2PdIn8 ( = 2 and = 1) Kaczorowski and Ce3PdIn11 ( = 3 and = 1) Kratochvilova .
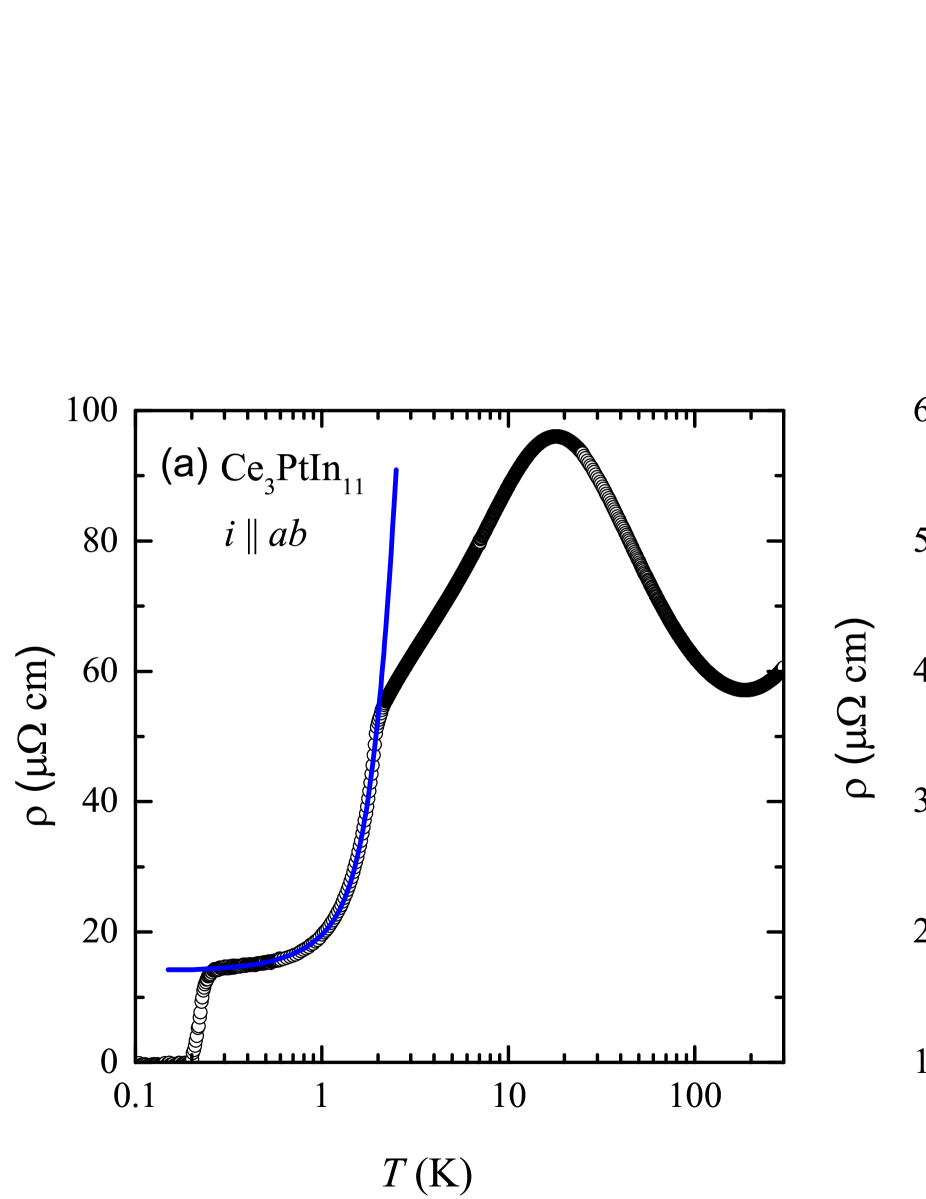
Successively, a distinct drop in is seen at 2.1 K caused by the reduction in the spin-disorder scattering due to the AFM ordering below . Another sharp resistivity drop down to zero occurs at = 0.23 K, and signals the onset of the superconducting state. As displayed in Fig. 2a, at temperatures , the data can be modeled by the formula Fontes
| (2) |
where the second term accounts for Fermi liquid contribution, and the third term represents scattering of conduction electrons on AFM spin-wave excitations with an energy gap in the magnon spectrum (here, phonon contribution was neglected because of very low temperature range considered). The coefficient in this expression is related to the spin-wave stiffness as Fontes . Least-squares fitting of Eq. 2 to the experimental data (see the figure) yielded: = 14.0(1) cm, =5.4(5) cm K-2, = 9.1(3) cm K-2 and = 10.8(1) K. The so-obtained value of is somewhat larger than that derived from the heat capacity data (see above). However, considering difference in methods/experiments involved, these values are fairly comparable. In turn, the quite large value of manifests the significance of electron-electron scattering in this compound, as generally expected for HF systems.
In accordance with the heat capacity results, the AFM transition seen in gradually shifts towards lower temperatures with increasing strength of transverse (applied along the crystallographic axis) magnetic field (see Fig. 2b). Notably, in fields 0 T 2T and 7 T 9 T, two distinct anomalies in d/d are observed (note the arrows in the inset to Fig. 2b), highlighting two separate phase transitions. It is worth pointing out that the field variations of the critical temperatures coincide very well with those derived from the heat capacity data. In addition, another observation which demands special note is the sudden drop in at the ordering temperature observed in applied fields of 7 T and 9 T that gives rise to sharpening of the peak in d/d. This finding is in perfect concert with the features seen in (compare Fig. 1b) suggesting a first order transition.
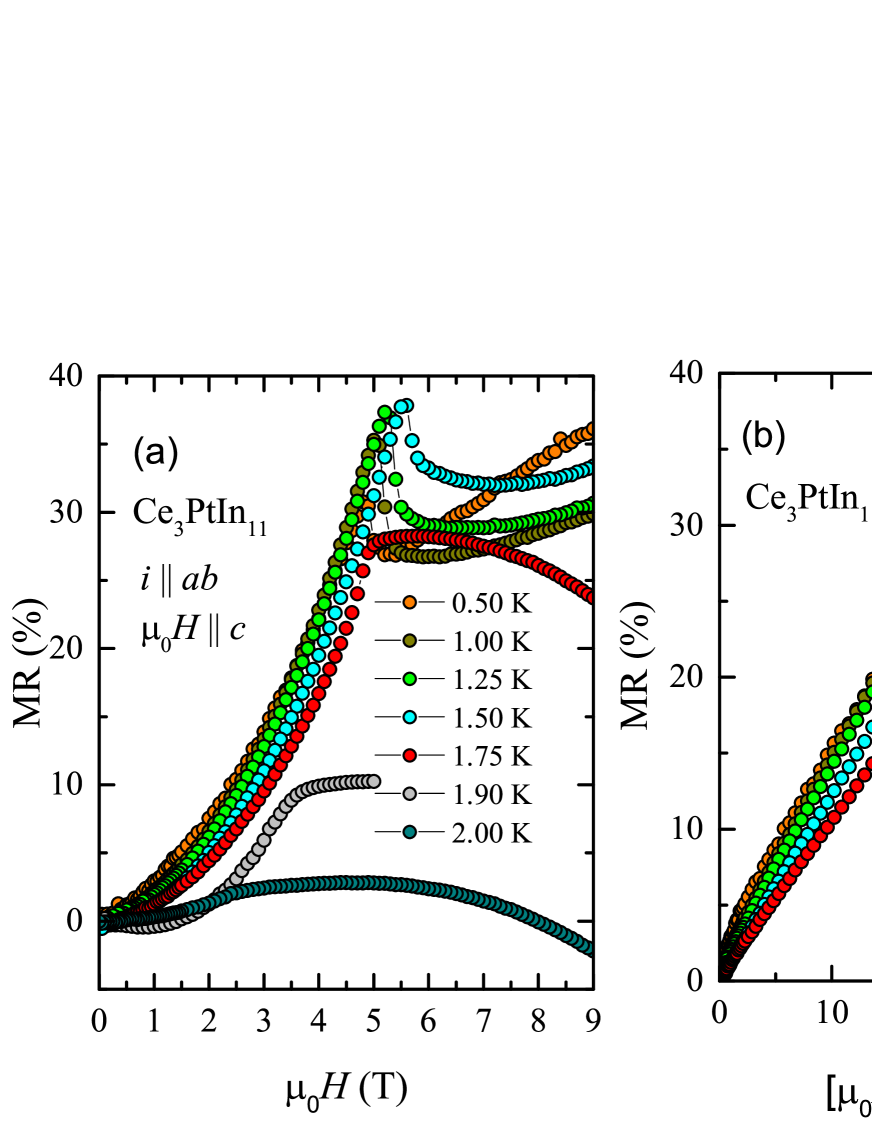
In order to gain further insight on the field-dependent critical behavior observed in the specific heat data, the transverse magnetoresistance (MR = ) of Ce3PtIn11 was measured with electric current flowing within the crystallographic plane and external magnetic field applied along the four-fold axis. The results obtained in the AFM state are shown in Fig. 3a. Far below , MR is positive and increases with ramping field in a quadratic manner (cf. Fig. 3b) up to a critical field , at which a pronounced peak is observed. The positive value of MR is consistent with the AFM ordering in the system, and the MR dependence can be attributed to the influence of magnetic field on the energy dispersion of the AFM spin waves, as predicted by Yamada and Takada within the random phase approximation Yamada . In turn, the MR singularities at manifest metamagnetic-like phase transitions. Remarkably, the value of shows a non-monotonic temperature dependence: on rising up to 1.5 K, it increases but with further increasing temperature, it slightly decreases. Close to , the feature in MR is quite broadened and then disappears.
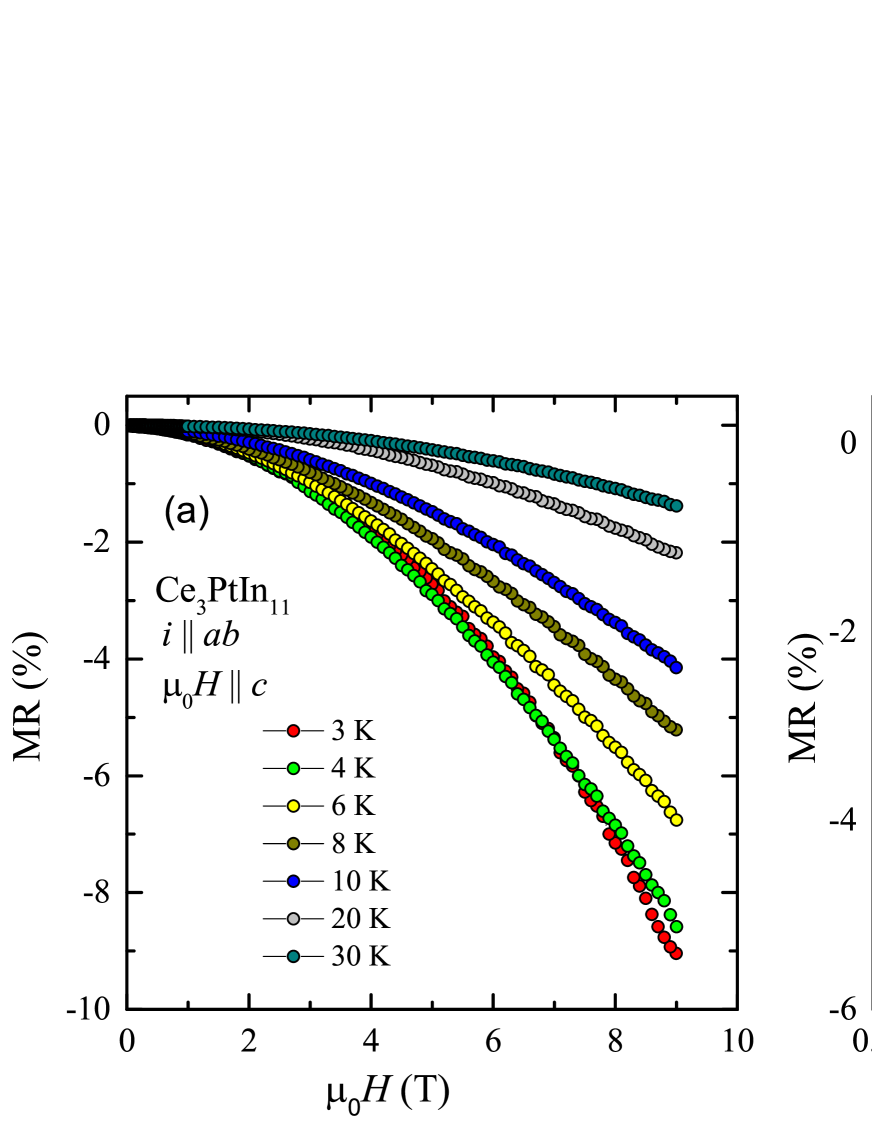
Fig. 3c shows the high-field MR data measured at temperatures 0.5 K (one can expect that in these conditions the scattering of conduction electrons on spin fluctuations is strongly damped). As can be inferred from the figure, above the metamagnetic transition, MR has a linear dependency with field. This feature accounts for some unusual kind of cyclotron motion of the charged particles. It is worth recalling that linear MR may arise in systems with small concentrations of charge carriers having small effective masses, in regime of the electrical transport involving only the lowest Landau level Abrikosov . Clearly, this mechanism should be ruled out for Ce3PtIn11 which is a HF compound. Another possibility for linear MR arises for gapless materials with linear energy spectrum Abrikosov2 ; Parish . In the case of the compound studied, the spin wave gap = 10.1 K was found (from electrical resistivity), and hence also the latter scenario cannot be justified. Actually, the physical origin of the linear contribution to the magnetoresistance of Ce3PtIn11, being dominant at = 0.5 K (see Fig. 2c) remains unclear. It is worthwhile mentioning that similar behavior of MR was found before for antiferromagnetic Ce2PdGa12 Gnida but also for this compound no explanation of this unusual feature was given. Above 1.5 K, the MR isotherms change their overall shapes in strong fields.
Fig. 4a displays the transverse magnetoresistance of single-crystalline Ce3PtIn11 measured as described above at few temperatures in the paramagnetic state. At each temperature, MR is negative and its absolute value decreases with increasing temperature. Such a behavior of MR is expected for a Kondo compound due to freezing-out of the spin-flip scattering by external magnetic field. Remarkably, as shown in Fig. 4b, all the MR isotherms taken at 8 K can be projected onto a single curve by plotting the MR data as a function of , where the parameter is the characteristic temperature, usually considered as an approximate measure of the Kondo temperature Schlottmann . This so-called Schlottmann-type scaling was applied to Ce3PtIn11 yielding = 12 K.
II.3 Magnetic phase diagram
Fig. 5 presents the magnetic field - temperature phase diagram of Ce3PtIn11, constructed based on the results of thermodynamic and electrical transport measurements. Interestingly, the phase boundary constructed from the MR data, , describing metamagnetic transition (MMT), evidences a first order like phase transition which is quite remarkable. Now, in order to properly understand the field evolution of the AFM ordering temperature and emergence of new field-stabilized magnetic phases, the phase diagram can be divided into three regions as pointed out in the inset of Fig. 5. Initially, two AFM transitions occurring at and shift to lower temperatures with increasing the magnetic field strength. Then, in the field range 4 T5 T these two transitions merge into a single feature at further decreasing with ramping field. This finding is quite consistent with the expectation that with increasing field, Zeeman energy is increased and when it exceeds the energy of the intersite-coupling strength, the long-range ordering is turned into a field-induced ferromagnetic state. However, with magnetic field above 5 T, one observes another peculiarity, namely the latter transition again splits into two well separated anomalies seen at and . The positions of these singularities systematically decrease with raising field, at least up to 9 T. Notably, the height of the peak at systematically decreases with increasing field, while the peak at rapidly sharpens on going from 5.5 T to 6 T. Furthermore, at high fields, the shape of the latter anomaly, observed both in the specific heat (see Fig. 1b) and the electrical resistivity (see Fig. 2b), resembles to a first order like transition. This may hint towards possible rearrangement of the Fermi surface sparking the possibility of a field induced Lifshitz transition in this system. Further detailed investigations probing the Fermi surface geometry such as quantum oscillations or angle-resolved photoemmision spectroscopy are needed to verify that conjecture.
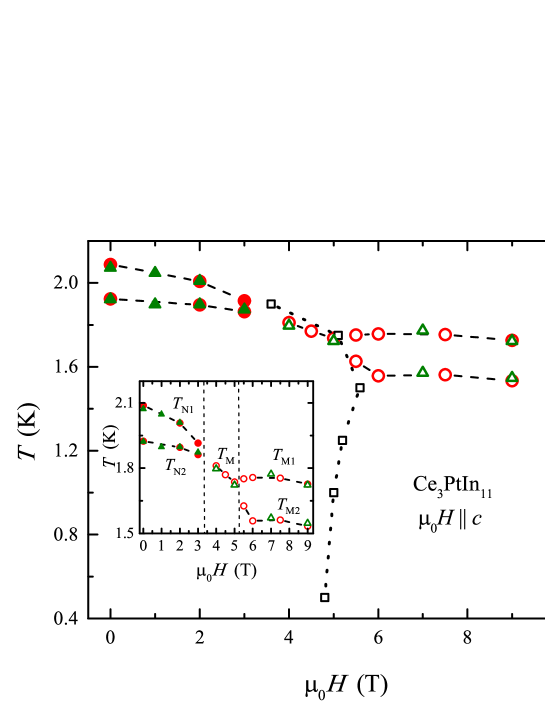
Remarkably, the phase diagram constructed for Ce3PtIn11 bears striking similarities with the magnetic phase diagrams of intensively studied HF antiferromagnets CeRhIn5 and Ce2RhIn8Cornelius . In particular, a common feature is the presence of both first- and second-order field-induced magnetic transitions. Therefore, the phase diagram of Ce3PtIn11 turns out to be quite remarkable as it may suggest the existence of competing order parameters in this material. In order to explore this peerless feature, further investigation involving neutron diffraction and muon spin relaxation/reorientation will be essential. Another direction for future studies would be investigating the thermodynamic and transport properties of Ce3PtIn11 in other magnetic field orientations, in order to shed some light on the expected anisotropy of the field stabilized magnetic phases emerging in this material.
II.4 Superconducting phase
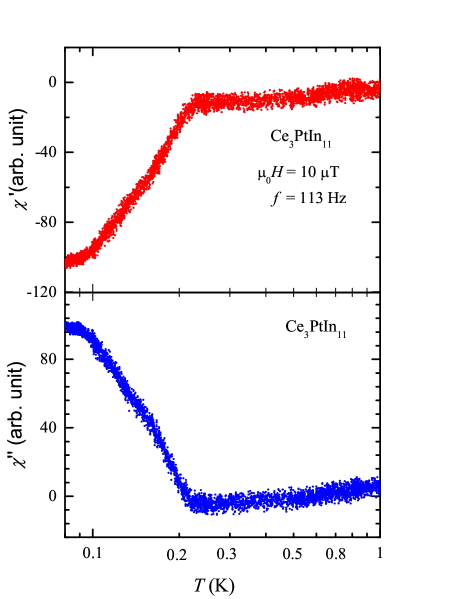
Fig. 6 depicts the real and imaginary components of the dynamic magnetic susceptibility of Ce3PtIn11 measured in zero steady magnetic field with an ac field of 10 T oscillating with frequency of 113 Hz. Both a clear diamagnetic signal in and a pronounced upturn in below = 0.23(1) K manifest the onset of bulk superconductivity in the specimen measured. Remarkably, the so-derived value of is in perfect agreement with the electrical resistivity data described below, however distinctly smaller than = 0.32 K reported in the literature Prokle ; Custers2 . Possible source of this discrepancy may be related to some tiny structural features, as suggested in the previous section in the context of the magnetic critical temperatures. Clarification of this intriguing issue requires comprehensive crystallographic investigations of single crystals of Ce3PtIn11 grown in different batches.
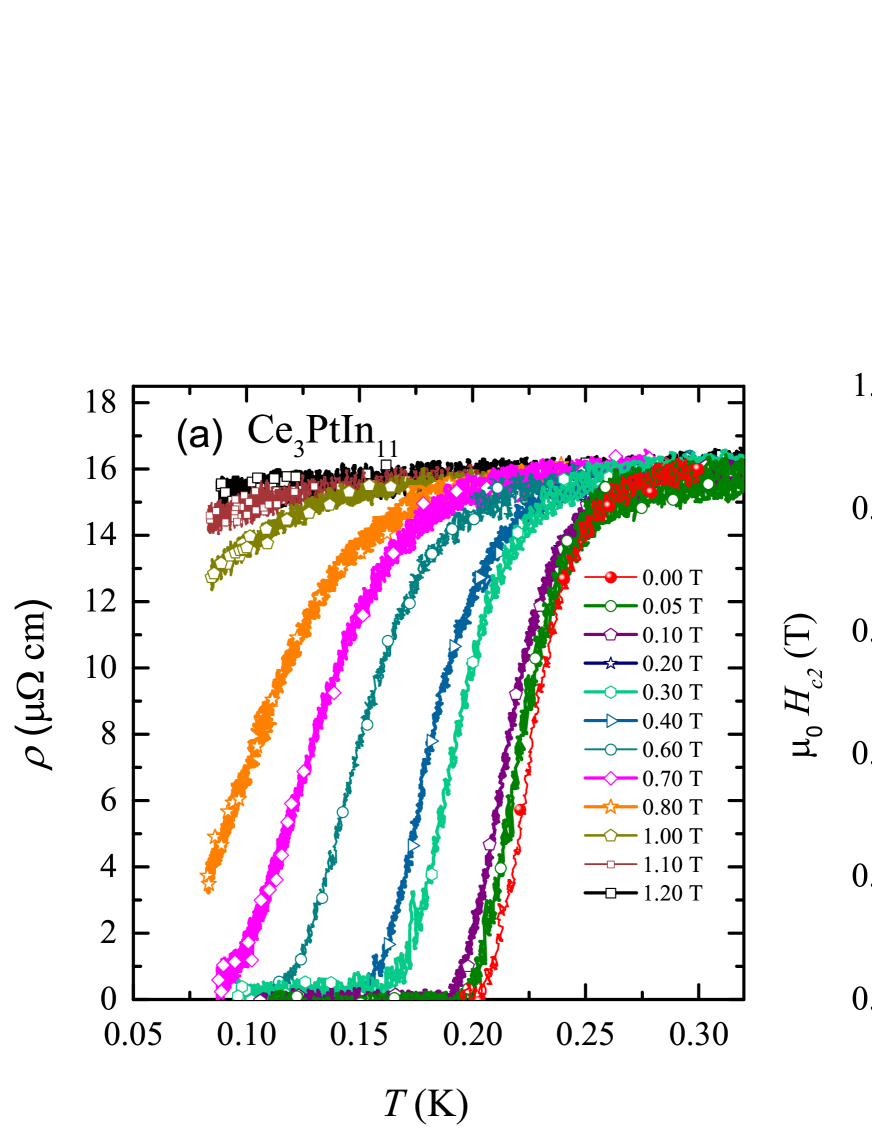
Fig. 7a shows the ultra-low temperature dependence of the electrical resistivity of Ce3PtIn11 measured with electric current flowing in the tetragonal plane and external magnetic field applied along the crystallographic axis. Clearly, with increasing field strength the superconducting transition gradually broadens and shifts to lower temperatures. The critical temperature, defined at the midpoint of the drop in , is equal to = 0.23(2) K, which is in good agreement with the ac magnetic susceptibility data. Plotting the change of in the magnetic field one can derive the temperature variation of the upper critical field in the specimen studied. From the results presented in Fig. 7b, the initial slope of the dependence near is found out to be -10 T/K. The overall dependence can be well approximated using a mean-field type expression
| (3) |
yielding 1.1 T which is much larger than the Pauli-Cologston-Chandrasekhar limiting field = = 0.43 T.
Now from the formula
| (4) |
where is the flux quantum, one can estimate Ginzburg-Landau (GL) coherence length in Ce3PtIn11 to be = 88 Å.
| Parameters | Ce3PtIn11 | Ce2PdIn8 | CePt3Si |
|---|---|---|---|
| (K) | 0.23 | 0.68 | 0.75 |
| (J/mol K2) | 1.33 | 1.0 | 0.335 |
| (T) | 1.1 | 4.8 | 4.0 |
| (T/K) | 10.0 | 14.3 | 8.5 |
| (Å) | 88 | 82 | 81 |
The key characteristics of the superconducting state in Ce3PtIn11 are gathered in Table 4, where they are compared with those reported for Ce2PdIn8 Kaczorowski and CePt3Si Bauer2 . A close resemblance of these various superconducting parameters with those of the well established HF superconductors hints towards a possible unconventional origin of the superconductivity that emerges in Ce3PtIn11 even within the AFM ordered state.
III Conclusions
In summary, the results of our detailed investigation of AFM ordering and superconducting phase in single-crystalline Ce3PtIn11 elucidate a likely coexistence of AFM and superconductivity in this compound. The specific heat and electrical transport data collected in various applied magnetic fields conjointly establish a complex magnetic phase diagram with several distinct field stabilized magnetic phases. It sparks the possibility of finding competing order parameters near the critical field in this compound. This observation is quite remarkable considering the uniqueness of such phase diagram in the existing literature. Furthermore, the magnetotransport data collected at low temperatures revealed a metamagnetic transition followed by a linear field dependence. This feature implies an unusual kind of cyclotron motion.
The electrical resistivity and ac magnetic susceptibility data obtained in the superconducting state in Ce3PtIn11 indicated unconventional superconductivity with the key parameters similar to those reported for well-established heavy-fermion superconductors. Thus, Ce3PtIn11 turns out to be one of the rare examples of HF systems where superconductivity coexists with bulk magnetic order. Further detailed investigations involving microscopic techniques such as muon spin rotation, neutron diffraction and photoemission spectroscopy are called for in order to address the unusual and unique features witnessed in Ce3PtIn11.
IV Methods
Single crystals of Ce3PtIn11 were grown using In flux, as outlined by Kratochvlov . Kratochvilova . The crystals selected for physical properties measurements were examined by x-ray diffraction (XRD) an Oxford Diffraction four-circle single crystal diffractometer equipped with a CCD detector using graphite-monochromatized Mo-K radiation. The raw data were treated with the CrysAlis Data Reduction Program (version 1.171.38.34a). The intensities of the reflection were corrected for Lorentz and polarization effects. The crystal structures were solved by direct methods and refined by full-matrix least-squares method using SHELXL-2014 programSheldrick . The atoms were refined using anisotropic displacement parameters. Their chemical composition was checked by energy-dispersive X-ray (EDX) analysis using a FEI scanning electron microscope equipped with an EDAX PV9800 microanalyzer. The XRD and EDX results confirmed the expected stoichiometry and the crystal structure of the compound, in line with the literature data Prokle ; Custers2 .
The electrical resistivity was measured over the temperature interval 0.4 to 300 K and in magnetic fields up to 9 T using a standard ac four-probe technique implemented in a Quantum Design PPMS platform. In order to probe the superconducting state, a Cryogenic Ltd. 3He-4He dilution refrigerator was employed to carry out electrical resistivity measurements down to 50 mK in applied fields up to 1.2 T. Furthermore, the ac magnetic susceptibility was measured in the same dilution fridge. Heat capacity measurements were performed in the range 0.35-20 K in fields up to 9 T using relaxation method and the PPMS equipment.
V Acknowledgment
This work was supported by the National Science Centre (Poland) under research grant No. 2015/19/B/ST3/03158.
References
- (1) Gegenwart, P., Si, Q. and Steglich, F. Quantum criticality in heavy-fermion metals. Nature Physics 4 , 186 (2008).
- (2) Si, Q. and Steglich, F. Heavy Fermions and Quantum Phase Transitions. Science 329, 1161 (2010).
- (3) Kchler, R., et al. Quantum Criticality in Cubic Heavy-Fermion Syatem CeIn3-xSnx. Phys. Rev. Lett. 96, 256403 (2006).
- (4) Steglich, F. Superconductivity and Magnetism in Heavy-Fermion Compounds. J. Phys. Soc. Jpn 74, 167 (2005).
- (5) Coleman, P. and Schofield, A. J. Quantum criticality. Nature 433, 226 (2005).
- (6) Sachdev, S. Quantum Phase Transitions. (Cambridge Univ. Press, New York, 1999).
- (7) Mathur, N. D., et al. Magnetically mediated superconductivity in heavy fermion compounds. Nature 394, 39 (1998).
- (8) Steglich, F. Superconductivity, magnetic ordering and non-Fermi-liquid effects in heavy-fermion metals. J. Magn. Magn. Mater. 226-230, 1 (2001).
- (9) White, B.D., Thompson, J.D., and Maple, M.B. Unconventional superconductivity in heavy-fermion compounds. Physica C 514, 246 (2015).
- (10) Steglich, F., et al. Superconductivity in the Presence of Strong Pauli Paramagnetism: CeCu2Si2. Phys. Rev. Lett. 43, 1892 (1979).
- (11) Petrovic, C., et al. Heavy-fermion superconductivity in CeCoIn5 at 2.3 K. J. Phys.: Condens. Matter 13, L337 (2001).
- (12) Bauer, E., et al. Heavy Fermion Superconductivity and Magnetic Order in Noncentrosymmetric CePt3Si. Phys. Rev. Lett. 92, 027003 (2004).
- (13) Kaczorowski, D., Pikul, A. P., Gnida, D., and Tran, V. H. Emergence of a Superconducting State from an Antiferromagnetic Phase in Single Crystals of the Heavy Fermion Compound Ce2PdIn8. Phys. Rev. Lett. 103, 027003 (2009).
- (14) Monthoux, P., Pines, D., and Lonzarich, G. G. Superconductivity without phonons. Nature 450, 1177 (2007).
- (15) Ohashi,M., Oomi, G.,Koiwai, S., Hedo, M., and Uwatoko, Y. Fermi-liquid instability of CeRh2Si2 near a pressure-induced quantum phase transition. Phys. Rev. B 68, 144428 (2003).
- (16) Paglione, J., et al. Field-Induced Quantum Critical Point in CeCoIn5. Phys. Rev. Lett 91, 246405 (2003).
- (17) Dong, J. K. Field-Induced Quantum Critical Point and Nodal Superconductivity in the Heavy-Fermion Superconductor Ce2PdIn8. Phys. Rev. X 1, 011010 (2011).
- (18) Kaluarachchi, U. S., Taufour, V., Bud’ko, S. L., and Canfield, P. C. Quantum tricritical point in the temperature-pressure-magnetic field phase diagram of CeTiGe3. Phys. Rev. B 94, 045139 (2011).
- (19) Doniach, S. The Kondo lattice and weak antiferromagnetism. Physica B 91, 231 (1977).
- (20) Benlagra, A., Fritz, L., and Vojta, M. Kondo lattices with inequivalent local moments: Competitive versus cooperative Kondo screening. Phys. Rev. B 84, 075126 (2011).
- (21) Tang, J. Ce5Ni6In11: An intermediate heavy-fermion system. Phys. Rev. B 52, 7328 (1995).
- (22) Kaczorowski, D., Murashova, E., Kurenbaeva, Z., Antiferromagnetic ordering in an intermediate valence compound Ce9Ru4Ga5. Journal of Alloys and Compounds 557, 23 (2013)
- (23) Prokleka, J., et al. Magnetism, superconductivity, and quantum criticality in the multisite cerium heavy-fermion compound Ce3PtIn11. Phys. Rev. B, 92, 161114 (2015).
- (24) Custers, J., Divi, M., and Kratochvlov, M. Quantum Critical Behavior and Superconductivity in new multi-site Cerium Heavy Fermion Compound Ce3PtIn11. J. Phys.: Conf. Ser. 683 , 012005 (2016).
- (25) Kratochvlov, M., et al. Coexistence of Antiferromagnetism and Superconductivity in Heavy Fermion Cerium Compound Ce3PdIn11. Sci. Rep. 5, 15904 (2015).
- (26) Park, T., et al. Hidden magnetism and quantum criticality in the heavy fermion superconductor CeRhIn5. Nature 440, 65 (2006).
- (27) Kaczorowski, D., et al. Non-Fermi liquid behavior in polycrystalline Ce2PdIn8. Physica B 404 2975 (2009).
- (28) Kaczorowski, D., Belan, B., Sojka, L., and Kalychak, Ya. Crystal structure and magnetic behavior of novel R2PdIn8 (R = Pr, Nd, and Sm) compounds. Journal of Alloys and Compounds 509 3208 (2011).
- (29) Chen,G., et al. Observation of Superconductivity in Heavy-Fermion Compounds of Ce2CoIn8. J. Phys. Soc. Jpn 71, 2836 (2002).
- (30) Tursina, A., et al. Ce2PdIn8, Ce3PdIn11 and Ce5Pd2In11—members of homological series based on AuCu3- and PtHg2-type structural units. J. Solid State Chem. 200 7 (2013).
- (31) Kratochvlov, M., et al. Single crystal study of the layered heavy fermion compounds Ce2PdIn8, Ce3PdIn11, Ce2PtIn8 and Ce3PtIn11. J. Cryst. Growth 397, 47 (2014).
- (32) de Medeiros, S. N., et al. Quantum critical point in CeCo(Ge1-xSix)3. Physica B 281–282, 340 (2000).
- (33) Continentino, M. A., et al. Anisotropic quantum critical behavior in CeCoGe3-xSix. Phys. Rev. B 64, 012404 (2001).
- (34) Coqblin, B., and Schrieffer, J.R., Exchange interaction in alloys with cerium impurities Phys. Rev. 185, 847 (1969).
- (35) Kaczorowski, D. and Schoenes, J., Electrical transport properties of UCuAs2 single crystals. Solid State Commun. 74, 143 (1990).
- (36) Fontes, M. B., et al. Electron-magnon interaction in RNiBC (R=Er, Ho, Dy, Tb, and Gd) series of compounds based on magnetoresistance measurements. Phys. Rev. B 60 , 6781 (1999).
- (37) Yamada, H., and Takada, S. Magnetoresistance due to Electron-Spin Scattering in Antiferromagnetic Metals at Low Temperatures. Prog. Theor. Phys. 49, 1401 (1973).
- (38) Abrikosov, A. A. Galvanomagnetic Phenomena in Metals in the Quantum Limit. Sov. Phys.JETP 29, 746 (1969).
- (39) Abrikosov, A. A. Quantum magnetoresistance. Phys. Rev. B 58, 2788 (1998).
- (40) Parish, M. M., and Littlewood, P.B. Non-saturating magnetoresistance in heavily disordered semiconductors. Nature 426, 162 (2003).
- (41) Gnida, D., and Kaczorowski, D. Magnetism and weak electronic correlations in Ce2PdGa12. J. Phys.: Condens. Matter, 25, 145601 (2013).
- (42) Schlottmann, P. Bethe-Ansatz solution of the ground-state of theSU (2j+1) Kondo (Coqblin-Schrieffer) model: Magnetization, magnetoresistance and universality. Z. Phys. B: Condens. Matter 51, 223 (1983).
- (43) Cornelius, A. L.,Pagliuso, P. G., Hundley, M. F., and Sarrao, J. L., Field-induced magnetic transitions in the quasi-two-dimensional heavy-fermion antiferromagnets CenRhIn3n+2 ( = 1 or 2) Phys. Rev. B 64, 144411 (2001).
- (44) Bauer, E. Heavy Fermion Superconductivity and Antiferromagnetic Ordering in CePt3Si without Inversion Symmetry. J. Phy. Soc. Jpn 76, 051009 (2007).
- (45) Sheldrick, G. M. Crystal structure refinement with SHELXL. Acta Crystallogr. A, 71, 3-8 (2015).
Author contributions statement
D.K. conceived the experiments and supervised the research. D.D., D.G., Ł.B. and A.R. performed the physical properties measurements and contributed to the analysis of the experimental data. M.D. conducted the structural characterization of the crystals. D.D. and D.K. wrote the manuscript with notable input from all the other authors.
Competing financial interests: The authors declare that they have no competing interests.