Navigating through the R packages for movement
Summary
-
1.
The advent of miniaturized biologging devices has provided ecologists with unprecedented opportunities to record animal movement across scales, and led to the collection of ever-increasing quantities of tracking data. In parallel, sophisticated tools have been developed to process, visualize and analyze tracking data, however many of these tools have proliferated in isolation, making it challenging for users to select the most appropriate method for the question in hand. Indeed, within the R software alone, we listed 58 packages created to deal with tracking data or ‘tracking packages’.
-
2.
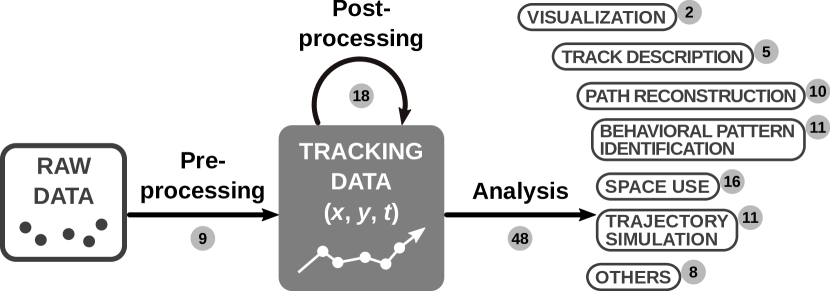
Here we reviewed and described each tracking package based on a workflow centered around tracking data (i.e. spatio-temporal locations ), broken down into three stages: pre-processing, post-processing and analysis, the latter consisting of data visualization, track description, path reconstruction, behavioral pattern identification, space use characterization, trajectory simulation and others.
-
3.
Supporting documentation is key to render a package accessible for users. Based on a user survey, we reviewed the quality of packages’ documentation, and identified 11 packages with good or excellent documentation.
-
4.
Links between packages were assessed through a network graph analysis. Although a large group of packages showed some degree of connectivity (either depending on functions or suggesting the use of another tracking package), one third of the packages worked in isolation, reflecting a fragmentation in the R movement-ecology programming community.
-
5.
Finally, we provide recommendations for users when choosing packages, and for developers to maximize the usefulness of their contribution and strengthen the links within the programming community.
Keywords
biologging, movement ecology, R project for statistical computing, spatial, tracking data
A Movement Ecology background
Animal movement plays a crucial role in ecological and evolutionary processes, from the individual to ecosystem level (Dingle, 1996; Clobert et al., 2001; Nathan et al., 2008). However, studying animal movement has presented challenges to researchers, as individuals are often difficult to follow for extended time periods and over large distances. Over recent decades, decreases in the size and cost of animal-borne sensors or biologging devices have led to an exponential increase in their use. This has substantially improved our understanding of how and why animals move (Nathan et al., 2008; Kays et al., 2015; Hussey et al., 2015). Technological advancements have also enabled a wide range of sensors to be used by ecologists, which can be integrated to remotely record a suite of metrics, including longitude and latitude , altitude or depth , acceleration, as well as in-situ environmental conditions (Wilson, Shepard & Liebsch, 2008; Cagnacci et al., 2010; Wilmers et al., 2015). From these multiple sensors, fine-scale behaviors and physiological states can be inferred (Rutz & Hays, 2009; Halsey et al., 2009).
The increase in quantity and complexity of biologging data requires appropriate analytical and software tools that aid processing and interpretation of data. Those tools should be sound and transparent to allow for reproducibility of results and computation time optimization (Urbano et al., 2010; Reichman, Jones & Schildhauer, 2011; Lowndes et al., 2017). Mainly in the last decade, many of these tools have been made available for the scientific community in the form of packages for the R software (R Core Team, 2018), which has facilitated their widespread use and contributed to make R the most dynamic programming platform in ecology. However, in order to identify the most appropriate function in R for a particular analysis, ecologists have to review and evaluate multiple functions within and between packages.
The aim of this study is to review the packages created to process or analyze a specific type of movement data: tracking data. Movement of an organism is defined as a change in the geographic location of an individual in time, so movement data can be defined by a space and a time component. Tracking data are composed by at least 2-dimensional coordinates and a time index , and can be seen as the geometric representation (the trajectory) of an individual’s path. The packages reviewed here, henceforth called tracking packages, are those explicitly developed to either create, transform or analyze tracking data (i.e. ), allowing a full workflow from raw data from biologging devices to final analytical outcome. For instance, a package that would use accelerometer, gyroscope and magnetometer data to reconstruct an animal’s trajectory via dead-reckoning, thus transforming those data into an format, would fit into the definition. However, a package analyzing accelerometry series to detect changes in behavior would not fit.
Here, we present a workflow for the study of tracking data (Fig. ) and review packages that are designed for tracking data, including their role in data processing and analysis. The workflow is composed of three stages: pre-processing, post-processing and data analysis. Data pre-processing is the process by which data are transformed into the format, and it would be necessary in cases where biologging devices do not provide raw data in the form of tracking data, e.g. for most geolocators or Global Location Sensors (GLS), only light intensity is provided. Tracking data may not be immediately usable, e.g. errors or outliers need to be identified, or other second or third order variables need to be derived for the dataset to be ready for analysis; we defined this stage of data processing as post-processing. Finally, the last stage of analysis can be divided into data visualization, track description, path reconstruction, behavioral pattern identification, space use characterization, trajectory simulation and others (e.g. population parameter estimation, interaction between individuals). In each of these subsections, we describe the tools provided by tracking packages to achieve these goals. When necessary, we also provided a short description of the biologging devices and the data they collect, since not all readers are familiar with every type of device. An additional subsection briefly describes some R packages that do not deal with tracking data (as defined above), but were developed to process and analyze data from biologging devices such as accelerometers and time-depth recorders.
Since the documentation provided in conjunction with the packages are key for rendering them accessible for users, we also review supporting documentation and, based on a survey, summarize packages based on the clarity of their documentation. The links between packages, showing how much they rely on each other and the compatibility between them, are also assessed.
This review is aimed at movement ecologists, whether they are potential users or developers of R packages. This study aims to provide users with criteria through which they can select packages for specific analyses, and offers developers recommendations to maximize the utility of packages and strengthen the links within the R community.
Data sources
Multiple sources were used to identify tracking packages; mainly, 1) the spatio-temporal task view on the Comprehensive R Archive Network (CRAN) repository (https://cran.r-project.org/web/views/SpatioTemporal.html, 2) an updated list of this task on GitHub (https://bit.ly/2CWoSD6), 3) packages suggested in the description files of other packages, 4) Google search engine and 5) e-mail/Twitter exchanges with ecologists. For the Google search, search terms were (trajectory OR movement OR spatiotemporal) AND package AND R. The combined use of these sources provided a large list of packages, from which we selected only the ones that matched the definition of a tracking package stated in the previous section (A Movement Ecology background).
The package search and information gathering was done between March and August 2018. Tracking packages that were either removed from CRAN or described as in a ‘very early version’ on their GitHub repositories were discarded. Information on package documentation was extracted as follows. Standard documentation was categorized as existing if it was available when installing the package. A vignette had to be visible from the main page of the repository or visible as an output of help(package). A peer-reviewed article had to be either mentioned on the main page of the repository, the vignette or in the citation of the package.
It should be noticed that between the period of information gathering and the time of publication of this work, new packages may have been published, and new versions of the reviewed packages containing additional functions could have been released. Information on the reviewed version of each package, links to each package repository along with a summary of their main characteristics are included in the Zenodo repository (https://doi.org/10.5281/zenodo.3483853). In this work, package citation refers strictly to the output of citation(package) in R by the time of writing the manuscript and the version cited in the reference may not match the studied version.
The R packages
Fifty-eight packages were found to assist with processing and analysis of tracking data (Fig. ). Some R packages have been developed to tackle several of these stages of data processing and analysis, while others focus on only one, as shown in Table LABEL:table:PurposeTable. To identify and classify packages functions for each specific stage, our main support was the standard documentation of the packages, complemented with the additional sources of information described in section Data sources above.
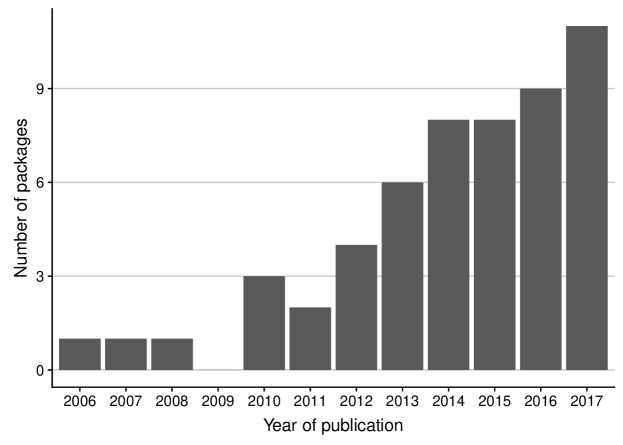
When appropriate, the type of biologging devices from which the tracking data originate is described in the text, so that readers that are not familiar with these devices have a basic idea of the advantages and limitations of the devices, and why some packages focus on specific issues related to them. The description of the tracking packages also includes information on the year each package was publicly available (Fig. ), the main repository where the package is stored and whether it is actively maintained (hereafter referred to as ‘active’). The official repository for R packages is the CRAN repository. CRAN enforces technical consistency, with a set of rules such as the inclusion of ownership information, cross-platform portable code (i.e. to work with Windows, Mac OS and UNIX platforms), minimum and maximum sizes for package components, among others. The majority of the packages reviewed in this manuscript are on CRAN; the remainder are mostly on GitHub or other repositories (e.g. R-Forge or independent websites). Regarding package maintenance, we consider that a package hosted on GitHub is actively maintained if a ‘commit’ (i.e. a contribution) has been made in the last year, and for other packages (if they are not also on GitHub), that the most recent version of the package is no older than one year (analysis conducted in August 2018).
Pre-processing
Pre-processing is required when raw biologging data are not in a tracking data format. The methods used for pre-processing depend heavily on the type of biologging device used. Among the tracking packages, 6 are focused on GLS, one on radio telemetry, and two use accelerometry and magnetometry data.
GLS data pre-processing
GLS are electronic archival tracking devices which record ambient light intensity and elapsed time. The timings of sunset and sunrise are estimated, latitude is calculated from day length, and longitude from the time of local midday relative to Greenwich Mean time (Afanasyev, 2004). GLS can record data for several years and their small size and low mass (1 g) make them suitable for studying long-distance movements in a wide range of species. Several methodologies have been developed to reduce errors in geographic locations generated from the light data, which is reflected by the large number of packages for pre-processing GLS data. We classified these methods in three categories: threshold, template-fitting and twilight-free.
-
•
Threshold methods. Threshold levels of solar irradiance, which are arbritrarily chosen, are used to identify the timing of sunrise and sunset. The packages that use threshold methods are GeoLight (2012, CRAN, inactive) (Lisovski, Hahn & Hodgson, 2012) and probGLS (2016, GitHub, inactive) (Merkel, 2019). GeoLight uses astronomical equations from Montenbruck & Pfleger (2013) to derive locations from timings of sunrise and sunset, and from sun elevation angles. probGLS implements a probabilistic method that takes into account uncertainty in sun elevation angle and twilight events to estimate locations. Starting with the first known location (where the individual was tagged), it estimates the location of the subsequent twilight event which is replicated several times adding an error term; it then computes probabilities for each location based on the plausibility of the estimated speed or on environmental conditions (e.g. sea surface temperature SST) (Merkel et al., 2016).
-
•
Template-fitting methods. The observed light irradiance levels for each twilight are modeled as a function of theoretical light levels (i.e. the template). Then, parameters from the model (e.g. a slope in a linear regression) are used to estimate the locations. The formulation of the model and the parameters used for location estimation vary from method to method (Ekstrom, 2004). The packages that use template-fitting methods are FLightR (2015, CRAN, active) (Rakhimberdiev & Saveliev, 2019), trackit (2012, GitHub, active) (Nielsen et al., 2012a) and tripEstimation (2007, GitHub, inactive) (Sumner, Wotherspoon & Hindell, 2009; Sumner & Wotherspoon, 2016). FLightR was specifically developed for avian movement. In its state-space modeling framework (Patterson et al., 2008), the locations are hidden states and the observation model is a physical model of light level changes as a function of geographic location and time. A detailed description of the model and the package functions can be found in Rakhimberdiev et al. (2015) and Rakhimberdiev et al. (2017), respectively. trackit was developed mainly for fish movement and light intensity around sunrise and sunset are used as inputs in a state-space model that includes solar altitude and SST as covariates (Lam, Nielsen & Sibert, 2010). tripEstimation was developed for marine organisms. It uses a Bayesian approach modeling light level as a function of sun elevation at each plausible location, prior knowledge of the animal’s movement, and complementary environmental information (e.g. SST, depth of the water column) (Sumner, Wotherspoon & Hindell, 2009). Although tripEstimation is still available on CRAN, it is indicated in its GitHub repository that the package was deprecated in favor of SGAT (Sumner, Wotherspoon & Hindell, 2009; Lisovski, Hahn & Hodgson, 2012), which contains functions to implement both threshold and template-fitting methods (note that the authors of tripEstimation are also the main authors of SGAT and GeoLight, and that the references to cite the packages are the same). For this reason, we consider both tripEstimation and SGAT as one. Auxiliary packages also exist to detect the timing of twilight periods from light data from GLS devices (e.g. TwGeos (Wotherspoon, Sumner & Lisovski, 2016b) and BAStag (Wotherspoon, Sumner & Lisovski, 2016a)). The estimated twilight periods can be later used as inputs in the above mentioned packages for location estimation.
-
•
Twilight-free methods. It is possible to estimate locations without depending on the identification of twilight events. TwilightFree (2017, GitHub, active) (Bindoff & Wotherspoon, 2019) uses a Hidden Markov Model (HMM) where the hidden states are the daily geographic locations (the spatial domain is discretized as gridded cells) and the observed variable is the observed pattern of light and dark over the day (Bindoff et al., 2017). SST and land/sea marks can be used as covariates. Parameter estimation is performed using functions from the SGAT package.
Radio tagging data pre-processing
Radio tagging (Kenward, 2000) involves the attachment of a radio transmitter to an animal. The radio signals transmitted (typically Very High Frequency VHF or Ultra High Frequency UHF) are picked up by an antenna and transformed into a beeping sound by a receiver. As the receiver gets closer to the transmitter, the beeps get louder. Location can then be estimated either by triangulation or with a method called homing, where the researcher moves towards the loudest beeps until the animal has been located. RFID (radio-frequency identification data) tags can also be used to record when an individual passes close to a receiver without the need to search for a signal.
telemetr (2012, GitHub, inactive) (Rowlingson, 2012) implements several triangulation methods as well as a maximum likelihood procedure to estimate locations from bearing data (triangulation information). Since there are no references to the methods in the package documentation, it is aimed at users that are already familiar with the methods.
Dead-reckoning using accelerometry and magnetometry data
High-frequency (e.g. 10 Hz) tri-axial accelerometers measure both static (gravitational) and dynamic body acceleration (DBA). The static component is typically derived using a sliding average over short time windows of a few seconds on each axis (Shepard et al., 2008). The static component enables determining the animal’s body posture. The dynamic component is calculated by subtracting the static acceleration from the raw acceleration on each axis, and provides a measure of the animal’s movement or velocity as a result of body motion. When coupled with time activity budgets and validated with empirical measurements of metabolic rate, the overall DBA can be used to estimate the animal’s energy expenditure (Wilson et al., 2019). High-frequency tri-axial magnetometers measure the geomagnetic field strength in the three axes and provide a measure of 3D orientation for dead-reckoning (e.g. Bidder et al., 2015) and for behavior identification (Williams et al., 2017).
The combined use of magnetometer and accelerometer data, especially as provided by modern inertial measurement units, which solve the problem of temporal synchronization among different sensors, and optionally gyroscopes and speed sensors, allows to reconstruct sub-second fine scale movement paths using the dead-reckoning (DR) technique (Wilson et al., 1991; Bidder et al., 2015). Given an initial known location (e.g. tagging or release location), the DR method uses speed and direction movement parameters derived from accelerometer, magnetometers and sometimes additional sensors, to reconstruct the movement path from one location to the next. Specifically, DBA derived from accelerometers can provide a useful metric of speed for terrestrial individuals (Bidder et al., 2012), though in aerial/aquatic media it may be better to use a speed sensor. Magnetometers—after appropriate calibration and correction for other sources of magnetism (Bidder et al., 2015), and in combination with accelerometers and gyroscopes when available—provide fine-scale measures of heading and direction. However, as DR is based on vectorial calculations, it accumulates errors over time, further compounded in the presence of passive movements caused by currents and drifts. Independent locations, typically collected by a GPS recording at lower frequency than the accelerometers and magnetometers, are required to correct for these errors (Bidder et al., 2015; Liu et al., 2015); see section Path reconstruction below for further details. Furthermore, the exact mathematical formulas for DR differ in the literature, and most of them do not account for 3D movement (see Benhamou (2018) for a comparison of movement properties in 2D and 3D). A discussion on DR per se is out of the scope of this work, but we advise users to understand the methods behind the packages performing DR before using them. animalTrack (2013, CRAN, inactive) (Farrell & Fuiman, 2013) and TrackReconstruction (2014, CRAN, inactive) (Battaile, 2014) implement DR to obtain tracks, though use different methods. While TrackReconstruction refers to Wilson et al. (2007) for DR, animalTrack cites Bowditch (1995).
Post-processing
Post-processing of tracking data comprises data cleaning (e.g. identification of outliers or errors), compressing (i.e. reducing data resolution which is sometimes called resampling) and computation of metrics based on tracking data, which are useful for posterior analyses.
Data cleaning
argosfilter (2007, CRAN, inactive) (Freitas, 2012) and SDLfilter (2014, CRAN, active) (Shimada et al., 2012, 2016) implement functions to filter implausible platform terminal transmitter (PTT) locations. Platform terminal (also known as Argos) transmitters send signals to polar-orbital Argos satellites, which geographically locate the source of the data. They preserve battery life by only needing to transmit signals (rather than receiving), leading them to be used for tracking of large-scale migrations, particularly marine mammals and turtles. When the tracked animals are under water, the chances of a satellite receiving PTT signals decrease, so fewer locations can be estimated, and they are likely estimated with fewer satellites, so their accuracy also diminishes. PTTs are particularly useful for individuals that cannot be recaptured, and hence a device recovered. Along with locations, Argos provide accuracy classes (1, 2, 3, 0, A, B, Z) which are associated with different degrees of spatial error (Costa et al., 2010). argosfilter’s algorithm is described in Freitas et al. (2007). It essentially removes records where a location was not estimated as well as locations that required unrealistic travel speeds. SDLfilter allow the removal of duplicates, locations estimated with a low number of satellites, biologically unrealistic locations based on speed thresholds or turning angles and locations above high tide lines. The filtering methods are described in Shimada et al. (2012, 2016), and they are also adapted to GPS data. GPS loggers are perhaps the most widely used type of biologging device. Location information from GPS can be downloaded directly without any post processing. GPS receivers collect but do not transmit information, and infer their own location based on the location of GPS satellites and the time of transmission. Four or more satellites should be visible to the receiver to obtain an accurate result ( m; able to reach m in some cases) (Tomkiewicz et al., 2010), so when less satellites are visible, location accuracy can be reduced.
Other packages with functions for cleaning tracking data are T-LoCoH (2013, R-forge, active) (Lyons, Getz & R Development Core Team, 2018), TrajDataMining (2017, CRAN, active) (Monteiro, 2018) and trip (2006, CRAN, active) (Sumner, 2016). They can be used for any tracking data and also contain functions to remove duplicates or records with unrealistically high speeds.
Data compression
Rediscretization or getting data to equal step lengths can be achieved with adehabitatLT (2010, CRAN, active) (Calenge, 2006), trajectories (2014, CRAN, active) (Pebesma, Klus & Moradi, 2018) or trajr (2018, CRAN, active) (McLean & Volponi, 2018). Regular time-step interpolation can be performed using adehabitatLT, amt (2016, CRAN, active) (Signer, 2018) or trajectories. Other compression methods include Douglas-Peucker (TrajDataMining and trajectories), opening window (TrajDataMining) or Savitzky-Golay (trajr). For a brief review on compression methods, see Meratnia & de By (2004).
rsMove (2017, CRAN, active) (Remelgado, 2018) provides functions to explore and transform tracking data for a posterior linkage with remote sensing data. Location fixes are transformed into pixels and grouped into regions. The spatial or temporal resolution of the tracking data can be changed to match the resolution of the remote sensing data.
Computation of metrics
Some packages automatically derive second or third order movement variables (e.g. distance and angles between consecutive fixes) when transforming the tracking data into the package’s data class (most packages define their own data classes, see file in Zenodo, https://doi.org/10.5281/zenodo.3483853). These packages are adehabitatLT, momentuHMM (2017, CRAN, active) (McClintock & Michelot, 2018), moveHMM (2015, CRAN, active) (Michelot et al., 2016), rhr (2014, GitHub, inactive) (Signer, 2016) and trajectories. bcpa has a function to compute speeds, step lengths, orientations and other attributes from a track. amt, move (2012, CRAN, active) (Kranstauber, Smolla & Scharf, 2018), segclust2d (2018, CRAN, active) (Patin et al., 2018), trajr and trip also contain functions for computing those metrics, but the user needs to specify which ones they need to compute.
feedr (2016, GitHub, active) (LaZerte, 2019) works specifically with RFID data (described in subsection Radio tagging data pre-processing above). Raw RFID data typically contain an individual line of data for each read event made by each RFID logger. feedr contains functions to read raw data from several RFID loggers, and to transform the data of logger detection into movement data for each individual, computing statistics such as the time of arrival and departure from each logger station, and how much time was spent near a station at each visitation.
VTrack (2015, CRAN, active) (Campbell et al., 2012) handles acoustic telemetry data. Acoustic telemetry uses high frequency sound (between 30 and 300 kHz) to transmit information through water. Tags (transmitters) emit a pulse of sound, which is detected by a hydrophone (or an array of hydrophones) with an acoustic receiver. The distance at which a transmitter can be detected depends on the power and frequency of the tag, and the characteristics of the surrounding environment (e.g. background noise, water turbidity and temperature) (DeCelles & Zemeckis, 2014). VTrack was created to deal with VEMCO©data, which has a similar structure than RFID; it is composed of transmitter ID, receiver ID, datetime stamps and the location of receiver. Like feedr for RFID, VTrack can compute statistics such as the time of arrival and departure from each receiver, and how much time was spent near a receiver at each visitation.
Visualization
In this section, we focus on the packages mainly developed for visualization purposes. Those are anipaths (2017, CRAN, active) (Scharf, 2018) and moveVis (2017, CRAN, active) (Schwalb-Willmann, 2018).
They were both conceived for producing animations of tracks. anipaths relies on the animation package (Xie, 2013; Xie et al., 2017). Users can specify time-steps and seconds per frame for animation, add a background map (e.g. Google Maps) and an individual-level covariate (e.g. migrant, stationary), among others. Consecutive fixes are joined via a spline-based interpolation and a confidence interval for the interpolation of the path for animation can be shown.
moveVis is based on a ggplot2 (Wickham, 2016) plotting architecture and works with move data class objects. Users can choose between ‘true time’ which displays the animation respecting the timestamps provided, or ‘simple’ animations where time is not taken into account and all individuals are displayed together as if their tracks started at time 0. Consecutive fixes are joined via linear interpolation. As in anipaths, users can specify the number of frames per second and personalize the background map. Statistics related to the background layer (e.g. temperature, land cover) can also be shown as animated lines or bar plots. For both packages, animations can be saved in many different formats such as mpeg, mp4 and gif.
Track description
amt, movementAnalysis (2013, GitHub, inactive) (Sijben, 2013) and trajr compute summary metrics of tracks, such as total distance covered, straightness index and sinuosity. It should be noted that movementAnalysis depends on adehabitat, which was officially removed from CRAN in 2018, as it was superseeded by adehabitatLT, adehabitatHR (2010, CRAN, active) (Calenge, 2006) and adehabitatMA (Calenge, 2006) in 2010.
trackeR (2015, CRAN, active) (Frick & Kosmidis, 2017) was created to analyze running, cycling and swimming data from GPS-tracking devices for humans. trackeR computes metrics summarizing movement effort during each track (or workout effort per session). Those metrics include total distance covered, total duration, time spent moving, work to rest ratio, averages of speed, pace and heart rate.
Path reconstruction
Whether it is for the purposes of correcting for sampling errors, or obtaining finer data resolutions or regular time steps, path reconstruction is a common goal in movement analysis. Here, we mention methods available, however, before choosing a method, users should be aware that every method is constructed under unique movement assumptions (either inherent to the mathematical model or constructed for a particular species or type of data), and users should refer to the literature on the methods first. Packages available for path reconstruction are HMMoce (2017, CRAN, active) (Braun et al., 2017), kftrack (2011, GitHub, active) (Sibert et al., 2012), ukfsst/kfsst (2012, GitHub, active) (Nielsen et al., 2012b), argosTrack (2014, GitHub, active) (Albertsen, 2018; Albertsen et al., 2015), bsam (2016, CRAN, active) (Jonsen, Flemming & Myers, 2005; Jonsen, 2016), BayesianAnimalTracker (2014, CRAN, inactive) (Liu, 2014), TrackReconstruction, crawl (2008, CRAN, active) (Johnson & London, 2018; Johnson et al., 2008), ctmcmove (2015, CRAN, active) (Hanks, 2018) and ctmm (2015, CRAN, active) (Fleming & Calabrese, 2019). While the first three focus on GLS data, bsam is intended for PTT data, BayesianAnimalTracker and TrackReconstruction combine GPS data and DR, and the last three could be used with any tracking data.
Improving location estimation from GLS data
kftrack, kfsst and ukfsst were developed by the same team of trackit, described in section Pre-processing above. As trackit, they are mainly focused on fish movement. kftrack, ukfsst and kfsst use already estimated positions, either by the threshold method or given by the provider, and improve those estimations using a 2-dimensional random walk model (Sibert, Musyl & Brill, 2003). Because of the generality of this modeling framework, kftrack could actually be used for any tracking data. In addition to the random walk model, kfsst includes SST as a covariate in the model (Nielsen et al., 2006), but it has been superseded by ukfsst, which implements an optimized parameter estimation. For that reason, we consider kfsst and ukfsst as one package.
HMMoce, also adapted to fish movement and working with already estimated/provided locations, uses HMMs (like TwilightFree) and incorporates depth-temperature profiles and SST as covariates in the observed model (Braun et al., 2017).
Improving location estimation from PTT data
bsam estimates locations by fitting Bayesian state-space models to the data. They offer the possibility of accounting for different movement patterns using ‘switching models’ or HMMs; if this is opted out, first-difference correlated random walk models (DCRWs) are used. It is possible to estimate some of the model parameters for each individual and others at the population level (see Jonsen et al. (2013); Jonsen (2016) for more details). The argosTrack package fits several types of movement models to PTT data (Albertsen et al., 2015), such as correlated random walks (CRWs) in discrete and continuous versions, and Ornstein-Uhlenbeck (OU) models, using Laplace approximation via Template Model Builder.
Combining dead-reckoning and GPS data
DR is based on vectorial calculations, thus even small errors in speed and/or direction accumulate over time. This can be further compounded in the presence of passive movements caused by currents and drifts. Independent locations, typically collected by a GPS recording at lower frequency than the accelerometers and magnetometers, are required to correct for these errors. TrackReconstruction provides a function that, after computing DR, forces the estimated locations to go through the known GPS points via space transformation, which returns a path with good shape but with biased length and orientation. BayesianAnimalTracker does not assume GPS to give the ‘true locations’. Instead, it implements a Bayesian approach to correct for biases, assuming a Brownian Bridge prior and using GPS points and an already estimated DR path to obtain a posterior of the sequence of locations. The posterior mean can be used as an estimate of the track, and the posterior standard error provides a measure of uncertainty about the estimated path (Liu et al., 2016).
In Bidder et al. (2015), the speed component is expressed as a linear equation, where the values of the coefficients are corrected iteratively until the dead-reckoned paths and ground-truth positions (e.g. GPS data) match. They also propose computing a correction factor for the heading vector. This method allows for correcting within the DR procedure, but has not been implemented in any R package so far.
Modeling movement of general tracking data
crawl reconstructs paths by fitting continuous-time CRW models (called CTCRWs) (Johnson et al., 2008) to tracking data. Though it can be used for any tracking data, crawl can account for the accuracy classes of PTT data to model the error associated with locations. ctmcmove fits a functional movement model (Buderman et al., 2016) to the data and a set of probable true paths can be generated. ctmm fits several continuous movement models such as Brownian motion and OU-based models, selects the best models via AIC and allows for prediction (thus path reconstruction) with the selected model.
Behavioral pattern identification
Another common goal in movement ecology is to get a proxy of the individual’s behavior through the observed movement patterns, based on either the locations themselves or second/third order variables such as distance, speed or turning angles. Covariates, mainly related to the environment, are frequently used for behavioral pattern identification.
We classify the methods in this section as: 1) non-sequential classification or clustering techniques, where each fix in the track is classified as a given type of behavior, independently of the classification of the preceding or following fixes (i.e. independently of the temporal sequence); 2) segmentation methods, which identify change in behavior in time series of movement patterns to cut them into several segments; and 3) hidden Markov models, centered upon a hidden state Markovian process (representing the sequence of non-observed behaviors) that conditions the observed movement patterns (Langrock et al., 2012).
Non-sequential classification or clustering techniques
EMbC (2015, CRAN, active) (Garriga et al., 2018) implements the Expectation-maximization binary clustering method (Garriga et al., 2016). m2b (2017, CRAN, inactive) (Dubroca & Thiebault, 2017) implements a random forest (a wrapper for the randomForest (Liaw & Wiener, 2002) package functions) to classify behaviors using a supervised training dataset, thus a dataset of both tracking data and known behaviors is needed to train the model.
Segmentation methods
adehabitatLT, bcpa (2013, CRAN, inactive) (Gurarie, 2014), segclust2d, marcher (2017, CRAN, active) (Gurarie & Cheraghi, 2017) and migrateR (2016, GitHub, active) (Spitz, 2018) implement segmentation methods. adehabitatLT presents two of these methods: Gueguen (Guéguen, 2001) and Lavielle (Lavielle, 1999, 2005). bcpa implements the behavioral change point analysis (Gurarie, Andrews & Laidre, 2009). segclust2d implements a bivariate extension of Lavielle and is also described as an extension of Picard et al. (2007) by its authors, but there was no documentation on the method by the time of the review. Both marcher and migrateR are suited for analysis of migratory behavior. marcher enables the mechanistic range shift analysis method (Gurarie et al., 2017) that identifies changes in locations of focal ranges, so migration and resident behaviors can be distinguished. The ranging models available in the package can take into account autocorrelation in location and in velocity. migrateR uses net displacement models to identify migratory, residency and nomadic behavior (Spitz, Hebblewhite & Stephenson, 2017). The models can incorporate factors such as elevation, sensitivity to starting date in the series, minimum time out of residence zone, among other features.
Hidden Markov models
In this category we consider standard HMMs as well as more complex versions of these models; e.g. adding hierarchical structures, a second observation process for locations (state-space modeling), covariates affecting different components in the model, autoregressive processes or a spatial covariance structure. bsam, lsmnsd (2016, GitHub, active) (Bastille-Rousseau, 2019a), moveHMM and momentuHMM implement methods that fall in the HMM category. bsam, for PTT data, implements Bayesian state-space models as described in section Path reconstruction above, and may incorporate a layer of two switching states into the model: one state representing directed fast movement, and the other representing relatively undirected slow movement (Jonsen et al., 2013). lsmnsd use an HMM approach were the observed variable is net squared displacement and its mixture model distribution is conditioned on three hidden states that would correspond to two encamped and one exploratory mode (Bastille-Rousseau et al., 2016); the time spent in each mode and the transition probabilities are used to classify the track as migration, dispersal, nomadic or sedentary.
moveHMM and momentuHMM are not restricted to two or three states. moveHMM implements HMMs incorporating covariates and allowing for state sequence reconstruction, i.e. sequences of the behavioral proxies, via the Viterbi algorithm. In moveHMM, the variables modeled in the observed process are step length and turning angles, or two variables that statistically behave as step length and turning angles. momentuHMM implements generalized Hidden Markov models (McClintock et al., 2012) with great flexibility for the choice of observed variables and their probability distributions, and covariate incorporation in the models. Since HMMs require regular time steps, momentuHMM offers a multiple imputation method (McClintock, 2017): it fits a CTCRW (from crawl) to the data obtaining regular time-step realizations and then fits an HMM to those realizations; all of this is done multiple times. Even if the data classes and model formulation in the package differ from moveHMM, many of the HMM-related functions are based on moveHMM. moveHMM is more user-friendly than momentuHMM, but momentuHMM offers greater modeling possibilities.
Space and habitat use characterization
Multiple packages implement functions to help answer questions related to where animals spend their time and what role environmental conditions play in movement or space-use decisions, which are typically split into two categories: home range calculation and habitat selection.
Home range
Several packages allow the estimation of home ranges: adehabitatHR, amt, BBMM (2010, CRAN, inactive) (Nielson et al., 2013), ctmm, mkde (2014, CRAN, inactive) (Tracey et al., 2014a), MovementAnalysis, move, rhr and T-LoCoH. They provide a variety of methods, from simple Minimum convex polygons (MCP) (Mohr, 1947) to more complex probabilistic Utilization distributions (UD) (Van Winkle, 1975), potentially accounting for the temporal autocorrelation in tracking data, as detailed below.
-
•
adehabitatHR contains a comprehensive list of methods to estimate home ranges: convex hull methods like MCP, clustering techniques, Local convex hulls (LoCoH) (Getz et al., 2007) and the characteristic hull method Downs & Horner (2009); UD methods like kernel home ranges, also with the modification from Benhamou & Cornélis (2010) to account for boundaries, and methods to account for temporal autocorrelation between locations (Brownian bridge kernel method) (Bullard, 1991); biased random bridge kernel method also known as movement-based kernel estimation (Benhamou & Cornélis, 2010; Benhamou, 2011); and product-kernel algorithm, Horne et al. (2007).
-
•
amt also allows the estimation of home ranges using three common approaches not based on movement (MCP, LoCoh, and kernel UD), as well as movement-based UDs from fitted Step Selection Functions (SSFs, Fortin et al., 2005, see below).
-
•
rhr (Signer & Balkenhol, 2015) provides a graphical user interface to estimate home ranges using several non-movement based methods, such as parametric home ranges, MCP, kernel UD, or local convex hulls, as well as the Brownian Bridge kernel method (as a wrapper to the adehabitatHR function). Complementary analyses include time to statistical independence, site fidelity test (against random permutation of step lengths and angles), among others.
-
•
T-LoCoH is focused on constructing home-range hulls (Lyons, Turner & Getz, 2013). A time-scale distance metric and a set of different nearest-neighbor criteria are available to choose which points to consider in a same hull. Hull metrics for space use, such as number of revisitations (repeated visits of an individual to the same hull) and their durations are also computed. Although the package was originally implemented for GPS data, it can be used for tracking data in general.
-
•
BBMM, movementAnalysis and mkde use Brownian bridge movement models to obtain UDs. mkde allows for a 3D extension of the Brownian bridges (Tracey et al., 2014b).
-
•
move, in turn, calculates UDs of tracking data via dynamic Brownian Bridge modeling (Kranstauber et al., 2012) or uses MCP for home range estimation; for the latter, it imports functions from adehabitatHR.
-
•
ctmm fits several candidate continuous-time movement models via a variogram regression approach (Fleming et al., 2014), which can account for spatial autocorrelation in locations and periodicity in space use (Péron et al., 2016). UDs are computed via an autocorrelated kernel estimator, where the autocorrelation term comes from the movement model previously fitted (Fleming et al., 2015).
Habitat use
The role of habitat features on animal space use, or habitat selection, can be investigated with any of the following four packages.
-
•
hab (2015, GitHub, inactive) (Basille, 2015) enhances several utility functions of adehabitatHS (Calenge, 2006), adehabitatHR and adehabitatLT, and provides core functions to prepare, fit and evaluate SSFs while relying on adehabitatLT classes to handle trajectories. SSFs essentially investigate habitat selection along the trajectory, by comparing habitat features at observed step locations with those at alternative random steps taken from the same starting point (Thurfjell, Ciuti & Boyce, 2014).
-
•
amt contains functions and wrappers to streamline the process of fitting SSFs from pairs of coordinates defining locations, to the conditional logistic regression model. It also allows fitting of integrated step selection functions (iSSFs), in which both movement behavior and resource selection are modeled, and the role of environmental variables on each of these processes is investigated (Avgar et al., 2016).
-
•
In ctmcmove, the role of habitat features is investigated through a generalized linear model framework, for which these features are rasterized, and the animal track is first imputed via functional movement modeling and then discretized in a gridded space (more details in Hanks, Hooten & Alldredge (2015)).
Non-conventional approaches for space use
Other non-conventional approaches for investigating space use from tracking data can be found in moveNT (2017, GitHub, active) (Bastille-Rousseau, 2019b), recurse (2017, CRAN, active) (Bracis, Bildstein & Mueller, 2018), rsMove, feedr and VTrack.
-
•
moveNT tackles space use analysis via network graph theory (Bastille-Rousseau et al., 2018). The procedure could be summarized as follows: 1) tracking data is represented over a gridded map and the number of transitions between pixels are counted; 2) the adjacency matrix, i.e. the counts of transitions, are then used to compute some network metrics at the pixel level; 3) a Gaussian mixture model is fitted to one of the metrics (user choice) to cluster values in two groups potentially representing patches and interpatch movement.
-
•
rsMove implements a procedure to identify feeding sites from tracking data as a function of environmental variables (remote sensing data). It uses a random forest classification model from the caret package (Kuhn, 2018); however, there is no information about how to fix the parameters of the model, so users should go through the documentation of caret to understand and calibrate the model. An application of the method can be found in Remelgado et al. (2017), but the parametrization is not described in the manuscript.
-
•
recurse aims at computing number of revisitations to pre-defined areas and their duration. These areas can be defined by the user by entering their center of gravity (by default, the fixes in the track) and a radius. The vignette gives important criteria to use the functions and interpret the results, though there are no citations of scientific publications. feedr and VTrack, for radio and acoustic telemetry data, respectively, provide statistics on animal visits to given logger stations/receivers.
Trajectory simulation
Simulating trajectories can be useful to test hypotheses concerning movement, by comparing the patterns of simulated movement from several alternative theoretical models, or the patterns in the simulated movement to those of real observed tracks. In addition, simulation allows the quantification of estimator uncertainty by parametric bootstrapping (e.g. Michelot et al. (2016)). As with other types of data analysis, simulations highly depend on the model used by the researcher. The tracking packages implement trajectory simulation mainly based on Hidden Markov models, correlated random walks, Brownian motions, Lévy walks or Ornstein-Uhlenbeck processes.
Packages that allow simulation of trajectories from movement models fitted to tracking data (i.e. parameters are estimated by the models) are moveHMM, momentuHMM (HMMs), bsam (DCRWs), crawl (CTCRWs), argosTrack (discrete and continuous CRWs, and OU processes) and ctmm (several continuous time movement models). These packages have been described in previous sections, and the simulations are presented as additional features after model fitting in their documentation. Another package for model fitting and simulation is smam (2013, CRAN, inactive) (Pozdnyakov et al., 2018, 2014, 2017; Yan et al., 2014; Yan, Pozdnyakov & Hu, 2018). It can fit and simulate two types of movement models: Brownian motions with measurement error (Pozdnyakov et al., 2014) and moving-resting processes with Brownian motion for the moving stage (Yan et al., 2014).
Other packages implement simulation functions when there is no previous model fitting to tracking data (i.e. movement parameters are known or simulations concern hypothetical mobile organisms). adehabitatLT proposes trajectory simulation using Brownian motion-based models, Lévy walks, CRWs and bivariate OU motion. trajr allows for CRWs, directed random walks (direction is equal to a constant plus a small noise), Brownian motion and Lévy walks. moveNT enables simulation of movement within and between patches. Movement within patches can follow an OU process (wrapping functions from adehabitatLT) or a two-states movement model (wrapping functions from moveHMM). Movement between patches is simulated via a Brownian bridge movement model (from adehabitatLT).
SiMRiv (2016, CRAN, active) (Quaglietta & Porto, 2018) is another package created for simulation and it can take into account environmental constraints. It allows simulating random walks, correlated random walks, multi-state movement and constraining the area by an environmental resistance variable—defined by the user—that conditions the direction of the movement. The available documentation gives a detailed explanation of the simulation process.
Other analyses of tracking data
Interactions
Interactions between individuals can be assessed using metrics from wildlifeDI (2014, CRAN, active) (Long, 2014), which quantifies the dynamic interaction between two tracks of distinct individuals through several metrics (see Long et al. (2014) for details). The package relies on ‘ltraj’ objects (adehabitatLT data class for trajectories). Other packages that include functions investigating interaction are TrajDataMining and movementAnalysis: TrajDataMining can identify potential partners based on distance and time thresholds fixed by the user and movementAnalysis computes the expected duration of encounters at each location for every pair of IDs, based on a Brownian Bridge movement model fitted to the tracking data.
Movement similarity
SimilarityMeasures (2015, CRAN, inactive) (Toohey, 2015) assesses similarity between trajectories using metrics such as the longest common subsequence (LCSS), Fréchet distance, edit distance and dynamic time warping (DTW). Magdy et al. (2015) provides a brief review on trajectory similarity measures. trajectories also computes the Fréchet distance for two trajectories.
Population size
caribou (2011, CRAN, inactive) (Crepeau et al., 2012) was specifically created to estimate population size from Caribou tracking data, but can also be used for wildlife populations with similar home-range behavior. The methods implemented here are described in Rivest, Couturier & Crépeau (1998). The user needs to specify parameters concerning the size of each detected group, the number of collars in each of these groups and the detection model to use.
Inferring environmental conditions
Using tracking data to infer an environmental variable is the objective of moveWindSpeed (2016, CRAN, active) (Kranstauber & Weinzierl, 2019). It uses avian tracking data to estimate wind speed via a maximum likelihood approach (Weinzierl et al., 2016). The estimation is only performed for segments where the bird is circling in a thermal, so a function in the package identifies those segments. Speed is modeled as a mean with an autocorrelated drift.
Database management
Finally, rpostgisLT (2016, CRAN, active) (Dukai, Basille & Bucklin, 2016) handles database management for trajectory data by integrating R and the ‘PostgreSQL/PostGIS’ database system. The package relies on adehabitatLT, and allows users to seamlessly transfer ‘ltraj’ objects from R to the database, and vice-versa, using the corresponding ‘pgtraj’ data structure in the database.
Analysis of biologging but not tracking data
Time-depth recorders (TDRs) collect data on depth, velocity and other parameters as animals move through the water. These biologging data by themselves do not allow obtaining tracking data and thus comparable analyses to the ones presented above, however we briefly describe the R packages that could be used to analyze TDR and accelerometer data. diveMove (Luque, 2007) and rbl, the latter also for accelerometer data, are the two packages implementing TDR data analysis. diveMove contains functions to identify wet and dry periods in the series, calibrate depth and speed sensor readings, identify individual dives and their phases, summarize statistics per dive and plot the data. With rbl, accelerometry data are used for identifying prey catch attempts (Viviant et al., 2010) and swimming effort from frequency and magnitude of tail movement (Bras et al., 2016). Other functions allow the extraction of summary statistics from dives (e.g. maximum depth), fitting broken stick models (i.e. piecewise linear regression) to dive series and identifying dive phases.
Accelerometry data are also used in human studies, primarily to assess levels of physical activity. Six R packages focus on the analysis of human accelerometry data, mainly to describe periodicity and levels of activity. accelerometry (Van Domelen, 2018), GGIR (van Hees et al., 2014, 2015, 2019) and PhysicalActivity (Choi et al., 2018) identify wear and non-wear time of the accelerometers. nparACT computes descriptive statistics such as interdaily stability, intradaily variability and relative amplitude of activity (Blume, Santhi & Schabus, 2016). acc (Song & Cox, 2016), GGIR and pawacc (Geraci et al., 2012; Geraci, 2017) classify wear data into different levels of activity (e.g. sedentary, moderate and vigorous) using thresholds given by the user, and offer some functions for visual representation of the data and descriptive statistics on the types of activities. Additionally, acc allows for activity simulation via Hidden Markov modeling.
Packages documentation
Documentation in the form of manuals, vignettes (long-form documentation), tutorials or published articles is key to guide the use of a package’s features, especially if the package contains a large number of functions and tools. Without proper user testing and peer editing, package documentation can lead to large gaps of understanding and limited usefulness of the package. If functions and workflows are not explicitly defined, a package’s capacity to help users is undermined. Vignettes can act as road maps for the user, and published articles pertaining to the package help provide context and guidance on the internal workings of functions. Moreover, since packages make specific methods available for R users, the documentation should not only explain how to use the packages but also describe or provide references for the methods.
To assess package documentation, an online survey was conducted between August and October 2018. The survey got Institutional Review Board exemption (IRB201802319). Questions in the survey regarded helpfulness of package documentation and the frequency of package use; it was completed by 225 people. The exact formulation of each question in the survey, detailed results and a discussion on the representativity of the survey are accessible in https://doi.org/10.5281/zenodo.3483853.
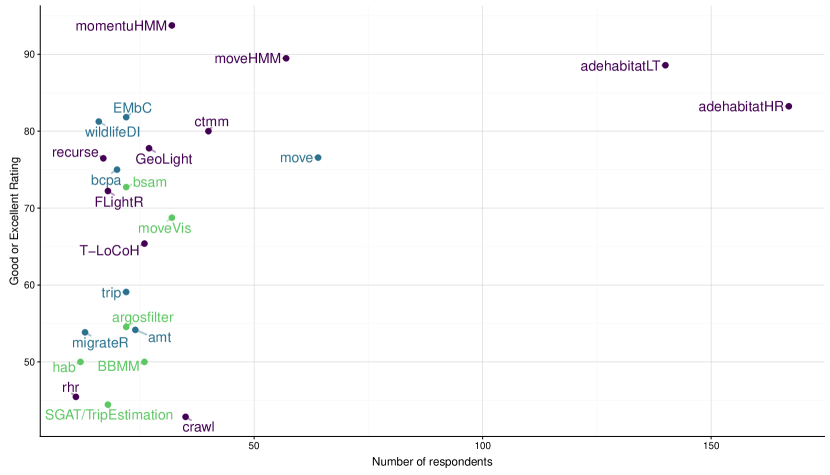
Among 26 packages with at least 10 respondents, we identified 10 packages as having ‘adequate documentation’, meaning that more than of the respondents expressed that the documentation was either good (allowing the user to do everything they wanted and needed to do with the package) or excellent (allowing users to do even more than what they initially planned because of the excellent quality of the information). These are: momentuHMM (), moveHMM (), adehabitatLT (), adehabitatHR (), EMbC (), wildlifeDI (), ctmm (), GeoLight (), move () and recurse () (see Fig. ). From this group of packages, move offers manuals and vignettes, while all the others offer in addition scientific articles centered on the package.
The results of this survey should be used by package developers as guidance to decide on whether to improve the documentation of their packages so more researchers can use them.
Links between the packages
We analyzed the links between tracking packages. If a package needs functions that have already been created by another package, the developer(s) can use those functions by declaring this dependency in the description file of the package under ‘Depends on’, ‘Imports’ or ‘Linking to’ categories. Theoretically there are some differences between the three, but in practice developers mix those groups, so we consider them as part of the same concept: dependency. A package can also suggest using other packages; for instance, a package focused on data analysis can recommend, in the case data have to be cleaned first, the use of a package that allows post-processing.
Developers usually define their own data classes for their packages. A data class allows them to pre-define the minimum requirements that data should have (e.g. dimensions, variables) and guarantee that the functions in the package will work if the data are in the pre-defined format. Similarly, if a package uses functions from other packages or the developer wants to facilitate the use of other packages along with their own, the latter should also provide coercion methods, i.e. functions that allow compatibility with data classes from these other packages.
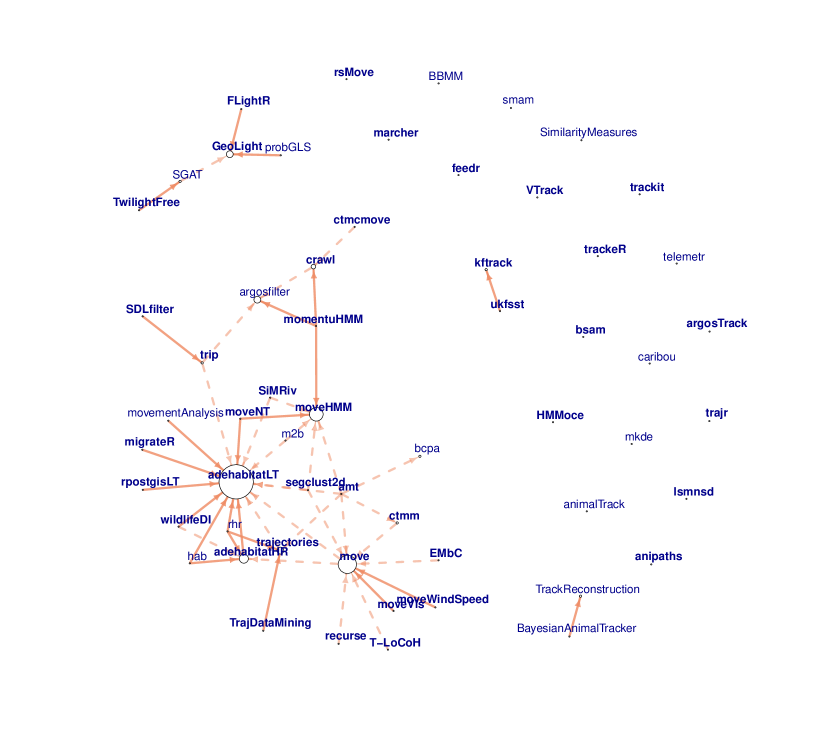
The dependency and suggestion information (collected in August 2018) was used for a graph analysis of package links (Fig. ). Thirty-nine packages in total showed some level of connections among them ( in the form of one large group and three other small groups), while () of the packages worked in isolation. adehabitatLT and move were the most suggested/depended-on packages with 14 and 8 links to them, respectively (8 and 2, respectively, were dependencies). Indeed, many packages use functions compatible with the ‘ltraj’ data class from adehabitatLT, and some others with the ‘move’ class from move. amt suggests more packages than any other (6), and it provides coercion methods for data classes from the packages it suggests.
Discussion
As the quantity and diversity of biologging data increases, so does the need for suitable statistical techniques and software resources. These tools are essential to convert collected data into ecologically meaningful measures and analyze outputs to test hypotheses. Through a systematic search we identified 58 R packages aimed at processing or analyzing tracking data. The packages offer tools for data processing, visualization, computation of statistics for track description, path reconstruction, behavioral pattern identification, space use characterization and trajectory simulation, among others. All the stages of the movement ecology workflow are covered by the reviewed packages. In some cases, there is even function overlapping, with more than one package implementing the same type of analysis with the same or very similar approaches (e.g. animalTrack and TrackReconstruction for DR, BBMM, MovementAnalysis and mkde for Brownian bridge movement models). A type of analysis that was poorly covered was collective motion: mainly wildlifeDI and, to a lesser degree, TrajDataMining and movementAnalysis allow computing descriptive metrics on encounters between individuals, periods of proximity or other metrics of interaction. The lack of R functions to analyze collective movement beyond descriptive statistics is most likely a reflection of the early stages of this field regarding the use of tracking data; collective behavior has mostly relied on controlled laboratory-based studies and theoretical models (Westley et al., 2018). Overall, the review highlighted the abundance of analytical tools available, but also identified a need to improve visibility and accessibility (i.e. documentation) to existing packages more than developing new packages.
Integration over proliferation
Transparency in science is facilitated by the sharing of data and analytical tools, including code. This has resulted in a general tendency in the scientific community to convert functions into publicly available packages. In movement ecology, this has translated into a proliferation of R packages dealing with tracking data, many of them, isolated from all other packages (Fig. ) despite having similar goals and methods. While a large number of packages reflects that the field is active and that codes for several types of analyses are available for the community, such independent proliferation of packages makes it hard to maintain an overview of their functionality and availability. Here we presented a list of 58 packages but the number is expected to keep increasing steadily, associated with an increased possibility of unnecessary redundancy and disconnection between the packages. Due to the already overwhelming number of tracking packages, we suggest developers only create new packages in the future when they represent a new and complementary contribution to the scientific and programming community.
While package necessity is not assessed through any repository, there is a peer-review process available for packages through rOpenSci, a non-profit initiative founded in 2011 with the goal of making scientific data more retrievable and reproducible (http://ropensci.org). Packages submitted to rOpenSci are reviewed by two independent reviewers for readability, usability, usefulness and redundancy. The rOpenSci community checks that developers adhere to coding ‘best practices’ such as unit testing (i.e. testing if individual units of code work correctly), continuous integration (i.e. all changes made by developers are immediately tested and reported when added to the mainline code base), minimizing code duplication, and strong documentation. This open review process improves packages as it helps developers strengthen their package and coding, while gaining additional technical support from rOpenSci’s volunteer staff. In addition, a couple of journals have partnered with rOpenSci: the Journal of Open Source Software (JOSS, http://joss.theoj.org) and Methods in Ecology and Evolution (MEE, methodsinecologyandevolution.org). JOSS is an open access journal for research software packages that adheres to similar standards as rOpenSci, and, if the submitted package have already been accepted to rOpenSci, they can be submitted for fast-track publication at JOSS, in which JOSS editors may evaluate based on rOpenSci’s reviews alone. MEE can publish articles on new R packages and gives authors the option of a joint rOpenSci-MEE review in which the package is reviewed by rOpenSci, followed by fast-tracked review of the manuscript by MEE. The R Journal (https://journal.r-project.org/) and, for packages concerning statistical analysis, the Journal of Statistical Software (https://www.jstatsoft.org/), are other choices of journal, that adhere to similar standards as rOpenSci.
Recommendations
This work is not intended to tell ecologists exactly which packages to use, but to provide them an exhaustive catalog of tracking packages, a description of their functions and show the similarities and differences between them. We suggest researchers use packages with good documentation, that are actively maintained and that have a large number of users. Good documentation facilitates the initial use of a package. A regularly maintained package means that there is a person or team behind it, and that, when an error arises in the package, it will likely be fixed rapidly and a new version will be available. A package that has a large number of users means greater opportunity to 1) identify bugs in the package, calling the attention of the maintainer for a rapid fix, and thus improving functionality, and to 2) obtain additional guidance on package use from other users. Regarding the methods available in the packages, while we previously stated the importance of describing them and citing references, it is the responsibility of the researchers to select and apply a method if they correctly understand it, and not only because it is available in a package. Also, with a critical use of packages, researchers should feel encouraged to report bugs when they see them, to contribute to their improvement.
When developers are working on new packages, we recommend they submit to rOpenSci and consider the following criteria:
-
•
Contribution: Does your package fill a gap or need? Does a function within the package perform a novel task that does not already exist in another published package? Can those functions be instead added to an existing package? Developers should contemplate the possibility (and appropriateness) of contacting authors of existing and actively maintained packages to incorporate new functions. We also suggest the authors of existing packages to be open to integration of new functions (and new collaborators) within their package.
-
•
Data class coercion: Does the package handle commonly used data classes (e.g. spatial classes from sp or ‘ltraj’ from adehabitatLT), so that it is compatible with the use of other packages? Since tracking packages deal with spatial data, most of them use georeferenced data classes. sp data classes (Pebesma & Bivand, 2005; Bivand, Pebesma & Gomez-Rubio, 2013) are the most popular spatial data classes ( out of the packages use them). The recent sf package (Pebesma, 2018) aims at providing a simpler and standard implementation of geographic objects in R; handling sf objects is as easy as handling non-spatial objects in R, and computationally more efficient than using sp. Only one package (crawl) was compatible with sf at the time our research was done. Because of its functionalities, we encourage developers to provide coercion methods to sf. Regarding data classes for trajectories, ltraj (from adehabitatLT) is one of the oldest and most used data classes, but others exist (e.g. trip from trip or Track from trajectories). Ideally, the community of tracking-package developers should unite to discuss the best data class for a trajectory, and once a consensus is reached, provide coercion methods to that class.
-
•
Documentation: Is the documentation clear, exhaustive on the functions, with methods description or references available? The latter is even more important if the package implements a new method of analysis. Worked examples and vignettes can enable researchers to navigate through the package and learn what it does more easily, minimizing the need for additional support.
-
•
Maintenance: Who will maintain the package over time? Specific people are required to maintain the continuity of packages. Typically, lab PIs or members of a working group/collaboration could take this role in view of the long term commitment. On CRAN, non-maintained packages are considered ‘orphaned’ if they are not actively maintained and ‘archived’ if they do not pass ‘R CMD check’ anymore (https://cran.r-project.org/src/contrib/Orphaned/README).
Conclusions
This review has served as a road map of the tools implemented by the packages for data analysis in movement ecology. In recent years, programmers have responded to the need for advanced statistical tools to analyze movement data by developing at least 58 R tracking packages. However, we emphasize that increased accessibility and understanding of existing packages (in which documentation plays a fundamental role), and more integration for package development will help the advancement of research in this field, allowing researchers to continue to address novel and exciting questions.
Acknowledgments
The authors (RJ, TAC, SCP, SCT and MB) were funded by a Human Frontier Science Program Young Investigator Grant (SeabirdSound - RGY0072/2017). We are grateful to Guillaume Bastille-Rousseau, Clément Calenge, Christen H. Fleming, Devin Johnson, Bart Kranstauber, Simeon Lisovski, Brett McClintock, Benjamin Merkel, Théo Michelot, Anders Nielsen, Eldar Rakhimberdiev, Henry Scharf, Jakob Schwalb-Willmann, Takashiro Shimada, Derek Spitz, and Michael Sumner for enlightening discussions and additional information about their packages. Special thanks to Simon Benhamou for discussions about accelerometers, magnetometers and gyroscopes, and reviewing the corresponding sections of the manuscript. During review, constructive comments and suggestions of Johannes Signer and Luca Borger (associated editor) have significantly contributed to the quality of this work. We also thank the anonymous survey participants and everyone who suggested packages for this review.
Data accessibility
The data collected on all the packages and used for the review and the anonymous data from the survey, as well as R codes and additional files to reproduce Figures 2–4 are available on Zenodo https://doi.org/10.5281/zenodo.3483853.
Authors’ contributions
RJ conceived the ideas of the review and reviewed the R packages. RJ and MB worked on the workflow for the manuscript. RJ and MEB gathered the information on the packages. RJ led the survey and analyzed the results; MEB and MB implemented it in an online platform. RJ, MEB and MB worked in the Zenodo repository. RJ led the writing of the manuscript. All authors contributed critically to the drafts and reponses to the reviewers, and gave final approval for publication.
References
- Afanasyev (2004) Afanasyev, V. (2004) A miniature daylight level and activity data recorder for tracking animals over long periods. Memoirs of National Institute of Polar Research, Special Issue, 58, 227–233.
- Albertsen (2018) Albertsen, C.M. (2018) argosTrack: Fit Movement Models to Argos Data for Marine Animals. R package version 1.2.2-1.
- Albertsen et al. (2015) Albertsen, C.M., Whoriskey, K., Yurkowski, D., Nielsen, A. & Flemming, J.M. (2015) Fast fitting of non-Gaussian state-space models to animal movement data via Template Model Builder. Ecology, 96, 2598–2604. ISSN 0012-9658.
- Avgar et al. (2016) Avgar, T., Potts, J.R., Lewis, M.A. & Boyce, M.S. (2016) Integrated step selection analysis: bridging the gap between resource selection and animal movement. Methods in Ecology and Evolution, 7, 619–630. ISSN 2041-210X.
-
Basille (2015)
Basille, M. (2015) hab: Habitat and movement functions.
R package version 1.20.4.
URL http://ase-research.org/basille/hab - Bastille-Rousseau (2019a) Bastille-Rousseau, G. (2019a) lsmnsd: Classify movement strategies using a latent-state model and NSD. R package version 0.0.0.9000.
- Bastille-Rousseau (2019b) Bastille-Rousseau, G. (2019b) moveNT: An R package for the analysis of movement data using network theory. R package version 0.0.0.9000.
- Bastille-Rousseau et al. (2018) Bastille-Rousseau, G., Douglas-Hamilton, I., Blake, S., Northrup, J.M. & Wittemyer, G. (2018) Applying network theory to animal movements to identify properties of landscape space use. Ecological Applications, 28, 854–864. ISSN 1939-5582.
- Bastille-Rousseau et al. (2016) Bastille-Rousseau, G., Potts, J.R., Yackulic, C.B., Frair, J.L., Ellington, E.H. & Blake, S. (2016) Flexible characterization of animal movement pattern using net squared displacement and a latent state model. Movement Ecology, 4, 15. ISSN 2051-3933.
-
Battaile (2014)
Battaile, B. (2014) TrackReconstruction: Reconstruct animal tracks from
magnetometer, accelerometer, depth and optional speed data.
R package version 1.1.
URL https://CRAN.R-project.org/package=TrackReconstruction - Benhamou (2011) Benhamou, S. (2011) Dynamic Approach to Space and Habitat Use Based on Biased Random Bridges. PLOS ONE, 6, e14592. ISSN 1932-6203.
-
Benhamou (2018)
Benhamou, S. (2018) Mean squared displacement and sinuosity of
three-dimensional random search movements.
arXiv:1801.02435 [q-bio].
ArXiv: 1801.02435.
URL http://arxiv.org/abs/1801.02435 - Benhamou & Cornélis (2010) Benhamou, S. & Cornélis, D. (2010) Incorporating movement behavior and barriers to improve kernel home range space use estimates. Journal of Wildlife Management, 74, 1353–1360. ISSN 0022-541X.
- Bidder et al. (2015) Bidder, O.R., Walker, J.S., Jones, M.W., Holton, M.D., Urge, P., Scantlebury, D.M., Marks, N.J., Magowan, E.A., Maguire, I.E. & Wilson, R.P. (2015) Step by step: Reconstruction of terrestrial animal movement paths by dead-reckoning. Movement Ecology, 3, 1–16. ISSN 20513933.
- Bidder et al. (2012) Bidder, O.R., Soresina, M., Shepard, E.L.C., Halsey, L.G., Quintana, F., Gómez-Laich, A. & Wilson, R.P. (2012) The need for speed: testing acceleration for estimating animal travel rates in terrestrial dead-reckoning systems. Zoology, 115, 58–64. ISSN 0944-2006.
- Bindoff & Wotherspoon (2019) Bindoff, A. & Wotherspoon, S. (2019) TwilightFree: Reconstruct animal tracks from GLS tag data. R package version 0.1.1.
- Bindoff et al. (2017) Bindoff, A.D., Wotherspoon, S.J., Guinet, C., Hindell, M.A. & Orme, D. (2017) Twilight-free geolocation from noisy light data. Methods in Ecology and Evolution, 9, 1190–1198. ISSN 2041-210X.
-
Bivand, Pebesma & Gomez-Rubio (2013)
Bivand, R.S., Pebesma, E. & Gomez-Rubio, V. (2013) Applied spatial data
analysis with R, Second edition.
Springer, NY.
URL http://www.asdar-book.org/ - Blume, Santhi & Schabus (2016) Blume, C., Santhi, N. & Schabus, M. (2016) ‘nparACT’ package for R: A free software tool for the non-parametric analysis of actigraphy data. MethodsX, 3, 430–435. ISSN 2215-0161.
- Bowditch (1995) Bowditch, N. (1995) The new American practical navigator. Bethesda, MD: Defense Mapping Agency Hydrographic Topographic Center.
-
Bracis, Bildstein & Mueller (2018)
Bracis, C., Bildstein, K.L. & Mueller, T. (2018) Revisitation analysis
uncovers spatio-temporal patterns in animal movement data.
Ecography, 41, 1801–1811.
URL http://dx.doi.org/10.1111/ecog.03618 - Bras et al. (2016) Bras, Y.L., Jouma’a, J., Picard, B. & Guinet, C. (2016) How Elephant Seals (Mirounga leonina) Adjust Their Fine Scale Horizontal Movement and Diving Behaviour in Relation to Prey Encounter Rate. PLOS ONE, 11, e0167226. ISSN 1932-6203.
- Braun et al. (2017) Braun, C.D., Galuardi, B., Thorrold, S.R. & Parrini, F. (2017) HMMoce: An R package for improved geolocation of archival-tagged fishes using a hidden Markov method. Methods in Ecology and Evolution, 9, 1212–1220. ISSN 2041-210X.
- Buderman et al. (2016) Buderman, F.E., Hooten, M.B., Ivan, J.S. & Shenk, T.M. (2016) A functional model for characterizing long-distance movement behaviour. Methods in Ecology and Evolution, 7, 264–273. ISSN 2041210X.
- Bullard (1991) Bullard, F. (1991) Estimating the home range of an animal: a Brownian bridge approach. University of North Carolina Chapel Hill.
- Cagnacci et al. (2010) Cagnacci, F., Boitani, L., Powell, R.A. & Boyce, M.S. (2010) Animal ecology meets GPS-based radiotelemetry: a perfect storm of opportunities and challenges. Philosophical Transactions of the Royal Society of London B: Biological Sciences, 365, 2157–2162. ISSN 0962-8436, 1471-2970.
- Calenge (2006) Calenge, C. (2006) The package adehabitat for the R software: tool for the analysis of space and habitat use by animals. Ecological Modelling, 197, 1035.
- Campbell et al. (2012) Campbell, H.A., Watts, M.E., Dwyer, R.G. & Franklin, C.E. (2012) V-Track: software for analysing and visualising animal movement from acoustic telemetry detections. Marine and Freshwater Research, 63, 1635.
-
Choi et al. (2018)
Choi, L., Beck, C., Liu, Z., Matthews, C.E. & Buchowski, M.S. (2018)
PhysicalActivity: Process Accelerometer Data for Physical Activity
Measurement.
R package version 0.2-2.
URL https://CRAN.R-project.org/package=PhysicalActivity - Clobert et al. (2001) Clobert, J., Danchin, E., Dhondt, A.A. & Nichols, J.D. (2001) Dispersal. Oxford University Press.
- Costa et al. (2010) Costa, D.P., Robinson, P.W., Arnould, J.P.Y., Harrison, A.L., Simmons, S.E., Hassrick, J.L., Hoskins, A.J., Kirkman, S.P., Oosthuizen, H., Villegas-Amtmann, S. & Crocker, D.E. (2010) Accuracy of ARGOS Locations of Pinnipeds at-Sea Estimated Using Fastloc GPS. PLOS ONE, 5, e8677. ISSN 1932-6203.
-
Crepeau et al. (2012)
Crepeau, H., Rivest, L.P., Couturier, S. & Baillargeon, S. (2012)
caribou: Estimation of caribou abundance based on large scale
aggregations monitored by radio telemetry.
R package version 1.1.
URL https://CRAN.R-project.org/package=caribou - DeCelles & Zemeckis (2014) DeCelles, G. & Zemeckis, D. (2014) Chapter Seventeen - Acoustic and Radio Telemetry. Stock Identification Methods (Second Edition) (eds. S.X. Cadrin, L.A. Kerr & S. Mariani), pp. 397–428. Academic Press. ISBN 978-0-12-397003-9.
- Dingle (1996) Dingle, H. (1996) Migration: The Biology of Life on the Move. Oxford University Press, 1st edn., USA. ISBN 978-0-19-964039-3.
- Downs & Horner (2009) Downs, J.A. & Horner, M.W. (2009) A characteristic-hull based method for home range estimation. Transactions in GIS, 13, 527–537.
-
Dubroca & Thiebault (2017)
Dubroca, L. & Thiebault, A. (2017) m2b: Movement to Behaviour Inference
using Random Forest.
R package version 1.0.
URL https://CRAN.R-project.org/package=m2b -
Dukai, Basille & Bucklin (2016)
Dukai, B., Basille, M. & Bucklin, D. (2016) rpostgisLT: Managing Animal
Movement Data with ’PostGIS’ and R.
URL https://CRAN.R-project.org/package=rpostgisLT - Ekstrom (2004) Ekstrom, P.A. (2004) An advance in geolocation by light. Memoirs of National Institute of Polar Research. Special issue, 58, 210–226. ISSN 03860744.
-
Farrell & Fuiman (2013)
Farrell, E. & Fuiman, L. (2013) animalTrack: Animal track reconstruction
for high frequency 2-dimensional (2D) or 3-dimensional (3D) movement data.
R package version 1.0.0.
URL https://CRAN.R-project.org/package=animalTrack - Fleming et al. (2015) Fleming, C., Fagan, W., Mueller, T., Olson, K., Leimgruber, P. & Calabrese, J. (2015) Rigorous home range estimation with movement data: a new autocorrelated kernel density estimator. Ecology, 96, 1182–1188.
- Fleming et al. (2014) Fleming, C.H., Calabrese, J.M., Mueller, T., Olson, K.A., Leimgruber, P. & Fagan, W.F. (2014) From Fine-Scale Foraging to Home Ranges: A Semivariance Approach to Identifying Movement Modes across Spatiotemporal Scales. The American Naturalist, 183, E154–E167. ISSN 0003-0147.
-
Fleming & Calabrese (2019)
Fleming, C.H. & Calabrese, J.M. (2019) ctmm: Continuous-Time Movement
Modeling.
R package version 0.5.4.
URL https://CRAN.R-project.org/package=ctmm - Fortin et al. (2005) Fortin, D., Beyer, H.L., Boyce, M.S., Smith, D.W., Duchesne, T. & Mao, J.S. (2005) Wolves influence elk movements: behavior shapes a trophic cascade in Yellowstone National Park. Ecology, 86, 1320–1330.
-
Freitas (2012)
Freitas, C. (2012) argosfilter: Argos locations filter.
R package version 0.63.
URL https://CRAN.R-project.org/package=argosfilter - Freitas et al. (2007) Freitas, C., Lydersen, C., Fedak, M.A. & Kovacs, K.M. (2007) A simple new algorithm to filter marine mammal Argos locations. Marine Mammal Science, 24, 315–325. ISSN 0824-0469.
- Frick & Kosmidis (2017) Frick, H. & Kosmidis, I. (2017) trackeR: Infrastructure for Running and Cycling Data from GPS-Enabled Tracking Devices in R. Journal of Statistical Software, 82, 1–29.
- Garriga et al. (2016) Garriga, J., Palmer, J.R.B., Oltra, A. & Bartumeus, F. (2016) Expectation-Maximization Binary Clustering for Behavioural Annotation. PLOS ONE, 11, e0151984. ISSN 1932-6203.
-
Garriga et al. (2018)
Garriga, J., Palmer, J.R., Oltra, A. & Bartumeus, F. (2018) EMbC:
Expectation-Maximization Binary Clustering.
R package version 2.0.1.
URL https://CRAN.R-project.org/package=EMbC -
Geraci (2017)
Geraci, M. (2017) pawacc: Physical activity with accelerometers.
R package version 1.2.2.
URL https://CRAN.R-project.org/package=pawacc -
Geraci et al. (2012)
Geraci, M., Rich, C., Sera, F., Cortina-Borja, M., Griffiths, L.J. & Dezateux,
C. (2012) Technical report on accelerometry data processing in the
Millennium Cohort Study.
, University College London, London, UK.
URL http://discovery.ucl.ac.uk/1361699 - Getz et al. (2007) Getz, W.M., Fortmann-Roe, S., Cross, P.C., Lyons, A.J., Ryan, S.J. & Wilmers, C.C. (2007) LoCoH: nonparameteric kernel methods for constructing home ranges and utilization distributions. PloS one, 2, e207.
-
Gurarie (2014)
Gurarie, E. (2014) bcpa: Behavioral change point analysis of animal
movement.
R package version 1.1.
URL https://CRAN.R-project.org/package=bcpa - Gurarie, Andrews & Laidre (2009) Gurarie, E., Andrews, R.D. & Laidre, K.L. (2009) A novel method for identifying behavioural changes in animal movement data. Ecology letters, 12, 395–408. ISSN 1461-0248.
- Gurarie et al. (2017) Gurarie, E., Cagnacci, F., Peters, W., Fleming, C.H., Calabrese, J.M., Mueller, T. & Fagan, W.F. (2017) A framework for modelling range shifts and migrations: asking when, whither, whether and will it return. Journal of Animal Ecology, 86, 943–959. ISSN 1365-2656.
-
Gurarie & Cheraghi (2017)
Gurarie, E. & Cheraghi, F. (2017) marcher: Migration and Range Change
Estimation in R.
R package version 0.0-2.
URL https://CRAN.R-project.org/package=marcher - Guéguen (2001) Guéguen, L. (2001) Segmentation by Maximal Predictive Partitioning According to Composition Biases. Computational Biology (eds. O. Gascuel & M.F. Sagot), Lecture Notes in Computer Science, pp. 32–44. Springer Berlin Heidelberg. ISBN 978-3-540-45727-5.
- Halsey et al. (2009) Halsey, L.G., Green, J.A., Wilson, R.P. & Frappell, P.B. (2009) Accelerometry to Estimate Energy Expenditure during Activity: Best Practice with Data Loggers. Physiological and Biochemical Zoology, 82, 396–404. ISSN 1522-2152.
-
Hanks (2018)
Hanks, E. (2018) ctmcmove: Modeling Animal Movement with Continuous-Time
Discrete-Space Markov Chains.
R package version 1.2.9.
URL https://CRAN.R-project.org/package=ctmcmove - Hanks, Hooten & Alldredge (2015) Hanks, E.M., Hooten, M.B. & Alldredge, M.W. (2015) Continuous-time discrete-space models for animal movement. Annals of Applied Statistics, 9, 145–165. ISSN 19417330.
- Horne et al. (2007) Horne, J.S., Garton, E.O., Krone, S.M. & Lewis, J.S. (2007) Analyzing animal movements using Brownian bridges. Ecology, 88, 2354–2363.
- Hussey et al. (2015) Hussey, N.E., Kessel, S.T., Aarestrup, K., Cooke, S.J., Cowley, P.D., Fisk, A.T., Harcourt, R.G., Holland, K.N., Iverson, S.J., Kocik, J.F., Flemming, J.E.M. & Whoriskey, F.G. (2015) Aquatic animal telemetry: A panoramic window into the underwater world. Science, 348, 1255642. ISSN 0036-8075, 1095-9203.
-
Johnson & London (2018)
Johnson, D.S. & London, J.M. (2018) crawl: an R package for fitting
continuous-cime correlated random walk models to animal movement data.
URL https://doi.org/10.5281/zenodo.596464 - Johnson et al. (2008) Johnson, D.S., London, J.M., Lea, M.A. & Durban, J.W. (2008) Continuous-Time Correlated Random Walk Model for Animal Telemetry Data. Ecology, 89, 1208–1215. ISSN 0012-9658.
- Jonsen (2016) Jonsen, I. (2016) Joint estimation over multiple individuals improves behavioural state inference from animal movement data. Scientific reports, 6, 20625–20625. ISSN 2045-2322.
- Jonsen, Flemming & Myers (2005) Jonsen, I.D., Flemming, J.M. & Myers, R.A. (2005) Robust state-space modeling of animal movement data. Ecology, 86, 2874–2880.
- Jonsen et al. (2013) Jonsen, I., Basson, M., Bestley, S., Bravington, M., Patterson, T., Pedersen, M., Thomson, R., Thygesen, U. & Wotherspoon, S. (2013) State-space models for bio-loggers: A methodological road map. Deep Sea Research Part II: Topical Studies in Oceanography, 88-89, 34–46. ISSN 09670645.
- Kays et al. (2015) Kays, R., Crofoot, M.C., Jetz, W. & Wikelski, M. (2015) Terrestrial animal tracking as an eye on life and planet. Science, 348, aaa2478. ISSN 0036-8075, 1095-9203.
- Kenward (2000) Kenward, R.E. (2000) A manual for wildlife radio tagging. Academic press
- Kranstauber et al. (2012) Kranstauber, B., Kays, R., Lapoint, S.D., Wikelski, M. & Safi, K. (2012) A dynamic Brownian bridge movement model to estimate utilization distributions for heterogeneous animal movement. Journal of animal ecology, 81, 738–746. ISSN 1365-2656.
-
Kranstauber, Smolla & Scharf (2018)
Kranstauber, B., Smolla, M. & Scharf, A.K. (2018) move: Visualizing and
Analyzing Animal Track Data.
R package version 3.1.0.
URL https://CRAN.R-project.org/package=move -
Kranstauber & Weinzierl (2019)
Kranstauber, B. & Weinzierl, R. (2019) moveWindSpeed: Estimate Wind
Speeds from Bird Trajectories.
R package version 0.2.2.
URL https://CRAN.R-project.org/package=moveWindSpeed -
Kuhn (2018)
Kuhn, M. (2018) caret: Classification and Regression Training.
R package version 6.0-81.
URL https://CRAN.R-project.org/package=caret - Lam, Nielsen & Sibert (2010) Lam, C.H., Nielsen, A. & Sibert, J.R. (2010) Incorporating sea-surface temperature to the light-based geolocation model TrackIt. Marine Ecology Progress Series, 419, 71–84. ISSN 0171-8630, 1616-1599.
- Langrock et al. (2012) Langrock, R., King, R., Matthiopoulos, J., Thomas, L., Fortin, D. & Morales, J.M. (2012) Flexible and practical modeling of animal telemetry data: hidden Markov models and extensions. Ecology, 93, 2336–2342. ISSN 0012-9658.
- Lavielle (1999) Lavielle, M. (1999) Detection of multiple changes in a sequence of dependent variables. Stochastic Processes and their Applications, 83, 79–102. ISSN 0304-4149.
- Lavielle (2005) Lavielle, M. (2005) Using penalized contrasts for the change-point problem. Signal Processing, 85, 1501–1510. ISSN 0165-1684.
-
LaZerte (2019)
LaZerte, S.E. (2019) feedr: Transforming Raw RFID Data.
R package version 0.10.0.
URL https://github.com/animalnexus/feedr - Liaw & Wiener (2002) Liaw, A. & Wiener, M. (2002) Classification and Regression by randomForest. R News, 2, 18–22.
- Lisovski, Hahn & Hodgson (2012) Lisovski, S., Hahn, S. & Hodgson, D. (2012) GeoLight – processing and analysing light-based geolocator data in R. Methods in Ecology and Evolution, 3, 1055–1059. ISSN 2041-210X.
- Liu et al. (2015) Liu, Y., Battaile, B.C., Trites, A.W. & Zidek, J.V. (2015) Bias correction and uncertainty characterization of Dead-Reckoned paths of marine mammals. Animal Biotelemetry, 3, 51. ISSN 2050-3385.
- Liu et al. (2016) Liu, Y., Zidek, J.V., Trites, A.W. & Battaile, B.C. (2016) Bayesian data fusion approaches to predicting spatial tracks: Application to marine mammals. The Annals of Applied Statistics, 10, 1517–1546. ISSN 1932-6157, 1941-7330.
-
Liu (2014)
Liu, Y.S. (2014) BayesianAnimalTracker: Bayesian Melding of GPS and DR
Path for Animal Tracking.
R package version 1.2.
URL https://CRAN.R-project.org/package=BayesianAnimalTracker -
Long (2014)
Long, J. (2014) wildlifeDI: Calculate Indices of Dynamic Interaction for
Wildlife Telemetry Data.
R package version 0.2.
URL https://CRAN.R-project.org/package=wildlifeDI - Long et al. (2014) Long, J.A., Nelson, T.A., Webb, S.L. & Gee, K.L. (2014) A critical examination of indices of dynamic interaction for wildlife telemetry studies. Journal of animal ecology, 83, 1216–1233. ISSN 1365-2656.
- Lowndes et al. (2017) Lowndes, J.S.S., Best, B.D., Scarborough, C., Afflerbach, J.C., Frazier, M.R., O’Hara, C.C., Jiang, N. & Halpern, B.S. (2017) Our path to better science in less time using open data science tools. Nature Ecology & Evolution, 1, 0160. ISSN 2397-334X.
- Luque (2007) Luque, S.P. (2007) Diving Behaviour Analysis in R. R News, 7, 8–14. ISSN -2022. Contributions from: John P.Y. Arnould, Laurent Dubroca, and Andy Liaw.
- Lyons, Getz & R Development Core Team (2018) Lyons, A., Getz, W. & R Development Core Team (2018) T-LoCoH: Time Local Convex Hull Homerange and Time Use Analysis. R package version 1.40.05.
- Lyons, Turner & Getz (2013) Lyons, A.J., Turner, W.C. & Getz, W.M. (2013) Home range plus: a space-time characterization of movement over real landscapes. Movement Ecology, 1, 2. ISSN 2051-3933.
- Magdy et al. (2015) Magdy, N., Sakr, M.A., Mostafa, T. & El-Bahnasy, K. (2015) Review on trajectory similarity measures. Intelligent Computing and Information Systems (ICICIS), 2015 IEEE Seventh International Conference on, pp. 613–619. IEEE.
- McClintock (2017) McClintock, B.T. (2017) Incorporating Telemetry Error into Hidden Markov Models of Animal Movement Using Multiple Imputation. Journal of Agricultural, Biological and Environmental Statistics, 22, 249–269. ISSN 1085-7117, 1537-2693.
- McClintock et al. (2012) McClintock, B.T., King, R., Len, T., Matthiopoulos, J., McConnell, B.J. & Morales, J.M. (2012) A general discrete-time modeling framework for animal movement using multistate random walks. Ecological Monographs, 82, 335–349. ISSN 0012-9615.
- McClintock & Michelot (2018) McClintock, B.T. & Michelot, T. (2018) momentuHMM: R package for generalized hidden Markov models of animal movement. Methods in Ecology and Evolution, 9, 1518–1530.
- McLean & Volponi (2018) McLean, D.J. & Volponi, M.A.S. (2018) trajr: An R package for characterisation of animal trajectories. Ethology, 124, 440–448.
- Meratnia & de By (2004) Meratnia, N. & de By, R.A. (2004) Spatiotemporal Compression Techniques for Moving Point Objects. Advances in Database Technology - EDBT 2004 (eds. E. Bertino, S. Christodoulakis, D. Plexousakis, V. Christophides, M. Koubarakis, K. Böhm & E. Ferrari), Lecture Notes in Computer Science, pp. 765–782. Springer Berlin Heidelberg. ISBN 978-3-540-24741-8.
-
Merkel (2019)
Merkel, B. (2019) probGLS: probabilistic algorithm for geolocation data.
R package version 0.9.5.
URL https://github.com/benjamin-merkel - Merkel et al. (2016) Merkel, B., Phillips, R.A., Descamps, S., Yoccoz, N.G., Moe, B. & Strøm, H. (2016) A probabilistic algorithm to process geolocation data. Movement Ecology, 4, 26. ISSN 2051-3933.
- Michelot et al. (2016) Michelot, T., Langrock, R., Patterson, T.A. & McInerny, G. (2016) moveHMM: an R package for the statistical modelling of animal movement data using hidden Markov models. Methods in Ecology and Evolution, 7, 1308–1315. ISSN 2041-210X.
- Mohr (1947) Mohr, C.O. (1947) Table of equivalent populations of North American small mammals. The American Midland Naturalist, 37, 223–249.
-
Monteiro (2018)
Monteiro, D. (2018) TrajDataMining: Trajectories Data Mining.
R package version 0.1.6.
URL https://CRAN.R-project.org/package=TrajDataMining - Montenbruck & Pfleger (2013) Montenbruck, O. & Pfleger, T. (2013) Astronomy on the personal computer. Springer, Berlin, Heidelberg.
- Nathan et al. (2008) Nathan, R., Getz, W.M., Revilla, E., Holyoak, M., Kadmon, R., Saltz, D. & Smouse, P.E. (2008) A movement ecology paradigm for unifying organismal movement research. Proceedings of the National Academy of Sciences, 105, 19052–19059. ISSN 0027-8424, 1091-6490.
- Nielsen et al. (2006) Nielsen, A., Bigelow, K.A., Musyl, M.K. & Sibert, J.R. (2006) Improving light-based geolocation by including sea surface temperature. Fisheries Oceanography, 15, 314–325. ISSN 1365-2419.
-
Nielsen et al. (2012a)
Nielsen, A., Sibert, J.R., Ancheta, J., Galuardi, B. & Lam, C.H.
(2012a) trackit: Track tagged individuals from light
measurements.
R package version 0.2-6.
URL https://www.soest.hawaii.edu/tag-data/software/ - Nielsen et al. (2012b) Nielsen, A., Sibert, J.R., Ancheta, J., Galuardi, B. & Lam, C.H. (2012b) ukfsst: Kalman Filter tracking including Sea Surface Temperature. R package version 0.3.
-
Nielson et al. (2013)
Nielson, M., R., Sawyer, H. & McDonald, T.L. (2013) BBMM: Brownian
bridge movement model.
R package version 3.0.
URL https://CRAN.R-project.org/package=BBMM -
Patin et al. (2018)
Patin, R., Etienne, M.P., Lebarbier, E. & Benhamou, S. (2018)
segclust2d: Bivariate Segmentation/Clustering Methods and Tools.
R package version 0.1.0.
URL https://CRAN.R-project.org/package=segclust2d - Patterson et al. (2008) Patterson, T.A., Thomas, L., Wilcox, C., Ovaskainen, O. & Matthiopoulos, J. (2008) State-space models of individual animal movement. Trends in Ecology and Evolution, 23, 87–94.
-
Pebesma (2018)
Pebesma, E. (2018) Simple Features for R: Standardized Support for Spatial
Vector Data.
The R Journal, 10, 439–446.
URL https://journal.r-project.org/archive/2018/RJ-2018-009/index.html -
Pebesma, Klus & Moradi (2018)
Pebesma, E., Klus, B. & Moradi, M. (2018) trajectories: Classes and
Methods for Trajectory Data.
R package version 0.2-1.
URL https://CRAN.R-project.org/package=trajectories -
Pebesma & Bivand (2005)
Pebesma, E.J. & Bivand, R.S. (2005) Classes and methods for spatial data in
R.
R News, 5, 9–13.
URL https://CRAN.R-project.org/doc/Rnews/ - Picard et al. (2007) Picard, F., Robin, S., Lebarbier, E. & Daudin, J.J. (2007) A Segmentation/Clustering Model for the Analysis of Array CGH Data. Biometrics, 63, 758–766. ISSN 1541-0420.
- Pozdnyakov et al. (2018) Pozdnyakov, V., Elbroch, L.M., Hu, C., Meyer, T. & Yan, J. (2018) On estimation for Brownian motion governed by telegraph process with multiple off states. ArXiv e-prints.
- Pozdnyakov et al. (2017) Pozdnyakov, V., Elbroch, L.M., Labarga, A., Meyer, T. & Yan, J. (2017) Discretely observed Brownian motion governed by telegraph process: estimation. Methodology and Computing in Applied Probability, 21, 907–920.
- Pozdnyakov et al. (2014) Pozdnyakov, V., Meyer, T., Wang, Y.B. & Yan, J. (2014) On modeling animal movements using Brownian motion with measurement error. Ecology, 95, 247–253. ISSN 0012-9658.
- Péron et al. (2016) Péron, G., Fleming, C.H., de Paula, R.C. & Calabrese, J.M. (2016) Uncovering periodic patterns of space use in animal tracking data with periodograms, including a new algorithm for the Lomb-Scargle periodogram and improved randomization tests. Movement Ecology, 4, 19. ISSN 2051-3933.
-
Quaglietta & Porto (2018)
Quaglietta, L. & Porto, M. (2018) SiMRiv: Individual-Based,
Spatially-Explicit Simulation and Analysis of Multi-State Movements in River
Networks and Heterogeneous Landscapes.
R package version 1.0.3.
URL https://CRAN.R-project.org/package=SiMRiv -
R Core Team (2018)
R Core Team (2018) R: A Language and Environment for Statistical
Computing.
R Foundation for Statistical Computing, Vienna, Austria.
URL https://www.R-project.org/ -
Rakhimberdiev & Saveliev (2019)
Rakhimberdiev, E. & Saveliev, A. (2019) FLightR: SSM for solar
geolocation.
R package version 0.4.8.
URL http://github.com/eldarrak/FLightR - Rakhimberdiev et al. (2017) Rakhimberdiev, E., Saveliev, A., Piersma, T. & Karagicheva, J. (2017) FLightR: an r package for reconstructing animal paths from solar geolocation loggers. Methods in Ecology and Evolution, 8, 1482–1487. ISSN 2041-210X.
- Rakhimberdiev et al. (2015) Rakhimberdiev, E., Winkler, D.W., Bridge, E., Seavy, N.E., Sheldon, D., Piersma, T. & Saveliev, A. (2015) A hidden Markov model for reconstructing animal paths from solar geolocation loggers using templates for light intensity. Movement Ecology, 3, 25. ISSN 2051-3933.
- Reichman, Jones & Schildhauer (2011) Reichman, O.J., Jones, M.B. & Schildhauer, M.P. (2011) Challenges and Opportunities of Open Data in Ecology. Science, 331, 703–705. ISSN 0036-8075, 1095-9203.
-
Remelgado (2018)
Remelgado, R. (2018) rsMove: Guidelines for the use of Remote Sensing in
Movement Ecology.
R package version 0.2.7.
URL https://CRAN.R-project.org/package=rsMove - Remelgado et al. (2017) Remelgado, R., Leutner, B., Safi, K., Sonnenschein, R., Kuebert, C. & Wegmann, M. (2017) Linking animal movement and remote sensing – mapping resource suitability from a remote sensing perspective. Remote Sensing in Ecology and Conservation, 4, 211–224. ISSN 2056-3485.
- Rivest, Couturier & Crépeau (1998) Rivest, L.P., Couturier, S. & Crépeau, H. (1998) Statistical Methods for Estimating Caribou Abundance Using Postcalving Aggregations Detected by Radio Telemetry. Biometrics, 54, 865–876. ISSN 0006-341X.
-
Rowlingson (2012)
Rowlingson, B. (2012) telemetr: Radio Direction-finding Telemetry code.
R package version 0.3.
URL https://github.com/barryrowlingson/telemetr - Rutz & Hays (2009) Rutz, C. & Hays, G.C. (2009) New frontiers in biologging science. Biology Letters, 5, 289–292. ISSN 1744-9561, 1744-957X.
-
Scharf (2018)
Scharf, H. (2018) anipaths: Animation of Observed Trajectories Using
Spline-Based Interpolation.
R package version 0.9.6.
URL https://CRAN.R-project.org/package=anipaths -
Schwalb-Willmann (2018)
Schwalb-Willmann, J. (2018) moveVis: Movement Data Visualization.
R package version 0.9.9.
URL https://CRAN.R-project.org/package=moveVis -
Shepard et al. (2008)
Shepard, E.L.C., Wilson, R.P., Halsey, L.G., Quintana, F., Laich, A.G., Gleiss,
A.C., Liebsch, N., Myers, A.E. & Norman, B. (2008) Derivation of body motion
via appropriate smoothing of acceleration data.
Aquatic Biology, 4, 235–241.
ISSN 1864-7782, 1864-7790.
URL https://www.int-res.com/abstracts/ab/v4/n3/p235-241/ - Shimada et al. (2012) Shimada, T., Jones, R., Limpus, C. & Hamann, M. (2012) Improving data retention and home range estimates by data-driven screening. Marine Ecology Progress Series, 457, 171–180. ISSN 0171-8630, 1616-1599.
- Shimada et al. (2016) Shimada, T., Limpus, C., Jones, R., Hazel, J., Groom, R. & Hamann, M. (2016) Sea turtles return home after intentional displacement from coastal foraging areas. Marine Biology, 163, 8. ISSN 0025-3162, 1432-1793.
- Sibert et al. (2012) Sibert, J., Nielsen, A., Ancheta, J., Galuardi, B. & Lam, C.H. (2012) kftrack: kftrack. Http://www.r-project.org, https://www.soest.hawaii.edu/tag-data/tracking/kftrack.
- Sibert, Musyl & Brill (2003) Sibert, J.R., Musyl, M.K. & Brill, R.W. (2003) Horizontal movements of bigeye tuna (Thunnus obesus) near Hawaii determined by Kalman filter analysis of archival tagging data. Fisheries Oceanography, 12, 141–151. ISSN 1365-2419.
- Signer (2016) Signer, J. (2016) rhr: Reproducible Home Ranges with R. R package version 1.2.909.
-
Signer (2018)
Signer, J. (2018) amt: Animal Movement Tools.
R package version 0.0.5.0.
URL https://CRAN.R-project.org/package=amt - Signer & Balkenhol (2015) Signer, J. & Balkenhol, N. (2015) Reproducible home ranges (rhr): A new, user-friendly R package for analyses of wildlife telemetry data. Wildlife Society Bulletin, 39, 358–363. ISSN 19385463.
- Sijben (2013) Sijben, S. (2013) movementAnalysis: Analysis of trajectory data using linear or Brownian motion model. R package version 0.6.
-
Song & Cox (2016)
Song, J. & Cox, M.G. (2016) acc: Exploring Accelerometer Data.
R package version 1.3.3.
URL https://CRAN.R-project.org/package=acc - Spitz (2018) Spitz, D. (2018) migrateR: Animal Movement Classification. R package version 1.0.7.
- Spitz, Hebblewhite & Stephenson (2017) Spitz, D.B., Hebblewhite, M. & Stephenson, T.R. (2017) ’MigrateR’: Extending model-driven methods for classifying and quantifying animal movement behavior. Ecography, 40, 788–799. ISSN 16000587.
-
Sumner (2016)
Sumner, M.D. (2016) trip: Tools for the Analysis of Animal Track Data.
R package version 1.5.0.
URL https://CRAN.R-project.org/package=trip -
Sumner & Wotherspoon (2016)
Sumner, M.D. & Wotherspoon, S. (2016) Metropolis Sampler and Supporting
Functions for Estimating Animal Movement from Archival Tags and Satellite
Fixes.
R package version R package version 0.0-44.
URL https://github.com/mdsumner/tripEstimation - Sumner, Wotherspoon & Hindell (2009) Sumner, M.D., Wotherspoon, S.J. & Hindell, M.A. (2009) Bayesian Estimation of Animal Movement from Archival and Satellite Tags. PLOS ONE, 4, e7324. ISSN 1932-6203.
- Thurfjell, Ciuti & Boyce (2014) Thurfjell, H., Ciuti, S. & Boyce, M.S. (2014) Applications of step-selection functions in ecology and conservation. Movement Ecology, 2, 4. ISSN 2051-3933.
- Tomkiewicz et al. (2010) Tomkiewicz, S.M., Fuller, M.R., Kie, J.G. & Bates, K.K. (2010) Global positioning system and associated technologies in animal behaviour and ecological research. Philosophical Transactions of the Royal Society B: Biological Sciences, 365, 2163–2176.
-
Toohey (2015)
Toohey, K. (2015) SimilarityMeasures: Trajectory Similarity Measures.
R package version 1.4.
URL https://CRAN.R-project.org/package=SimilarityMeasures -
Tracey et al. (2014a)
Tracey, J.A., Sheppard, J., Zhu, J., Sinkovts, R., Chourasia, A., Lockwood, G.
& Fisher, R.N. (2014a) mkde: 2D and 3D movement-based
kernel density estimates (MKDEs).
R package version 0.1.
URL https://CRAN.R-project.org/package=mkde - Tracey et al. (2014b) Tracey, J.A., Sheppard, J., Zhu, J., Wei, F., Swaisgood, R.R. & Fisher, R.N. (2014b) Movement-Based Estimation and Visualization of Space Use in 3D for Wildlife Ecology and Conservation. PLOS ONE, 9, e101205. ISSN 1932-6203.
- Urbano et al. (2010) Urbano, F., Cagnacci, F., Calenge, C., Dettki, H., Cameron, A. & Neteler, M. (2010) Wildlife tracking data management: a new vision. Philosophical Transactions of the Royal Society of London, Series B: Biological Sciences, 365, 2177–2185.
-
Van Domelen (2018)
Van Domelen, D.R. (2018) accelerometry: Functions for Processing
Accelerometer Data.
R package version 3.1.2.
URL https://CRAN.R-project.org/package=accelerometry - van Hees et al. (2014) van Hees, V.T., Fang, Z., Langford, J., Assah, F., MohammadMirkes, A., da Silva, I.C., Trenell, M.I., White, T., Wareham, N.J. & Brage, S. (2014) Autocalibration of accelerometer data for free-living physical activity assessment using local gravity and temperature: an evaluation on four continents. Journal of Applied Physiology, 117, 738–744.
-
van Hees et al. (2019)
van Hees, V.T., Fang, Z., Zhao, J.H., Heywood, J., Mirkes, E., Sabia, S. &
Migueles, J.H. (2019) GGIR: Raw Accelerometer Data Analysis.
R package version 1.8-1.
URL https://CRAN.R-project.org/package=GGIR - van Hees et al. (2015) van Hees, V.T., Sabia, S., Anderson, K.N., Denton, S.J., Oliver, J., Catt, M., Abell, J.G., Kivimaki, M., Trenell, M.I. & Singh-Manoux, A. (2015) A Novel, Open Access Method to Assess Sleep Duration Using a Wrist-Worn Accelerometer. PLoS One, 10.
- Van Winkle (1975) Van Winkle, W. (1975) Comparison of several probabilistic home-range models. The Journal of wildlife management, pp. 118–123.
- Viviant et al. (2010) Viviant, M., Trites, A.W., Rosen, D.A.S., Monestiez, P. & Guinet, C. (2010) Prey capture attempts can be detected in Steller sea lions and other marine predators using accelerometers. Polar Biology, 33, 713–719. ISSN 1432-2056.
- Weinzierl et al. (2016) Weinzierl, R., Bohrer, G., Kranstauber, B., Fiedler, W., Wikelski, M. & Flack, A. (2016) Wind estimation based on thermal soaring of birds. Ecology and Evolution, 6, 8706–8718. ISSN 2045-7758.
- Westley et al. (2018) Westley, P.A.H., Berdahl, A.M., Torney, C.J. & Biro, D. (2018) Collective movement in ecology: from emerging technologies to conservation and management. 373, 20170004.
- Wickham (2016) Wickham, H. (2016) ggplot2: Elegant Graphics for Data Analysis. Springer-Verlag New York. ISBN 978-3-319-24277-4.
- Williams et al. (2017) Williams, H.J., Holton, M.D., Shepard, E.L.C., Largey, N., Norman, B., Ryan, P.G., Duriez, O., Scantlebury, M., Quintana, F., Magowan, E.A., Marks, N.J., Alagaili, A.N., Bennett, N.C. & Wilson, R.P. (2017) Identification of animal movement patterns using tri-axial magnetometry. Movement Ecology, 5, 6. ISSN 2051-3933.
- Wilmers et al. (2015) Wilmers, C.C., Nickel, B., Bryce, C.M., Smith, J.A., Wheat, R.E. & Yovovich, V. (2015) The golden age of bio-logging: how animal-borne sensors are advancing the frontiers of ecology. Ecology, 96, 1741–1753. ISSN 1939-9170.
- Wilson et al. (1991) Wilson, R.P., Wilson, M.-P.T., Link, R., Mempel, H., Adams, N.J. (1991) Determination of movements of african penguins spheniscus demersus using a compass system: dead reckoning may be an alternative to telemetry. Journal of Experimental Biology, 157, 557–564.
- Wilson, Shepard & Liebsch (2008) Wilson, R.P., Shepard, E.L.C. & Liebsch, N. (2008) Prying into the intimate details of animal lives: use of a daily diary on animals. 4, 123–137.
- Wilson et al. (2007) Wilson, R.P., Liebsch, N., Davies, I.M., Quintana, F., Weimerskirch, H., Storch, S., Lucke, K., Siebert, U., Zankl, S., Müller, G., Zimmer, I., Scolaro, A., Campagna, C., Plötz, J., Bornemann, H., Teilmann, J. & McMahon, C.R. (2007) All at sea with animal tracks; methodological and analytical solutions for the resolution of movement. Deep Sea Research Part II: Topical Studies in Oceanography, 54, 193–210. ISSN 0967-0645.
- Wilson et al. (2019) Wilson, R.P., Börger, L., Holton, M.D., Scantlebury, D.M., Gómez-Laich, A., Quintana, F., Rosell, F., Graf, P.M., Williams, H., Gunner, R., Hopkins, L., Marks, N., Geraldi, N.R., Duarte, C.M., Scott, R., Strano, M.S., Robotka, H., Eizaguirre, C., Fahlman, A. & Shepard, E.L.C. (2019) Estimates for energy expenditure in free-living animals using acceleration proxies: A reappraisal. In press.
- Wotherspoon, Sumner & Lisovski (2016a) Wotherspoon, S., Sumner, M. & Lisovski, S. (2016a) BAStag: Basic data processing for light based geolocation archival tags. R package version 0.1.3.
- Wotherspoon, Sumner & Lisovski (2016b) Wotherspoon, S., Sumner, M. & Lisovski, S. (2016b) TwGeos: Basic data processing for light-level geolocation archival tags. R package version 0.0-1.
- Xie (2013) Xie, Y. (2013) animation: An R Package for Creating Animations and Demonstrating Statistical Methods. Journal of Statistical Software, 53, 1–27.
-
Xie et al. (2017)
Xie, Y., Mueller, C., Yu, L. & Zhu, W. (2017) animation: A Gallery of
Animations in Statistics and Utilities to Create Animations.
R package version 2.5.
URL https://yihui.name/animation - Yan et al. (2014) Yan, J., Chen, Y.w., Lawrence-Apfel, K., Ortega, I.M., Pozdnyakov, V., Williams, S. & Meyer, T. (2014) A moving–resting process with an embedded Brownian motion for animal movements. Population Ecology, 56, 401–415. ISSN 1438-3896, 1438-390X.
-
Yan, Pozdnyakov & Hu (2018)
Yan, J., Pozdnyakov, V. & Hu, C. (2018) smam: Statistical Modeling of
Animal Movement.
R package version 0.4.0.
URL https://github.com/ChaoranHu/smam
Table captions
Table 1. Summary of the functionality of the tracking packages.
| Workflow stage | Categories | Method description | Data type | Package |
| Pre-processing | Threshold | GLS | GeoLight, probGLS | |
| Template-fitting | GLS | FlightR, trackit, TripEstimation/SGAT | ||
| Twilight-free | GLS | TwilightFree | ||
| Triangulation | Radio | telemetr | ||
| Dead reckoning | Accel. + magnet. | animalTrack, TrackReconstruction | ||
| Post-processing | Data cleaning | Filter implausible locations | PTT | argosfilter, SDLfilter |
| GPS | SDLfilter | |||
| Remove duplicates / speed filter | Any | T-LoCoH, TrajDataMining, trip | ||
| Data compression | Rediscretization | Any | adehabitatLT, trajectories, trajr | |
| Interpolation | Any | adehabitatLT, amt , trajectories | ||
| Douglas-Peucker | Any | TrajDataMining, trajectories | ||
| Opening window | Any | TrajDataMining | ||
| Savitzky-Golay | Any | trajr | ||
| Transform to pixels to link with remote sensing | Any | rsMove | ||
| Metrics computation | 2nd or 3rd order variables | Any | adehabitatLT, amt, bcpa, momentuHMM, move, moveHMM, rhr, segclust2d, trajectories, trajr, trip | |
| Radio | feedr | |||
| Acoustic | VTrack | |||
| Visualization | Animations of tracks | Any | anipaths, moveVis | |
| Track description | Summary metrics | Any | amt, movementAnalysis, trajr, marcher | |
| GPS | trackeR | |||
| Path reconstruction | State-space models | GLS | HMMoce, kftrack, ukfsst/kfsst | |
| PTT | argosTrack, bsam | |||
| Any | crawl | |||
| Functional movement model | Any | ctmcmove | ||
| Continuous Markov chain in gridded space | Any | ctmm | ||
| Bayesian Brownian bridge model | GPS + DR path | BayesianAnimalTracker | ||
| Transformation of the space | GPS + DR path | TrackReconstruction | ||
| Behavioral pattern identification | Clustering techniques | Expectation-maximization binary clustering | Any | EMbC |
| Random forest | Any | m2b | ||
| Segmentation | Gueguen and Lavielle | Any | adehabitatLT | |
| Extension of Lavielle | Any | segclust2d | ||
| Behavioral change point analysis | Any | bcpa | ||
| Mechanistic range shift analysis | Any | marcher | ||
| Net displacement models | Any | migrateR | ||
| Hidden Markov based models | Bayesian state-space model with states | PTT | bsam | |
| Hidden Markov models | Any | lsmnsd, momentuHMM, moveHMM | ||
| Space use | Home range estimation | Minimum convex polygon | Any | adehabitatHR, amt, move, rhr |
| Density kernel utilization distribution | Any | adehabitatHR, amt, rhr | ||
| Movement-based utilization distribution | Any | adehabitatHR, amt, BBMM, ctmm, mkde, move, movementAnalysis, rhr | ||
| Local convex hull | Any | adehabitatHR, amt, rhr, T-LoCoH | ||
| Habitat use | Step selection functions | Any | amt, hab | |
| Generalized linear models | Any | ctmcmove | ||
| Non-conventional approaches | (See text) | Radio | feedr | |
| Acoustic | VTrack | |||
| Any | moveNT, recurse, rsMove | |||
| Trajectory simulation | Movement models fitted to data | Any | crawl, ctmm, momentuHMM, moveHMM, smam | |
| PTT | argosTrack, bsam | |||
| Movement models with parameters defined by user | Any | adehabitatLT, moveNT, SiMRiv, trajr | ||
| Other | Interactions | Dyad interaction metrics | Any | wildlifeDI |
| Distance and time thresholds | Any | movementAnalysis, TrajDataMining | ||
| Movement similarity | Similarity measures between trajectories (e.g. Frechet) | Any | SimilarityMeasures, trajectories | |
| Population size | Stochastic model for abundance | Radio | caribou | |
| Environment conditions | Likelihood maximization of airspeed model | Any | moveWindSpeed | |
| Database management | Integrating R and PostgreSQL / PostGIS | Any | rpostgisLT |
Figure captions
Figure 1. Workflow for data processing and analysis in movement ecology. Numbers in parenthesis are the number of packages dealing with each stage of the workflow. Some packages may correspond to more than one category, except for data visualization, where only packages created for that purpose are counted.
Figure 2. Number of packages per year of publication. Since the packages were reviewed between March and August 2018, this last year was incomplete and not included in the graph.
Figure 3. Packages with good and excellent documentation (survey results). Text color in green corresponds to packages with standard documentation only, blue is for packages with vignettes, and purple is for packages that also have peer-reviewed articles published. Only results for packages with at least 10 respondents are shown.
Figure 4. Network representation of the dependency and suggestion between tracking packages. The arrows go towards the package the others suggest (dashed arrows) or depend on (solid arrows). Bold font corresponds to active packages. The size of the circle is proportional to the number of packages that suggest or depend on this one.