Implications of a hot atmosphere/corino from ALMA observations towards NGC1333 IRAS 4A1
Abstract
We report high angular resolution observations of NGC1333 IRAS4A, a protostellar binary including A1 and A2, at 0.84 mm with the Atacama Large Millimeter/submillimeter Array. From the continuum observations, we suggest that the dust emission from the A1 core is optically thick, and A2 is predominantly optically thin. The A2 core, exhibiting a forest of spectral lines including complex molecules, is a well known hot corino as suggested by previous works. More importantly, we report, for the first time, the solid evidence of complex organic molecules (COMs), including CH3OH, 13CH3OH, CH2DOH, CH3CHO associated with the A1 core seen in absorption. The absorption features mostly arise from a compact region around the continuum peak position of the A1 core. Rather than originating from a larger common envelope surrounding the protobinary, the COM features are associated with individual cores A1 and A2. Considering the signatures observed in both continuum and spectral lines, we propose two possible scenarios for IRAS 4A1 - the COM absorption lines may arise from a hot-corino-like atmosphere at the surface of an optically-thick circumstellar disk around A1, or the absorption may arise from different layers of a temperature-stratified dense envelope.
1 Introduction
Hot cores and hot corinos are associated with (high- and low-mass) star formation at its relatively early stage of evolution. Due to high temperature in the vicinity of protostar, large abundance of complex organic molecules (containing typically at least six atoms, Herbst & van Dishoeck, 2009) are observed in the gas phase. Hot cores, with typical sizes of 0.1 pc, densities of cm-3, and temperatures of 100 K (e.g.,van der Tak, 2004), are related to massive star forming regions. Orion KL, for example, hosts an archetypal hot molecular core as revealed by millimeter molecular line observations (e.g., Blake et al., 1987). Similar spectral line surveys found that saturated COMs, e.g., CH3OH, HCOOCH3, CH3OCH3 are especially abundant in the hot core regions (e.g. Comito et al., 2005; Tercero et al., 2010; Crockett et al., 2014). The low mass analogs of the hot cores are dubbed as hot corinos. NGC 1333 IRAS 4A (IRAS 4A hereafter) and IRAS 162932422 (I16293 hereafter) are among the first recognized hot corinos (Cazaux et al., 2003; Bottinelli et al., 2004). There are only a handful of hot-corinos known to date (e.g.,Bottinelli et al., 2007; Öberg et al., 2011, 2014; Fuente et al., 2014).
The observed COMs in hot cores and hot corinos have often been suggested to form primarily in grain icy mantles and later get liberated into the gas phase by thermal evaporation (desorption) (Millar et al., 1991; Charnley et al., 1992). Further investigation indicated, though, that their formation through recombination of radicals on grain surfaces during the warm up phase in the star formation process may be as important (Garrod et al., 2006). Laboratory experiments and theoretical calculations, nevertheless, demonstrated that methanol is produced largely in the grain phase through repeated hydrogenation of CO (e.g. Tielens et al., 1982, 2005) as,
| (1) |
Gas-phase production of CH3OH, on the other hand, is inefficient as compared to grain-phase for typical physical conditions in protostellar environments (Geppert et al., 2006). Consequently, methanol is often used to signify the presence of thermally-evaporated COMs in hot core and hot corinos.
In the context of low-mass YSOs, COMs were found in a few cases specifically associated with young stellar and protoplanetary disks. For example, mythalcyanide (CH3CN) and CH3OH were detected in the protoplanetary disk TW Hya (Öberg et al., 2015; Walsh et al., 2016). Lee et al. (2017b) detected CH3OH, deuterated methanol (CH2DOH), methyl mercaptan (CH3SH), formamide (NH2CHO) as well as doubly deuterated formaldehyde (D2CO) in HH212. The distribution of these molecular emission, above and below the dusty protoplanetary disk, are suggested to trace COMs formed in situ in the atmosphere of the disk. More recently, van ’t Hoff et al. (2018) detected methanol that appears to be thermally desorbed from grains in the disk of the young out-bursting source V883 Ori.
Complex molecular species mainly liberated from grain surfaces through thermal desorption with dust temperature reaching 85 K (Brown et al. 2007). Additional effects like photodissociation, reactive desorption and energetic interaction may enhance gas-phase abundances of chemical species (e.g. Sahu et al., 2018; Taquet et al., 2015) including COMs (Drozdovskaya et al., 2015). For this reason, a few COMs have been seen in the peripheral region of protostellar envelopes (e.g., Jaber et al., 2014) and in shocks produced by fast jet and molecular outflow (e.g. Palau et al., 2017 and references therein).
Thanks to the advent of the interferometric facilities like the Atacama Large Millimeter and submillimeter Array (ALMA), spectral signatures of COMs can be observed and mapped with high sensitivity and angular resolution at sub-arcsecond level, differentiating their emission regions. Previously, interferometric observations of hot corinos (e.g.Bottinelli et al., 2004; Kuan et al., 2004; Bisschop et al., 2008; Jørgensen et al., 2011, 2016; Codella et al., 2016) unveiled the presence of several COMs and in some cases their distributions, too.
The IRAS 4A, one of the first known hot corino objects, is located in the Perseus molecular cloud at a distance 235 pc (Hirota et al., 2008). A recent result from GAIA measured the distance of Perseus molecular cloud to be 29322 pc (Ortiz-León et al., 2018; Zucker et al., 2018), we adopt this updated distance (293 pc) throughout the paper. The overall luminosity and envelope mass of the object are 9.1 L⊙ and 5.6 M⊙ respectively (Kristensen et al., 2012; Karska et al., 2013). In the centimeter to millimeter continuum imaging measurements, IRAS 4A shows two compact emission cores and clumpy extended structure, and IRAS 4A1 (A1 hereafter) is found to be brighter than IRAS 4A2 (A2 hereafter) (Choi et al., 2010, 2011). A1 and A2, separated by 18 ( 527 AU), are likely a pair of class 0 proto-binary system originating from the same parent cloud (Jennings et al., 1987; Sandell et al., 1991; Lay et al., 1995; Looney et al., 2000) and are reported to have similarly powerful bipolar outflows (Santangelo et al., 2015). The IRAS 4A region therefore encompasses circumstellar disks associated with compact cores, and protostellar envelopes around the individual protostars and a common envelope shared by the binary (Choi et al., 2011). Taquet et al. (2015), through comparatively low angular resolution () observations that were unable to disentangle A1 and A2, found the presence of several COMs, e.g., CH3OH, HCOOCH3, CH3OCH3, HCOCH2OH, C2H5OH towards IRAS 4A as a whole. Recently, López-Sepulcre et al. (2017) studied the complex organics in IRAS 4A with ALMA and the Pleatu de Bure Interferometer (PdBI) at a higher angular resolution () and resolved apart the emissions from the two cores, A1 and A2. They found a striking contrast between these two neighboring cores — while A2 showed hot corino activity with enriched COMs’ emission (Persson et al., 2012), no sign of COMs was detected in A1. López-Sepulcre et al. (2017) suggest that either A1 does not host any hot corino, or alternatively A1 may host a hot corino with a size 15 AU (after scaling the adopted distance to 293 pc) that is 6 times smaller than that of A2.
Keeping all this in mind, in this paper we present ALMA observations of the protostellar binary IRAS 4A with a high resolution of (or equivalently 88 AU in linear scale). We detected emission signatures of methanol and its various isotopologues as well as CH3CHO in A2, while these species showed primarily absorption features towards A1. We suggest that we are seeing COMs in the “atmosphere” of A1, which itself is readily developing into a hot corino object with optically thick dust continuum emission. We describe the observational setup in Section 2, detail the results in Section 3, discuss the implications of these results in Section 4.
2 Observations
The observations of IRAS 4A were carried out by ALMA under the project code 2015.1.00147.S. Three Execution Blocks (EBs) were conducted with ALMA Band 7 receiver on 2016 Jul. 23 and 24 and 2016 Dec. 14. The number of antennas in the 12 M array for the three EBs were respectively 39, 42, and 43. The phase centre of the observations was set at R.A.(J2000) = 03d 29m 10.50s , Dec.(J2000) =+31∘13′ 31.5′′ and the total integration time on-source was approximately 84 mins. We deployed seven spectral windows, including one broadband window centered at 350.714 GHz whose bandwidth and spectral channel width are 1.875 GHz and 976 kHz, respectively. The latter, with standard online Hanning-smooth applied, corresponds to a velocity resolution of 0.84 km s-1. This paper focuses on the data from the above broadband window and more details about the full observational setup can be found in our forthcoming paper (Su et al. 2019)
The data were first calibrated by the ALMA observatory through the data reduction pipeline within the Common Astronomy Software Application package (CASA, version 4.7 McMullin et al., 2007), We then generated both the 0.84 mm continuum and spectral visibilities by fitting and subtracting continuum emission in the visibility domain. We used Briggs weighting with a robustness parameter of 0.5 for forming the images. The resulting synthesized beam size is 030 020 (PA=-6.45∘) for the continuum map and is 031 020 (P.A= -24∘) for the spectral data cubes (for a typical line transition only). We subsequently used MIRIAD (Sault et al., 1995) and CASSIS (developed by IRAP-UPS/CNRS- http://cassis.irap.omp.eu) for further image inspection and spectral line analysis. The resulting rms level is 8 mJy beam-1 and 3 mJy beam-1 in the continuum image and spectral cubes, respectively, with the noise rms being strongly limited by the imaging dynamical range in the continuum image due to the presence of very bright features.
3 Results
3.1 Dust continuum emission
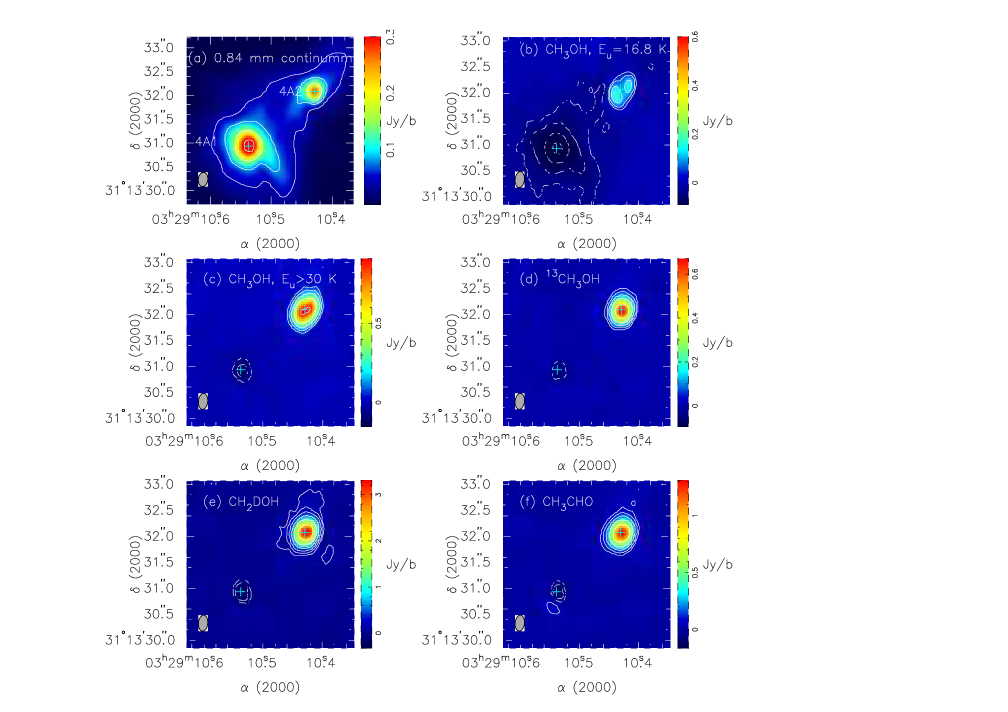
Figure 1(a) shows the 0.84 mm (357 GHz) continuum towards IRAS 4A. At an angular resolution of 031 020, IRAS 4A is clearly resolved into two components, with A1 located in the SE, A2 in the NW. A1 and A2 each appears to consist of a compact emission feature and an outer extended feature. We applied a two-component 2D Gaussian fitting to the two sources and summarize the fitting results in Table 1. Overall we recovered within the region a flux density of 7.24 Jy. Previous single dish observations by Smith et al. (2000) at 0.85 mm reported a peak flux density of 10.3 Jy beam-1 within a 16′′ beam toward IRAS 4A. Sandell & Knee (2001), on the other hand, measured at 0.85 mm a peak flux density of 9.05 Jy towards the same direction. Considering calibration uncertainties, these results appear consistent and are about only 20 larger than our ALMA measurement. Given the integrated region of single dish observations is also larger than the extent of the IRAS 4A centroid, we conclude that the missing flux issue, though may result from the most extended envelope, is not severe and does not impact our science focusing on the compact continuum features.
The angular separation between A1 and A2 derived from the positions of the compact components listed in Table 1 is 18, in agreement with previous measurements (e.g., López-Sepulcre et al., 2017, and references therein). For both A1 and A2, the diameters of the compact component are equivalent to about 55 – 115 AU, and the sizes of the extended envelope span about several hundreds to nearly 1000 AU. The brightness temperatures derived from the observed peak continuum are 57 K and 42 K towards A1 and A2, respectively. The relatively high brightness temperatures readily indicate that the center positions of both A1 and A2 are very warm. We note that these brightness temperatures are the beam-average values, and the actual brightness temperatures, depending on the source filling factor, could be further inflated.
Assuming a gas-to-dust ratio of 100, a (uniform) dust temperature of 60 K, a dust opacity = 0.006 (/245 GHz) β cm2 g-1 (Kramer et al. 1998; Shepherd & Watson 2002), an opacity index = 1.5, and a distance of 293 pc to IRAS 4A, the dust and gas mass is estimated to be 0.15, 0.49, 0.07, and 0.50 M⊙ for 4A1 compact component, 4A1 extended component, 4A2 compact component, and 4A2 extended component, respectively; calculations are based on optically thin assumption. Using the above-mentioned parameters, the H2 column density toward the 4A1 centroid is estimated to be at least 1.3 1026 cm-2. Such a high molecular gas column density will lead to a visual extinction Av 100000. Note that the estimated dust and gas mass of the 4A1 compact component is most likely a low limit given that there are indications of the A1 dust continuum being optically thick throughout the radio to submillimeter bands as discussed in Section 4.1.
| Source | Component | Position (ICRS 2000) | Sint | Deconvolved Size | Mass | |||
|---|---|---|---|---|---|---|---|---|
| (mJy) | max | min | P.A.∘ | M⊙ | ||||
| 4A1 | compact | 03 29 10.538 | +31 13 30.93 | 923 | 0.397 | 0.354 | 64.1 | 0.15 |
| extended | 03 29 10.523 | +31 13 30.69 | 2979 | 1.937 | 1.282 | 47.0 | 0.49 | |
| 4A2 | compact | 03 29 10.430 | +31 13 32.08 | 404 | 0.274 | 0.168 | 82.2 | 0.07 |
| extended | 03 29 10.448 | +31 13 32.12 | 3035 | 2.973 | 1.167 | 53.8 | 0.50 | |
3.2 Detected molecules and their distribution
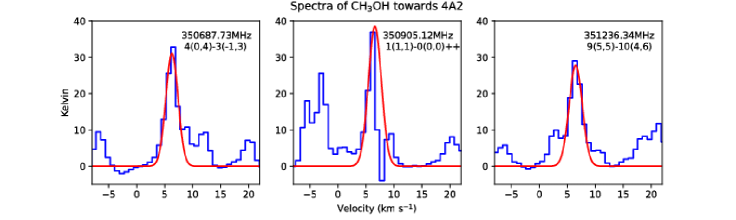
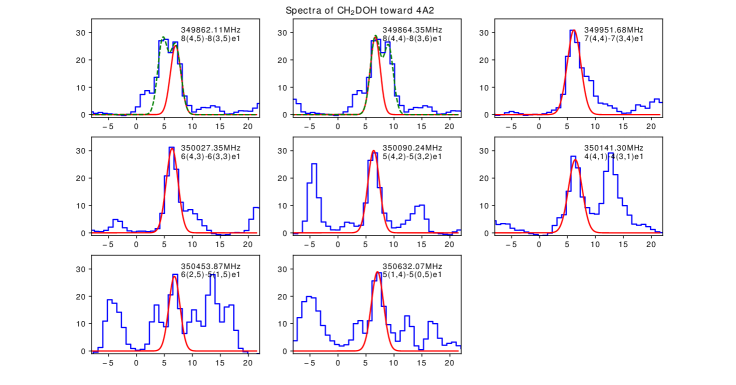
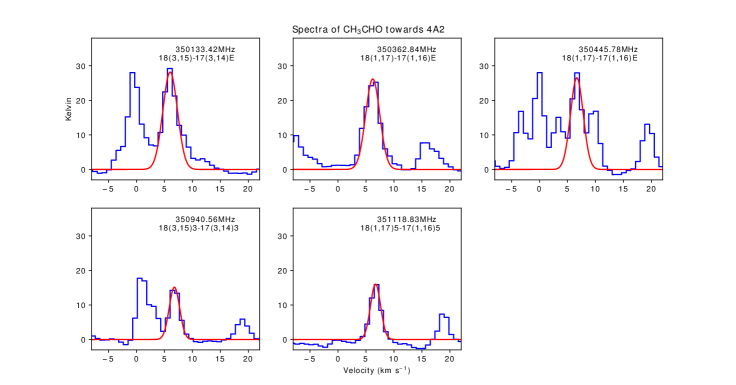
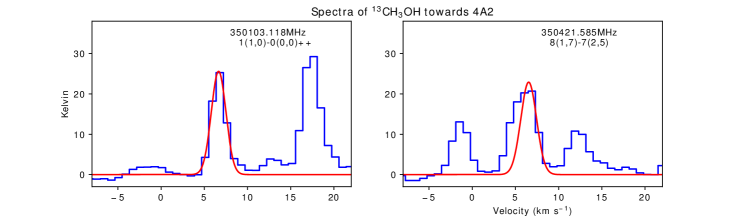
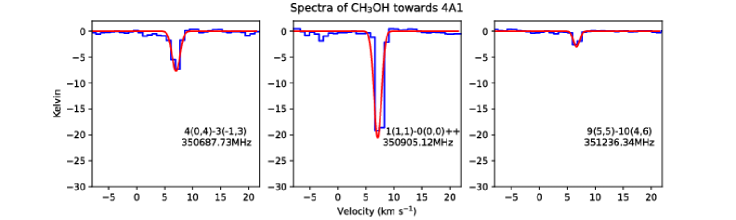
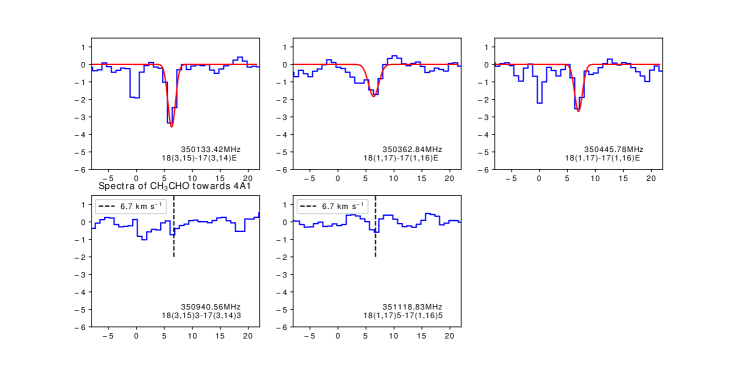
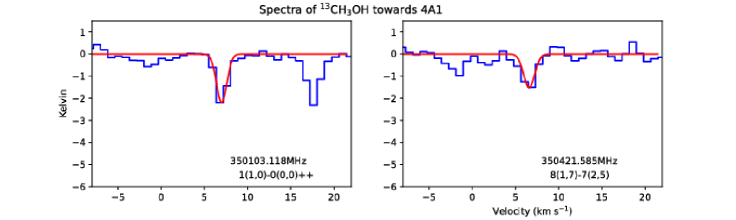
In Figure 2 we display the spectra towards the continuum A1 and A2 peaks over the full 1.875 GHz spectral window centered at 350.714 GHz. Line features from methanol (CH3OH) and its isotopologues (13CH3OH and CH2DOH) as well as those from acetaldehyde (CH3CHO), as identified and discussed below, are marked in Figure 2 and listed in more detail in Table 2.
Towards A1, the spectrum throughout the window exhibits rich and almost exclusively absorption features, regardless of their excitation temperatures. This is a complementary evidence suggesting that the continuum dust emission along the A1 line of sight is optically thick. In contrast, the spectrum towards A2 shows a multitude of emission lines. Many spectral features (e.g., CH3OH) from A2 display noticeably similar peak intensities at around 75 K, indicative of a “saturated” and thus optically-thick nature of those respective lines.
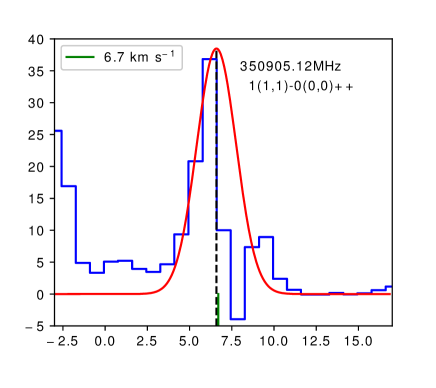
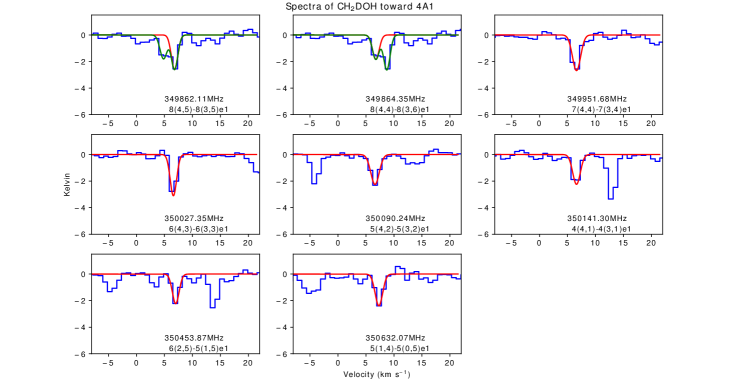
In this paper, we focus on the detection and analysis of CH3OH, its isotopologues including 13CH3OH and CH2DOH, and CH3CHO in both A1 and A2 cores of IRAS 4A. As noted, CH3OH is a robust tracer for highlighting surface chemistry which occurs within interstellar ices on the grain surface. To firmly secure the spectral identification, we examined the spectral features that bear strong (emission/absorption) intensities and are relatively well separated from line confusion/contamination. We visualized the spectral data in CASSIS for initial line identifications. Assuming a systematic velocity 6.96 km s-1 (Di Francesco et al., 2001) and employing the JPL (Pickett et al., 1998) and CDMS (Müller et al., 2001, 2005) databases, we generated synthetic spectra within CASSIS. Essentially all isolated transitions from these molecules with their Einstein co-efficient are well matched (at a level of 3 and above) while those with are likely below our detection threshold or blended by nearby stronger features from other species. CH3OH transitions are most intense and there is negligible contamination from other molecular species. All CH3OH transitions falling in the spectral coverage are identified, as listed in Table 2. In particular, the transition 1(1,1)-0(,0,0)++ to the ground state are prominently detected with a deep absorption feature toward A1 and an inverse P-Cygni profile towards A2. Though CH2DOH molecular transitions are detected without confusion, some of its transitions are blended themselves. For example, two CH2DOH transitions (8 & 8), with similar excitation energies Eu and frequencies, overlap at around 349.864 GHz. The detected molecular transitions of the selected species are common towards both the cores, except that the molecular transitions with E K of CH3CHO were not detected towards A1.
We applied Gaussian profile fitting for extracting the spectral parameters of the identified features. We list the fitting results in the Table 2 and plot the profiles in Figure 3 and Figure 5. During the fitting process, we consider the velocity range carefully to fit the spectral profile. In some cases, we excluded some channels to avoid line contamination and other kinematics feature (e.g. inverse P-Cygni, see Fig. 4). The fitting results of spectral profiles from different transitions of a molecule have peak around a common LSR velocity, considering the uncertainties of measurements. The averaged velocity of the emission features (excluding inverse P-Cygni profile) toward A2 is 6.6 km s-1. Given the limited velocity resolution, this velocity is consistent with the gas velocity seen in previous works (e.g., average value 6.8 km s-1, López-Sepulcre et al., 2017). The averaged velocity of absorption features toward A1 is 6.8 km s-1. Meanwhile, there does not appear any trend of velocity variation among the transitions of different excitation energy. When this is compared with the systemic velocity of 6.7 km s-1 adopted by Choi et al. (2007), there is no clear indication of (infall) motion in the absorbing gas. Based on the profile fitting (Table 2), we also note that the line-widths s are 1.0-1.5 km s-1 for the (absorption) features in A1 while s are 1.5-2.3 km s-1 for the (emission) lines in A2 core.
| Molecule | Transition∗ | (MHz) | Eup (K) | Aij sec-1 | Intensity(K) | Vlsr (km s-1) | V | Intensity(K) | Vlsr (km s-1) | V |
|---|---|---|---|---|---|---|---|---|---|---|
| transitions towards IRAS 4A2 | transitions towards IRAS 4A1∗∗ | |||||||||
| vt=0 4(0,4) - 3(-1,3) | 350687.73 | 36.33 | 8.67E-5 | 31.05 3.06 | 6.30 0.13 | 1.93 0.25 | -7.69 0.80 | 7.03 0.08 | 1.25 0.16 | |
| vt=0 1(1,1) - 0(0,0)++ | 350905.12 | 16.84 | 3.31E-4 | 38.49 2.72 | 6.59 0.10 | 2.06 0.12 | -20.59 5.95 | 7.10 0.24 | 1.18 0.38 | |
| vt=0 9(5,5) - 10(4,6) | 351236.34 | 240.51 | 3.66E-5 | 27.76 1.47 | 6.49 0.07 | 2.09 0.14 | -3.000.15 | 6.64 0.03 | 0.96 0.06 | |
| vt=0 1(1,0) - 0(0,0)++ | 350103.12 | 16.80 | 3.29E-4 | 25.59 0.86 | 6.65 0.03 | 1.49 0.06 | -2.19 0.17 | 7.01 0.05 | 1.06 0.10 | |
| vt=0 8(1,7) - 7(2,5) | 350421.58 | 102.62 | 7.03E-5 | 22.91 4.58 | 6.53 0.29 | 1.60 0.66 | -1.52 0.18 | 6.58 0.08 | 1.13 0.18 | |
| CH2DOH | 8(4,4) - 8(3,6) e1 | 349864.35 | 149.21 | 1.07E-4 | 28.33 1.06 | 6.65 0.09 | 1.54 0.14 | -1.84 0.29 | 6.76 0.12 | 1.05 0.29 |
| CH2DOH | 8(4,5) - 8(3,5) e1 | 349862.11 | 149.21 | 1.07E-4 | 25.23 0.13 | 7.00 0.02 | 1.65 0.02 | -2.60 0.41 | 6.82 0.16 | 1.02 0.21 |
| CH2DOH | 7(4,4) - 7(3,4) e1 aa4 transitions | 349951.68 | 132.07 | 1.00E-4 | 30.93 1.29 | 6.15 0.06 | 2.14 0.13 | -2.69 0.43 | 6.60 0.14 | 1.29 0.24 |
| CH2DOH | 6(4,3) - 6(3,3) e1 bb2 transitions. | 350027.35 | 117.08 | 9.06E-5 | 30.86 0.87 | 6.38 0.03 | 1.86 0.07 | -3.10 0.43 | 6.61 0.08 | 1.01 0.18 |
| CH2DOH | 5(4,2) - 5(3,2) e1 cc2 transitions. | 350090.24 | 104.23 | 7.58E-5 | 30.10 1.29 | 6.38 0.05 | 1.83 0.10 | -2.25 0.14 | 6.61 0.06 | 1.33 0.10 |
| CH2DOH | 4(4,1) - 4(3,1) e1 dd2 transitions. | 350141.30 | 93.53 | 5.03E-5 | 26.73 2.16 | 6.38 0.11 | 2.16 0.21 | -2.25 0.26 | 6.60 0.09 | 1.20 0.16 |
| CH2DOH | 6(2,5) - 5(1,5) e1 | 350453.86 | 71.55 | 1.39E-4 | 27.29 1.35 | 6.79 0.06 | 1.75 0.11 | -2.23 0.08 | 7.02 0.03 | 1.06 0.04 |
| CH2DOH | 5(1,4) - 5(0,5) e1 | 350632.07 | 48.98 | 2.07E-4 | 28.98 2.07 | 7.05 0.09 | 1.90 0.19 | -2.39 0.30 | 7.30 0.10 | 1.18 0.17 |
| CH3CHO | v=0 18(3,15) - 17(3,14) E b | 350133.42 | 179.2 | 1.44E-3 | 28.17 3.12 | 6.03 0.22 | 2.30 0.45 | -3.58 0.31 | 6.30 0.06 | 1.18 0.13 |
| CH3CHO | v=0 18(1,17) - 17(1,16) E | 350362.84 | 163.46 | 1.47E-3 | 26.16 1.28 | 6.21 0.08 | 2.23 0.17 | -1.84 0.19 | 6.36 0.11 | 1.60 0.20 |
| CH3CHO | v=0 18(1,17) - 17(1,16) E | 350445.78 | 163.42 | 1.47E-3 | 26.51 2.02 | 6.66 0.10 | 2.00 0.20 | -2.70 0.04 | 6.96 0.01 | 1.23 0.02 |
| CH3CHO | 18(3,15)3 - 17(3,14)3 | 350940.56 | 383.69 | 1.45E-3 | 15.15 0.71 | 6.79 0.05 | 1.63 0.09 | – | – | – |
| CH3CHO | 18(1,17)5 - 17(1,16)5 | 351118.83 | 368.32 | 1.45E-3 | 16.04 0.43 | 6.71 0.03 | 1.60 0.06 | – | – | – |
Figure 1(b-f) show the velocity integrated intensity maps of the molecules described in the text. In all panels, dashed contours in the map represent absorption and solid contours represent emission. There are three CH3OH transitions detected in both A1 and A2. We plotted the integrated emission of the low-temperature Eu=16.8 K transition, and the remaining two transitions (see Table 2) separately in Fig 1(b) & (c). From the two panels, we see that the absorption feature associated with the CH3OH 1(1,1)- 0(0,0)++ line (Eu =16.8 K) around the A1 core is extended and have a size of 087 074 (deconvolved from the beam after 2D Gaussian fittings), reflecting its low-lying energy nature. The integrated emission for the same transition toward A2 is also affected by the absorption part of the inverse P-Cygni profile. The absorption around A1 core for the two other higher Eu methanol transitions have a compact size of 042 029. To enhance the imaging quality, for species other than CH3OH, the integrated intensity maps are made by stacking the detected transitions all together. Based on 2D Gaussian fitting, we find that the absorption feature for 13CH3OH, CH3CHO, CH2DOH around the A1 core are all compact.
3.3 Gas temperatures and column densities
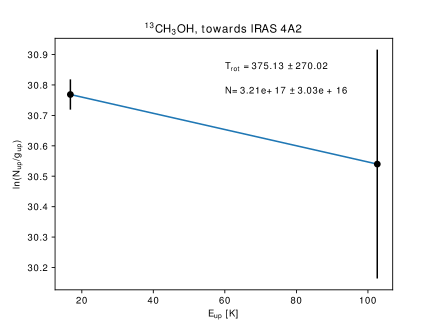
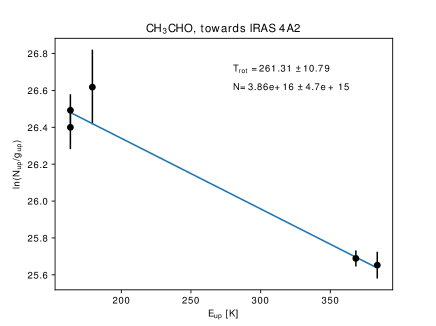
Towards IRAS 4A2, there are a large number of emission lines showing noticeably similar intensity levels at around 70 K (without continuum subtraction) as shown in Figure 2. This is particularly true for the three detected CH3OH transitions, all the CH2DOH transitions, and at least the three low energy CH3CHO transitions, as also shown in Figure 3. Given that these emission features originate from different species with different excitation energies and Einstein A coefficients, their common brightness can be understood only if all these lines are optically thick and saturated. The opaque nature indicates that the molecular gas at A2 is at least as hot as 70 K at its “surface”. For 13CH3OH in A2, the emissions may be optically thin, although the high Eu line is possibly blended by an interloper. Additionally, a couple of high Eu CH3CHO transitions do not seem to be saturated.
For these cases where we have detected multiple optically thin transitions from the same molecule, we may estimate the gas temperature using the rotation diagram method (Turner, 1991; Herbst & van Dishoeck, 2009 and references therein). Following the standard radiative transfer equation we have
| (2) |
where is the observed brightness at the line frequency , is the source function (, and are the gas excitation temperature at that transition and the background brightness temperature. is the optical depth at the line center. Equivalently,
| (3) |
The observed continuum-subtracted line brightness temperature can be expressed as
| (4) | |||||
| (5) |
Equation (4) is the same as Equation (A1) of Turner (1991), When the line emission is assumed optically thin, the upper level population is given by Equation (A3) of Turner (1991),
| (6) |
where, is the degeneracy of the upper level, is the Boltzmann constant, S is the line strength, is the dipole moment, W = is the integrated line intensity in K km s-1, and the Rayleigh-Jeans approximation has been applied. Furthermore, the level population can be described using Boltzmann distribution, characterized by a single (rotation) temperature T Trot, if its excitation is assumed in local thermodynamic equilibrium (LTE). The total molecular column density and the excitation (rotation) temperature can thus be related by the relation,
| (7) |
where Ntot is the total column density, Qtot is the rotational partition function at Trot. Combining Equations (5) and (6), we can find
| (8) |
This equation, with a negligible , hence a negligible last term, forms the conventional rotation diagram. That is, for the same molecule with multiple detected transitions, one can plot log(Nu/gu) vs. Eu and determine Trot and Ntot. We note that, though, when cannot be fully neglected but the line opacity remains reasonably small (), the plot of log(Nu/gu) vs. Eu still gives rise to a slop of 1/ Trot.
We applied the rotation diagram method to the 13CH3OH and the CH3CHO transitions detected towards A2. As shown in Figure 6, we obtained rotation temperatures of 375.13270.02 K and 261.3110.79 K for 13CH3OH and the CH3CHO, respectively. These temperatures should be taken as upper limits though, as their corresponding lower Eu lines are possibly optically thick. As Goldsmith & Langer (1999) pointed out that, when the optical depth is not negligible, the true total column density is related to the column density under the optically thin condition by the following relation,
| (9) |
That is, when the low Eu lines are optically thick, their respective Nu need to be corrected upwards, leading to a steeper slope in the rotation diagram and hence a lower rotation temperature. We also obtained lower limits on their column densities. Indirectly we can have an educated guess for the CH3OH column density also by considering the isotopic ratio 70 (Sheffer et al., 2007).
The situation toward IRAS 4A1, for its exclusively absorption features, can be more complicated. As the absorption features have various depths, in a naively scenario (Scenario I, see Figure 7), we assume that most, if not all, of the observed transitions in A1 are optically thin and there is no saturation in absorption. We regard the continuum emission as the “background” radiation in the radiative transfer equation and the absorbing molecular line forms in a “foreground” layer. We would therefore have both () and terms in Equation (5) negative as and and proceed with the rotation diagram method.
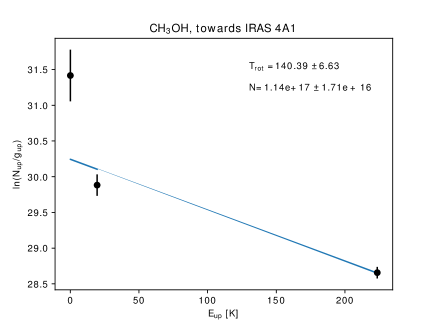
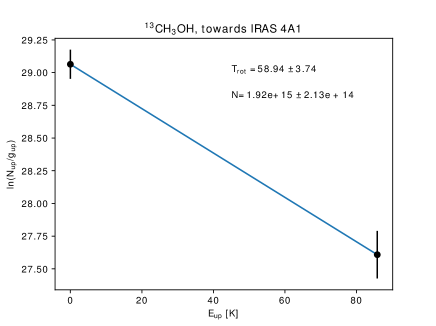
When this Scenario I is applied to the CH3OH and 13CH3OH transitions in A1, we obtain Figure 6, which indicates that the corresponding rotation temperatures for CH3OH and 13CH3OH are 140.396.63 K and 58.94 3.74 K, respectively. While CH2DOH does not fit with a well defined rotational temperature probably due to line blending. The detected transitions of CH3CHO towards A1 may be optically thin but they have very closely spaced Eu values ( K) and do not provide good constraints on the temperature through a rotation diagram. The column densities are shown in Table 3, for molecules where do not have any estimation of rotational temperature, we choose the temperature to be 200 K and calculated the column densities averaging the results from all the detected transitions of a molecule.
| Molecule | Trot | column density | Trot | column density |
|---|---|---|---|---|
| (K) | N (cm-2) | (K) | N (cm-2) | |
| IRAS 4A2 | IRAS 4A1 | |||
| CH3OH | 200 K | bbFor multiple transitions where there is no available rotational temperature, the average column density for the assumed temperature. | K | |
| 13CH3OH | K | K | ||
| CH2DOH | 200 K a | 200 K a | ||
| CH3CHO | K | 200 K a | ||
4 Discussion
While the observed forest of emission line features of COMs supports the hot corino nature of IRAS 4A2 as was established by previous studies (e.g. Taquet et al., 2015; Santangelo et al., 2015; López-Sepulcre et al., 2017), the nature of A1 is much less clear. Taquet et al. (2015) made detailed studies of COMs in selected low mass YSOs, including NGC 1333 IRAS4A. Even though the angular resolution of their observations only marginally resolved apart A1 and A2, it was clear that A1 is devoid of COM emission features. A lack of COM emission lines toward A1 was noticed by Santangelo et al. (2015) in their study of the bipolar outflows associated in IRAS4A. Based on the velocities and extents of the bipolar outflows, Santangelo et al. (2015) proposed a younger dynamical age of A1 as compared to A2. Using observations with PdBI and ALMA, López-Sepulcre et al. (2017) further reaffirmed a significant contrast of COM features between A1 and A2. López-Sepulcre et al. (2017) detected no COM emission but marginal absorption features of CH3CHO, HCOOCH3 and (CH3)2CO towards A1 and attribute these features to either an opaque absorbing foreground or a very small severely beam-diluted emission region. In particular, they estimated that the size of the emitting region should be of order 15 AU (after scaling the adopted distance to 293 pc) or smaller if it is not obscured by the foreground dust.
4.1 Continuum Opacity
In contrast to previous presumptions, we reason below several lines of evidence that points to the A1 continuum emission from centimeter to submillimeter wavelengths being optically thick. First of all, the rich absorption lines in combination of the absence of emission feature we observed at 0.84 mm is an indication of A1 being either genuinely deficient of trace molecular species within or the continuum is optically thick and has attenuated the embedded molecular emissions.
Secondly, as presented in Section 3.1, the brightness temperature of the compact component towards A1 is nearly 60 K at an angular resolution of 03 by 02. At 1.2 mm (250 GHz), López-Sepulcre et al. (2017) detected with ALMA a peak continuum flux of 542 mJy towards the A1 centroid at an angular resolution of 066 by 035. This leads to a brightness temperature of 46 K. With the Karl G. Jansky Very Large Array (JVLA) 6.9 mm observations at a resolution of 049 040, Liu et al. (2016) also reported a fairly high brightness temperature of 41 K towards A1. Recently VLA observations for the VLA Nascent Disk and Multiplicity (VANDAM) survey measured peak continuum fluxes of 4.151 mJy and 2.759 mJy at 8.1 mm and 10.3 mm, respectively, towards A1 (Cox et al., 2015). With their synthesized beam size of 0224 by 0199 and 025 by 025, these flux densities correspond to a brightness temperature of 83 K at 8.1 mm and 64 K at 10.3 mm. Given dust opacity is more optically thin at longer wavelengths, that is, scaling as with 1.0 or higher, one would expect at similar angular resolutions the continuum brightness temperature measured at a lower frequency will be significantly weaker than that observed at a higher frequency. The beam dilution effect could further make the brightness lower if the low frequency observations were done at a coarser angular resolution. We, for example, smooth our ALMA 0.84 mm continuum to have the same beam size as that of the JVLA 6.9 mm observations and find the resulting A1 peak brightness be 39 K, almost identical to the JVLA 6.9 mm measurement. With observations of these bands considered, the above-mentioned comparable brightness from 10 mm to 0.84 mm therefore implies opaque continuum emission throughout these bands towards the A1 peak, and the dusty opaque zone could be as large as the JVLA beam area of 049 040. In fact, a possible opaque nature of the 1.2 mm continuum emission of A1 was considered by López-Sepulcre et al. (2017), although it was ruled unlikely by the authors for its corresponding large volume density of cm-3 towards the region. Meanwhile, in a spectral energy distribution (SED) modelling and analysis, Li et al. (2017) considered a two-component (disk+envelope) fitting, which results in a good representation of the measured SED data points and hinted at A1 continuum being optically thick even down to centimeter wavelengths.
The possibility of A1 being optically thick throughout the centimeter to submillimeter bands has notable implications. All the column densities and masses reported by previous studies should then only be considered as lower limits, as they were derived with the optically-thin assumption. The lack of emission spectral feature and hence the deficiency in trace (COM) species, compared to that of A2 shall also be re-considered, as their emission could be naturally blanked by the optically thick continuum. Additionally, the weak NH3 line emission observed by Choi et al. (2007, 2011) towards A1 could also be partially understood if the continuum opacity remains substantial at 1.3 cm.
In the case of A2, Liu et al. (2016) reported a much weaker brightness of 2 K at 6.9 mm, about a factor of 20 lower that our ALMA 0.84 mm results. Note that the 0.84 mm brightness temperature smoothed to the JVLA 6.9 mm beam size is still as high as 23 K. The brightness difference indicates that the 6.9 mm continuum towards A2 peak is likely optically thin.
4.2 COM Features
We have detected spectra features of CH3OH, CH2DOH, 13CH3OH and CH3CHO in both A1 and A2 of IRAS 4A. Towards A2, all features from these species, except CH3OH 1(1,1)-0(0,0)++, are in emission. Many of the transitions are, as demonstrated in Section 3.2, optically thick with a brightness temperature of 70K suggesting that the gas is warm. The CH3OH 1(1,1)-0(0,0)++ line shows an inverse P-Cygni profile, indicative of gas infall motion, and this will be discussed in a separate paper. Towards A1, our observations demonstrate conclusively, for the first time, absorption features from the selected COMs against the optically thick dust continuum emission.
Could both the absorption features toward A1 and the emission features toward A2 have a common, possibly foreground, origin? Yıldız et al. (2013) suggested tentatively a foreground layer of gas based on O2 observations with the Herschel Space Observatory toward IRAS 4A and this component has been incorporated for optimizing the model fitting of H2O spectra observed also with Herschel by Mottram et al. (2013) in IRAS 4A. This foreground cloud with an estimated velocity at around 8.0 km s-1 also seems present in the 13CO (2-1) spectrum reported by Jørgensen et al. (2007) (their Fig. 6) in the PROSAC survey. However, this velocity component is 0.8 – 1.0 km s-1 offset from the systemic velocity of IRAS 4A and incompatible with our observed COM velocities. In addition, the spectral features of these COMs along the two close line-of-sights (towards A1 and A2) have disparate velocities, line-widths, and optical depths, strongly ruling out a common (foreground) origin of the observed COM absorption and emission.
Given that COMs have been observed sometimes in shocks associated with outflows (Sugimura et al., 2011), there is the possibility that the COM features are associated with the outflows in IRAS 4A. Santangelo et al. (2015) found a high-velocity jet from A1, while A2 drives a slower precessing jet, with both outflows primarily aligned along the north-south direction. On the other hand, our observed absorption and emission COM features rather trace closely the bright dust continuum. Furthermore, the observed line-widths of the COM features toward the A1 and A2 continuum are relatively narrow, in contrast to the high outflow velocities several tens of km s-1 relative to the ambient in this region (Santangelo et al., 2015). An outflow origin of the COM features towards A1 and A2 is therefore unlikely, leaving the observed COMs most probably associated directly with the individual A1 and A2 continuum sources at 0.3or 88 AU scale.
As shown in Figure 1, the low Eu ( K) CH3OH line exhibits absorption in a region that covers the full extent of the A1 continuum emission with a size of 0.9′′. This extended absorption layer is likely associated with the protostellar envelope surrounding the central protostar and possibly its circumstellar disk. On the other hand, other COM absorption features from higher upper energy levels ( 40 K) arise from a barely resolved region or 73 AU in diameter.
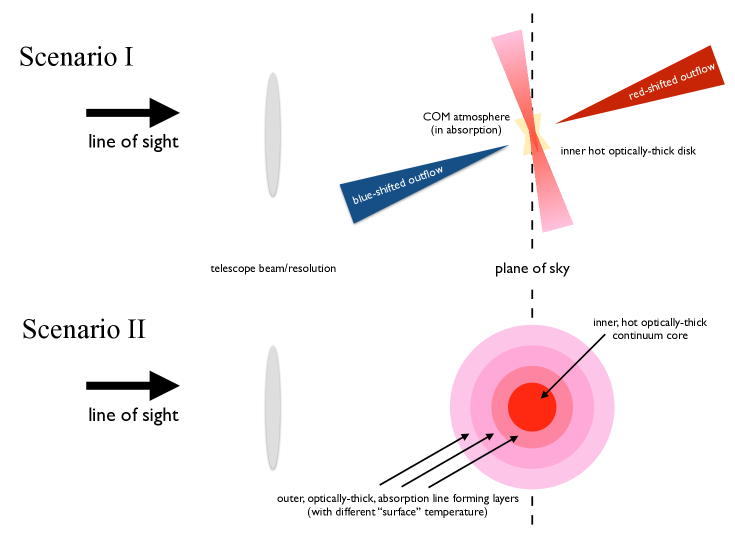
Based on the rotation diagram analysis in Scenario I, the gas temperature of this more compact absorption layer is 100 K. To have the observed absorption feature produced by a layer of COM (e.g. CH3OH gas), a brighter (background) continuum emission is required. Typically, the disk upper layers are hotter due to stellar irradiation, while the midplane is cooler. On the other hand, high accretion rate can potentially heat up the midplane region, particularly at small radii, and make it hotter than its atmosphere (Dullemond et al., 2007). As illustrated in Figure 7, in this scenario I, we speculate that we are witnessing a compact path of COM atmosphere absorbing against the very inner and hot part of an inclined circumstellar disk around a protostar at A1. We find, as listed in Table 3, the column density of CH3OH at the level of 1017 cm-2 (converting 13CH3OH column density). Factoring in a typical fractional abundance of CH3OH of 10-6 (Herbst & van Dishoeck, 2009), the absorbing COM atmosphere will have a column density of 1023 cm-2. This can be compared to the column density of the “background” continuum disk of 1026 cm-2 (see section 3.1). If the disk is only slightly inclined from face-on, we are able to observe the unresolved, compact ( 73 AU), hot inner disk and the associated COM atmosphere, which dominates the absorption spectral along its line of sight. The tentative COM absorption features seen by López-Sepulcre et al. (2017) may originate from the same region but get severely beam-diluted at a lower angular resolution. The (optically thick) disk surface has a temperature gradient, which results in an overall (beam averaged) continuum brightness of 60 K towards the A1 peak. In the case that the level of accretion heating in A1 is not sufficient to elevate the disk mid-plane temperature above its COM atmosphere locally (i.e., at the same radius), we may be viewing a tilted disk so that along the line of sight, we are seeing an atmosphere against the continuum emission at a smaller radius with higher temperature. Segura-Cox et al. (2018), for example, based on two-dimensional image fitting of the 8mm (dust) continuum emission observed with the JVLA, inferred a modestly inclined disk at 35∘. The slightly inclined disk probably leads to a seemingly faster but less extended bipolar outflow in A1 as compared to that in A2 (Santangelo et al., 2015), as the outflow will be highly inclined, resulting in a larger velocity along the light-of-sight and less transverse motion on the plane of the sky. A nearly pole-on (6∘) view of a bipolar outflow toward A1 was actually considered by Santangelo et al. (2015) although a different interpretation was preferred. A nearly face-on disk orientation could explain the lack of a clear velocity gradient seen in NH3 toward A1 by Choi et al. (2007, 2011). In contrast, a velocity gradient perpendicular to the bipolar outflow was seen in NH3 towards A2. The lack of obvious fast rotating signature in NH3 emission around A1 led Choi et al. (2011) to speculate that A1 hosts a less massive protostar than that of the A2.
The geometry of IRAS 4A1 proposed above is close to the picture suggested by Oya et al. (2018) of I16293 B. I16293 is another proto-binary where two (sub)millimeter continuum emission cores, I16293 A and B, show hot-corino activities (Oya et al., 2016). Similar to the case of IRAS 4A, the weaker continuum of I16293 (i.e., A core) show richer COM (emission) features compared to that of B core. Zapata et al. (2013) revealed a compact structure from continuum emission (0.45mm, angular resolution ) of I16293 B, and revealed a pronounced inner depression or absorption hole from H13CN, HC15N, CH3OH images. The ‘hole’ size is comparable to continuum size which is optically thick. So, in that image the molecular emission is surrounded like a wall. Our observation has a little similarity with this case but in our case we do not find any molecular emission outside of the central beam. The outer disk (beyond 36 AU in radius) is probably cold and/or optically thick so that COM emission is absent due to a lack of COMs in the gas phase and/or the attenuation of line emissions by continuum. A relevant case related to this picture is the COMs environment observed in HH212 system (Lee et al., 2017b). COMs were observed above the disk surface but not in the optically thick disk (Lee et al., 2017a) itself in HH212.
It is interesting to note that emission of complex organics such as CH3OH, CH2DOH, HCOOCH3, and NH2CHO have been proposed to trace the centrifugal barrier of accretion disks (Lee et al., 2017b; Oya et al., 2018). In the case of HH212, Lee et al. (2017b) observed a couple of layers of hot COM gas, including CH3OH, CH2DOH, and NH2CHO, above and below of an edge-on disk. The extent of the COM “atmosphere” is consistent with that of a centrifugal barrier (CB) at 44 AU based on kinematics considerations. For I16293 B, compact CH3OH and HCOOCH3 emission were observed toward its continuum; it was also suggested to trace the CB at a radius of 40 AU. If our observed COM emission is indeed associated with the same phenomenon, the compact nature of the COM absorption in A1 would imply that only a small ( 36 AU) disk within which Keplerian rotation has been established. We have not seen all the molecular transitions that are observed towards A2 in the absorption towards A1 (see Figure 2). The difference perhaps indicates that COM emission from A2 has a “genuine”/“typical” hot-corino nature while that from A1 is accretion-shock related at CB.
In addition to Scenario I in which the absorption lines are considered optically-thin, we discuss also an alternative scenario (Scenario II). It is possible that some (or all) of the absorption features toward A1 are in fact optically thick and saturated. As shown in Equation (2) and (4), in the optically thick situation, the depth of the absorption line core will be the temperature difference between the background continuum brightness and the foreground absorbing gas temperature, or equivalently, the brightness at the absorption line core is equal to the foreground absorbing gas temperature. In Scenario II, in which invoking a beam-filling factor is not necessary, the absorption lines with different excitation temperatures form at different layers in a temperature-stratified envelope, a configuration illustrated in Figure 7. The lower excitation line saturates at the outer cooler layer, while the higher excitation transition (not excited at the outer layer) become optically thick in the relatively inner and hotter region. The CH3OH transitions toward A1, for example, probe layers between 30K and 60K. Considering an envelope with its gas temperature scaling with r-0.5, where r is the radius from the center protostellar object, a factor of two difference in temperature translates to a radius difference by a factor of 4. The velocity for gas, if free-falling at 50 AU around a 0.1M⊙ protostar, is nearly 2 km s-1 and would be scaled by . Our observations should be able to detect such (differential) velocity offsets if the gas is under free-fall. As suggested in Section 3.2, the consistency of the absorption line velocities with the systematic velocity and among themselves appears to indicate a lack of gas accretion/inflow motion (along the line of sight) in the envelope at tens of AU scale.
4.3 Deuterium Fractionation
Now we consider the deuterium fractionation of CH3OH in A1 and A2. As CH3OH emission in A2 is optically thick, it would be good to compare 13CH3OH and CH2DOH column densities in both the cores. The 13CH3OH/CH2DOH ratio for A2 and A1 is 2.47 and 0.29 (considering the average value) respectively. Bianchi et al. (2017) used 13CH3OH to calculate 12CH3OH abundance and from this they reported a D/H ratio for methanol in HH212. The deuterium fractionation is one order lower than typical D/H values in hot-cores and prestellar clouds. The observation by Bianchi et al. (2017) was a high-resolution ALMA observation on scale 45 AU, similar to the scale of current observation 73 AU. If we consider 12C/13C 70 (Sheffer et al., 2007) (note: 12C/ 13C ratio is not standard and it varies in different medium, e.g., Taniguchi et al., 2016; Wirström et al., 2011), then the lower limit of CH2DOH/CH3OH ratio in A2 and A1 becomes the 0.6 and 4.9 respectively. This is only a factor difference in deuteration between the core A1 and A2. There is a caveat in this calculation, we assume a likely value of rotational temperature (200 K) for this and also there is huge uncertainty in 13CH3OH column density calculation, and rotational temperatures of 13CH3OH for two cores are very different. However, if we consider the result, then it suggests that higher gas temperature in the hot-corinos environment indirectly reduces the deuteration in methanol compared to cold prestellar conditions; this is similar to the methanol deuteration in HH212. It may imply that A1 also have a hot environment like the A2 with similar deuterium fractionation and hosts a hot-corino.
5 Conclusion
We have observed the NGC1333 IRAS 4A protobinary system with its two cores- A1 & A2 well resolved using ALMA. The results can be summarized as follows-
1. The dust continuum emission towards the core A2 is found to be predominantly optically thin at this scale while the continuum emission towards A1 is most likely to be optically thick.
2. A forest of spectral line emissions is observed towards A2, while spectral transitions towards A1 are detected in absorption. Here we have identified and discussed some COMs like CH3OH, 13CH3OH, CH2DOH, CH3CHO in both the cores A1 and A2. The A2 core is a known hot corino with a rich presence of COMs.
3. The observed absorption features towards A1 are probably arising from a hot-corino-like atmosphere against a very compact ( 36 AU) disk in A1. We speculate that this compact hot-corino-like atmosphere may resemble the cases in HH212 and I16293 B in which the COM emission is related to the centrifugal barrier of accretion disks. Alternatively, the absorption may arise from different layers of a temperature-stratified dense envelope.
4. An indirect calculation of deuterium fractionation shows that CH2 DOH/CH3OH ratio have similar order () towards both the sources. This low deuterium fractionation in both sources may imply a hot gas condition ( K) typical to a hot corino.
Acknowledgment We thank Prof. Emmanuel Caux for helpful discussion and suggestions, Dr. Kuo-Song Wang, Dr. Tien-Hao Hsieh (ASIAA, Taiwan) for some technical help. DS wants to thank ASIAA, Taiwan for providing a visitor position and computational facility; also wishes to thank PRL, India for supporting the research with post-doctoral fellowship and international travel grant. SYL acknowledges the support by the Minister of Science and Technology of Taiwan (MOST 107-2119-M-001-041). ZYL is supported in part by NSF grant AST-1815784 and AST-1716259 and NASA grant 80NSSC18K1095 and NNX14AB38G. ST acknowledges a grant from the Ministry of Science and Technology (MOST) of Taiwan (MOST 102-2119- M-001-012-MY3), and JSPS KAKENHI Grant Numbers JP16H07086 and JP18K03703 in support of this work. This work was supported by NAOJ ALMA Scientific Research Grant Numbers 2017-04A. This paper makes use of the following ALMA data: ADS/JAO.ALMA#2015.1.00147.S. ALMA is a partnership of ESO (representing its member states), NSF (USA) and NINS (Japan), together with NRC (Canada) and MoST and ASIAA (Taiwan) and KASI (Republic of Korea), in cooperation with the Republic of Chile. The Joint ALMA Observatory is operated by ESO, AUI/NRAO and NAOJ.
References
- Awad et al. (2010) Awad, Z., Viti, S., Collings, M. P., & Williams, D. A. 2010, MNRAS, 407, 2511
- Bacmann et al. (2012) Bacmann, A., Taquet, V., Faure, A., Kahane, C., & Ceccarelli, C. 2012, A&A, 541, L12
- Balucani et al. (2015) Balucani, N., Ceccarelli, C., Taquet, V., 2015, MNRAS 449, L16.
- Barone et al. (2015) Barone, V., Latouche, C., Skouteris, D. et al., 2015, MNRAS 453, L31.
- Bianchi et al. (2017) Bianchi, E., Codella, C., Ceccarelli, C. et al. 2017, A&A 606, L7.
- Bisschop et al. (2008) Bisschop, S. E., Jørgensen, J. K., Bourke, T. L., Bottinelli, S., & van Dishoeck,E. F. 2008, A&A, 488, 959.
- Blake et al. (1987) Blake, G. A., Sutton, E. C., Masson, C. R., & Phillips, T. G. 1987, ApJ, 315, 621
- Bottinelli et al. (2004) Bottinelli, S., Ceccarelli, C., Lefloch, B., et al. 2004, ApJ, 615, 354
- Bottinelli et al. (2007) Bottinelli, S., Ceccarelli, C., Williams, J. P., & Lefloch, B. 2007, A&A, 463, 601.
- Brown et al. (2007) Brown W. A., Bolina A. S., 2007, MNRAS, 374, 1006
- Cazaux et al. (2003) Cazaux, S., Tielens, A. G. G. M., Ceccarelli, C., et al. 2003, ApJ, 593, L51
- Charnley et al. (1992) Charnley, S. B., Tielens, A. G. G. M., & Millar, T. J. 1992, ApJ, 399, L71
- Choi et al. (2007) Choi, M., Tatematsu, K., Park, G., & Kang, M. 2007, ApJ, 667, L183
- Choi et al. (2010) Choi, M., Tatematsu, K., & Kang, M. 2010, ApJ, 723, L34
- Choi et al. (2011) Choi, M., Kang, M., Tatematsu, K. et al., 2011, PASJ, 63, 1281
- Codella et al. (2016) Codella, C., Ceccarelli, C., Cabrit, S., et al. 2016, A&A, 586, L3
- Comito et al. (2005) Comito, C., Schilke, P., Phillips, T. G., et al. 2005, ApJS, 156, 127
- Cox et al. (2015) Cox, E.G., Harris,R.J., Looney, L. W. et al. 2015, ApJ, 814, L28.
- Crockett et al. (2014) Crockett, N.R., Bergin, E.A. , Neill, J.L., et al., 2014, ApJ. 787, 112
- Di Francesco et al. (2001) Di Francesco, J., Myers, P. C., Wilner, D. J., Ohashi, N., & Mardones, D. 2001, ApJ, 562, 770
- Drozdovskaya et al. (2015) Drozdovskaya, M. N., Walsh, C., Visser, R., Harsono, D., van Dishoeck, E. F., 2015, MNRAS, 451, 3836.
- Dullemond et al. (2007) Dullemond, C. P., Hollenbach, D., Kamp, I., & D’Alessio, P. 2007, Protostars and Planets V, 555
- Fuente et al. (2014) Fuente, A., Cernicharo, J., Caselli, P., et al. 2014, A&A, 568, A65
- Garrod et al. (2006) Garrod, R. T., & Herbst, E. 2006, A&A, 457, 927
- Geppert et al. (2006) Geppert W. D. et al., 2006, Faraday Discuss., 133, 177
- Goldsmith & Langer (1999) Goldsmith, P. F. and Langer, W. D., 1999, ApJ, 517,1, 209
- Herbst & van Dishoeck (2009) Herbst, E. & van Dishoeck, E.F., 2009, Annu. Rev. Astron. Astrophys., 47, 427
- Hirota et al. (2008) Hirota, T., Bushimata, T., Choi, Y. K., et al. 2008, PASJ, 60, 37
- Imai et al. (2016) Imai, M., Sakai, N., Oya, Y., et al. 2016, ApJ, 830, L37
- Jaber et al. (2014) Jaber, A. A., Ceccarelli, C., Kahane, C., & Caux, E. 2014, ApJ, 791, 29
- Jennings et al. (1987) Jennings, R. E., Cameron, D. H. M., Cudlip, W., & Hirst, C. J. 1987, MNRAS, 226, 461
- Jiménez-Serra et al. (2016) Jiménez-Serra, I., Vasyunin, A. I., Caselli, P., et al. 2016, ApJ, 830, L6
- Jørgensen et al. (2005) Jørgensen, J. K., Bourke, T. L., Myers, P. C., et al. 2005, ApJ, 632, 973
- Jørgensen et al. (2007) Jørgensen, J. K., Bourke, T. L., Myers, P. C., et al. 2007, ApJ, 659, 479
- Jørgensen et al. (2011) Jørgensen, J. K., Bourke, T. L., Nguyen Luong, Q., & Takakuwa, S. 2011, A&A, 534, A100.
- Jørgensen et al. (2012) Jørgensen, J. K., Favre, C., Bisschop, S. E., et al. 2012, ApJ, 757, L4
- Jørgensen et al. (2016) Jørgensen, J. K., van der Wiel, M. H. D., Coutens, A., et al. 2016, A&A, 595,A117
- Karska et al. (2013) Karska, A., Herczeg, G. J., van Dishoeck, E. F., et al. 2013, A&A, 552, A141
- Kristensen et al. (2012) Kristensen, L. E., van Dishoeck, E. F., Bergin, E. A., et al. 2012, A&A, 542,A8
- Kuan et al. (2004) Kuan, Y.-J., Huang, H.-C., Charnley, S. B., et al. 2004, ApJ, 616, L27
- Lay et al. (1995) Lay, O. P.,Lay Carlstrom, J. E., & Hills, R. E. 1995, ApJ, 452, L73
- Lee et al. (2017a) Lee, C.-F., Li, Z.-Y., Ho, P. T. P., et al. 2017, Science Advances, 3, e1602935
- Lee et al. (2017b) Lee, C.-F., Li, Z.-Y., Ho, P. T. P., et al. 2017, ApJ, 843, 27
- Li et al. (2017) Li, J. I., Liu, H. B., Hasegawa, Y., & Hirano, N. 2017, ApJ, 840, 72
- Liu et al. (2016) Liu, H. B., Lai, S.-P., Hasegawa, Y., et al. 2016, ApJ, 821, 41
- López-Sepulcre et al. (2015) López-Sepulcre, A., Jaber, A. A., Mendoza, E., et al. 2015, MNRAS, 449, 2438
- López-Sepulcre et al. (2017) López-Sepulcre, A., Sakai, N., Neri, R., Imai, M. et al. 2017, A&A, 606, A121
- Looney et al. (2000) Looney, L. W., Mundy, L. G., & Welch, W. J. 2000, ApJ, 529, 477
- McMullin et al. (2007) McMullin, J. P., Waters, B., Schiebel, D., Young, W., & Golap, K. 2007, Astronomical Data Analysis Software and Systems XVI (ASP Conf. Ser. 376), ed. R. A. Shaw, F. Hill, & D. J. Bell (San Francisco, CA: ASP), 127
- Millar et al. (1991) Millar, T. J., Herbst, E., & Charnley, S. B. 1991, ApJ, 369, 147
- Mottram et al. (2013) Mottram, J. C., van Dishoeck, E. F., Schmalzl, M., et al. 2013, A&A, 558, A126
- Müller et al. (2001) Müller H. S. P., Thorwirth S., Roth D. A., Winnewisser G., 2001, A&A,370, L49.
- Müller et al. (2005) Müller H. S. P., Schlöder F., Stutzki J., Winnewisser G., 2005, J. Mol. Struct., 742, 215
- Öberg et al. (2015) Öberg, K. I., Guzmán, V. V., Furuya, K., et al. 2015, Nature, 520, 198
- Öberg et al. (2014) Öberg, K. I., Lauck, T., & Graninger, D. 2014, ApJ, 788, 68
- Öberg et al. (2011) Öberg, K. I., van der Marel, N., Kristensen, L. E., & van Dishoeck, E. F. 2011,ApJ, 740, 14
- Oya et al. (2018) Oya, Y., Moriwaki, K., Onishi, S., et al. 2018, ApJ, 854, 96
- Ortiz-León et al. (2018) Ortiz-León, G N., Loinard L., Dzib S A. et. al. 2018, ApJ, 865:73
- Oya et al. (2016) Oya, Y., Sakai, N., López-Sepulcre, A., et al. 2016, ApJ, 824, 88
- Palau et al. (2017) Palau, A., Walsh, C., Sanchez-Monge, A. et al. 2017, MNRAS, 467,2723
- Park et al. (2007) Park, G., & Choi, M. 2007, ApJ, 664, L99
- Persson et al. (2012) Persson, M. V., Jørgensen, J. K., & van Dishoeck, E. F. 2012, A&A, 541, A39
- Pickett et al. (1998) Pickett H. M., Poynter R. L., Cohen E. A., Delitsky M. L., Pearson J. C., Müller H. S. P., 1998, J. Quant. Spectrosc. Radiat. Transfer, 60, 883.
- Sahu et al. (2018) Sahu, D., Minh, Y-C., Lee, C-F. et al. 2018, MNRAS
- Sakai et al. (2006) Sakai, N., Sakai, T., & Yamamoto, S. 2006, PASJ, 58, L15
- Sakai et al. (2008) Sakai, N., Sakai, T., Hirota, T., & Yamamoto, S. 2008, ApJ, 672, 371
- Sakai et al. (2009) Sakai, N., Sakai, T., Hirota, T., Burton, M., & Yamamoto, S. 2009, ApJ, 697, 769
- Sakai et al. (2010) Sakai, N., Sakai, T., Hirota, T., & Yamamoto, S. 2010, ApJ, 722, 1633
- Sandell et al. (1991) Sandell, G., Aspin, C., Duncan, W. D., Russell, A. P. G., & Robson, E. I. 1991, ApJ, 376, L17
- Sandell & Knee (2001) Sandell G., & and Knee L. B. G. 2001, ApJ, 546, L49
- Santangelo et al. (2015) Santangelo, G., Codella, C., Cabrit, S., et al. 2015, A&A, 584, A126
- Sault et al. (1995) Sault R.J., Teuben P.J., & Wright M.C.H., 1995. In Astronomical Data Analysis Software and Systems IV, ed. R. Shaw, H.E. Payne, J.J.E. Hayes, ASP Conference Series, 77, 433-436
- Segura-Cox et al. (2018) Segura-Cox, D. M., Looney, L. W., Tobin, J. J., et al. 2018, ApJ, 866, 161
- Sheffer et al. (2007) Sheffer, Y., Rogers, M., Federman, S.R., et al. 2007, ApJ, 667, 1002.
- Smith et al. (2000) Smith, K. W., Bonnell, I. A., Emerson, J. P., & Jenness, T. 2000, MNRAS, 319, 991
- Sugimura et al. (2011) Sugimura, M., Yamaguchi, T., Sakai, T., et al. 2011, PASJ, 63, 459
- Taniguchi et al. (2016) Taniguchi, K., Saito, M., , and Ozeki, H., 2016, ApJ, 830:106
- Taquet et al. (2015) Taquet, V., López-Sepulcre, A., Ceccarelli, C., et al. 2015, ApJ, 804, 81
- Tercero et al. (2010) Tercero, B., Cernicharo, J., Pardo, J. R., & Goicoechea, J. R. 2010, A&A, 517, A96
- Tielens et al. (1982) Tielens A. G. G. M., Hagen W., 1982, A&A, 114, 245
- Tielens et al. (2005) Tielens A. G. G. M., 2005, The Physics and Chemistry of the Interstellar Medium. Cambridge Univ. Press, Cambridge
- Turner (1991) Turner, B. E. 1991, ApJS, 76, 617
- van ’t Hoff et al. (2018) van ’t Hoff, Merel L. R.; Tobin, John J.; et. al. 2018, ApJL, 864, L23
- Vastel et al. (2014) Vastel, C., Ceccarelli, C., Lefloch, B., & Bachiller, R. 2014, ApJ, 795, L2
- van der Tak (2004) van der Tak F. F. S., 2004, in Burton M. G., Jayawardhana R., Bourke T. L., eds, Proc. IAU Symp. Vol. 221, Star Formation at High Angular Resolution. Kluwer, Dordrecht, p. 59
- Walsh et al. (2016) Walsh, C., Loomis, R. A., Öberg, K. I., et al. 2016, ApJ, 823, L10
- Wirström et al. (2011) Wirström, E.S., Geppert, W. D., Hjalmarson Å. et al., 2011, A&A 533, A24.
- Yıldız et al. (2013) Yıldız, U. A., Acharyya, K., Goldsmith, P. F., et al. 2013, A&A, 558, A58
- Zapata et al. (2007) Zapata, L. A., Ho, P. T. P., Rodríguez, L. F., Schilke, P., & Kurtz, S. 2007, A&A,471, L59
- Zapata et al. (2009) Zapata, L. A., Schmid-Burgk, J., Ho, P. T. P., Rodríguez, L. F., & Menten, K. M.2009, ApJ, 704, L45
- Zapata et al. (2013) Zapata, L. A., Loinard, L., Rodríguez, L. F., et al. 2013, ApJ, 764, L14
- Zucker et al. (2018) Zucker, C., Schlafly, E.F., Speagle, S.F., Green, G.M., et. al., 2018, ApJ, 869:83