The Maven Dependency Graph: a Temporal Graph-based Representation of Maven Central ††thanks: This work has been partially supported by the STAMP ICT-16-10 No.731529, by the Wallenberg Autonomous Systems and software Program (WASP), and by Orange.
Abstract
The Maven Central Repository provides an extraordinary source of data to understand complex architecture and evolution phenomena among Java applications. As of September 6, 2018, this repository includes 2.8M artifacts (compiled piece of code implemented in a JVM-based language), each of which is characterized with metadata such as exact version, date of upload and list of dependencies towards other artifacts.
Today, one who wants to analyze the complete ecosystem of Maven artifacts and their dependencies faces two key challenges: (i) this is a huge data set; and (ii) dependency relationships among artifacts are not modeled explicitly and cannot be queried. In this paper, we present the Maven Dependency Graph. This open source data set provides two contributions: a snapshot of the whole Maven Central taken on September 6, 2018, stored in a graph database in which we explicitly model all dependencies; an open source infrastructure to query this huge dataset.
Index Terms:
Maven Central, Dataset, Mining, Temporal GraphI Introduction
Maven Central is one of the most popular and widely used repositories of JVM-based artifacts. It stores a large collection of software binaries together with their corresponding metadata in a well-defined structure, characterizing the exact version, date of upload and list of dependencies towards other artifacts. Preaching for reusability and ease of dependency management since its launch in 2004, Maven Central keeps attracting open-source projects and software vendors, reaching nowadays111September 6, 2018 more than unique artifacts.
Maven Central holds a treasure-worth big data that can reveal valuable insights about software engineering processes, evolution, and trends thanks to recent advances in big data analysis techniques. However, it is currently extremely challenging to perform analyses at the scale of the whole Maven Central. First, dependency relationships among artifacts are not modeled explicitly and cannot be queried. This data should be made available in a format that is conveniently consumed by big data processing and analysis frameworks, to run Empirical Software Engineering studies. Second, exporting all data from Maven Central is highly time and resource consuming because of the huge number of artifacts.
In this work, we showcase the Maven Dependency Graph, a novel dataset that aims at letting the Software Engineering community run empirical studies on the whole Maven Central. This open source graph222https://zenodo.org/record/1489120 includes metadata about Maven Central artifacts, indexed by deployment date in the Gregorian calendar. The graph includes more than explicit dependencies between artifacts as well as other relationships to represent artifacts’ version precedence. Artifacts are described by the 3-tuple ‘GroupId:ArtifactId:Version’, distinguishing different versions of a given library (‘GroupId:ArtifactId’)333Throughout the rest of the paper, we use library to refer to the couple GroupId:ArtifactId. This represents 85% of all Maven artifacts and their dependencies, as of September 6, 2018.
Our second contribution comes in the form of Maven-graph procedures. These procedures aim at facilitating queries over the big Maven Dependency Graph. This collection of procedures implement common queries; such as artifacts retrieval in time or per version-range, and many other features. We provide a custom Neo4j [3] Docker image shipping the entire dataset, together with the procedures plugin. These procedures, as well as our Maven Miner tool that can collect a snapshot of Maven Central and store it into a graph database, are open-source and available online [4].
The Maven Dependency Graph is intended to answer high-level research questions about artifacts releases, evolution, and usage trends over time. It also provides a solid basis to select relevant subsets of artifacts for assessing specific software engineering challenges. The queries over the Maven Dependency Graph can range from pattern matching techniques, e.g., ‘How often do libraries release new versions?’, to advanced big data analysis, such as ‘What are the most influential artifacts in the Maven Central?’ or, even predictive models using machine learning, e.g., ‘What artifacts are more likely to be adopted or overlooked by the community?’.
The Maven Dependency Graph is related to the Maven Dependency Dataset [12] (MDD). This previous dataset captured a snapshot of the Maven Central on July 30, 2011 and aimed at supporting large-scale research on libraries’ releases and dependencies. Since then, the Maven Central has more artifacts and more dependencies. Hence, we believe that an updated dataset is valuable for the software engineering community. Yet, because of this huge growth, our dataset resolves dependencies only at the artifacts level, by opposition to MDD that abstracts dependencies at the source code level too.
II Description of the dataset
In this section, we provide a general overview of the dataset. First, we describe the data schema. Later we present the data retrieval methodology and tooling.
II-A Overview & Schema
We rely on a temporal graph-based representation to capture the artifacts’ dependency graph of the Maven Central. Figure 1 shows a simplified schema of the Maven Dependency Graph. Formally, , the Maven Dependency Graph, is defined as a tuple . is a set of nodes that model the Maven artifacts. Every artifact node has a timestamp referring to its deployment date. Each node holds a set of properties: its groupId, artifactId, version, and packaging. The property coordinates is used to identify artifact nodes uniquely. Its value comes in the form ’group:artifact:version‘. are calendar nodes, represented by dashed boxes in Figure 1. They operate as a proxy to artifacts timestamp release date property. Their main intent is to temporally index the artifacts by their release date. is a set of dependency relationships. Every can be regarded as a couple () where and are respectively the user and provider of a library. A dependency has a scope, which limits the transitivity of a dependency. is depicted by the label DEPENDS_ON in Figure 1. Finally, is the set of version precedence relationships, represented by the label NEXT. Every is described as a couple (,) where and are respectively a given artifact and its next release.
1
∀i,j ∈A, coord(i) = coord(j) ⟹i = j
∀i ∈A, coord(i) ≠∅
∀d ∈D, scope(d) ≠∅
Our schema adheres to a set of constraints, namely uniqueness and existence. Constraints (1) (1) (1) depict few of them. The first constraint assures that nodes are uniquely identified by their coordinates. Whilst, the remaining constraints assure that every resolved artifact contains some mandatory properties. Other constraints such as uniqueness of edges and calendar nodes are not covered in this paper.
II-B Descriptive statistics
The Maven Dependency Graph represents a snapshot of the Maven Central Repository from September 6, 2018. Descriptive statistics can be found in Tables I and II.
While the Maven Central index contains M artifacts, almost entries are duplicated, leaving us with 2.8M artifacts. We retrieved metadata and dependency information for artifacts identified by their unique coordinates in the form of GroupId:ArtifactId:Version. The missing artifacts are either deployed in another artifact repository or their pom.xml is corrupted. As shown in Table I, these artifacts belong to unique groups and represent libraries (i.e., collections of artifacts with different versions but similar groupId and artifactId). Libraries exist in versions on average, with a minimum of 1 version and a maximum of versions, totaling upgrade operations. Other percentile values of versions count are provided in Table II.
The Maven Dependency Graph has edges, i.e., directed dependency relationships, regardless of their dependency scope. The graph has a density of . We call outgoing edges dependencies, while incoming edges are usages. Table II provides the minimum and maximum values of usages and dependencies, as well as the percentile values.
| Property | Number |
|---|---|
| Total artifacts | 2,407,335 |
| Libraries | 223,478 |
| Groups | 35,699 |
| Upgrades | 2,183,845 |
| Dependency relationships | 9,715,669 |
| Density | 4.03 |
| Percentiles | |||||
|---|---|---|---|---|---|
| 25th | 50th | 75th | min | max | |
| Dependencies | 2 | 30 | 89 | 0 | 402 |
| Usages | 0 | 38 | 405 | 0 | 47,951 |
| Versions | 2 | 110 | 485 | 1 | 2,182 |
II-C Data Collection Methodology & Tooling
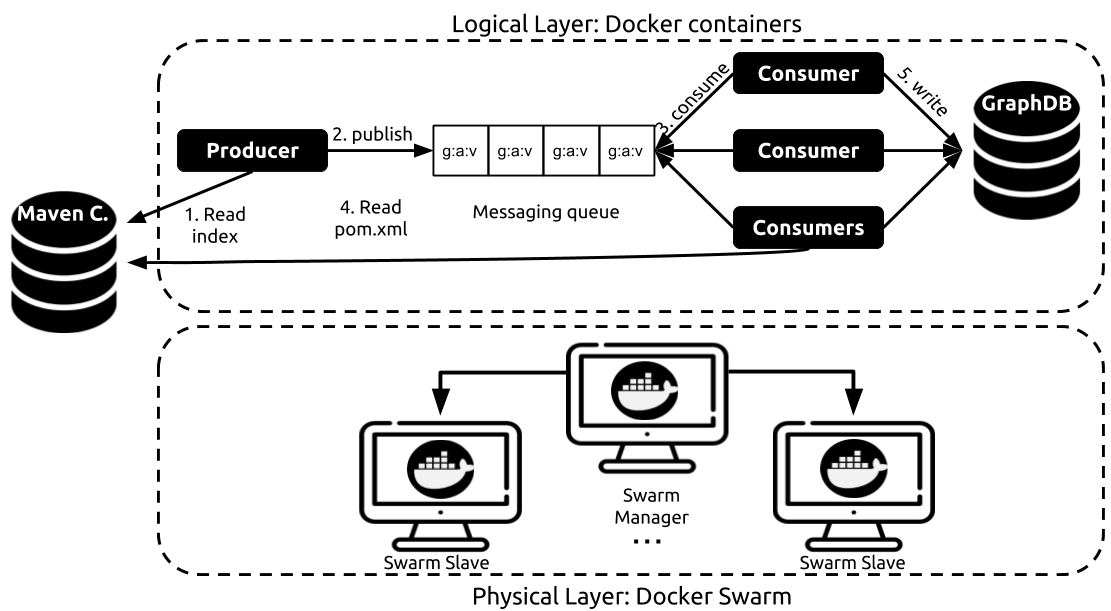
Data collection involved retrieving pom.xml files (at least one per artifact) from Maven Central, parsing them to retrieve metadata, and finally storing this information into a graph database. This a time-consuming process that we distributed on top of a Docker Swarm cluster. Figure 2 shows the overall architecture and methodology. The process ran on a cluster of 4 identical machines running an Ubuntu 18.04 LTS. Each machine has 16 Gb of RAM and 4 identical CPUs (MD A10-7700K APU with Radeon(TM) R7 Graphics, 2.105 GHz). One machine played the role of a Swarm Master while the others were Swarm Slaves.
We rely on a producer-consumer pattern to distribute the computation (upper part of Figure 2). The producer is responsible for reading the Maven Central Index, wrapping artifact coordinates into messages, and publishing them in a shared messaging queue. On the other side, each consumer retrieves one artifact coordinate at a time. For each artifact, the consumer resolves the artifact’s meta-data as well as its direct dependencies and store them in a graph database. Finally, the consumer acknowledges the broker having finished processing the message. In case of a consumer failure, the message broker puts back the message in the queue. Note messages are removed from the queue only if the corresponding consumer acknowledges so. Moreover, a message is processed by only one consumer at a time. When all artifacts are resolved, a post-processing phase is responsible for creating artifacts versions chains.
For message queuing, we use RabbitMQ [11], a scalable and widely used message broker. As for the graph database backend, we rely on Neo4j [3], one of the most popular NoSQL databases. It comes along with a powerful SQL-like graph query language, Cypher [2]. This simplifies the exploitation of the dataset in a very simple manner. Finally, to fetch artifacts from Maven Central and resolve their direct dependencies, we use Aether [14] Eclipse, a Java library to manage artifact repositories.
III The Maven Dependency Graph in Action
We have implemented a graph-based persistence backend for the Maven Dependency Graph. This allows interested users to exploit the dataset through the Neo4j web interface, leveraging the Cypher graph querying language [2]. Cypher is an open-source declarative language to specify graph queries with patterns. Multiple drivers have been implemented around Cypher, allowing its integration in other graph databases, such as SAP HANA, or distributed processing frameworks like Spark and Hadoop [9].
To further simplify queries on Maven Dependency Graph, we leverage Cypher procedures and functions. This mechanism supports the extension of Cypher by writing custom code, deploying it into the database, and calling it from Cypher. We have implemented a set of functions and procedures to simplify the description of queries involving versions comparison, artifacts selection by versions’ range or by date. Listing 3 shows a usage example of such functions. A complete list of Maven-graph procedures can be found online [5].
In the following, we illustrate some usage examples.
The artifacts deployed in 2018
Listing 1 lists all the artifacts that have been deployed during and use ‘Junit’, regardless of the scope.
Number of versions per library
This example shows how to make use of the precedence relationship (NEXT) to compute the number of versions per library. Listing 2 depicts the corresponding Cypher query. The query runs in two steps. Given a node with no incoming edges, it selects the longest path of the NEXT relationship and returns its length, together with the nodes’ groupId and artifactId. The second step simply selects nodes with neither incoming nor outgoing Next relationship and return 1 (i.e. one version) together with the groupId and artifactId. The results of the two steps are aggregated using the UNION operation.
Artifacts using older ‘JUnit‘ versions compared to libraries they are using
The query in Listing 3 simply selects all the nodes and where depends on , only on the ‘Test’ scope, but uses an older version of JUnit than . We use our custom procedure to check versions precedence. It takes as parameters an artifact node and a version as a String and returns true if the node’s version is strictly older than the given version. We use the label ‘junit’ instead of ‘Artifact’ to avoid checks on the groupId value and speed up query execution, relying on labels indexes.
IV Research opportunities
In this section, different types of empirical analyses that can leverage our dataset, as well as some research opportunities it can open up.
-
1.
Libraries maintenance: Java Libraries continuously evolve by releasing new versions with new functionality or enhanced performance. However, in some cases, clients decide not to upgrade their dependencies to newer versions. As a result, library maintainers may decide to continue maintaining parallel versions. When does this phenomenon happen? When do project maintainers decide to maintain two parallel versions? Why? Who are the clients that stick with an older version? To answer these questions, we should first identify libraries that keep on maintaining multiple versions. The Maven Dependency Graph can help to identify these projects, by comparing versions precedence of artifacts and crossing them with their release date. Subsequently, we can identify the clients that keep using older versions. Another side-effect to libraries evolution is the growing complexity of latest releases. When facing such issues, libraries’ maintainers decide to decompose the library into different ones, ending this library’s lifetime. Another interesting point could also be detecting two or more artifacts merging into a single one. The Maven Dependency Graph supports the empirical inquiry of this kind of behavior.
-
2.
Libraries adoption trends: Wisdom of the crowd Vs. Hype-driven development Vs. legacy This question focuses on end-users instead of library maintainers. What are the motivations that steer their decision to use a specific library? Do they behave according to Rogers’ theory [13] of Diffusion of innovation? Are there any organizational or social factors influencing these decisions? The wisdom of the crowd principle favors the collective opinion of a group of individuals rather than that of a single expert. It has been used as a form of crowd-sourcing in software engineering for numerous tasks [7]. In particular, Mileva et al. [8] encourages the wisdom of the crowds as a principle to assess developers deciding which library versions to use, and thus, avoiding some pitfalls experienced by other developers. However, many lead developers have been warning about the doom this might bring to their products. This anti-pattern development is called Hype-Driven Development. A more recent work et al. [1] leverages the same principle to recommend consented library updates. Their recommendation system relies on a graph that is very similar to our dataset. To evaluate their approach, they constructed a graph containing nodes of maven unique artifacts. We believe that a replication with the Maven Dependency Graph that is 3 orders of magnitude larger would improve the quality of such recommenders.
-
3.
House of cards Vs. sustainable software: In 2016, Sonatype analyzed applications and showed that had at least one security flaw tied to the use of a vulnerable library [15]. What are these libraries that once are vulnerable? How much vulnerable are these clients? A recent work [6] attempted to answer a similar question by studying the state of dependency update practices and the structure of dependency networks in JavaScript projects. Pashchenko and colleagues [10] introduced the concept of halted dependencies to describe the libraries that are no longer maintained. Together with other information extracted from code repositories, and using code-based analysis of patches, the authors were able to implement a methodology to assess developers quantifying the vulnerability of their tools when using 3rd-party libraries. We believe that the Maven Dependency Graph is perfectly fit to answer this kind of questions.
V Availability
We used Maven-miner, a set of tools and facility scripts, to collect the Maven Dependency Graph. The source code of Maven-miner is publicly available online [4]. Maven-miner runs in different setups, standalone, docker-compose mode, or docker-swarm mode. Ready to use Docker images and scripts are also available online. Instructions on how to the Maven-miner scripts can be found in the wiki section of the tool’s repository. Note it is discouraged to use the standalone mode to resolve all the dependencies in the Maven Central as it may take months to finish. The standalone mode is only intended to resolve a small set of artifacts.
The Maven Dependency Graph is publicly available and accessible from the tool’s repository. For ease of use, it comes in the form of docker images shipped with all the facility procedures simplifying data exploitation. For use outside of the Neo4j ecosystem, we have also released CSV files. The entirety of data can be found online:
https://zenodo.org/record/1489120
VI Limitations & threats to validity
Due to some technical limitations, we were, not able to resolve all the information about existing artifacts in the Maven Central. In particular, we do not consider artifacts dependencies that are hosted outside of the Maven Central repository. For this reason, some metrics like libraries usage and dependencies may not reflect the reality. Moreover, our dataset lacks some low-level information such as excluded dependencies. Consequently, querying the dependency tree of a given artifact may result in a super-set, including conflicting dependencies.
Although the proposed schema was designed to improve queries execution, very complex queries involving computation expensive operations, such as transitive usages traversals, require a significant computation power. Finally, our collection is limited to the Maven Central repository, any findings reflect only the state of practice in the Maven repository, and it should not be generalized.
VII Conclusion
We presented the Maven Dependency Graph, an open-source dataset that aims at enabling the Software Engineering community to conduct large-scale empirical studies on Maven Central. To ease the exploitation of this dataset, we provide a custom Neo4j Docker image shipping the entire dataset. It comes along with a very large collection of procedures implementing common graph queries and utility functions. We also introduced Maven Miner, a set of tools that enable the collection of the Maven Dependency Graph. Both Maven Dependency Graph and Maven miner are open-source and publicly available online.
References
- [1] Raula Gaikovina Kula, Coen De Roover, Daniel M German, Takashi Ishio, and Katsuro Inoue. Modeling library dependencies and updates in large software repository universes. arXiv preprint arXiv:1709.04626, 2017.
- [2] Neo4j Inc. Cypher, 2018. [Online]. Available: https://neo4j.com/developer/cypher-query-language/. [Accessed: 13- Nov- 2018].
- [3] Neo4j Inc. Neo4j, 2018. [Online]. Available: https://www.neo4j.com/. [Accessed: 13- Nov- 2018].
- [4] Inria. Maven-miner, 2018. [Online]. Available: https://github.com/diverse-project/maven-miner/. [Accessed: 13- Nov- 2018].
- [5] Inria. Maven-miner procedures, 2018. [Online]. Available: https://github.com/diverse-project/maven-miner/wiki/Maven-Miner-Procedures. [Accessed: 13- Nov- 2018].
- [6] R. Kikas, G. Gousios, M. Dumas, and D. Pfahl. Structure and evolution of package dependency networks. In 2017 IEEE/ACM 14th International Conference on Mining Software Repositories (MSR), pages 102–112, May 2017.
- [7] Ke Mao, Licia Capra, Mark Harman, and Yue Jia. A survey of the use of crowdsourcing in software engineering. Journal of Systems and Software, 126:57–84, 2017.
- [8] Yana Momchilova Mileva, Valentin Dallmeier, Martin Burger, and Andreas Zeller. Mining trends of library usage. In Proceedings of the Joint International and Annual ERCIM Workshops on Principles of Software Evolution (IWPSE) and Software Evolution (Evol) Workshops, IWPSE-Evol ’09, pages 57–62, New York, NY, USA, 2009. ACM.
- [9] OpenCypher. Opencypher usages, 2018. [Online]. Available: https://www.opencypher.org/projects. [Accessed: 13- Nov- 2018].
- [10] Ivan Pashchenko, Henrik Plate, Serena Elisa Ponta, Antonino Sabetta, and Fabio Massacci. Vulnerable open source dependencies: Counting those that matter. In Proceedings of the 12th International Symposium on Empirical Software Engineering and Measurement (ESEM), Oct 2018.
- [11] RabbitMQ. RabbitMQ, 2018. [Online]. Available: https://www.rabbitmq.com/. [Accessed: 13- Nov- 2018].
- [12] Steven Raemaekers, Arie van Deursen, and Joost Visser. The maven repository dataset of metrics, changes, and dependencies. In Proceedings of the 10th Working Conference on Mining Software Repositories, MSR ’13, San Francisco, CA, USA, May 18-19, 2013, pages 221–224, 2013.
- [13] Everett M Rogers. The diffusion of innovation 5th edition, 2003.
- [14] Sonatype. Aether, 2018. [Online]. Available: https://wiki.eclipse.org/Aether/What_Is_Aether. [Accessed: 13- Nov- 2018].
- [15] Sonatype. Sonatype releases 2016 state of the software supply chain report, 2018. [Online]. Available: https://www.sonatype.com/press-release-blog/ssc-press-release. [Accessed: 13- Nov- 2018].