Measurements As First-class Artifacts
Extended Version
Abstract
The emergence of programmable switches has sparked a significant amount of work on new techniques to perform more powerful measurement tasks, for instance, to obtain fine-grained traffic and performance statistics. Previous work has focused on the efficiency of these measurements alone and has neglected flexibility, resulting in solutions that are hard to reuse or repurpose and that often overlap in functionality or goals.
In this paper, we propose the use of a set of reusable primitive building blocks that can be composed to express measurement tasks in a concise and simple way. We describe the rationale for the design of our primitives, that we have named MAFIA (Measurements As FIrst-class Artifacts), and using several examples we illustrate how they can be combined to realize a comprehensive range of network measurement tasks. Writing MAFIA code does not require expert knowledge of low-level switch architecture details. Using a prototype implementation of MAFIA, we demonstrate the applicability of our approach and show that the use of our primitives results in compiled code that is comparable in size and resource usage with manually written specialized P4 code, and can be run in current hardware.
I Introduction
Historically, network measurement’s evolution paralleled the growth of the Internet but at a much slower pace. SNMP, ping, and traceroute constituted the bulk of measurement-related aids for a long time. The introduction of SDN has led to significant work on various aspects of programmable network infrastructures. An SDN controller can dynamically install and modify switch rules, enforce high-level operator policies and gather statistics. Starting from the original white paper[1] various aspects of SDN (and particularly OpenFlow[2]) have been examined in depth. Unfortunately, measurement, a well-understood requirement for the Internet, with a long body of developed work for over two decades, appears to have been an afterthought in SDN’s development. In fact, [1] mentions security a dozen times (rightfully so) but the words measurement or metrics do not appear in it.
Given measurement’s importance in network operation and management, there has been a flurry of work on exploiting SDN features and programmable switches to perform more powerful measurement tasks. Beyond OpenFlow, proposals like OpenState [3] and switch programmability as in P4 [4] have enabled richer, customizable in-network processing that can implement measurements for fine-grained traffic and network performance statistics [5, 6, 7]. Most of the recent work in this area focuses on efficiently mapping measurement tasks on programmable forwarding elements. Efficiency is key as current programmable switch chips have limited computational and memory resources [8, 5, 7, 9].
An important requirement that has not been addressed in prior work is flexibility and extensibility in supporting a variety of measurement tasks; instead we have ad-hoc solutions proposed for specific measurements. In spite of advances in programmable data planes, it is not possible without significant effort to combine, reuse or repurpose existing solutions although they may partly overlap in functionality or goals.
We instead argue for supporting flexible measurement through a set of reusable building blocks (primitives) that take advantage of novel features of programmable forwarding elements and span most of the commonly performed measurement tasks. We identify a set of such primitives that network operators can use to express measurement tasks in a concise and simple way. Further, they are reusable as complex tasks can be expressed by composing a few calls to a subset of our measurement primitives.
We define our approach as Measurements As FIrst-class Artifacts, or MAFIA for short. Concretely, we instantiate our ideas as an API that provides an abstraction over measurement primitives that execute at line rate in the data plane. We remark that our primary target is network operators, who are not proficient data plane programmers, yet they desire to quickly address performance-, security- and troubleshooting-related measurement needs. As such, our goal is not satisfied by and is orthogonal to data plane programming languages like P4. These technologies are an enabler for MAFIA but remain fundamentally lower-level approaches.
Our work is informed by the large number of legacy measurements that have been carried out routinely in large and small networks as well as new ones in the SDN milieu. We identify the primitives for measurement on the basis of their breadth of applicability and the ability for maximal reuse (i.e., a good implementation can yield rich dividends in a broad set of contexts). We are driven by four key considerations inherent in measurement [10]: what, where, when, and how. We validate our idea by showing that several key known SDN measurements and some new ones can be built by composing our abstractions. Our primitives can be used to answer questions ranging from network-wide traffic characteristics (e.g., flow size distributions, identifying heavy hitters [11, 12, 13, 14], to fine-grained monitoring of properties of flows and switches (throughput, latency, loss, etc.) [15, 16, 17, 18, 19], to verification (traffic behavior matching operator’s intent) [20], to debugging (e.g., troubleshooting root causes of performance problems or switch/controller misbehavior) [21, 22], and various security aspects (e.g., anomalies, DDoS, malicious activity) [13, 14].
|
|
|
HOW Legacy SDN | |||||||||||||||||
|---|---|---|---|---|---|---|---|---|---|---|---|---|---|---|---|---|---|---|---|---|
|
Traffic Eng. |
|
|
SNMP; NetFlow; sFlow Counters; Samples; Sketches | |||||||||||||||||
|
Performance |
|
|
|
SNMP; NetFlow; sFlow Counters; Probes; Samples; Bloom filters; Sketches | ||||||||||||||||
|
Verification |
|
Config. Analysis - Tags; | ||||||||||||||||||
|
Troubleshooting |
|
|
|
|||||||||||||||||
|
Security |
|
|
|
|
||||||||||||||||
We contribute the following: i) We identify a set of programmable and reusable primitives that can be supported by switches to realize flexible measurement tasks; ii) We show how our primitives can be composed and applied to a wide variety of measurements due to their orthogonality; iii) We develop a MAFIA prototype that compiles measurements expressed through our API into equivalent P4 codes that can execute in current P4-compliant programmable switches. We show that our abstractions reduce development effort of measurement tasks while the resulting P4 code is, in size, only marginally larger than the hand-written version, and can be mapped to hardware with a modest use of resources. MAFIA is released at https://github.com/paololaff/mafia-sdn.
II On Measurement Primitives
A core tenet of our work is that many of the common network measurement tasks can be expressed by composing primitives that can be supported by current and future programmable forwarding elements. But what is a good primitive? Functions that are routinely applicable for a range of measurement needs is a candidate given its potential for reuse. Functions also need to be composable to express more complex tasks. They should be sufficiently low-level to be broadly applicable but sufficiently high-level to reduce effort.
However, modern data rates of high-speed networks impose stringent per-packet processing requirements. Thus, primitives should have low processing and state complexity so they can be implemented in programmable forwarding elements.
Finally, the primitives need not be novel; instead, we seek to ground our choice on functionalities that have proven themselves useful in various contexts. We survey prior work, studying a range of measurement scenarios in traditional networking and in SDN environments before describing the set of our primitives.
Measurement Scenarios: We performed an analysis of the extensive related work in network measurements. We examined five key categories that have historically dominated work in this area: traffic engineering[11, 12, 23, 13, 24, 14], performance monitoring[15, 16, 17, 18, 19, 5, 7], verification[25, 26, 20], troubleshooting [22, 21, 7] and security[13, 24, 14].
While in legacy networks, SNMP, NetFlow and sFlow were still the tools (despite being ineffective in enabling visibility into the details of individual flows), in SDN context, packet and byte counters available from OpenFlow matching rules help[15] in calculating throughput, port/link utilizations and packet loss with their exact information. Polling frequency is traded off against computational cost. Sampling is an option[16] if protocol-specific information like sequence numbers are available to correct the estimation phase. Novel approaches have also proposed compact data structures and algorithms based on Bloom filters to monitor the number of packets for each flow[17] as well as packet losses[17, 18]. Sketches can as well be used for these measurement scenarios to provide approximate counters for a group of flows. Programmable forwarding elements are also enabling stateful tracking of flows directly in the switches[19].
Table I summarizes the main measurement categories and captures the differences between traditional and SDN environments. We identified common factors exploited for measurement-related problems. The mechanisms used in previous measurements (shown in the last two columns) are particularly relevant for our work, as they helped us identify a small set of key primitives usable in a broad range of use cases. We build on this small set of building blocks to provide flexible, programmable measurements for most of the known measurement tasks.
Selecting the Primitives: Examining the various techniques that have been proposed, we see that for each measurement-related problem, up to different, ad-hoc solutions existed. Implementing them in every switch is impractical. Many of these mechanisms overlap in intent and functionality and cannot be easily repurposed to address different questions. To expose operators to the unnecessary complexity of figuring out the nuances of the different variations of roughly equivalent mechanisms makes production of new measurement code harder. To avoid these pitfalls, we have identified a core set of primitives that allow us to express the vast majority of common measurement tasks and some new ones hitherto unaddressed. These primitives are orthogonal and can be combined to express complex measurement tasks. They are: Match, Tag, Timestamp, Sample, Counter, BloomFilter, Sketch, and Window. We argue that switches should provide support to perform these primitive measurement operations. As shown in §V, this set supports a wide range of measurement needs and can be mapped to hardware with a modest use of resources.
III MAFIA
A measurement task in MAFIA is expressed by combining primitives through the sequential and parallel composition operators. Semantically, a task is a function that processes a stream of packets using our primitive-oriented operators (or simply primitives). Operators take a packet as input, optionally modify state and produce either a packet as output or the null value to stop its processing. A task also includes flow key definitions to group packets into flows (e.g., the IP 5-tuple) and a declaration of state variables to be used by stateful operators.
We note that measurement tasks neither interact nor influence forwarding logic. Once a packet is consumed by a measurement task, processing for that packet logically ends and, subsequently, the forwarding logic is applied until the packet leaves the switch (or gets dropped).
The input stream denoted as pkts represents the stream of all received data packets. The input stream denoted as ctrl captures instead the packets received from the SDN controller. Additionally, named logical streams can be created by sampling packets; a sampled packet is duplicated and injected in a logical stream to be processed further. Each primitive executes well-defined operations on the packets in the stream as per its semantics. Our examples given below illustrate the use of our primitives on the different streams.
When describing a measurement task using MAFIA the user is oblivious to where the primitives are executed. In this paper we focus on compiling the primitives such that they can be executed in a programmable switch ASIC. However, our work can be extended to compile MAFIA to other targets, such as software switches or smart NICs.
We now give an overview of MAFIA primitives (§III-A). We then describe how primitives compose (§III-B) and discuss how we implement measurement intervals (§III-C). Finally, we use the example of detecting heavy hitters to detail how MAFIA works and the nature of code that network operators would write while using our API (§III-D).
III-A MAFIA Primitives
We categorize primitives in 4 classes: i) to perform filtering (Match); ii) to manipulate packets (Tag and Sample); iii) to manipulate state (Timestamp, Counter, Sketch and BloomFilter); and iv) to control the measurement interval. Table II presents a summary of these primitives, their API, and hints of their implementation in P4. We now describe each primitive’s functionality and then discuss the required resources.
Match: Filters and selects classes of packets by parsing and inspecting the content of packet headers. Provides conditional tests on state, allowing detection when some condition holds.
Tag: Modifies or adds a header field to the packet. Tagging is useful for piggybacking measurement data to other entities in the network, notifying a controller, or disseminating information to other devices.
Sample: Makes a (logical) copy of the current packet, separating the stream of samples from the original input stream. Permits to send sampled packets to external entities like a controller or a collector[16, 22].
Timestamp: Reads the local clock at the switch. The ability to derive time-related information is essential to detect timeouts or estimate latency and packet inter-arrival times[27]. Switches are not assumed to have synchronized clocks.
Counter: Keeps track of measurable quantities such as number of bytes, packets, etc. Counters are the standard support for statistics in OpenFlow[2], first realization of SDN, and in traditional telemetry systems (NetFlow). Numerous approaches successfully leveraged counters [12, 11, 15].
BloomFilter: Allows for efficient implementations of membership sets. Permits to dynamically filter specific flows. Extensions to the counting Bloom filer algorithm can also be used to store measurement state[17, 18].
| Primitive | API | P4 Implementation | ||
| Tables | Actions | LoC | ||
| Match | match(conditional) | 1 | builtin | 9 |
| Tag | tag(header_field, expr) | 1 | 1 | 9 |
| Sample | duplicate(stream) | 1 | 1 | 22 |
| collect(endpoint) | 1 | S | S | |
| Timestamp | timestamp(t) | 1 | 2 | 10 |
| Counter | set, reset | 1 | 4 | 12 |
| BloomFilter |
membership:
{insert, test, reset, init}. |
1 | ||
|
counting:
{set, reset, init, all, any, sum, avg, min, max} |
1 | |||
| Sketch |
pcsa/hll:
{update, test, reset} |
|||
|
count-min:
{set, reset, sum, avg, min, max} |
1 | |||
|
store:
{set, reset, all, any, sum, avg, min, max} |
1 | |||
| Window | window | (variable) | ||
Sketch: Compact data structures to hold summaries of large datasets with provable accuracy bounds. Sketch families include counting algorithms (count-min sketch) and cardinality estimators (PCSA, Hyperloglog)[13, 24].
Window: Allows to specify the duration of the measurement interval (see §III-C).
Table II’s right columns depict the number of P4 tables and actions needed to implement each primitive, with the total number of LoC (Lines of Code). The collect operation of the Sample primitive requires a number of actions dependent on the method of samples collection (e.g., forwarding to a monitoring server that is directly attached vs. via IP encapsulation). BloomFilter and Sketch require an amount of code proportional to the hash functions used; for these cases, a min-max range is given. Match does not require any custom action. Window yields code dependent on the size of the structures that need to be reset (see §III-C).
III-B Combining Primitives
Primitives can be composed to express complex measurement tasks. We consider two forms of composition: sequential and parallel (somewhat similar to NetKAT[28]).
Sequential composition
Primitives can be composed in serial order using the operator . The composition: indicates that must be executed first, then , etc. The execution of each primitive takes into account the effects of the previous primitive. That is, operators’ side effects (e.g., updating a counter) are made visible as soon as they execute. This is different from NetKAT, which models policies as pure functions. Note that operators that follow a Match are only executed if the conditional evaluates to true.
Parallel composition
Primitives can be parallelized via the operator ; the expression executes the primitives independently and applies multiple disjoint measurement operations to the packet. Note that the API does not prevent two parallelized primitives to execute concurrent operations on the same set of state variables. In general, to prevent any inconsistency at runtime, our intention is for read-write and write-write conflicts to be detected ahead of time through static analysis (left for future work).
III-C Measurement Interval
MAFIA allows the user to assign a measurement interval to any measurement task. The purpose of specifying an interval is to avoid state overflowing and thus corruption of measurement results. At the end of each interval, data structures are reset to their initial values before a new interval is initiated. The measurement interval is specified in time units (in the current version, in seconds) using the window operator.
When a measurement interval is specified, a composition has two modes of operation. The measuring mode, where the primitives are invoked as specified by the measurement task, and a resetting mode, during which the state of the primitive’s state is reset. Given that there is a limited amount of instructions that can be executed at line rate, full reset of the data structures cannot be done atomically (i.e., it can take too long to reset all the data structures at once). To circumvent this limitation, all our data structures support incremental reset. When operating in resetting mode, at each packet processing, incremental reset is invoked, which clears a portion of the data structure. The resetting mode persists, advancing incrementally each time a packet is received, until all portions of the data structures have been reset; at that time a new measurement interval is initiated. The time required to perform the reset can be minimized by exploiting spare resources in the switch pipeline to maximize the amount of cleared state at each packet. The actual length of the resetting phase depends on the amount of memory used by the measurement and on the packet inter-arrival times.
III-D MAFIA by Example
We present the flavor of the MAFIA API through a use case and discuss the abstractions on which it relies, as well as detailing the behavior of the measurement primitives.
Consider the problem of identifying heavy hitters, i.e., flows that consume more than a fraction of link capacity. Typical approaches to this problem consist of installing forwarding rules associated with counters to monitor flows [12, 23]. However, limited switch memory makes it impossible to install a separate rule for each flow; the common strategy is to monitor a set of aggregates (i.e., grouping classes of flows at coarse granularities) and then zooming in on the ones most likely to contain heavy flows. Unfortunately, this technique introduces a detection delay since it counts in several consecutive time intervals. Other approaches adopt approximate algorithms such as the count-min sketch to approximately count the size of flows [13, 24]. A monitoring server can then retrieve the sketch data from the switch to compute the identifiers of the top-k largest flows. Although sketches can provide provable bounds on the estimation error, collisions between different flows are workload-dependent and hard to predict.
Instead, we combine these approaches to obtain fast detection with accurate results. MAFIA allows to do so by flexibly composing a few primitive operations. The algorithm works in two phases. First, it identifies potentially large flows using a count-min sketch. After a flow has been detected as a possible heavy hitter (by checking against a user-defined threshold), its identifier is encoded in a Bloom filter. The filter keeps track of the set of suspected flows, whose packets will then be monitored using exact counters instead of using a sketch. Next, we send alarms to a controller whenever suspected flows are inserted in the filter. The corresponding MAFIA code (Listing 1) consists of two main parts: i) measurement state declarations and ii) the composition of primitives.
III-D1 Measurement state
Lines 1-8 present an example of state declaration for the considered measurement.
Keys
Keys allow us to group packets to flows and map them to measurement state. Each state variable can be configured to maintain multiple instances of the same primitive’s state. This is done using a hash map that, through a hash function of the key, obtains an index at which to hold flow state. Hash maps are meant to be simple container abstractions and do not handle potential hash collisions on different keys in our implementation. Eviction techniques for collision handling such as the one adopted in [5] are amenable to be used within our approach. Bloom filters and sketches adopt a set of hash functions to implement the mapping of packets to state.
State
State is important in a wide range of measurement needs, including tracking traffic conditions, filtering events and maintaining statistics or counters. State is maintained in the data plane and updated at line rate.
State is declared as named variables for stateful primitives. In the example (Lines 2-8), we have i) a counter total, which is used to track the total volume of flows received on an input port; ii) a sketch nbytes using a count-min algorithm to approximately measure the volume of a set of flows; iii) a membership Bloom filter hh holding the set of flows to be monitored by exact counters; and iv) an hash map of counters hh_bytes used to track the volume of heavy hitters.
Declaration of state variables is required by primitives manipulating them (i.e., Timestamp, Counter, Sketch and BloomFilter). Variables of these types all require some parameters, such as the width of counters (in bits), the number of hash functions nhash for sketches and Bloom filters, etc.
MAFIA does not mandate how state is consumed. In certain contexts, the maintained state serves as a filter to pick up interesting packets or flows that need to be collected at monitoring servers. In other contexts, the maintained state (e.g., flow counters, volume sketches) is the information of interest; this information can be queried in-band (as in [29]) using Tag, or via switch-specific APIs (beyond our scope).
III-D2 Composition of primitives
A composition of primitives is the core part of a measurement task in MAFIA. In Listing 1, two compositions of primitives (Lines 12-21 and 23-24) implement the heavy hitter monitoring and controller alarms, respectively. The entry point is at Line 11.
First, we select (Line 12) from the pkts stream all packets from a given input port (PORT) using the Match primitive with a conditional on the pkt’s input port field. Recall packets are parsed into tuples and we allow expressions on packet header fields and metadata via intuitive keywords (e.g., ipv4.src for the IP source address, pkt.size for the packet size). The available packet headers are the ones that derive from the switch packet parsing procedure. Then, we maintain (Line 15) a total count of traffic volume ingressed.
Next, depending on whether the current packet belongs (Line 14) to the set of heavy hitters (hh) or not (Line 21), one of two things happen. As these are independent, we express them as a parallel composition guarded by the (mutually exclusive) tests on the hh BloomFilter. Lines 15-19 measure flows not (yet) suspected to be heavy hitters, while Line 21 measures the heavy hitters. In the first case (non heavy hitter), we update (Line 15) the flow’s volume in the nbytes Sketch and then we query (Line 16) the count-min sketch to check whether the flow’s estimated bandwidth utilization is above . We insert (Line 17) flows that exceed the threshold into the hh Bloom filter and we raise (Line 19) an alarm for each such flow, by duplicating the packet into the hh_alarms stream. In the second case (heavy hitter), we update (Line 21) the flow’s volume tracked by an exact counter in hh_bytes, which is initialized in Line 19 with the current value of the sketch when the heavy hitter flow is flagged.
The last part of the code, on Lines 23-24, handles the duplicated packets generated whenever a flow is detected as heavy hitter. We tag the packets with the current flow volume from the sketch and forward them to the controller node processing these alarms. The counter values of flows identified as heavy hitters can be queried by the controller using control requests: Lines 26-29 handle this case. We match control traffic for specific requests (Line 34) and, as a response, we tag the queried value (Line 29). Note that the controller needs to know the counters where the queried value is. We use a straightforward solution: given that flagged flows are sent to the controller as alarms, the controller can use packet crafting techniques[30] to forge the necessary header values when querying the switch state.
This example, addressed with only 29 lines of code, is able to improve measurement efficacy when compared to the common black-box solutions using only sketch-based algorithms or exact counters. It merges the benefit of small memory requirements of sketches to identify which flows should be monitored (reducing the number of expensive counters to be employed) with the precision of exact counters to determine the volume of heavy flows (thus eliminating estimation errors due to hash collision in the sketch). Collisions in the bloom filter maintaining the current set of heavy hitters that may pollute the exact counters of the heavy flows can be rendered unlikely at a small cost to memory.
IV Implementation
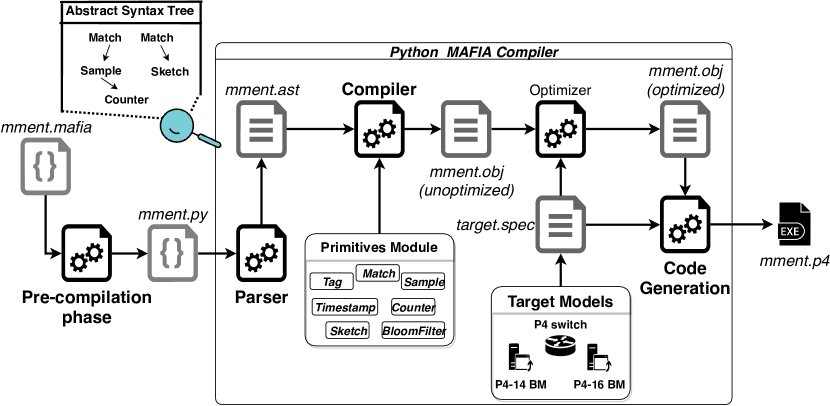
We implement MAFIA as a small domain specific language embedded in Python. Although our approach is not tied to any particular programmable forwarding element implementation, as backend we target PISA (Protocol-Independent Switch Architecture) [8] switches programmed in P4. Our implementation consists of a compiler (around 4,500 lines of code in Python) that takes a MAFIA measurement as input and produces an equivalent P4 program.
The compilation process is illustrated in Figure 1. We follow a compilation sequence composed of the five phases enumerated below. For brevity, we highlight the salient details. A pre-compilation phase translates a MAFIA code into Python. Then, the corresponding AST (Abstract Syntax Tree), where operators are nodes of the tree, is built. The compiler then produces an intermediate representation of unoptimized P4 code by analyzing the primitive composition and translating it into a set of tables and actions. These are the P4 processing blocks (packet functions) of MAFIA code, whose execution is controlled via a sequence of P4 table calls that is determined by the compiler analyzing how primitives were composed via the and operators. Then, an optimization phase takes as input a target’s model specification, and produces the code optimized for the target’s architecture. This optimization phase accounts for the different target capabilities and handles differences in syntax of dialects of P4 (P4-14, P4-16). Finally, the process generates P4 code for tables, actions and registers. Extending our solution to target different architectures, software switches or smart NICs, is left as future work. Table II shows the number of P4-14 lines of code and the number of tables and actions necessary to implement each primitive.
V Evaluation
We evaluate our approach along three axes. We assess the expressiveness of MAFIA by implementing 13 measurement tasks that are routinely done along with some new ones. We then compare the efficiency of the P4 code generated by our compiler by contrasting the complexity of MAFIA implementation of these tasks with a manual implementation. Finally, we show the feasibility of our approach by assessing the hardware resource required to deploy each considered measurement use case on programmable switches.
V-A Expressiveness
The measurement tasks are enumerated in Table III. The MAFIA code for each use case can be found in Appendix A. Here, we focus on three novel measurements that demonstrate the re-usability and composability of our primitives: i) identification of congested flows by improving a state-of-the-art solution offered by INT (In-band Network Telemetry) [25]; ii) measurement of path changes and iii) and monitoring of the distributed coordination of a novel path update protocol, ez-Segway [31]. Some of these tasks require deploying measurement tasks in different switches whose identity is assumed to be known at deployment time. As mentioned, we show capability of MAFIA in some new measurement tasks beyond well-known ones.
Top-k Congested Flows
Detecting flows that are experiencing large queuing delays in the network is important to guarantee quality of service and meet service level agreements. INT collects hop-by-hop information (e.g., queue occupancy, hop latency) for each packet by using a custom header, inserted to the packet at the network ingress point and stripped at egress point. However, potentially large per-hop information needs to be exported in order to be used for analysis. We can improve on this by using a simple composition of primitives and provide a stateful algorithm identifying the most congested flows. Listing 2 shows the MAFIA code for this measurement task. It has three code segments to be installed at different switches. 1) The first-hop switch marks the packet’s IP ToS field to indicate whether the measurement should be applied, and tags the IP ID field with the current queue occupancy level. 2) Intermediate switches check if the packet has been marked and update the tag by summing the local queue occupancy. 3) The last switch records the total amount of queuing encountered along the path using a count-min Sketch, which can be periodically queried to compute the top-k elements. Another Sketch using the same flow key instead tracks the total number of changes happening over time. We could add a Counter tagged in packets to track the number of hops traversed by each packet, useful to compute an average value of queue occupancy at each hop. A similar measurement could also sum up the queuing time experienced at each hop, using Timestamp.
Path Changes
Recently proposed load balancing mechanisms, such as flowlet switching [32], autonomously cause path changes without any coordination with a controller. One may want to monitor such mechanisms to understand how often a given flow changes its path. We show how such a task can be realized using MAFIA in Listing 3. To encode the path followed by a packet, we use a BloomFilter to store the packet location (i.e., the current switch ID and port), which is tagged into the packet’s IP ID field. The filter is updated at every hop, resulting in a compact representation of the path. At the last hop, we collect the tag, and save it inside a Sketch, which maintains the identifiers of the packet’s path.
The measurement checks, at every packet, if the carried path tag value is found in any entry held in the sketch (i.e., holding the flow status at the previous packet). If not, a path change is detected, and a count-min sketch tracking the amount of changes is updated. The controller can fetch the data at desired frequency to learn about path changes.
Path Change Coordination and Latency
Implementing path changes in SDN networks often involves updating forwarding rules in multiple switches. Lack of proper coordination in these changes may result in transient inconsistencies such as black holes, loops, or link overloads. There has been significant research effort in techniques to provide consistent forwarding updates in SDN. We focus our attention on ez-Segway[31], a technique that shortens the time required to perform consistent path changes by implementing a coordination mechanisms among the switches that requires the exchange of “GoodToMove” messages in a given order. We now describe a measurement that captures the partial order by which the “GoodToMove” messages are exchanged during the reconfiguration and also the time at which these messages are received by each switch involved in the task. This measurement can be used to find bugs in the coordination algorithm that may prevent the path change protocol from terminating and also to assess how long it takes to execute. The MAFIA code is shown in Listing 4. We detect the receipt of a “GoodToMove” message and generate a duplicate to be sent back to the controller. Both a local Timestamp and a logical clock are recorded and tagged before the copy is sent back to the controller via sampling. The use of logical clocks allows the controller to build a causal graph of the deployed updates, providing an execution log that can be queried for debugging and verification. If the controller’s and switches’ clocks are synchronized (e.g., via NTP), real timestamps permit the controller to estimate the time between change deployments and their actual occurrence.
| P4 LoC | ||||
| Measurement | (Manual) | (Compiler) | ||
| Use case | API: Primitives | raw | opt. | |
|
Flow volume and
duration |
3 Match;
3 Counter HashMap; 2 Timestamp HashMap; |
121 | 185 |
146
() |
|
Approximate
flow volume |
1 Match;
1 Sketch (count-min) |
107 | 120 |
120
() |
|
Flow
cardinality |
1 Match;
1 Sketch (PCSA) |
86 | 92 |
92
() |
|
Flow
cardinality |
1 Match;
1 Sketch (HyperLogLog) |
96 | 102 |
102
() |
|
Counter
thresholds |
5 Match;
2 Counter HashMap; 2 Sample |
139 | 193 |
170
() |
|
Stochastic
sampling |
2 Match;
1 Tag; 1 Sample; |
103 | 126 |
118
() |
|
Deterministic
sampling |
5 Match;
3 Counter HashMap; 1 Tag; 1 Sample; |
131 | 207 |
167
() |
|
Postcard
generation |
2 Match;
4 Tag; 1 Sample; |
94 | 121 |
101
() |
|
Trajectory
encoding |
5 Match;
1 BloomFilter; 1 Timestamp+HashMap ; 6 Tag; 1 Sample; 1 Counter; |
244 | 299 |
260
() |
|
Two-phase
heavy hitter |
4 Match;
1 Counter; 1 Counters HashMap; 1 Sketch (count-min); 1 BloomFilter; |
261 | 345 |
281
() |
|
Top-k
congested flows |
3 Match;
1 Counter; 2 Sketch (count-min); 3 Tag; |
198 | 240 |
204
() |
| Path changes |
3 Match;
1 Sketch (count-min); 1 Sketch; 1 BloomFilter; 1 Tag; |
325 | 389 |
345
() |
|
Path change
latency |
2 Match;
1 Timestamp; 1 Sample; 1 Tag; |
38 | 44 |
41
() |
V-B Efficiency
Table III shows the number of MAFIA primitives required to specify each of the considered use cases. The table also compares the number of LoC needed to implement the measurement manually in P4 and the resulting size of the compiler-generated code (optimized and not). Both the compiler-generated code and the manual implementation instantiate the same amount of state, which means that our compiler is efficient and does not introduce state overhead. The flow cardinality use cases has been address by two different variations of sketches[33][34]. The code complexity of the optimized version is comparable to hand-written code: the P4 LoCs produced by MAFIA are, depending on the task, to larger than those of the code written manually in P4. The use cases using a single sketch (approx. flow volume and cardinality) are always optimized by our compiler.
The low number of primitives employed in each use case demonstrates that it is possible to express the measurements concisely. With a handful of primitive invocations, it is possible to express measurement techniques that would otherwise require significant coding effort. Our API is able to convey the measurement intent and describe the operational steps involved allowing network operators to focus on the measurement needs to be carried out rather than issues arising from using a low-level language such as P4. Compilation times for each of the considered examples is always below 25 ms and is negligible compared to the effort of implementing several ad hoc solutions in P4. Our primitive-oriented approach benefits from the reusability of a simple set of measurement functionality.
V-C Feasibility
To demonstrate the deployment feasibility of our approach, we estimate the resource requirements of a hardware switch111We are not allowed to report results for the actual resource requirements on a Barefoot’s Tofino switch chip due to a confidentiality agreement. for the measurements presented in Table III, following the same methodology as in previous work [5]. The metrics we consider are: i) the depth of the switch processing pipeline (i.e., number of match-action stages); ii) the width of the pipeline (i.e., the maximum number of parallel computation that needs to be performed in a single stage); and iii) the total number of processing atoms that each measurement occupies in the switch pipeline.
We model each of the measurements using the Banzai machine model [35] and compile the Banzai code using its compiler, Domino. A Banzai machine comprises of stateless atoms, which are able to perform binary operations (arithmetic, logic, and relational) on pairs of packet fields, and one stateful atom, capable of accessing and updating the switch registers.
Table IV shows that all of the measurements considered can be mapped to hardware with a modest use of resources. The most complex measurement requires 9 pipeline stages and 13 concurrent operations per stage, for a total of 49 atoms. To put this in context, current programmable switch chips [8], like Barefoot’s Tofino (24 stages and up to 63 actions per stage), already fulfill these requirements.
MAFIA expects a target switch to make a certain amount of memory available for primitives. Current programmable switch architectures support 0.5 - 32 Mb of memory for each stage [8], organized in register arrays. Memory employed in MAFIA is mapped to registers by our compiler.
| Measurement | Pipeline depth | Pipeline width | Num. Atoms |
Banzai
Atom Type |
| Flow volume and duration | 4 | 4 | 11 | Sub |
| Approximate flow volume | 4 | 5 | 18 | RAW |
| Flow cardinality | 3 | 3 | 6 | RW |
| Flow cardinality | 3 | 2 | 4 | RW |
| Counter thresholds | 5 | 2 | 9 | If-Else-RAW |
| Stochastic sampling | 3 | 1 | 3 | If-Else-RAW |
| Deterministic sampling | 6 | 2 | 8 | Pairs |
| Postcard generation | 1 | 5 | 5 | RW |
| Trajectory encoding | 6 | 3 | 8 | RW |
| Two-phase heavy hitter | 8 | 12 | 41 | If-Else-RAW |
| Top-k congested flows | 9 | 6 | 38 | If-Else-RAW |
| Path changes | 9 | 13 | 49 | If-Else-RAW |
| Path change latency | 4 | 2 | 5 | RW |
VI Related Work
Our selection of primitives is inspired by many successful measurement approaches [12, 11, 15, 13, 14] that demonstrated the value of maintaining exact packet or byte counters or approximate estimates via sketches or Bloom filters, sampling information, exporting information via packet tagging, etc. These ideas were applied successfully in a range of contexts from detecting heavy-hitters to estimating the traffic matrix, to measuring throughput, latency, and packet loss.
OpenFlow [2] supports traffic monitoring by automatically associating packets and bytes counters to flow match rules installed by the controller. These have been used to perform heavy-hitter detection, traffic matrix estimation, throughput, latency, and packet loss[12, 11, 15]. Two key limitations of rule-based counters emerged: 1) measurement data are tightly coupled to the flow-matching rules required to implement the forwarding policy; and 2) data collection led to high overhead on both controller(s) and switches (additional network traffic, CPU processing, and time). Subsequent research mitigated these drawbacks using approximation algorithms and data structures (i.e., sketches and bloom filters) to keep short summaries of traffic characteristics[13, 14], with provable bounds on accuracy when assigned a certain amount of resources. But they had limited applicability and/or re-usability, as they were tailored to specific measurement problems that required special-purpose, hard-coded algorithms.
Recent trends on programmable data planes[4] allow the definition and implementation of somewhat arbitrary measurement algorithms[19, 17, 18] that can be installed on programmable forwarding elements. However, current measurement approaches propose only tailored solutions to specific problems, without providing general and reusable abstractions to ease network measurements specification.
In-band Network Telemetry [25], a practical realization of TPP[29], aims at improving the visibility of the network operating conditions by gathering measurement data (i.e., queuing, delay, losses and utilization) along the path taken by the packets. However, INT’s applicability is limited by design and narrows its focus to the areas of performance monitoring and troubleshooting. Its techniques are not immediately applicable to other scenarios. Also, it cannot specify stateful measurement algorithms. Supporting explicit composability, MAFIA provides INT’s benefits while also covering a wider range of measurements needs.
Marple[5] proposes high-level language abstractions to ease expressiveness of measurement tasks. It focuses on providing aggregation of linear-in-state query results directly in the switch, but is limited to performance-related measurements. Its technique relies on the ability to export state from switches on hash collisions towards an offline collector, where partial results are then aggregated.
Sonata[36] proposes a data-streaming model for measurement queries with iterative refinement, modulating which data collection functions run in-network and which ones run at stream processors. While Sonata and MAFIA share measurement flexibility as a goal, and both achieve it via composability, MAFIA goes beyond Sonata in the array of provided measurement primitives at switches. Sonata could exploit our primitives to deploy richer queries or optimize their execution plan based on resource requirements.
Finally, Allman et al. [37] underline the need for built-in protocol support to aid measurements. They propose end-host and hop-by-hop support to gather measurement data along a packet’s path. However, their approach is limited as it focuses on the host’s view of the network. Also, they do not provide mechanisms to perform stateful processing of measurement data in the data plane.
VII Conclusions and Future Work
We advocate that true software-defined measurement should start with configurable and reusable primitives—basic building-blocks that, when properly composed, can support a wide variety of network measurements. That is, Measurements As FIrst-class Artifacts.
We proposed a set of orthogonal primitives that can be exported by switches to implement measurement tasks. We implemented a MAFIA prototype and showed how our principled approach is capable of deriving concise and easy to understand specifications of measurement activity. We demonstrated, by using our primitives, how a wide range of measurement tasks can be easily solved using MAFIA. In future work, we plan to explore the necessary abstractions and protocols to deploy measurement tasks dynamically across a set of switches.
Acknowledgments. This work was partially supported by Fundação para a Ciência e Tecnologia (FCT) and Feder projects with references PTDC/EEI-COM/29271/2017 (Cosmos) and UID/ CEC/ 50021/ 2019. Paolo Laffranchini was supported by a fellowship from the Erasmus Mundus Joint Doctorate in Distributed Computing (EMJD-DC) program funded by the European Commission (EACEA) (FPA 2012-0030). We thank David Walker and Leonid Ryzhyk for their constructive comments on this work.
References
- [1] Open Networking Foundation, “Software-defined networking: The new norm for networks,” https://www.opennetworking.org/images/stories/downloads/sdn-resources/white-papers/wp-sdn-newnorm.pdf, 2012.
- [2] N. McKeown, T. Anderson, H. Balakrishnan, G. Parulkar, L. Peterson, J. Rexford, S. Shenker, and J. Turner, “OpenFlow: Enabling Innovation in Campus Networks,” SIGCOMM Comput. Commun. Rev., vol. 38, no. 2, 2008.
- [3] G. Bianchi, M. Bonola, A. Capone, and C. Cascone, “OpenState: Programming Platform-independent Stateful Openflow Applications Inside the Switch,” SIGCOMM Comput. Commun. Rev., vol. 44, no. 2, 2014.
- [4] P. Bosshart, D. Daly, G. Gibb, M. Izzard, N. McKeown, J. Rexford, C. Schlesinger, D. Talayco, A. Vahdat, G. Varghese, and D. Walker, “P4: Programming Protocol-independent Packet Processors,” SIGCOMM Comput. Commun. Rev., vol. 44, no. 3, 2014.
- [5] S. Narayana, A. Sivaraman, V. Nathan, P. Goyal, V. Arun, M. Alizadeh, V. Jeyakumar, and C. Kim, “Language-Directed Hardware Design for Network Performance Monitoring,” in SIGCOMM, 2017.
- [6] J. Sonchack, A. J. Aviv, E. Keller, and J. M. Smith, “Turboflow: Information Rich Flow Record Generation on Commodity Switches,” in EuroSys ’18, 2018.
- [7] J. Sonchack, O. Michel, A. J. Aviv, E. Keller, and J. M. Smith, “Scaling Hardware Accelerated Network Monitoring to Concurrent and Dynamic Queries With *Flow,” in ATC, 2018.
- [8] P. Bosshart, G. Gibb, H.-S. Kim, G. Varghese, N. McKeown, M. Izzard, F. Mujica, and M. Horowitz, “Forwarding Metamorphosis: Fast Programmable Match-action Processing in Hardware for SDN,” in SIGCOMM, 2013.
- [9] A. Sapio, I. Abdelaziz, A. Aldilaijan, M. Canini, and P. Kalnis, “In-Network Computation is a Dumb Idea Whose Time Has Come,” in HotNets, 2017.
- [10] M. Crovella and B. Krishnamurthy, Internet Measurement: Infrastructure, Traffic and Applications. John Wiley and Sons, Inc., 2006.
- [11] A. Tootoonchian, M. Ghobadi, and Y. Ganjali, “OpenTM: Traffic Matrix Estimator for OpenFlow Networks,” in PAM, 2010.
- [12] L. Jose, M. Yu, and J. Rexford, “Online Measurement of Large Traffic Aggregates on Commodity Switches,” in Hot-ICE, 2011.
- [13] M. Yu, L. Jose, and R. Miao, “Software Defined Traffic Measurement with OpenSketch,” in NSDI, 2013.
- [14] Z. Liu, A. Manousis, G. Vorsanger, V. Sekar, and V. Braverman, “One Sketch to Rule Them All: Rethinking Network Flow Monitoring with UnivMon,” in SIGCOMM, 2016.
- [15] N. L. Van Adrichem, C. Doerr, and F. A. Kuipers, “OpenNetMon: Network monitoring in Openflow Software-defined Networks,” in NOMS, 2014.
- [16] J. Suh, T. T. Kwon, C. Dixon, W. Felter, and J. Carter, “OpenSample: A Low-Latency, Sampling-Based Measurement Platform for Commodity SDN,” in ICDCS, 2014.
- [17] Y. Li, R. Miao, C. Kim, and M. Yu, “FlowRadar: A Better NetFlow for Data Centers,” in NSDI, 2016.
- [18] ——, “LossRadar: Fast Detection of Lost Packets in Data Center Networks,” in CoNEXT, 2016.
- [19] M. Ghasemi, T. Benson, and J. Rexford, “Dapper: Data Plane Performance Diagnosis of TCP,” in SOSR, 2017.
- [20] K. Agarwal, E. Rozner, C. Dixon, and J. Carter, “SDN Traceroute: Tracing SDN Forwarding Without Changing Network Behavior,” in HotSDN, 2014.
- [21] Y. Zhu, N. Kang, J. Cao, A. Greenberg, G. Lu, R. Mahajan, D. Maltz, L. Yuan, M. Zhang, B. Y. Zhao, and H. Zheng, “Packet-Level Telemetry in Large Datacenter Networks,” in SIGCOMM, 2015.
- [22] N. Handigol, B. Heller, V. Jeyakumar, D. Mazières, and N. McKeown, “I Know What Your Packet Did Last Hop: Using Packet Histories to Troubleshoot Networks,” in NSDI, 2014.
- [23] M. Moshref, M. Yu, R. Govindan, and A. Vahdat, “DREAM: Dynamic Resource Allocation for Software-defined Measurement,” in SIGCOMM, 2014.
- [24] ——, “SCREAM: Sketch Resource Allocation for Software-defined Measurement,” in CoNEXT, 2015.
- [25] “In-band network telemetry,” http://p4.org/wp-content/uploads/fixed/INT/INT-current-spec.pdf, 2016.
- [26] P. Zhang, H. Li, C. Hu, L. Hu, L. Xiong, R. Wang, and Y. Zhang, “Mind the Gap: Monitoring the Control-Data Plane Consistency in Software Defined Networks,” in CoNEXT, 2016.
- [27] T. Mizrahi and Y. Moses, “The case for Data Plane Timestamping in SDN,” INFOCOM Workshops, 2016.
- [28] C. J. Anderson, N. Foster, A. Guha, J.-B. Jeannin, D. Kozen, C. Schlesinger, and D. Walker, “NetKAT: Semantic Foundations for Networks,” in POPL, 2014.
- [29] V. Jeyakumar, M. Alizadeh, Y. Geng, C. Kim, and D. Mazières, “Millions of Little Minions: Using Packets for Low Latency Network Programming and Visibility,” in SIGCOMM, 2014.
- [30] H. Zeng, P. Kazemian, G. Varghese, and N. McKeown, “Automatic Test Packet Generation,” in CoNEXT, 2012.
- [31] T. D. Nguyen, M. Chiesa, and M. Canini, “Decentralized Consistent Updates in SDN,” in SOSR, 2017.
- [32] N. Katta, M. Hira, C. Kim, A. Sivaraman, and J. Rexford, “HULA: Scalable Load Balancing Using Programmable Data Planes,” in SOSR ’16, 2016.
- [33] P. Flajolet and G. N. Martin, “Probabilistic counting algorithms for data base applications,” Journal of Computer and System Sciences, vol. 31, no. 2, 1985.
- [34] P. Flajolet, Éric Fusy, O. Gandouet, and et al., “Hyperloglog: The analysis of a near-optimal cardinality estimation algorithm,” in AOFA, 2007.
- [35] A. Sivaraman, A. Cheung, M. Budiu, C. Kim, M. Alizadeh, H. Balakrishnan, G. Varghese, N. McKeown, and S. Licking, “Packet Transactions: High-Level Programming for Line-Rate Switches,” in SIGCOMM, 2016.
- [36] A. Gupta, R. Harrison, A. Pawar, R. Birkner, M. Canini, N. Feamster, J. Rexford, and W. Willinger, “Sonata: Query-Driven Network Telemetry,” SIGCOMM, 2018.
- [37] M. Allman, R. Beverly, and B. Trammell, “Principles for Measurability in Protocol Design,” SIGCOMM Comput. Commun. Rev., vol. 47, no. 2, 2017.
- [38] Y. Zhang, “An Adaptive Flow Counting Method for Anomaly Detection in SDN,” in CoNEXT, 2013.
- [39] S. R. Chowdhury, M. F. Bari, R. Ahmed, and R. Boutaba, “Payless: A Low Cost Network Monitoring Framework for Software-defined Networks,” in NOMS, 2014.
- [40] C. Yu, C. Lumezanu, Y. Zhang, V. Singh, G. Jiang, and H. V. Madhyastha, “FlowSense: Monitoring Network Utilization with Zero Measurement Cost,” in PAM, 2013.
- [41] A. R. Curtis, J. C. Mogul, J. Tourrilhes, P. Yalagandula, P. Sharma, and S. Banerjee, “DevoFlow: Scaling Flow Management for High-performance Networks,” in SIGCOMM, 2011.
- [42] G. Cormode and S. Muthukrishnan, “An improved data stream summary: the count-min sketch and its applications,” Journal of Algorithms, vol. 55, no. 1, 2005.
- [43] S. Shirali-Shahreza and Y. Ganjali, “FleXam: Flexible Sampling Extension for Monitoring and Security Applications in Openflow,” in HotSDN, 2013.
- [44] Y. Afek, A. Bremler-Barr, S. Landau Feibish, and L. Schiff, “Sampling and Large Flow Detection in SDN,” in SIGCOMM, 2015.
Appendix A Implementation with primitives API
|
|
|||
| Flow volume and duration | [11, 38, 15, 12, 39, 40, 41] | ⬇ flowid = Key(ip.src,ip.dest,tcp.src,tcp.dest,ip.proto) now_ts = Timestamp(); byte_counter = HashMap(key=flowid, size=1024, type=Counter(width=32)); packet_counter = HashMap(key=flowid, size=1024, type=Counter(width=32)); start_ts = HashMap(key=flowid, size=1024, type=Timestamp()); flow_duration = HashMap(key=flowid, size=1024, type=Counter(width=32)); pkts ( byte_counter.set(byte_counter + pkt.size) packet_counter.set( packet_counter + 1) ) ( ( match(start_ts == 0) timestamp(start_ts) ) ( match(start_ts != 0) timestamp(now_ts) flow_duration.set(now_ts - start_ts)) ) ) | ||
|
Approximate
flow volume (Count-Min Sketch) |
[41, 13, 36, 24, 42] | ⬇ flowid = Key(ip.src,ip.dest,tcp.src,tcp.dest,ip.proto) flow_size = Sketch(alg=”countmin”, nhash=4, key=flowid, size=256, width=32); pkts flow_size.set(flow_size + pkt.size) | ||
|
Flow cardinality
(PCSA Sketch) |
[13, 33] | ⬇ flowid = Key(ip.src,ip.dest,tcp.src,tcp.dest,ip.proto) num_flows = Sketch(alg=”pcsa”,key=flowid,nhash=1,size=128); pkts num_flows.update() | ||
|
Flow cardinality
(HyperLogLog Sketch) |
[24, 34] | ⬇ flowid = Key(ip.src,ip.dest,tcp.src,tcp.dest,ip.proto) num_flows = Sketch(alg=”hyperloglog”,key=flowid,nhash=1,size=256); pkts num_flows.update() | ||
|
Counter
thresholds |
[41] | ⬇ flowid = Key(ip.src,ip.dest,tcp.src,tcp.dest,ip.proto) byte_counter = HashMap(key=flowid, size=1024, type=Counter(width=32)); packet_counter = HashMap(key=flowid, size=1024, type=Counter(width=32)); pkts packet_counter.set(packet_counter + 1) match(packet_counter > PACKET_THRESHOLD) duplicate(pkts_exceeded) pkts byte_counter.set(byte_counter + pkt.size) match(byte_counter > BYTE_THRESHOLD) duplicate(bytes_exceeded) pkts_exceeded collect(COLLECTOR) bytes_exceeded collect(COLLECTOR) |
|
|
|||
|
Stochastic
Sampling |
[43, 16, 44] | ⬇ pkts match(random([0:100]) < SamplingRatio) duplicate(samples) ) samples collect(COLLECTOR) | ||
|
Deterministic
Sampling |
[43] | ⬇ flowid = Key(ip.src,ip.dest,tcp.src,tcp.dest,ip.proto) n = HashMap(key=flowid, size=1024, type=Counter(width=32)) m = HashMap(key=flowid, size=1024, type=Counter(width=32)) delta = HashMap(key=flowid, size=1024, type=Counter(width=32)) pkts ( ( match(delta < SKIP) delta.add(1) ) ( match(delta >= SKIP && m < NUM_SAMPLES) m.set(m + 1)) duplicate(samples) ) ( n.set(n + 1) match(n >= NUM_PACKETS) n.reset() m.reset() delta.reset() ) ) samples collect(COLLECTOR) | ||
|
Postcard
generation |
[22] | ⬇ pkts duplicate(postcards) postcards tag(ipv4.checksum, pkt.input_port) tag(ipv4.identification, pkt.output_port) tag(ipv4.tos, switchid) collect(COLLECTOR) | ||
|
Trajectory
encoding |
[26] | ⬇ //code executed at ingress switch now = Timestamp() ; flowid = key(ip.src,ip.dest,tcp.src,tcp.dest,ip.proto) verify_time = HashMap(key=flowid, size=1024, type=Timestamp()) ; pkts timestamp(now) match( verify_time - now > THRESHOLD) timestamp(verify_time) tag(ipv4.tos, switch.id) tag(ipv4.identification, pkt.input_port) tag(pkt.ipv4.tos, pkt.ipv4.tos|0x1) //code executed at intermediate switch location = key(pkt.input_port, switch.id, pkt.output_port) trajectory = BloomFilter(alg=”membership”, nhash=4, key=location, size=16); pkts match(pkt.ipv4.tos & 0x1 == 0x1) trajectory.insert() tag(ipv4.checksum, ipv4.checksum | trajectory.read())) trajectory.reset() //code executed at egress switch pkts match(pkt.ipv4.tos & 0x1 == 0x1) tag(ipv4.identification, pkt.output_port) tag(ipv4.tos, switch.id) duplicate(reports) reports collect(COLLECTOR) |
|
|
|||
|
Two-phase
heavy hitters |
⬇ flowid = Key(ip.src,ip.dest,tcp.src,tcp.dest,ip.proto) total = Counter(width=32) nbytes = Sketch(alg=”count-min”,nhash=4,key=flowid,size=256,width=32) hh = BloomFilter(alg=”membership”,key=flowid,nhash=4,size=64) hh_bytes = HashMap(key=flowid,size=1024,type=Counter(width=32)) window(mment_interval) pkts match(pkt.input_port == PORT) total.set(total + pkt.size) ( ( match(!hh.test()) nbytes.set(nbytes + pkt.size) match(nbytes.min() / total > THRESHOLD) hh.insert() hh_bytes.set(nbytes.min()) duplicate(hh_alarms) ) ( match(hh.test()) hh_bytes.set(hh_bytes + pkt.size) ) ) hh_alarms tag(ipv4.checksum, nbytes.min()) collect(CONTROLLER) // Control traffic to retrieve heavy hitters volume. ctrl match(pkt.request == HH_VOLUME) duplicate(get_hh_volume) get_hh_volume tag(pkt.hh_volume, hh_bytes) collect(CONTROLLER) | |||
| Top-k Congested Flows | ⬇ // Code executed at first hop: pkts tag(ipv4.tos, ipv4.tos | 0x1) tag(ipv4.id, pkt.in_queue_length)) // Code executed at intermediate hops: q_len = Counter(width=32); pkts match(ipv4.tos & 0x1 == 0x1) q_len.set(ipv4.id + pkt.in_queue_length) tag(ipv4.id, q_len) // Code executed at last hop: flowid = Key(ip.src,ip.dest,tcp.src,tcp.dest,ip.proto) total_pkts = Sketch(alg=”countmin”,key=flowid,nhash=4,size=1024,w=32) path_q_len = Sketch(alg=”countmin”,key=flowid,nhash=4,size=1024,w=32) pkts.window(5s) match(ipv4.tos & 0x1 == 0x1) total_pkts.set(total_pkts + 1) path_q_len.set(path_q_len + ipv4.id) | |||
| Path Changes | ⬇ // Code to be executed at intermediate switches location = Key(pkt.input_port, switch.id, pkt.output_port) location_bf = BloomFilter( alg=”membership”,key=location,nhash=4,size=32) pkts location_bf.init(ipv4.checksum) trajectory.set() tag(ipv4.checksum, ipv4.checksum | location_bf) location_bf.reset() // Code to be executed at the packet’s last hop flowid = Key(ip.src,ip.dest,tcp.src,tcp.dest,ip.proto) paths_sketch = Sketch( alg=”store”,key=flowid,nhash=4,size=256,width=16) n_change_sketch = Sketch( alg=”countmin”,key=flowid,nhash=4,key=flowid,size=256) pkts.window(10 RTT) match(!paths_sketch.any(ipv4.checksum)) paths_sketch.set(ipv4.checksum) n_change_sketch.set(n_change_sketch + 1) |
|
|
|||
| Path Change Latency | ⬇ // Code to be executed on all switches updating rules change_ts = Timestamp(); l_clock = Counter(width=8); pkts match(segway_header.msg == GoodToMove) l_clock.set(max(l_clock + 1, segway_header.ts)) tag(segway_header.ts, l_clock) duplicate(end_of_update) end_of_update timestamp(change_ts) tag(segway_header.time, change_ts) tag(segway_header.ts, l_clock) collect(SEGWAY_CONTROLLER) |