Temperature rise in shear bands in a simulated metallic glass
Abstract
Temperature rise () associated with shear-banding of metallic glasses is of great importance for their performance. However, experimental measurement of is difficult due to temporal and spatial localization of shear bands and, as a result, our understanding of the mechanism of is limited. Here, based on molecular dynamics simulations we observe a spectrum of , which depends on both sample size and strain rate, in the shear bands of CuZr metallic glass under tension. More importantly, we find that the maximum sliding velocity of the shear bands correlates linearly with the corresponding , ranging from 25 K up to near the melting point for the samples studied. Taking heat diffusion into account, we expect to be lower than 25 K for the lower end of sliding velocity. At high temperature, shear band bifurcation and/or multiplication can occur as a negative feedback mechanism that prevents temperature rising well above the melting point.
I Introduction
Shear-banding is a form of highly localized plastic deformation widely found in polymers, granular suspensions, and even crystalline metals li_behavior_1984 ; fall_yield_2009 ; wei_evolution_2002 ; xue_self-organization_2002 . It is also the major mode of plastic deformation in metallic glasses below their glass transition. During this process, the stored elastic energy of the strained material transforms into kinetic energy of the shear bands, which is expected to result in an increase in temperature within the bands. Once shear bands form in metallic glass, they can slide either via a runaway mode or serrated (stop-and-go) mode. The runaway sliding often leads to a catastrophic failure, and the serrated shear-banding can also transit into fracture das_temperature_2018 ; maass_long_2015 . Upon fracture, substantial temperature rise is observed, as evidenced by sparks during dynamic fracture gilbert_light_1999 , the formation of liquid droplets liu_test_1998 , and river patterns bruck_dynamic_1996 on fracture surfaces.
Intuitively, one would expect higher temperature rise in samples of larger size and at larger strain rates greer_shear_2013 . A modelling analysis, based on the assumption that the heat flux into the band scales with the sliding velocity, reports that the temperature rise is less than 15 K for samples with diameter up to 2 mm but is greater than the glass transition temperature for samples of at least 3 mm in diameter cheng_cold_2009 , and infra-red thermography of constrained compressions demonstrates that increases from K to K as the strain rate increases from 4.910-4/s to 2.810-2/s jiang_rate-dependent_2008 . Although measured by infra-red thermography typically ranges from 0.25 K to several tens of K yang_-situ_2004 ; yang_dynamic_2005 ; song_seeing_2017 ; flores_local_1999 , 500 K during dynamic compression has been reported bruck_dynamic_1996 , albeit based on the use of a single detector. values around 1127 K upon dynamic fracture has also been reported based on light spectrum analysis gilbert_light_1999 .
While the above studies confirm the rise in temperature associated with shear-banding, direct and accurate measurements of in a shear band is nearly impossible because it occurs within the bulk of the material and is only accessible for post-mortem analysis song_seeing_2017 . The accuracy of surface temperature measurements (such as infra-red thermography) is limited by the temporal and spatial resolutions of these techniques, which are orders of magnitude lower than that required (in nm and ns to s scales). As a result, is often indirectly estimated based on solutions to the heat conduction equation or adiabatic approximation. As summarized in Table 1, such estimations can, even in the scenario of high resolutions of measurement lewandowski_temperature_2006 , lead to unrealistic temperature predictions up to 8600 K or more lewandowski_temperature_2006 ; yang_localized_2006 ; bengus_peculiarities_1993 .
As can be seen, the measurement of temperature within shear bands is intrinsically difficult, and our understanding of temperature rise is limited. On the other hand, atomistic simulations cao_structural_2009 ; bailey_atomistic_2006 , thanks to their nanoscale capacity comparable to the spatial and time scale of shear banding, are a promising complementary approach for tackling this difficult problem. Through simulating tensile loading of CuZr metallic glass we attempt to elucidate the mechanisms of heating associated with shear banding and contributing effects of sample size and strain rate.
| material | deformation | method | calculation method | reference | ||
|---|---|---|---|---|---|---|
| Pd-based | tension | 0.04 | thermometer | 8000 | adiabatic approximation | bengus_peculiarities_1993 |
| Zr-based | tension | 0.25 | IR | 333 | STZ heating | yang_localized_2006 |
| 10000 | adiabatic approximation | yang_localized_2006 | ||||
| Zr-based | tension | 0.4 | IR | 1200 | adiabatic approximation | yang_-situ_2004 |
| Zr-based | tension | 22.5 | IR | 54.2 | heat conduction | flores_local_1999 |
| Zr-based | bending | 207 | tin coating | 3100-8300 | Carslaw-Jaeger’s equation | lewandowski_temperature_2006 |
| Zr-based | compression | 500 | IR | - | - | bruck_dynamic_1996 |
| Zr-based | impact | 1127 | LS | - | - | gilbert_light_1999 |
II Methods
First, a bulk rectangular simulation cell containing 2592 Cu and 2592 Zr atoms, modelled by the embedded atom method (EAM) potential proposed for CuZr mendelev_development_2009 , was well equilibrated at 2000 K, about 700 K higher than the simulated melting point tang_anomalously_2013 , for 2 ns. The liquefied system was then quenched to 100 K at 1010 K/s, with the final cell dimension being around . A tension sample, denoted as , was then built by repeating the final configuration by , , and times in space. For reducing computational cost, we set as 1 for all samples in this study, which makes the size along much smaller than those along and . Nevertheless, this does not alter our conclusions since the size (2 nm) is much larger than the cut-off (7.6 Å) range of atomic interaction and periodic boundary conditions are applied along . The size of simulation cell along was then doubled by inserting in a vacuum layer to create free surfaces. The samples with free surfaces were then relaxed at 650 K and 100 K for 80 ps and 20 ps, respectively, to reduce the structural periodicity caused by repeating the building blocks. Finally, a surface notch was created by removing some atoms in order to stimulate the formation of shear bands from the surface. The notched samples were then stretched along axis up to an engineering strain of at a strain rate of 108/s unless otherwise specified. Structure visualization and analysis were performed using Code OVITO stukowski_visualization_2010 .
All simulations were carried out under NPT (constant particle number, pressure, and temperature) ensemble using code LAMMPS plimpton_fast_1995 , with temperature and pressure being modulated with Nosé-Hoover thermostat and barostat, respectively, and the time step being set as 2 fs. During the bulk relaxation process, pressure was isotropically set to zero, and during the tension process, pressure was set to zero only in direction. In order to avoid the influence of thermostat on temperature during deformation, we set a damping coefficient longer than the deformation process, which effectively turns off the thermostatcao_structural_2009 . While alternatively one can apply the thermostat only to a small group of atoms far away from the shear band to ensure the heat transfer from the shear band to the matrix, we noticed that within our current approach the temperature of the atoms very far from the shear band is essentially stable, due to the large size of the system with respect to the shear band, even when the shear band reaches its peak temperature.
Unless otherwise specified, for all temperature calculations in this study, we refer to a group of atoms in the center of the shear band that initially form a parallelepiped-shaped zone with the edges along the loading axis being 3 nm. Although this means a relatively wider zone is used for computation in a smaller sample, we note this choice does not qualitatively alter our conclusions in this work. We calculated the temperature of zones of interest using
| (1) |
where is the average kinetic energy of the atoms in the zones and is the Boltzmann constant. In this formula, the portion of kinetic energy from translational movement of atoms along the shear-banding direction should be factored out since this inertial collective movement does not contribute to temperature rise. We noted that at the center of a shear band the collective translational velocity is nearly zero due to the opposite movements of either side of the band, although the sliding velocity, i.e., the relative velocities of neighboring atom layers, can be high. As shown in Table 2, the translational effect is small and so ignored in this work.
| Sample | (Å) | () | () | () | / |
|---|---|---|---|---|---|
| 0 | 66.8 | 67.0 | 66.8 | 33.3% | |
| 71 | 39.5 | 38.8 | 40.3 | 33.3% | |
| 141 | 36.0 | 37.1 | 36.3 | 32.9% | |
| 0 | 306.9 | 291.8 | 296.6 | 34.3% | |
| 141 | 143.2 | 78.9 | 78.0 | 47.7% | |
| 283 | 93.5 | 39.8 | 35.3 | 55.5% |
III Results
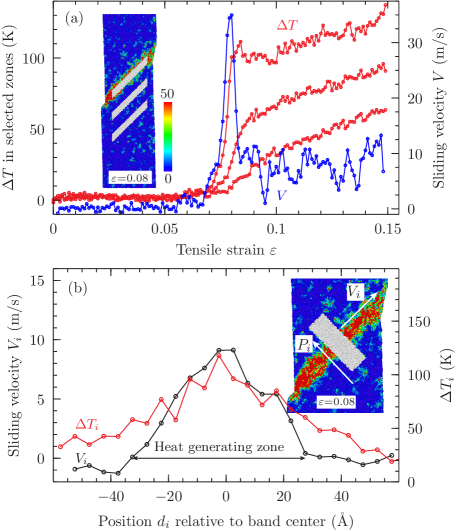
We start by examining the shear banding process associated with temperature rise using a sample as an example. For this sample, a mature shear band with thickness of 6 nm is formed at an engineering strain of , as shown in the inset of Fig. 1(a).
As shown in Fig. 1(a), at the temperature within the band zone starts to increase rapidly and reaches a peak K at . During this process the heat diffuses into the matrix and results in a temperature rise in the neighboring zones within the matrix. Fig. 1(a) shows that a peak of sliding velocity, or the relative velocity of either side of the shear band, occurs at , well corresponding to the sharp rise in temperature. After the peak, the sample does not fail catastrophically but the band continues to shear at around 5 to 10 m/s, corresponding to further temperature rise at larger strains. All these imply a close correlation between temperature rise and the friction of adjacent atoms within the shear band. To quantitatively elucidate this point, we chose the point of and computed the sliding velocity of atomic layers (i.e., relative velocity of either side of a layer) as a function of their position relative to the center of the shear band. As shown in Fig. 1(b), the sliding velocity at the center of the band is the highest and decreases to zero at distances greater than Å. The rise in temperature also exhibits a similar distribution, with at distances greater than Å due to heat diffusion.
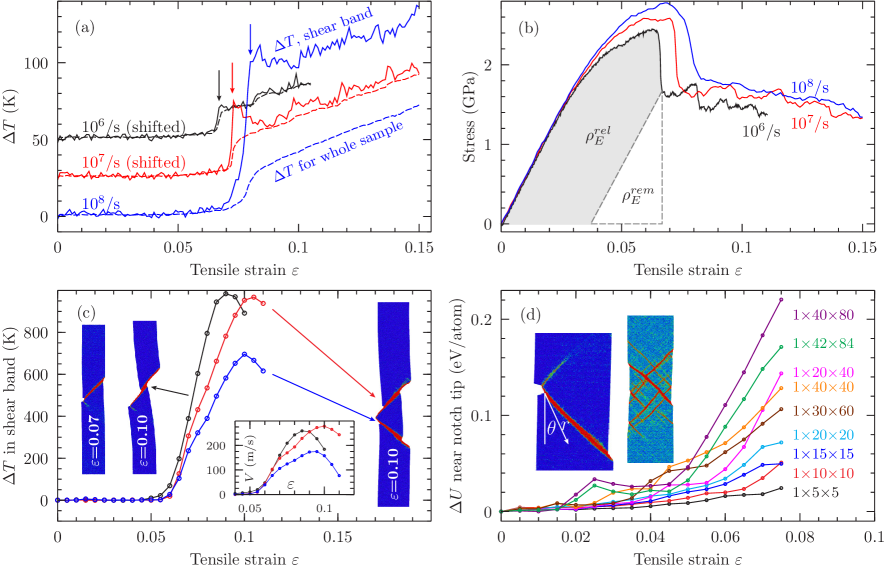
Since correlates with the sliding velocity of shear band, strain rate is expected to directly affect . As can be seen from Fig. 2(a), when the strain rate decreases from 108/s to 107/s and 106/s, the peak upon the point when the shear band penetrates the sample, as indicated by an arrow in the figure, reduces from K to K and K. The trend observed here is qualitatively similar to that obtained using infrared thermography for quasistatic compression jiang_rate-dependent_2008 although the strain rate ranges in these two studies are orders of magnitude different. During experimental deformation, especially dynamic testing, strain rate may not be constant. By step varying strain rate shortly before the start of shear banding, we found that it is indeed the strain rate accompanying shear banding, rather than the rate during the elastic deformation stage, that controls .
From an energetic perspective, results from the elastic energy released during the process of shear band formation. As shown in Fig. 2(b), the density of released energy somewhat decreases as strain rate decreases, but in the shear band decreases more rapidly. This implies that, at the point when the shear band penetrates the sample, for a lower strain rate a greater portion of kinetic energy diffuses from the band into the matrix. Indeed, as can be seen from Fig. 2(a), for rate 106/s in shear band is very close to that of the whole sample, which is distinct from the cases of the other two rates. This implies that for strain rate 106/s the sample is too small compared with the heat diffusion distance, resulting in near zero temperature gradient in the sample and, hence, low efficiency for further heat dissipation. It is clear that, for the same sliding velocity corresponding to sample at 106/s, one can expect even lower in a larger sample because of more efficient heat dissipation.
Using a constant strain rate of 108/s, we computed as a function of sample size. For samples up to , the measured values are less than 200 K, comparable to previous simulation results cao_structural_2009 ; bailey_atomistic_2006 . As the sample size increases, we found a consistently increasing , reaching 1000 K for sample of which the size is nm3, as shown in Fig. 2(c). Such an extreme temperature rise indicates that the shear band can reach the melting point (1340 K tang_anomalously_2013 ) of this simulated metallic glass during deformation at room temperature. As mentioned above, for sample a peak of occurs when the band propagates through the sample. However, for sample increases smoothly around this point. This indicates a transition from stable shear-banding to unstable shear-banding when the sliding velocity is larger than some threshold value, as was also observed in a model analysis cheng_cold_2009 .
Further increase in sample size beyond does not result in higher . Instead, the shear band was found to bifurcate into two bands reducing the temperature, as shown in Fig. 2(c) for sample . As shown in the inset of Fig. 2(c), the peak sliding velocities of the shear bands in samples and are about 260-280 m/s. It has been proposed that the sliding speed limit at the point of yield onset is about 1/10 miracle_shear_2011 ; greer_shear_2013 of the transverse sound wave speed, which ranges from 2 to 2.5 km/s for a series of BMGs wang_bulk_2004 . We note that the peak sliding velocities occur upon substantial plastic deformation and nearby the onset of yield the sliding velocities are far below the proposed limit. This indicates that can be limited by shear band bifurcation before the sliding velocity limit is reached, although we stress that bifurcation could occur at low-temperature shear bands due to, for example, local structural inhomogeneity. We note that a previous model cheng_cold_2009 also predicted higher temperature rise for larger samples, but in that model the temperature diverges and increases without limit greer_shear_2013 even upon small plastic strains for samples above some critical size. Consistent with our findings, experimentally, crack bifurcation around surface notch lowhaphandu_fracture_1998 ; flores_enhanced_1999 and multiple shear-banding conner_shear_2003 have been reported to increase fracture toughness and plasticity.
For the samples studied we found that shear band bifurcation is less likely for samples with 20, likely for 4060, and almost inevitable for 80. Correspondingly, the change in internal energy, , near the surface notch increases with increasing sample size, as shown in Fig. 2(d). This implies the bifurcation may result from the instability of shear band initiation driven by the large energy flux. This conclusion is supported by the occurrence of multiple shear bands in larger samples ( and ) without a surface notch.
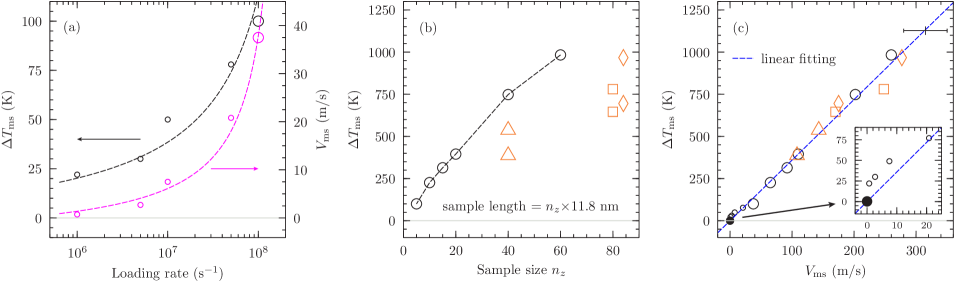
The effects of strain rate and sample size on temperature rise in shear bands can be illustrated using at some representative strain. Here we choose the point of the maximum sliding velocity (), where the corresponding temperature rise, denoted as , is near a peak or the maximum. For stable shear-banding (i.e., slow sliding), we did not choose the higher values during the following slower sliding process because these higher values result from the accumulated heating during the continuous sliding process while for serrated shear-banding the generated heat is nearly exhausted during the ‘stop’ stage thurnheer_time-resolved_2016 . As can be seen in Fig. 3(a), as strain rate decreases logarithmically both and appear to asymptotically approach zero. Fig. 3(b) shows that, at fixed strain rate 108/s, increases approximately linearly with sample length for the single-band samples, but reduces considerably when shear band bifurcation occurs. By combining the data points for various strain rates and sample sizes, we obtain a linear correlation between and , as shown in Fig. 3(c).
IV Discussion
Experimentally, measurements of shear-banding focus on the quasistatic cases that usually associate with serrated flow stresses dalla_torre_stick-slip_2010 ; song_capturing_2010 ; maass_propagation_2011 ; wright_high-speed_2013 ; slaughter_shear_2014 and generally the reported sliding velocities are on the order of 1 mm/s. Infrared imaging yang_dynamic_2005 ; song_seeing_2017 reveals a temperature rise of 0.25 K corresponding to the drop phases of the stress serrations. These experimental data (0.25 K and 5.5 mm/s from references yang_dynamic_2005 ; song_capturing_2010 ) are located on the lower-end extrapolation of our results (Fig. 3(c)). Indeed, the recently reported up to 2 K is comparable to our lowest simulated (20 K) when considering the sliding velocity difference. Although flow stress serrations are beyond the capacity of MD simulations tang_atomistic_2018 , some insightful comments can be made here. As mentioned above, is limited by the elastic energy released during the shearing process. For serrated shear-banding, the stress drop is often below 0.04 GPa dalla_torre_stick-slip_2010 ; maass_shear-band_2015 , which means the released strain energy is only about 2% of the fracture energy if a fracture stress of 2 GPa is assumed. If we assume around 1000 K for fracture gilbert_light_1999 , the possible maximum for serrated shearing would be 20 K. In view of the time scale difference between fracture and serrated shear-banding (s versus ms slaughter_shear_2014 , for the latter should be far lower than 20 K.
On the other hand, the sliding velocity can be high during fracture. In a recent quasistatic compression experiment slaughter_shear_2014 , the fracture process of samples with dimensions mm3 finished within 20 s, which approximately translates into an average sliding velocity around 280 to 350 m/s ( to mm/s where accounts for the shear band angle to the loading axis) although fracture might not be a complete shearing process. In this experiment, temperature rise was calculated to be 4060 K based on thermal diffusion equation, which appears to be overestimated since, for impact fracture, the temperature rise was measured to be about 1127 K based on light spectrum gilbert_light_1999 . Assuming =1127 K and sliding velocity of 31535 m/s upon fracture, we found this combination well fits the trend line in Fig. 3(c). When comparing the fracture with our simulations, we are aware of the following two facts. First, we assumed an average sliding velocity (315 m/s) since the peak velocity was not available. Obviously, if the peak velocity was used, the corresponding data point should somewhat deviate from the fitting line. Second, fracture is not an ideal shear-banding process and so can only be compared roughly with shear-banding. In fact, high speed imaging has shown that a fractured sample can break apart before the (measured) stress drops to zero wright_high-speed_2013 . With these said, the high temperature and fast velocity of fracture still seem to support the positive correlation between and sliding velocity.
Although so far no velocities are reported for the intermediate range in Fig. 3(c), it is expected that during shock compression tests bruck_dynamic_1996 ; zhuang_shock_2002 and ballistic impacts the shear-banding is much faster than the quasistatic ones, which is worth for future experimental confirmation. Also, in the model analysis cheng_cold_2009 by Cheng ., the sliding velocity for “hot” run-away shear-banding is far beyond the scale of mm/s.
Finally, we note that the results obtained in this study are based on some specific relaxed structure (quenched at 1010 K/s), specific environmental temperature (100 K), and a limited number of sample geometries. For lowering the computational cost, we used a thin slab geometry with only 2 nm in the direction. While this thickness is much larger than the cutoff distance of atomic interaction and indeed we obtained similar for a few thicker slabs, such as sample , it is worth exploring the effect of sample geometry in the future. Also, as shear-banding is a thermally activated process maass_propagation_2011 ; derlet_thermally-activated_2018 , the effects of relaxation is worth further investigations. According to this study, ultrahigh temperature in the order of thousands of degrees in shear bands or fracture surfaces seems unlikely due to band or crack bifurcation. However, it remains as an open question whether this is possible in a scenario where the bifurcation is prohibited. In this case factors such as changes in viscosity may have an impact on the friction in shear bands and temperature rise.
V Summary
In summary, we have studied temperature rise in shear bands during tensile loading of CuZr metallic glass through molecular dynamics simulations. It was found that the temperature rise correlates positively with strain rate and sample size. Especially, the maximum sliding velocity of the shear band, a function of both strain rate and sample size, correlates linearly with the corresponding temperature rise, ranging from 20 K to near the melting point. For quasistatic loading temperature rise lower than 20 K is expected from our study. Temperature well above the melting point was not observed because of shear band bifurcation or multiplication, which occurs in response to the instability of shear bands, hinders further temperature rise.
VI Acknowledgements
The authors acknowledge NCI National Facility for computational support of project codes eu7 and y88. CT would particularly like to thank the Australian Research Council for the DECRA Fellowship (grant no. DE150100738) for enabling this work to be carried out. JY thanks SJTU-UNSW Collaborative Research Fund for the financial support.
VII References
References
- (1) J. Li, Polym. Eng. Sci., 24, 750, (1984).
- (2) A. Fall, F. Bertrand, G. Ovarlez, and D. Bonn, Phys. Rev. Lett., 103, 178301, (2009).
- (3) Q. Wei, D. Jia, K. T. Ramesh, and E. Ma, Appl. Phys. Lett., 81, 1240, (2002).
- (4) Q. Xue, M. A. Meyers, and V. F. Nesterenko, Acta Mater., 50, 575, (2002).
- (5) A. Das, P. Kagebein, S. Kuchemann, and R. Maass, Appl. Phys. Lett., 112, 261905, (2018).
- (6) R. Maass, P. Birckigt, C. Borchers, K. Samwer, and C. A. Volkert, Acta Mater., 98, 94, (2015).
- (7) C. J. Gilbert, J. W. Ager, V. Schroeder, R. O. Ritchie, J. P. Lloyd, and J. R. Graham, Appl. Phys. Lett., 74, 3809, (1999).
- (8) C. T. Liu, L. Heatherly, D. S. Easton, C. A. Carmichael, J. H. Schneibel, C. H. Chen, J. L. Wright, M. H. Yoo, J. A. Horton, and A. Inoue, Metall. Mater. Trans. A-Phys. Metall. Mater. Sci., 29, 1811, (1998).
- (9) H. A. Bruck, A. J. Rosakis, and W. L. Johnson, J. Mater. Res., 11, 503, (1996).
- (10) A. L. Greer, Y. Q. Cheng, and E. Ma, Mater. Sci. Eng. R-Rep., 74, 71, (2013).
- (11) Y. Q. Cheng, Z. Han, Y. Li, and E. Ma, Phys. Rev. B, 80, 134115, (2009).
- (12) W. H. Jiang, H. H. Liao, F. X. Liu, H. Choo, and P. K. Liaw, Metall. Mater. Trans. A-Phys. Metall. Mater. Sci., 39A, 1822, (2008).
- (13) B. Yang, P. K. Liaw, G. Wang, M. Morrison, C. T. Liu, R. A. Buchanan, and Y. Yokoyama, Intermetallics, 12, 1265, (2004).
- (14) B. Yang, M. L. Morrison, P. K. Liaw, R. A. Buchanan, G. Y. Wang, C. T. Liu, and M. Denda, Appl. Phys. Lett., 86, 141904, (2005).
- (15) Y. Song, X. Xie, J. Luo, P. K. Liaw, H. Qi, and Y. Gao, Mater. Today, 20, 9, (2017).
- (16) K. M. Flores and R. H. Dauskardt, J. Mater. Res., 14, 638, (1999).
- (17) J. J. Lewandowski and A. L. Greer, Nat. Mater., 5, 15, (2006).
- (18) B. Yang, C. T. Liu, T. G. Nieh, M. L. Morrison, P. K. Liaw, and R. A. Buchanan, J. Mater. Res., 21, 915, (2006).
- (19) V. Bengus, E. Tabachnikova, S. Shumilin, Y. Golovin, M. Makarov, A. Shibkov, J. Miskuf, K. Csach, and V. Ocelik, Int. J. Rapid Solidif., 8, 21, (1993).
- (20) A. J. Cao, Y. Q. Cheng, and E. Ma, Acta Mater., 57, 5146, (2009).
- (21) N. P. Bailey, J. Schiotz, and K. W. Jacobsen, Phys. Rev. B, 73, 064108, (2006).
- (22) M. I. Mendelev, M. Asta, M. J. Rahman, and J. J. Hoyt, Philosophical Magazine, 89, 3269, (2009).
- (23) C. Tang and P. Harrowell, Nat. Mater., 12, 507, (2013).
- (24) A. Stukowski, Modelling Simul. Mater. Sci. Eng., 18, 015012, (2010).
- (25) S. Plimpton, J. Comput. Phys., 117, 1, (1995).
- (26) D. B. Miracle, A. Concustell, Y. Zhang, A. R. Yavari, and A. L. Greer, Acta Mater., 59, 2831, (2011).
- (27) W. H. Wang, C. Dong, and C. H. Shek, Mater. Sci. Eng. R-Rep., 44, 45, (2004).
- (28) P. Lowhaphandu and J. J. Lewandowski, Scr. Mater., 38, 1811, (1998).
- (29) K. M. Flores and R. H. Dauskardt, Scr. Mater., 41, 937, (1999).
- (30) R. D. Conner, W. L. Johnson, N. E. Paton, and W. D. Nix, J. Appl. Phys., 94, 904, (2003).
- (31) P. Thurnheer, F. Haag, and J. F. Loffler, Acta Mater., 115, 468, (2016).
- (32) F. H. Dalla Torre, D. Klaumuenzer, R. Maass, and J. F. Loeffler, Acta Mater., 58, 3742, (2010).
- (33) S. X. Song, X. Wang, and T. G. Nieh, Scr. Mater., 62, 847, (2010).
- (34) R. Maass, D. Klaumunzer, and J. F. Loeffler, Acta Mater., 59, 3205, (2011).
- (35) W. J. Wright, R. R. Byer, and X. Gu, Appl. Phys. Lett., 102, 241920, (2013).
- (36) S. K. Slaughter, F. Kertis, E. Deda, X. Gu, W. J. Wright, and T. C. Hufnagel, APL Mater., 2, 096110, (2014).
- (37) C. Tang, K. Laws, and M. Ferry, Materialia, 1, 121, (2018).
- (38) R. Maass and J. F. Loeffler, Adv. Funct. Mater., 25, 2353, (2015).
- (39) S. M. Zhuang, J. Lu, and G. Ravichandran, Appl. Phys. Lett., 80, 4522, (2002).
- (40) P. M. Derlet and R. Maass, Acta Mater., 143, 205, (2018).