SDSS-IV MaNGA: Inside-out vs. outside-in quenching in different local environments
Abstract
The large Integral Field Spectroscopy (IFS) surveys have allowed the classification of ionizing sources of emission lines on sub-kpc scales. In this work, we define two non-parametric parameters, quiescence () and its concentration (), to quantify the strength and the spatial distribution of the quenched areas, respectively, traced by the LI(N)ER regions with low EW(H). With these two measurements, we classify MaNGA galaxies into inside-out and outside-in quenching types according to their locations on the vs. plane and we measure the fraction of inside-out (outside-in) quenching galaxies as a function of halo mass. We find that the fraction of galaxies showing inside-out quenching increases with halo mass, irrespective of stellar mass or galaxy type (satellites vs. centrals). In addition, high stellar mass galaxies exhibit a greater fraction of inside-out quenching compared to low stellar mass ones in all environments. In contrast, the fraction of outside-in quenching does not depend on halo mass. Our results suggest that morphological quenching may be responsible for the inside-out quenching seen in all environments. On the other hand, the flat dependence of the outside-in quenching on halo mass could be a mixed result of ram-pressure stripping and galaxy mergers. Nevertheless, at a given environment and stellar mass, the fraction of inside-out quenching is systematically greater than that of outside-in quenching, suggesting that inside-out quenching is the dominant quenching mode in all environments.
Subject headings:
galaxies:evolution galaxies: low-redshift1. INTRODUCTION
It has been long recognized that environments play an important role in the galaxy evolution (Dressler, 1980; Baldry et al., 2006; Cooper et al., 2007; Peng et al., 2010; Muzzin et al., 2012; Wetzel et al., 2012). Galaxies located in dense environments may experience short periods of mass assembly where different processes of star formation quenching are present such that their stellar populations are in general old with high metallicities as opposed to the field galaxies (e.g., Roberts & Haynes, 1994; Kauffmann, 1996; Kuntschner et al., 2002; Trager et al., 2008; Blanton & Moustakas, 2009).
Studies of the main-sequence galaxies in various environments find that the specific star formation rate (sSFR) of galaxies located in groups or clusters is systematically lower by 0.1 – 0.3 dex when compared to that of the field galaxies (Vulcani et al., 2010; Haines et al., 2013; Lin et al., 2014; Jian et al., 2017, 2018). Nevertheless, recent works have concluded that the well-established ‘color-density’ relation at low redshifts is primarily driven by the increase of the quiescent population, with the global reduction in the star formation rate of star-forming galaxies in dense environments only being a secondary effect (Baldry et al., 2004; Koyama et al., 2013; Lin et al., 2014; Lacerna et al., 2016; Jian et al., 2017; Argudo-Fernández et al., 2018; Lacerna et al., 2018). Combining all these results, it is suggested that there could be a mixing of various quenching processes that operate on different time-scales going on for group/cluster galaxies.
A number of environment-associated mechanisms have been proposed to explain the suppressed star formation rate in dense environments. For example, the gas in galaxy discs or halos can be stripped when galaxies fall into a cluster and move through the hot intracluster medium, often referred to as ram pressure stripping (Gunn & Gott, 1972; McCarthy et al., 2008). This scenario is supported by the depleted HI gas and offset ionized gas observed in local cluster galaxies (e.g., Brown et al., 2017; Fritz et al., 2017). Similarly, the outer hot halo of galaxies may also be removed due to tidal forces or ram pressure, referred to as ‘strangulation’, in which case galaxies lose their fuel to supply further star formation (Larson et al., 1980). Other processes, such as galaxy interactions or galaxy harassment (Moore et al., 1996), which are found more frequently in dense environments (Lin et al., 2010), may also induce gas inflow toward the centers of galaxies, trigger starbursts, and consume the gas completely (Mihos & Hernquist, 1994; Cox et al., 2006). While it is likely that multiple processes may all contribute to the lower level of star formation activities in dense environments, it is observationally very challenging to identify which mechanism is dominant over others.
Recent integral field spectroscopy (IFS) surveys, such as CALIFA (Sánchez et al., 2012), SAMI (Bryant et al., 2015), and MaNGA (Bundy et al., 2015), provide great opportunities to probe the quenching effect through spatially resolved information, as different quenching processes may leave distinct imprints on the spatial distributions of the star formation. For processes like ram-pressure stripping or strangulation, one expects that the gas suppression and star formation quenching happen outside-in or globally, while AGN feedback would result in the opposite trend (inside-out). With the resolved information, it is therefore possible to constrain the quenching mechanisms by investigating the spatial patterns of quenching within the galaxies (e.g., González Delgado et al., 2014, 2016; Tacchella et al., 2015; Li et al., 2015; Lin et al., 2017b; Ellison et al., 2018; Sánchez et al., 2018), including their dependence on the stellar mass, morphology, and environment (Pérez et al., 2013; González Delgado et al., 2015; Pan et al., 2015; Ibarra-Medel et al., 2016; González Delgado et al., 2017; Schaefer et al., 2017; Spindler et al., 2018; Wang et al., 2018; Sánchez et al., 2018; Medling et al., 2018). Depending on the tracers used to study the quenching, some are more sensitive to the instantaneous halt of star formation (e.g., star formation rate), while others may in fact probe the ageing effect (e.g., age, D4000 strength, etc).
The environmental dependence of the resolved star formation activities so far have yielded controversial results. Schaefer et al. (2017) adopted the nearest neighbor local density as a environment tracer and studied the star formation rate gradients in the SAMI sample. They concluded that the star formation quenching occurs outside-in in dense environments. On the other hand, Spindler et al. (2018) utilized galaxies taken from the MaNGA survey and found a global suppression in the star formation rate from inner to outer regions for satellite galaxies, which favors the strangulation scenario.
In this paper, we investigate the spatial pattern of quenching and its dependence on the local environment, specifically the halo mass, in the MaNGA sample by quantifying the spatial distribution of quenched areas using non-parametric methods. We study the fractions of galaxies showing inside-out and outside-in quenching features as a function of halo mass for central and satellites galaxies separately, from which we infer the environment quenching mechanisms that act in massive halos.
Throughout this paper we adopt the following cosmology: H0 = 100 Mpc-1, and . We use a Salpeter IMF and adopt the Hubble constant = 0.7. All magnitudes are given in the AB system.
2. DATA
2.1. MaNGA IFU data
MaNGA (Bundy et al., 2015; Yan et al., 2016b) is an integral field unit (IFU) survey on the SDSS 2.5m telescope (Gunn et al. 2006), as part of the SDSS-IV survey (Albareti et al., 2017; Blanton et al., 2017). MaNGA makes use of a modification of the BOSS spectrographs (Smee et al. 2013) to bundle fibres into hexagons (Drory et al. 2015). Each spectra has a wavelength coverage of 3500-10,000Å, and instrumental resolution 60 kms-1 . After dithering, MaNGA data have an effective spatial resolution of 2.5″(FWHM; Law et al. 2015), and data cubes are gridded with 0.5″spaxels.
In this study, we use 4690 galaxies with taken from the MaNGA MPL-6 version of the internal release. To eliminate the effect of inclination to our analysis, we only use galaxies with a major to minor axis ratio (b/a) greater than 0.4 (i.e., excluding high-inclination systems with ). This selection results in 4273 galaxies in our sample. We make use of the Pipe3D pipeline (Sánchez et al., 2016a) to model the stellar continuum with the GSD156 library of simple stellar populations (SSPs; Cid Fernandes et al., 2013) that comprises 156 templates covering 39 stellar ages (from 1Myr to 14.1Gyr), and 4 metallicities (Z/Z=0.2, 0.4, 1, and 1.5), extracted from a combination of the synthetic stellar spectra from the GRANADA library (Martins et al., 2005) and the MILES project (Sánchez-Blázquez et al., 2006; Vazdekis et al., 2010; Falcón-Barroso et al., 2011). Details of the fitting procedures are described in Sánchez et al. (2016b). In short, a spatial binning is first performed in order to reach a S/N of 50 accross the entire field of view (FoV) for each datacube. A stellar population fit of the coadded spectra within each spatial bin is then computed. The stellar population model for spaxels with continuum S/N 3 is then estimated by re-scaling the best fitted model within each spatial bin to the continuum flux intensity in the corresponding spaxel, following Cid Fernandes et al. (2013) and Sánchez et al. (2016a). The stellar mass surface density () is obtained using the stellar mass derived for each spaxel and normalized to the physical area of one spaxel. The best-fit stellar continuum is then subtracted from the reduced data spectrum for the emission line measurements, which are measured spaxel by spaxel using a weighted momentum analysis as described in (Sánchez et al., 2016b, 2018). All the emission lines were dust extinction corrected by using the Balmer decrement computed at each spaxel of the IFU cube, following the method described in the Appendix of Vogt et al. (2013). An extinction law with Rv = 4.5 (Fischera & Dopita, 2005) and Calzetti (2001) attenuation curve is used. These emission line measurements are later used for the ionizing source classification through the Baldwin-Phillips-Terlevich (BPT) excitation diagnostic diagrams (Baldwin et al., 1981; Veilleux & Osterbrock, 1987; Kauffmann et al., 2003; Kewley et al., 2006). The classification is not sensitive to the dust reddening law since the lines in each pair used for the line ratio calculations are close enough in the wavelength.
2.2. Halo mass
The halo masses of our sample are adopted from the group catalog kindly made available by Yang et al. (in private communication). This catalog updates the SDSS DR4 group catalog of Yang et al. (2007, 2008) to the SDSS DR7 version. The galaxy groups are identified using an adaptive halo-based group finder based on the NYU-VAGC Catalog (Blanton et al., 2005). The match to Yang’s group catalog results in a subsample of 2915 galaxies with halo mass measurements.
For each galaxy, the group catalog provides two estimates for its halo mass: (1) , based on the ranking of the characteristic luminosity , the total luminosity of all group members with ; (2) , based on the ranking of the characteristic stellar mass , the total stellar mass of all group members with . Detailed tests with mock catalogs have shown that the halo masses are estimated reliably, with a standard deviation of about 0.3 dex (Yang et al., 2008). The two halo mass estimates yield very similar results for our analyses. In this paper, we present the results based on the luminosity-based halo mass .
3. Methods
With the advent of large IFU surveys, such as CALIFA, MaNGA, etc, ones are able to probe the emission line properties in sub-regions within the galaxies. In Hsieh et al. (2017), we confirmed the so-called ‘resolved star-forming main sequence’ (Sánchez et al., 2013; Cano-Díaz et al., 2016; González Delgado et al., 2016), the tight correlation between the star formation rate surface density and the stellar mass surface density () on kpc scales for HII regions classified based on the BPT line diagnostics. In addition, we found that the H surface density () is also strongly correlated with for regions classified as LI(N)ERs. The emission power of LI(N)ER regions is lower than that of the HII regions by nearly two orders of magnitude at a fixed . The existence of this relation is in support of the scenario that LI(N)ER regions are primarily powered by hot evolved stars (e.g., Binette et al., 1994; Stasińska et al., 2008; Sarzi et al., 2010; Yan & Blanton, 2012; Singh et al., 2013; Papaderos et al., 2013; Gomes et al., 2016; Belfiore et al., 2016, 2017), whose abundance is proportional to the stellar mass. Since the emissions from hot evolved stars only begin to dominate after tens of Mys after the OB stars stop forming (Zhang et al., 2017) and the emission power of LI(N)ER is only a few percent of that of star-forming regions (Hsieh et al., 2017), spaxels classified as LI(N)ER can be regarded as regions where the star formation has already ceased. This kind of association between the LI(N)ER regions and the ‘retired’ or ‘quenched’ areas has also been previously investigated in other works (Singh et al., 2013; Belfiore et al., 2016, 2017). Nevertheless, it is worth noting that some LI(N)ER-like emission may be associated with a weakly active galactic nucleus or shocks (e.g., in interacting galaxies), which normally have high equivalent widths (EW). In order to remove contributions from non-quenching origins of LI(N)ERs, we apply an EW (H) cut when identifying the quenched areas (see the next paragraph).
For a given galaxy, we can then quantify the degree and the spatial distribution of the quenched areas by looking into the abundance and locations of the quenched spaxels. In this work, we thus define two quantities, and , to describe the fraction and the concentration of the quenched areas within a galaxy, respectively. For each spaxel of MaNGA data, we first classify the emission line regions using the BPT diagrams. We adopt the dividing curves suggested in the literature (e.g., Kewley et al., 2001; Kauffmann et al., 2003; Cid Fernandes et al., 2010) to separate various regions into HII, LI(N)ER, composite, and AGN regimes by using the [NII]/H and [OIII]/H ratio as illustrated in the Figure 7 of Lin et al. (2017a) . To differentiate contributions between quenched regions (or sometimes called ‘retired regions’ ) and other ionizing sources (e.g., weakly AGNs or shocks) in powering LI(N)ERs, we further apply an EW(H) ¿ -3Å (positive value for absorption) cut in LI(N)ER spaxels when identifying final quenched areas (Cid Fernandes et al., 2011; Hsieh et al., 2017). Releasing the equivalent width criterion to EW(H) ¿ -6Å (e.g., Sánchez et al., 2015) would result in an increase of inside-out quenching fraction (defined below) by % and change the outside-in quenching fraction with differences ranging from -50% to +20%. Nevertheless, this does not affect our main results and conclusions.
For each galaxy, we define the quenched fraction (or ‘quiescence’ hereafter), , as the following:
| (1) |
where is the total number of spaxels within 1.5 with stellar mass surface density greater than kpc-2 and with at least one of the four emission lines (H, H, [NII], [OIII]) above the S/N threshold (3 for H and H; 2 for [NII] and [OIII]), and is the number of quenched spaxels (only galaxies with are considered in this work). The stellar mass surface density cut is motivated by the data distribution on the star formation rate surface density vs. stellar mass surface density plane of Abdurro’uf (2018, see their Figure 7). Our conclusions remain the same even if a higher cut of kpc-2 is applied.
The concentration of the quenched spaxels (hereafter ‘quenching concentration’), , is computed as:
| (2) |
where refers to the distance of a given spaxel to the galaxy center, corrected for the inclination. While represents the degree of quenching in a galaxy, reflects the spatial distribution of the quenched area.
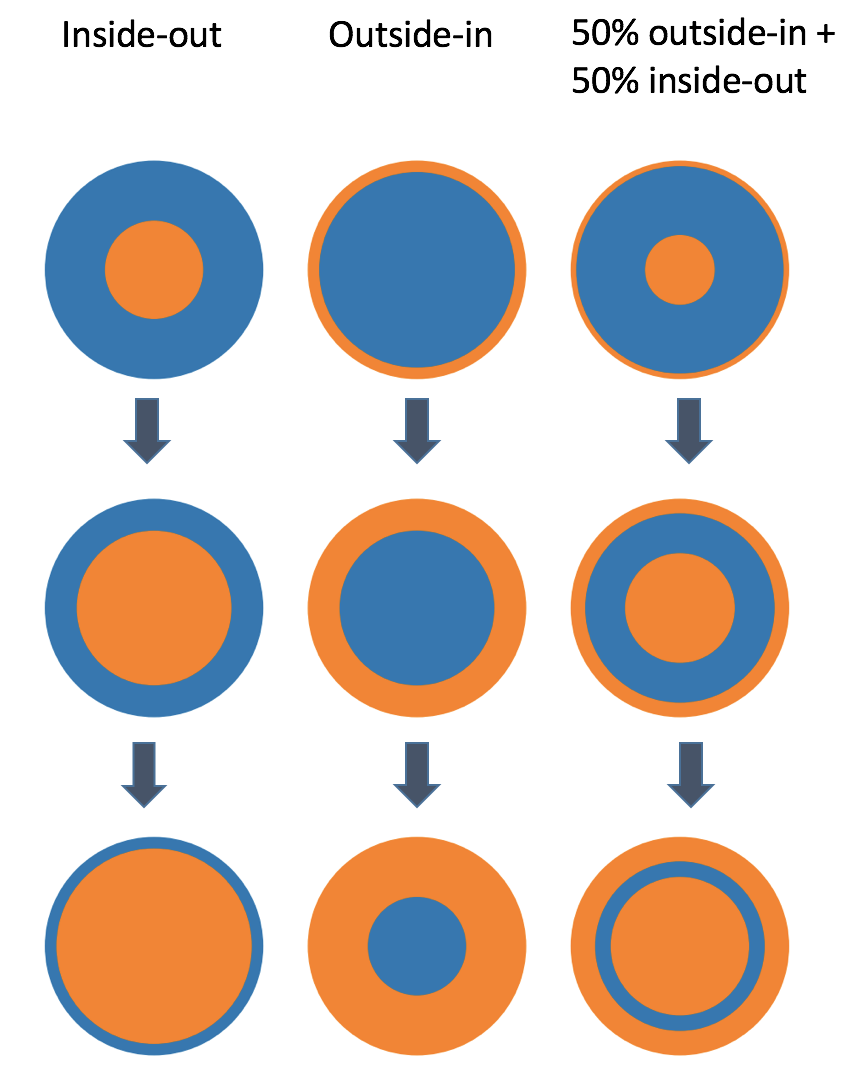
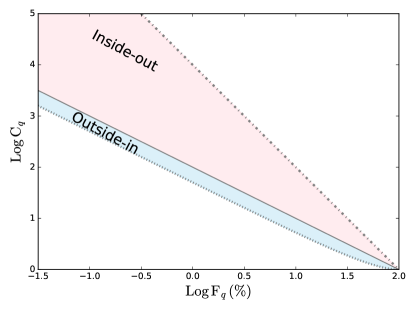
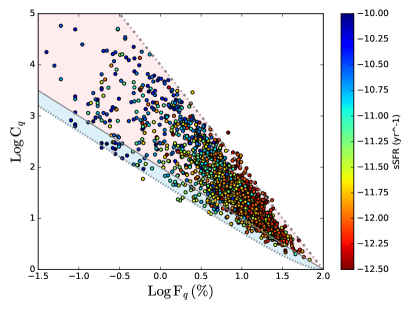
The combination of and provides a powerful method for describing the spatial sequence of quenching. At a fixed , galaxies with quenching occurring in the inner regions have a greater value of than those with quenching occurring in the outskirts. In other words, the inside-out quenching and outside-in quenching will follow different trajectories in the vs. diagram. To illustrate this point, we perform two sets of toy models, one with inside-out quenching, starting from the inner spaxels to the outer spaxels (see the left sequence in Figure 1) and the other with outside-in quenching, proceeding with the opposite direction (see the middle sequence in Figure 1), assuming a perfect circle. For each set of the models, we create 80 equally-spaced annulus bins. In each step, we shift the annulus boundary that separates the quenched and unquenched areas by one annulus bin and compute and . The obtained inside-out and outside-in quenching trajectories are shown as the dot-dashed line and the dotted line in Figure 2, respectively. In fact, these two trajectories can also be derived analytically. In Appendix A, we consider a general case where there is a mixture of inside-out and outside-in quenching within a galaxy (see the right sequence in Figure 1). The equations describing the pure inside-out and outside-in quenching lines can be obtained using Equation A.15 by adopting (the contribution of inside-out quenching) = 100 and 0, respectively:
| (Inside-out) | (3) | ||||
| (Outside-in) | (4) |
By comparing the locations of the observed and of galaxies with the models, we are able to categorize whether a galaxy is more inside-out quenching like or outside-in quenching like. The criteria we adopted for the selection of quenched areas only concern the stellar mass surface density, the line equivalent width, and the line ratios, all of which do not directly depend on the observation resolution. As the two parameters ( and ) deal with the relative quantities, our method is not that sensitive to the spatial resolution in the case where there are sufficient resolution elements. Nevertheless, it is worth noting that very compact regions of quenched areas could be missed in our data and can only be resolved with greater spatial resolutions. Higher resolution observations would be required to investigate whether this is an important effect or not.
4. Results
| Subsample | Stellar mass cut | () | (%) | (%) |
|---|---|---|---|---|
| Centrals | 11.95 | |||
| Centrals | 12.49 | |||
| Centrals | 13.37 | |||
| Centrals | 14.21 | |||
| Satellites | 11.88 | |||
| Satellites | 12.59 | |||
| Satellites | 13.58 | |||
| Satellites | 14.67 | |||
| Satellites | 12.83 | |||
| Satellites | 13.60 | |||
| Satellites | 14.30 |
| Subsample | Stellar mass cut | () | Fraction(%) |
|---|---|---|---|
| AGN | 11.86 | ||
| AGN | 12.46 | ||
| AGN | 13.41 | ||
| AGN | 14.53 | ||
| 11.89 | |||
| 12.61 | |||
| 13.60 | |||
| 14.76 | |||
| 12.84 | |||
| 13.61 | |||
| 14.30 |
4.1. The dependence of quiescence () and concentration () on the global sSFR
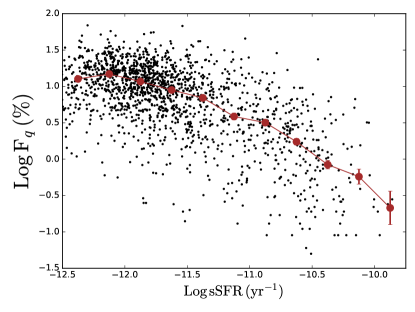
Our working assumption is that the regions showing LI(N)ER-like emissions and with low EW(H) are essentially places where the star formation has already ceased. If this is true, one would expect that more active star-forming galaxies should have lower whereas quiescent galaxies tend to have high . This correlation is illustrated in Figure 3, where we plot the quiescence () vs. the global sSFR computed from Pipe3D. As expected, the quiescence parameter decreases with increasing global sSFR, although with large scatter. The scatter is greater for galaxies with high sSFR. This is because the strength of the sSFR may differ in HII spaxels among galaxies even at a given fixed fraction of LI(N)ER spaxels. Nevertheless, it is still encouraging to see the anticorrelation between the defined quiescence and global sSFR.
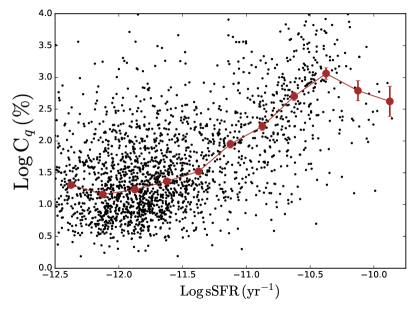
Next, we plot the quenching concentration () as a function of global sSFR in Figure 4. We find that there is also a fairly good correlation between and global sSFR. Galaxies with lower sSFR tend to have more extended distributions of quenched area, and hence low . However, we also notice that seems to decline with sSFR for galaxies with log(sSFR) . This is likely due to the small number statistics of both the sample size of galaxies in the two highest log(sSFR) bins and the small number of retired spaxels associated with them.
4.2. Quiescence () vs. quenching concentration ()
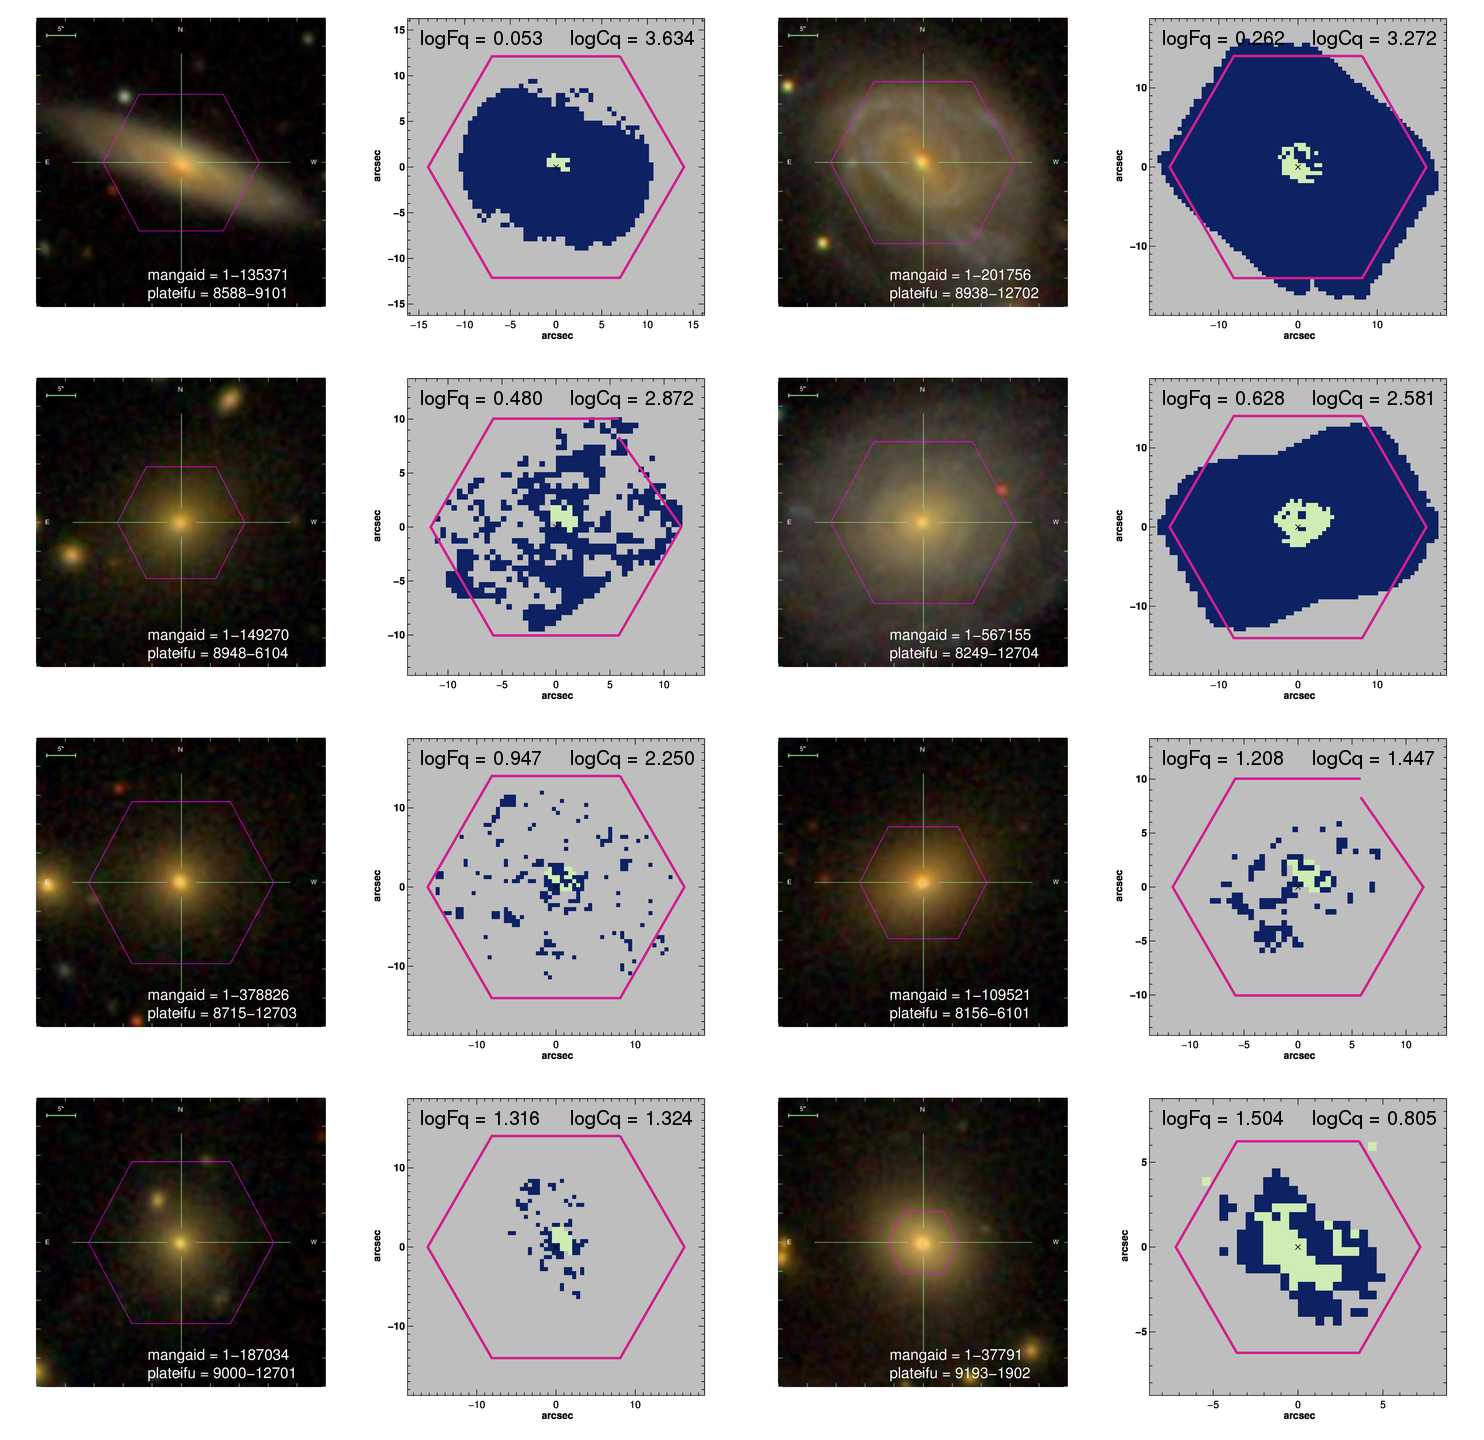
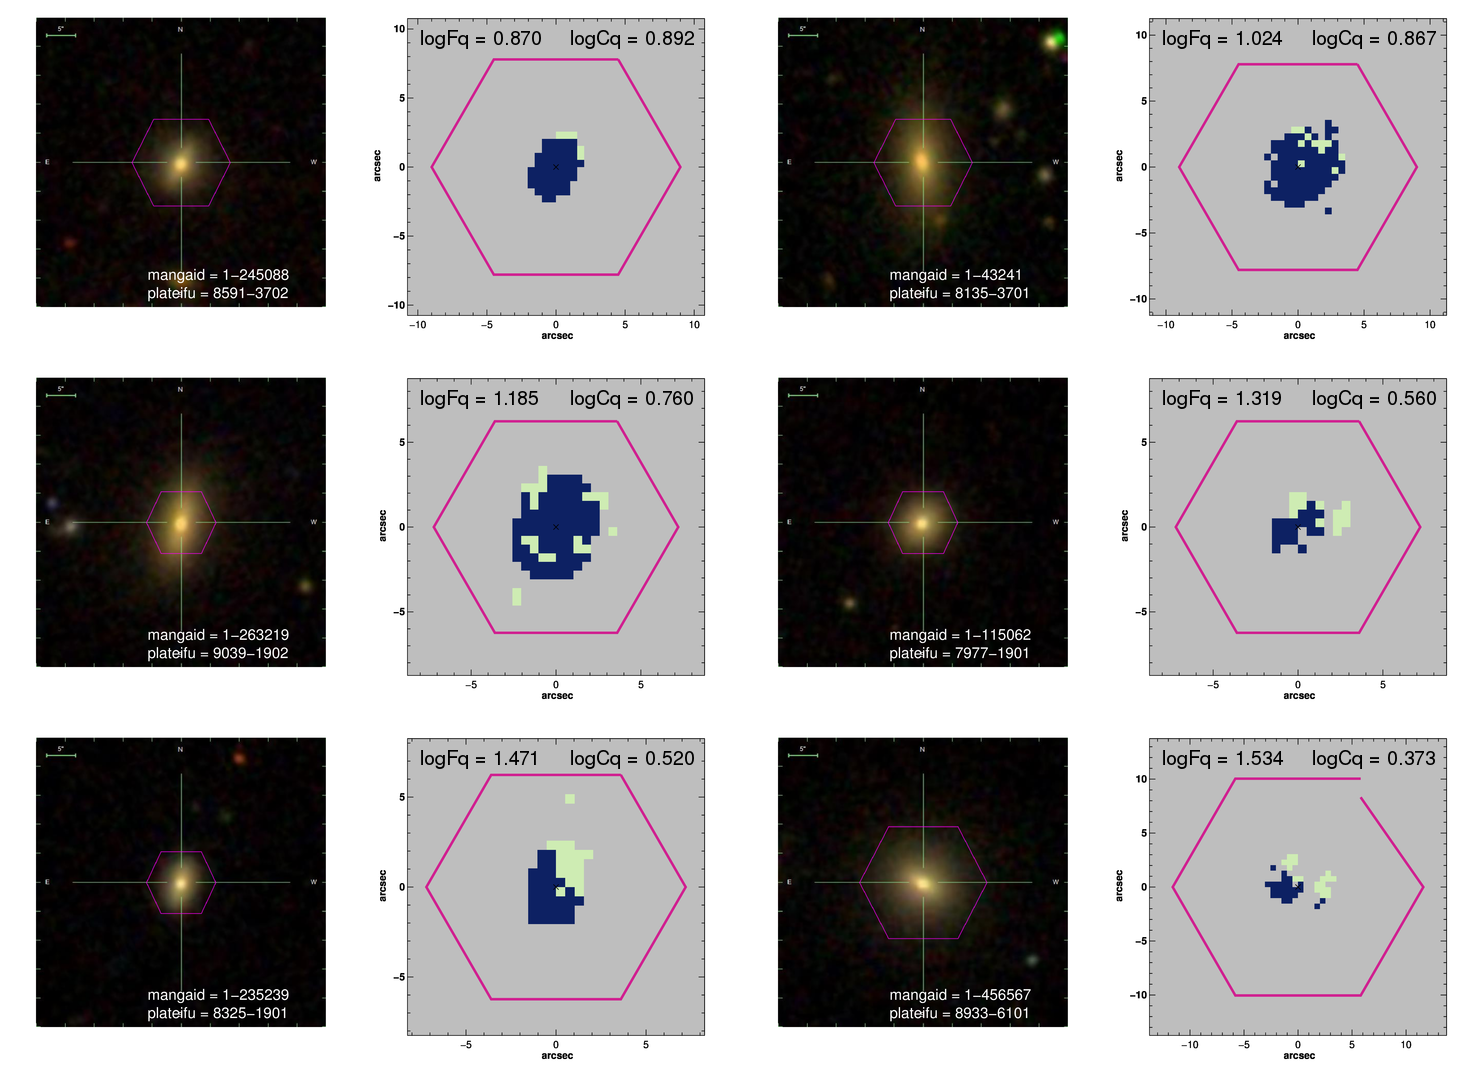
In figure 5 we plot the distributions of all MaNGA galaxies on the versus plane, color-coded according to their global sSFR. The two toy model lines are also shown to guide the eyes. It can be seen that our sample spreads over the regions between the two model lines on the versus plane. This could be attributed to two effects. First, the quenching may not occur subsequently with increasing or decreasing radius and/or that there could be mixed modes of quenching for most of the galaxies. For example, when a centrally quenched galaxy due to prior AGN or morphological quenching falls into a cluster environments and hence suffers from ram pressure stripping, it can exhibit both the inside-out and outside-in quenching features. Secondly, as illustrated in figures 6 and 7, the spatial distribution of quenched areas may be patchy, not necessarily axis-symmetric.
In order to properly classify galaxies into the outside-in and inside-out quenching categories, we analytically compute the and values by varying the relative contributions from the two modes and investigate how these two parameters change on the versus plane. The detailed calculations are given in the Appendix A. As illustrated in Figure A1, even a small contribution from the outside-in quenching will move the locations toward the pure outside-in quenching line. Therefore, we define a dividing line (gray line), which corresponds to the 50% inside-out and 50% outside-in quenching contributions to separate the two types of quenching modes. Galaxies lying below (above) this threshold line are counted as outside-in (inside-out) dominant quenching.
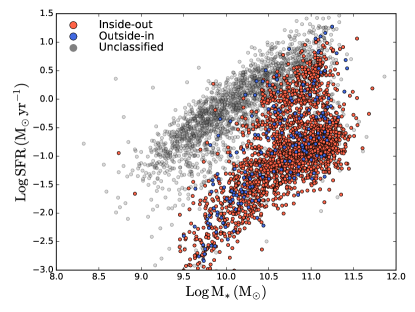
Figure 8 presents the global SFR – distribution derived from the Pipe3D analysis of the full MaNGA sample, color-coded according to their quenching types (red: inside-out; blue: outside-in; grey: unclassified). We split the sample into two stellar mass bins. For massive galaxies (), those objects showing either inside-out (68%) or outside-in (5%) quenching features are located in the lower side of the star-forming sequence and the quiescent population. On the other hand, in the low mass bin ( ), 31% are classified as inside-out quenching while 5% are classified as outside-in quenching. These low-mass galaxies with quenching features predominately lie in the quiescent (passive) population.
4.3. The halo mass dependence of the inside-out and outside-in quenching
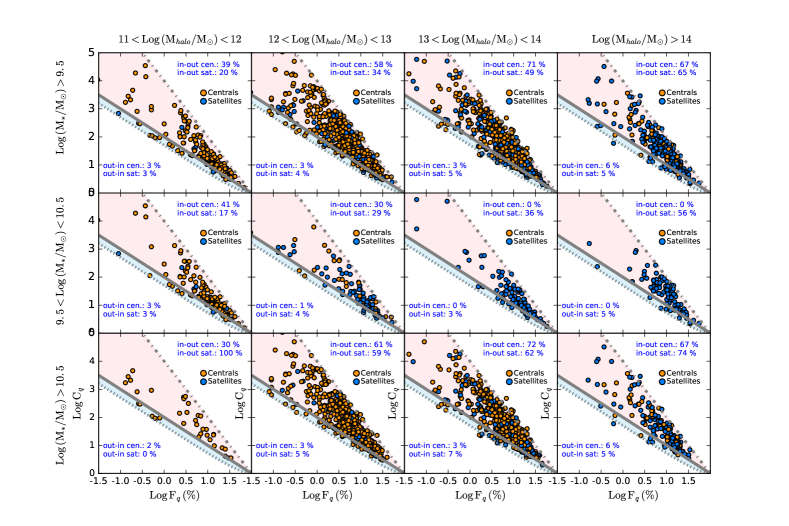
To see how environments might affect the quenching patterns of galaxies, we make a similar plot by binning the galaxies based on their hosting halo masses for all galaxies with (top panels of Figure 9). For this purpose, we limit our sample to 2915 galaxies that have the halo mass meausurements. As the strength of ram-pressure stripping is proportional to the density of intergalactic medium (Gunn & Gott, 1972), it has been suggested to take place in denser environments, such as galaxy clusters. If ram pressure stripping is indeed a dominant process that quenches the star formation in cluster-like halos, we would expect to see fractionally more galaxies classified as outside-in quenching with increasing halo mass. As mentioned in Sec. 4.2, the fractions of galaxies that exhibit inside-out or outside-in quenching features are stellar mass dependent. In order to remove the stellar mass effect, we also present the results in two stellar mass bins, and , in the middle and bottom panels, respectively. The two stellar mass cuts adopted here yield a similar dynamical range in terms of stellar mass and are also able to provide sufficient number of satellites in different halo mass bins for subsequent analyses. For centrals and satellites, we compute the fraction of galaxies exhibiting inside-out quenching patterns (fin-out) as the following:
| (5) | ||||
| (6) |
where () is the number of total central (satellite) galaxies and () is the number of central (satellite) galaxies classified as inside-out quenching. There are galaxies, however, which do not have LI(N)ER spaxels within 1.5 , meaning that neither their nor is computed. These galaxies are typically star-forming galaxies as illustrated in Figure 8 and can not be categorized in either inside-out quenching or outside-in quenching. In others words, + 1. Therefore, we separately compute the fraction of galaxies exhibiting outside-in quenching patterns (fout-in):
| (7) | ||||
| (8) |
where () is the number of central (satellite) galaxies classified as outside-in quenching. The derived values of fin-out and fout-in are shown in the upper-right and lower-left corners of each panel, respectively, as well as in Table 1.
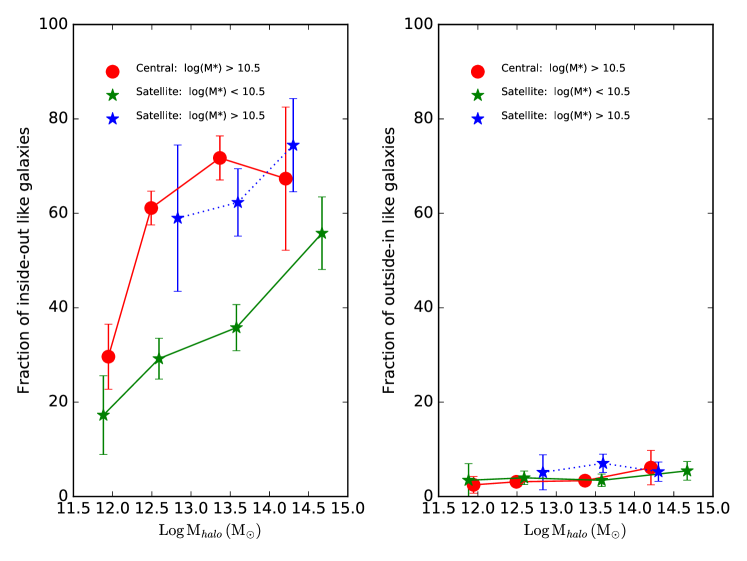
In the left panel of Figure 10, we show the fraction of galaxies exhibiting inside-out quenching patterns (fin-out) as a function of halo mass. For centrals, we only present results with as the statistics for less massive centrals are relatively poor in massive halos. We see that fin-out increases with hosting halo mass for both centrals and satellite galaxies. For the satellites, fin-out is significantly higher for high stellar mass galaxies than the low stellar mass ones at a given halo mass. This phenomenon is consistent with the finding that the fraction of centrally suppressed galaxies or central LI(N)ER galaxies increases with the stellar mass (Belfiore et al., 2017; Spindler et al., 2018). Recalling that not all galaxies possess enough LI(N)ER features to be classified as inside-out quenching or outside-in quenching, fin-out and fout-in does not necessarily sum to one. To see the trend for the fraction of galaxies exhibiting outside-in quenching patterns (fout-in), we plot fout-in versus halo mass in the right panel of Figure 10.
Interestingly, it is shown that the fraction of outside-in quenching galaxies does not strongly depend on the halo mass, for either centrals or satellites. The flat dependence on the halo mass for satellites suggests that the ram-pressure stripping may not be a dominant, at least not the only channel, to suppress the star formation of massive satellites in groups and clusters. However, we note that the dividing line (50% inside-out and 50% outside-in) adopted here is closer to the pure outside-in trajectory (dotted line) and hence it is possible that our results are affected by the small statistics of the outside-in galaxies. To test the robustness of our results, we also repeat the analyses by using the other two dividing lines that correspond to the 60% inside-out vs 40% outside-in and 70% inside-out vs 30% outside-in contributions (see Appendix A). We find that the flat dependence of the outside-in fraction on the halo mass still holds in these two cases, despite that the fraction of outside-in quenching galaxies increases as a result while moving the dividing line away from the pure outside-in trajectory,
5. DISCUSSION
5.1. What drives the inside-out quenching?
Our results show that the fraction of galaxies showing an inside-out quenching pattern, strongly depends on the halo mass, regardless of being a central galaxy or a satellite. The increasing frequency of inside-out quenching with halo mass still holds even we split the satellites into two stellar mass bins. Furthermore, we find that more massive galaxies tend to have higher fractions of inside-out quenching than less massive ones, irrespective of their environments. This is in line with the finding in the literature that high-mass galaxies tend to exhibit suppressed sSFR in the galactic cores as opposed to low-mass galaxies (Belfiore et al., 2018; Liu et al., 2018; Sánchez et al., 2018). Our results suggest that the effect of inside-out quenching depends on both stellar mass and halo mass.
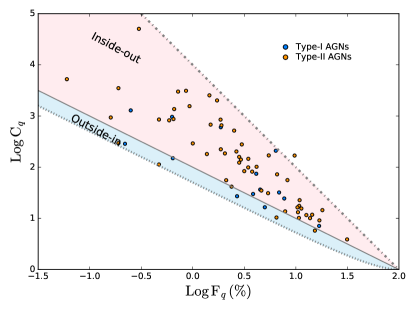
Among all the mechanisms that may suppress the star formation, AGN feedback (e.g., Bower et al., 2006; Croton et al., 2006; Fabian, 2012) or morphological quenching (Martig et al., 2009), may potentially drive the features of the inside-out quenching. The study of molecular gas properties of a preliminary set of MaNGA-selected green valley galaxies suggests that the gas is depleted in an inside-out fashion, possibly attributed to the AGN feedback (Lin et al., 2017b). In order to investigate whether these processes are responsible for the halo mass dependence of the inside-out quenching, we first investigate the frequency of AGN and galaxies with high Sérsic index as a function of halo mass in our sample. For the study of AGNs, we utilize the emission-line selected AGN candidates identified by (Sánchez et al., 2018), updated with the MPL-6 version. The AGN sample contains both Type-I and Type-II AGNs. It is found that the properties of their host galaxies differ slightly in the SFR vs. stellar mass plane – Type-I AGN hosts span a wide range of sSFR, from star-forming to quiescent, whereas Type-II AGN hosts are preferentially located in the green valley and the high-sSFR end of the quiescent population (see Figure 4 of Sánchez et al., 2018, for details). Figure 11 shows the distributions of two types of AGNs on the vs. plane. It is clear that Type-I and Type-II AGNs are distributed differently in this diagram– 38% and 15% of galaxies hosting a Type-I AGN show the inside-out and outside-in quenching patterns, respectively, compared to Type-II AGNs (66% vs. 8%). However, the location of Type-I AGN could be strongly affected by the lack of LI(N)ER detection in the central regions that are heavy ionized by the AGN itself, leading to the deficit of inside-out quenching Type-I AGN seen in the analysis.
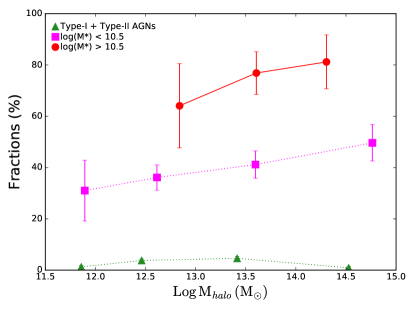
In Figure 12 and Table 2 we show the ratio of the number of Type-I plus Type-II AGNs to the number of total galaxies with as a function of halo mass. It can be seen that the AGN fraction peaks in halos with masses between to , roughly corresponding to the group scales, and drops towards massive cluster-scale halos. This trend remains similar if we restrict the sample to Type-I or Type-II AGNs only, and is different from the increasing inside-out fraction with halo mass. Our finding that the frequency of optically-selected AGNs peaks on group scales is similar to the trend found for samples of X-ray and radio selected AGNs (Sánchez & González-Serrano, 2002; Best, 2004; Arnold et al., 2009; Davies et al., 2017).
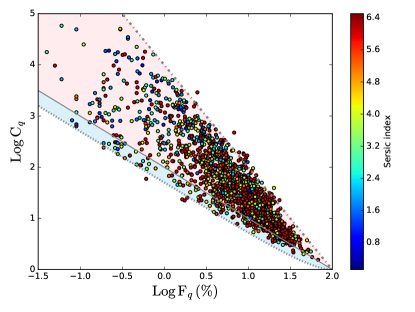
Figure 13 shows how the galaxies with different Sérsic indices () are distributed in the and plane. We see that galaxies with higher Sérsic index tend to occupy the inside-out regions. 70% and 6% of galaxies with 3 are classified as inside-out and outside-in quenching, respectively. On the other hand, only 17% and 1% of galaxies with 3 are classified as inside-out and outside-in quenching, respectively. The high inside-out quenching fraction seen in galaxies with high is somewhat expected since it is well-known that galaxies with high Sérsic index or bulge-to-total (B/T) have lower sSFR (Whitaker et al., 2015; Pan et al., 2018) and that the bulges tend to have old stellar populations (González Delgado et al., 2015; McDermid et al., 2015; López Fernández et al., 2018) and lower sSFR (Pan et al., 2018). In Figure 12 (also see Table 2) we show the fraction of satellite galaxies with 3 as a function of halo mass for two stellar mass bins (red symbols). In the case of low-mass satellites for which we have enough statistics, it is shown that the fraction of high-Sérsic index galaxies strongly increases with halo mass, as seen in the fraction of inside-out galaxies. The trend remains similar if we change the threshold of the Sérsic index to a higher value of 3.5 or a lower value of 2.5.
Unlike the AGN fraction, which is much smaller compared to the inside-out fraction, the fraction of galaxies with high-Sérsic index is comparable to that of the inside-out galaxies. The good agreement in the halo mass dependence between the high Sérsic fraction and inside-out fraction indicates that morphological quenching could be responsible for the growing inside-out quenched galaxies found in more massive halos. Our results seem to favor morphological quenching (Martig et al., 2009) over the AGN feedback as the primary cause for the similar environment dependence of the inside-out quenching. However, it should be noted that the duty cycles of AGN and the timescale of morphological quenching may be quite different. As discussed in Sánchez et al. (2018), the timescale of active AGN phase may be on the order of Gyr (Parma et al., 2007; Shulevski et al., 2015), which could be shorter than the star formation quenching timescale itself. On the other hand, morphological quenching operates over longer period once the bulge component forms. Galaxies showing inside-out quenching features may be a result of accumulated quenching events over time in the past rather than an on-going event. Therefore, we can not rule out the possibility that galaxies are quenched when they are located in groups (the ’pre-processing’ effect), where the AGN is more frequent as seen in our data, after which they fall into bigger clusters.
An alternative process that is commonly thought to operate in dense environments is called ‘strangulation’ (or ‘starvation’), refers to the situation where galaxies fail to replenish the gas due to the removal of extended gas halo. This effect is suggested to be stronger when galaxies fall into dense environments such as groups or cluster of galaxies (Larson et al., 1980; Kawata & Mulchaey, 2008). Strangulation is predicted to suppress the star formation uniformly over the entire galaxy and therefore produces spatial distribution of star formation that is distinct from other mechanisms. It has been argued that strangulation is the primary channel to quench the star formation of satellites (van den Bosch et al., 2008; Peng et al., 2015; Spindler et al., 2018), although the exact dependence of environments has not been well constrained. There has been an increasing number of studies finding the global suppression of star formation in green valley galaxies or satellite galaxies by comparing their star formation rate or specific star formation rate gradients with respect to the reference sample (Belfiore et al., 2018; Spindler et al., 2018), favouring the strangulation quenching scenario. However, it should be stressed that spatially uniform suppression of star formation is not necessarily in contradiction with the inside-out or outside-in quenching defined in this work, which are characterized based on the already quenched areas within the galaxies. As the areas with sSFR below a certain threshold will become a LI(N)ER and hence are defined as quenched regions first, depending on the initial slope of the star formation rate profile, the global reduction of star formation may result in the inside-out or outside-in quenching features.
5.2. What drives the outside-in quenching?
A few processes associated with environments may potentially be responsible for the outside-in quenching features. Ram-pressure stripping has long been suggested to be one of the primary mechanisms that suppress the star formation of galaxies in groups and clusters. When galaxies fall into massive groups or clusters, they experience winds caused by the its relative motion to the hot intraclustser medium (ICM). As a result, the diffuse interstellar medium (IGM) in the outer parts of galaxies can be stripped, leading to the cessation of star formation. An alternative explanation for the outside-in quenching is through galaxy mergers. Both observations and simulations have demonstrated that galaxy interactions can induce gas inflow to the central parts of galaxies, trigger starbursts (Barnes & Hernquist 1996; Cox et al. 2006; Lin et al. 2007; but see Bergvall 2003; Barrera-Ballesteros et al. 2015; Fensch et al. 2017 for different findings) and possibly AGN activities (Di Matteo et al., 2005; Hopkins et al., 2006; Ellison et al., 2008). Recent merger simulations further suggest that the star formation could be suppressed at large galactocentric radii during galaxy-galaxy interactions as a result of gas inflow while the star formation rate in the central part of galaxies is strongly enhanced, followed by an immediate truncation of star formation after the gas fuel is fully consumed. (Moreno et al., 2015). Under this circumstance, quenching may possibly occur in an outside-in fashion during some phases of galaxy mergers. Observations and simulations found that galaxy mergers are typically more frequent in dense environments (Lin et al., 2010) and peaks in halos with halo mass (Jian et al., 2012). Therefore, if ram-pressure stripping process is effective in removing the cold gas from the outskirts of galaxies, we expect to see higher fraction of galaxies with outside-in patterns in massive halos, especially in clusters of galaxies. On the other hand, if galaxy-galaxy interactions dominate the outside-in quenching, the fraction of outside-in quenching galaxies is expected to peak around the group scales.
As shown in Figure 10, the dependence of fout-in on halo mass is nearly flat for both low mass and high mass satellites, which indicates that neither ram-pressure stripping nor galaxy interactions play a dominant role in producing the outside-in quenching processes. Either both processes may contribute to some degrees or there could be some other mechanism that causes the outside-in quenching features. Nevertheless, it is worth noting that majority of (partially) quenched satellite galaxies is instead in the inside-out quenching category, which strongly depends on halo mass. In other words, while ram-pressure stripping or galaxy interactions may act in massive halos, they may not be the primary mechanisms that produces a higher fraction of passive galaxies seen in the groups and clusters relative to the field galaxies (Lin et al., 2014; Jian et al., 2017, 2018).
5.3. Comparisons with other works
Since the advent of large IFU surveys, there has been a growing number of environmental studies based on the spatial distributions of stellar populations and star formation rate (e.g., Goddard et al., 2017; Zheng et al., 2017; Schaefer et al., 2017; Spindler et al., 2018; Medling et al., 2018). While most studies are based on the gradients of age, star formation rate, or specific star formation rate, our approach probes the spatial distribution of quenched areas, which provides complementary information. Therefore, it would be intriguing to compare our results with previous environmental works based on the IFU observations.
Spindler et al. (2018) studied the environmental effects by exploring the sSFR gradients in central and satellite galaxies using 1494 MaNGA galaxies. In their study, they classified their galaxies into centrally unsuppressed and suppressed types. The former class on average shows flat profiles in sSFR while the latter exhibits positive slopes in the sSFR gradient. By comparing the sSFR of the satellites relative to the centrals with the same stellar mass, they found a global suppression in the satellites and concluded that their results favor the strangulation scenario. Supposedly if the reduction in the sSFR is spatially uniform, the centrally suppressed galaxies will display the inside-out quenching feature according to our definition, as the central spaxels become LI(N)ER first. On the other hand, the centrally unsuppressed galaxies will not appear as inside-out nor outside-in quenching since the local spaxels become the LI(N)ER regions simultaneously once their sSFRs drop below the HII threshold. Although it is not straightforward to directly translate our results to the gradient studies given the different natures between our approaches, both works seem to point out that outside-in quenching plays a less vital role in environmental quenching.
On the other hand, the greater fraction of inside-out quenching over outside-in quenching found in our work seems to be in direct conflict with the work carried out by Schaefer et al. (2017), who studied the star formation rate gradients in the SAMI sample and concluded that in dense environments the star formation quenches outside-in. However, there is a fundamental difference between our analyses–the environments are traced by the local nearest neighbour density in Schaefer et al. (2017) whereas in this work we focus on the halo mass. These two environment proxies do not necessarily have one-to-one correspondence. As shown in Figure 12 of Lin et al. (2016), there is a wide spread of local density at a given halo mass–at low redshifts the highest density is actually dominated by groups rather than clusters. Thus, the relative strength of various environment effects may differ between our samples.
6. CONCLUSIONS
Using the spatially resolved data cubes of 2915 galaxies drawn from SDSS-IV MaNGA, we study the quenching properties of galaxies as a function of halo mass in order to probe environmental quenching effects. We use LI(N)ER regions with low EW(H) to trace the quenched areas and we define two non-parametric parameters, quiescence () and its concentration (), to quantify the strength and the spatial distribution of the quenched areas. With the combination of these two parameters, we are able to classify galaxies into two categories: inside-out and outside-in quenching, and to study their frequency in different mass of halos. Our results can be summarized as follows:
1. The fraction of galaxies showing inside-out quenching increases with both stellar mass (at a fixed halo mass) and halo mass (at a fixed stellar mass). On the other hands, the frequency of outside-in quenching is almost independent of the halo mass. In nearly all local environments, the frequency of inside-out quenching is higher than the frequency of outside-in quenching at a fixed stellar mass and halo mass. The difference between the two quenching modes is more pronounced for galaxies located in the more massive halos. Our results suggest that inside-out quenching is the dominant quenching mode in all environments.
2. We find that the increasing fraction of galaxies exhibiting a high Sérsic index (and hence a greater bulge component) with halo mass is similar to the halo mass dependence of the inside-out quenching, suggesting a plausible link between these two phenomena. On the other hand, the frequency of AGNs peaks at group scales, different from the rising curve of the inside-out quenching with respect to the halo mass. Our result seems to favour the morphological quenching over AGN feedback as a primary mechanism driving the environmental dependence of the inside-out quenching, although this could be affected by the issue of uncertainties in the AGN duty cycle.
3. The lack of the halo mass dependence of outside-in quenching suggests that neither the ram-pressure stripping, nor the galaxy-galaxy merger, is the dominant process in act in massive halos. It is likely both mechanisms contribute to the outside-in quenching seen in different environments.
Our method that characterizes the quenched areas provides a complementary approach in investigating the quenching mechanisms with respect to other studies that are based on the spatial gradients in the (specific) star formation rate and stellar populations. This study has revealed that both inside-out and outside-in quenching coexist in different environments and that inside-out quenching dominates in the more massive halos. Combining MaNGA data with future spatially resolved molecular gas observations from ALMA will be key to further understand the cause of quenching in different environments.
Appendix A A. Toy models
Let’s consider a perfectly circular galaxy with external radius . The inside-out quenching region is a circular section of the galaxy with a radius around the nucleus. The outside-in quenching region extends from radius to . We will define so that and are numerically equivalent to fractions of the total galaxy radius. In that case, the total circular area of a galaxy is numerically identical to .
The quenched fraction of a “mixed” galaxy (i.e. presenting both inside-out and outside-in quenching) is given by the fraction of quenched pixels to the total galaxy area, i.e.
| (A.1) | |||||
| (A.2) | |||||
| (A.3) |
The contribution of inside-out quenching to the value above, , can be expressed as
| (A.4) | |||||
| (A.5) |
so that we can express in terms of as
| (A.6) |
The concentration is defined as
Expressing the density of pixels as and considering the infinitesimal limit, the squared summation of radial distances up to a radius can be written as
| (A.7) | |||||
| (A.8) |
so that we can express the concentration of a “mixed” galaxy as
| (A.9) | |||||
| (A.10) |
where is the result of . From equation A.6,
and from equation A.3,
so that we can re-write the solution for (eq. A.10) as
| (A.11) | |||||
| (A.12) |
Now, in order to express and in the same notation as in the paper (log scale, and as a percent) we define
| (A.13) | |||||
| (A.14) |
so that the loci of constant values are given by
| (A.15) |
Notice that the values are fractions of the quenched area, not percent values.

References
- Abdurro’uf (2018) Abdurro’uf, A., Masayuki 2018, MNRAS, 479, 5083
- Albareti et al. (2017) Albareti, F. D., Allende Prieto, C., et al. 2017, ApJS accepted, (arXiv:1608.02013)
- Argudo-Fernández et al. (2018) Argudo-Fernández, M., Lacerna, I., & Duarte Puertas, S. 2018, arXiv:1806.02369
- Arnold et al. (2009) Arnold, T. J., Martini, P., Mulchaey, J. S., Berti, A., & Jeltema, T. E. 2009, ApJ, 707, 1691
- Baldry et al. (2004) Baldry, I. K., Glazebrook, K., Brinkmann, J., et al. 2004, ApJ, 600, 681
- Baldry et al. (2006) Baldry, I. K., Balogh, M. L., Bower, R. G., et al. 2006, MNRAS, 373, 469
- Baldwin et al. (1981) Baldwin, J. A., Phillips, M. M., & Terlevich, R. 1981, PASP, 93, 5
- Barnes & Hernquist (1996) Barnes, J. E., & Hernquist, L. 1996, ApJ, 471, 115
- Barrera-Ballesteros et al. (2015) Barrera-Ballesteros, J. K., Sánchez, S. F., García-Lorenzo, B., et al. 2015, A&A, 579, A45
- Belfiore et al. (2017) Belfiore, F., Maiolino, R., Tremonti, C., et al. 2017, accepted by MNRAS (arXiv:1703.03813)
- Belfiore et al. (2018) Belfiore, F., Maiolino, R., Bundy, K., et al. 2018, MNRAS, 477, 3014
- Belfiore et al. (2016) Belfiore, F., Maiolino, R., Maraston, C., et al. 2016, MNRAS, 461, 3111
- Bergvall et al. (2003) Bergvall, N., Laurikainen, E., & Aalto, S. 2003, A&A, 405, 31
- Best (2004) Best, P. N. 2004, MNRAS, 351, 70
- Binette et al. (1994) Binette, L., Magris, C. G., Stasińska, G., & Bruzual, A. G. 1994, A&A, 292, 13
- Blanton et al. (2005) Blanton, M. R., Schlegel, D. J., Strauss, M. A., et al. 2005, AJ, 129, 2562
- Blanton & Moustakas (2009) Blanton, M. R., & Moustakas, J. 2009, ARA&A, 47, 159
- Blanton et al. (2017) Blanton, M. R., Bershady, M. A., Abolfathi, B., et al. 2017, AJsubmitted (arXiv:1703.00052)
- Bower et al. (2006) Bower, R. G., Benson, A. J., Malbon, R., et al. 2006, MNRAS, 370, 645
- Brown et al. (2017) Brown, T., Catinella, B., Cortese, L., et al. 2017, MNRAS, 466, 1275
- Bryant et al. (2015) Bryant, J. J., Owers, M. S., Robotham, A. S. G., et al. 2015, MNRAS, 447, 2857
- Bundy et al. (2015) Bundy, K., Bershady, M. A., Law, D. R., et al. 2015, ApJ, 798, 7
- Calzetti (2001) Calzetti, D. 2001, PASP, 113, 1449
- Cano-Díaz et al. (2016) Cano-Díaz, M., Sánchez, S. F., Zibetti, S., et al. 2016, ApJ, 821, L26
- Cid Fernandes et al. (2010) Cid Fernandes, R., Stasińska, G., Schlickmann, M. S., et al. 2010, MNRAS, 403, 1036
- Cid Fernandes et al. (2011) Cid Fernandes, R., Stasińska, G., Mateus, A., & Vale Asari, N. 2011, MNRAS, 413, 1687
- Cid Fernandes et al. (2013) Cid Fernandes, R., Pérez, E., García Benito, R., et al. 2013, A&A, 557, A86
- Cooper et al. (2007) Cooper, M. C., Newman, J. A., Coil, A. L., et al. 2007, MNRAS, 376, 1445
- Cox et al. (2006) Cox, T. J., Jonsson, P., Primack, J. R., & Somerville, R. S. 2006, MNRAS, 373, 1013
- Croton et al. (2006) Croton, D. J., Springel, V., White, S. D. M., et al. 2006, MNRAS, 365, 11
- Davies et al. (2017) Davies, R. I., Hicks, E. K. S., Erwin, P., et al. 2017, MNRAS, 466, 4917
- Dressler (1980) Dressler, A. 1980, ApJ, 236, 351
- Di Matteo et al. (2005) Di Matteo, T., Springel, V., & Hernquist, L. 2005, Nature, 433, 604
- Drory et al. (2015) Drory, N., MacDonald, N., Bershady, M. A., et al. 2015, AJ, 149, 77
- Elbaz et al. (2011) Elbaz, D., Dickinson, M., Hwang, H. S., et al. 2011, A&A, 533, A119
- Ellison et al. (2008) Ellison, S. L., Patton, D. R., Simard, L., & McConnachie, A. W. 2008, AJ, 135, 1877
- Ellison et al. (2018) Ellison, S. L., Sánchez, S. F., Ibarra-Medel, H., et al. 2018, MNRAS, 474, 2039
- Fabian (2012) Fabian, A. C. 2012, ARA&A, 50, 455
- Falcón-Barroso et al. (2011) Falcón-Barroso, J., Sánchez-Blázquez, P., Vazdekis, A., et al. 2011, A&A, 532, A95
- Fensch et al. (2017) Fensch, J., Renaud, F., Bournaud, F., et al. 2017, MNRAS, 465, 1934
- Fischera & Dopita (2005) Fischera, J., & Dopita, M. 2005, ApJ, 619, 340
- Fritz et al. (2017) Fritz, J., Moretti, A., Gullieuszik, M., et al. 2017, ApJ, 848, 132
- Goddard et al. (2017) Goddard, D., Thomas, D., Maraston, C., et al. 2017, MNRAS, 465, 688
- Gomes et al. (2016) Gomes, J. M., Papaderos, P., Kehrig, C., et al. 2016, A&A, 588, A68
- González Delgado et al. (2014) González Delgado, R. M., Pérez, E., Cid Fernandes, R., et al. 2014, A&A, 562, A47
- González Delgado et al. (2015) González Delgado, R. M., García-Benito, R., Pérez, E., et al. 2015, A&A, 581, A103
- González Delgado et al. (2016) González Delgado, R. M., Cid Fernandes, R., Pérez, E., et al. 2016, A&A, 590, A44
- González Delgado et al. (2017) González Delgado, R. M., Pérez, E., Cid Fernandes, R., et al. 2017, A&A, 607, A128
- Gunn & Gott (1972) Gunn, J. E., & Gott, J. R. I. 1972, ApJ, 176, 1
- Gunn et al. (2006) Gunn, J. E., Siegmund, W. A., Mannery, E. J., et al. 2006, AJ, 131, 2332
- Haines et al. (2013) Haines, C. P., Pereira, M. J., Smith, G. P., et al. 2013, ApJ, 775, 126
- Hopkins et al. (2006) Hopkins, P. F., Hernquist, L., Cox, T. J., et al. 2006, ApJS, 163, 1
- Hsieh et al. (2017) Hsieh, B. C., Lin, L., Lin, J. H., et al. 2017, ApJ, 851, L24
- Huang & Kauffmann (2015) Huang, M.-L., & Kauffmann, G. 2015, MNRAS, 450, 1375
- Ibarra-Medel et al. (2016) Ibarra-Medel, H. J., Sánchez, S. F., Avila-Reese, V., et al. 2016, MNRAS, 463, 2799
- Jian et al. (2012) Jian, H.-Y., Lin, L., & Chiueh, T. 2012, ApJ, 754, 26
- Jian et al. (2017) Jian, H.-Y., Lin, L., Lin, K.-Y., et al. 2017, ApJ, 845, 74
- Jian et al. (2018) Jian, H.-Y., Lin, L., Oguri, M., et al. 2018, PASJ, 70, S23
- Kawata & Mulchaey (2008) Kawata, D., & Mulchaey, J. S. 2008, ApJ, 672, L103
- Kauffmann et al. (2003) Kauffmann, G., Heckman, T. M., White, S. D. M., et al. 2003, MNRAS, 341, 33
- Kauffmann (1996) Kauffmann, G. 1996, MNRAS, 281, 487
- Kuntschner et al. (2002) Kuntschner, H., Smith, R. J., Colless, M., et al. 2002, MNRAS, 337, 172
- Kewley et al. (2001) Kewley, L. J., Dopita, M. A., Sutherland, R. S., Heisler, C. A., & Trevena, J. 2001, ApJ, 556, 121
- Kewley et al. (2006) Kewley, L. J., Groves, B., Kauffmann, G., & Heckman, T. 2006, MNRAS, 372, 961
- Koyama et al. (2013) Koyama, Y., Smail, I., Kurk, J., et al. 2013, MNRAS, 434, 423
- Lacerna et al. (2016) Lacerna, I., Hernández-Toledo, H. M., Avila-Reese, V., Abonza-Sane, J., & del Olmo, A. 2016, A&A, 588, A79
- Lacerna et al. (2018) Lacerna, I., Argudo-Fernández, M., & Duarte Puertas, S. 2018, arXiv:1806.02368
- Larson et al. (1980) Larson, R. B., Tinsley, B. M., & Caldwell, C. N. 1980, ApJ, 237, 692
- Law et al. (2015) Law, D. R., Yan, R., Bershady, M. A., et al. 2015, AJ, 150, 19
- Li et al. (2015) Li, C., Wang, E., Lin, L., et al. 2015, ApJ, 804, 125
- Lin et al. (2007) Lin, L., Koo, D. C., Weiner, B. J., et al. 2007, ApJ, 660, L51
- Lin et al. (2010) Lin, L., Cooper, M. C., Jian, H.-Y., et al. 2010, ApJ, 718, 1158
- Lin et al. (2014) Lin, L., Jian, H.-Y., Foucaud, S., et al. 2014, ApJ, 782, 33
- Lin et al. (2016) Lin, L., Capak, P. L., Laigle, C., et al. 2016, ApJ, 817, 97
- Lin et al. (2017a) Lin, L., Lin, J.-H., Hsu, C.-H., et al. 2017a, ApJ, 837, 32
- Lin et al. (2017b) Lin, L., Belfiore, F., Pan, H.-A., et al. 2017b, ApJ, 851, 18
- Liu et al. (2018) Liu, F. S., Jia, M., Yesuf, H. M., et al. 2018, ApJ, 860, 60
- López Fernández et al. (2018) López Fernández, R., González Delgado, R. M., Pérez, E., et al. 2018, A&A, 615, A27
- Martig et al. (2009) Martig, M., Bournaud, F., Teyssier, R., & Dekel, A. 2009, ApJ, 707, 250
- Martin et al. (2007) Martin, D. C., Wyder, T. K., Schiminovich, D., et al. 2007, ApJS, 173, 342
- Martins et al. (2005) Martins, L. P., González Delgado, R. M., Leitherer, C., Cerviño, M., & Hauschildt, P. 2005, MNRAS, 358, 49
- Medling et al. (2018) Medling, A. M., Cortese, L., Croom, S. M., et al. 2018, MNRAS, 475, 5194
- McCarthy et al. (2008) McCarthy, I. G., Frenk, C. S., Font, A. S., et al. 2008, MNRAS, 383, 593
- McDermid et al. (2015) McDermid, R. M., Alatalo, K., Blitz, L., et al. 2015, MNRAS, 448, 3484
- Mihos & Hernquist (1994) Mihos, J. C., & Hernquist, L. 1994, ApJ, 431, L9
- Moore et al. (1996) Moore, B., Katz, N., Lake, G., Dressler, A., & Oemler, A, 1996, Nature, 379, 613
- Moreno et al. (2015) Moreno, J., Torrey, P., Ellison, S. L., et al. 2015, MNRAS, 448, 1107
- Muzzin et al. (2012) Muzzin, A., Wilson, G., Yee, H. K. C., et al. 2012, ApJ, 746, 188
- Pan et al. (2015) Pan, Z., Li, J., Lin, W., et al. 2015, ApJ, 804, L42
- Pan et al. (2018) Pan, H.-A., Lin, L., Hsieh, B.-C., et al. 2018, ApJ, 854, 159
- Parma et al. (2007) Parma, P., Murgia, M., de Ruiter, H. R., et al. 2007, A&A, 470, 875
- Peng et al. (2010) Peng, Y.-j., Lilly, S. J., Kovač, K., et al. 2010, ApJ, 721, 193
- Peng et al. (2015) Peng, Y., Maiolino, R., & Cochrane, R. 2015, Nature, 521, 192
- Papaderos et al. (2013) Papaderos, P., Gomes, J. M., Vílchez, J. M., et al. 2013, A&A, 555, L1
- Pérez et al. (2013) Pérez, E., Cid Fernandes, R., González Delgado, R. M., et al. 2013, ApJ, 764, L1
- Roberts & Haynes (1994) Roberts, M. S., & Haynes, M. P. 1994, ARA&A, 32, 115
- Sánchez & González-Serrano (2002) Sánchez, S. F., & González-Serrano, J. I. 2002, A&A, 396, 773
- Sánchez-Blázquez et al. (2006) Sánchez-Blázquez, P., Peletier, R. F., Jiménez-Vicente, J., et al. 2006, MNRAS, 371, 703
- Sánchez et al. (2012) Sánchez, S. F., Kennicutt, R. C., Gil de Paz, A., et al. 2012, A&A, 538, A8
- Sánchez et al. (2013) Sánchez, S. F., Rosales-Ortega, F. F., Jungwiert, B., et al. 2013, A&A, 554, A58
- Sánchez et al. (2015) Sánchez, S. F., Pérez, E., Rosales-Ortega, F. F., et al. 2015, A&A, 574, A47
- Sánchez et al. (2016a) Sánchez, S. F., Pérez, E., Sánchez-Blázquez, P., et al. 2016a, RMxAA, 52, 21
- Sánchez et al. (2016b) Sánchez, S. F., Pérez, E., Sánchez-Blázquez, P., et al. 2016b, RMxAA, 52, 171
- Sánchez et al. (2018) Sánchez, S. F., Avila-Reese, V., Hernandez-Toledo, H., et al. 2018, RMxAA, 54, 217
- Sarzi et al. (2010) Sarzi, M., Shields, J. C., Schawinski, K., et al. 2010, MNRAS, 402, 2187
- Schaefer et al. (2017) Schaefer, A. L., Croom, S. M., Allen, J. T., et al. 2017, MNRAS, 464, 121
- Shulevski et al. (2015) Shulevski, A., Morganti, R., Barthel, P. D., et al. 2015, A&A, 583, A89
- Singh et al. (2013) Singh, R., van de Ven, G., Jahnke, K., et al. 2013, A&A, 558, A43
- Smee et al. (2013) Smee, S. A., Gunn, J. E., Uomoto, A., et al. 2013, AJ, 146, 32
- Spindler et al. (2018) Spindler, A., Wake, D., Belfiore, F., et al. 2018, MNRAS, 476, 580
- Stasińska et al. (2008) Stasińska, G., Vale Asari, N., Cid Fernandes, R., et al. 2008, MNRAS, 391, L29
- Tacchella et al. (2015) Tacchella, S., Carollo, C. M., Renzini, A., et al. 2015, Science, 348, 314
- Trager et al. (2008) Trager, S. C., Faber, S. M., & Dressler, A. 2008, MNRAS, 386, 715
- van den Bosch et al. (2008) van den Bosch, F. C., Aquino, D., Yang, X., et al. 2008, MNRAS, 387, 79
- Vazdekis et al. (2010) Vazdekis, A., Sánchez-Blázquez, P., Falcón-Barroso, J., et al. 2010, MNRAS, 404, 1639
- Veilleux & Osterbrock (1987) Veilleux, S., & Osterbrock, D. E. 1987, ApJS, 63, 295
- Vogt et al. (2013) Vogt, F. P. A., Dopita, M. A., & Kewley, L. J. 2013, ApJ, 768, 151
- Vulcani et al. (2010) Vulcani, B., Poggianti, B. M., Finn, R. A., et al. 2010, ApJ, 710, L1
- Wang et al. (2018) Wang, E., Li, C., Xiao, T., et al. 2018, ApJ, 856, 137
- Wetzel et al. (2012) Wetzel, A. R., Tinker, J. L., & Conroy, C. 2012, MNRAS, 424, 232
- Whitaker et al. (2015) Whitaker, K. E., Franx, M., Bezanson, R., et al. 2015, ApJ, 811, L12
- Yan & Blanton (2012) Yan, R., & Blanton, M. R. 2012, ApJ, 747, 61
- Yan et al. (2016a) Yan, R., Tremonti, C., Bershady, M. A., et al. 2016a, AJ, 151, 8
- Yan et al. (2016b) Yan, R., Bundy, K., Law, D. R., et al. 2016b, AJ, 152, 197
- Yang et al. (2007) Yang, X., Mo, H. J., van den Bosch, F. C., et al. 2007, ApJ, 671, 153
- Yang et al. (2008) Yang, X., Mo, H. J., & van den Bosch, F. C. 2008, ApJ, 676, 248
- Zhang et al. (2017) Zhang, K., Yan, R., Bundy, K., et al. 2017, MNRAS, 466, 3217
- Zheng et al. (2017) Zheng, Z., Wang, H., Ge, J., et al. 2017, MNRAS, 465, 4572