An Asymmetric Keplerian Disk Surrounding the O-type Protostar IRAS165474247
Abstract
During the last decades, a great interest has emerged to know if even the most massive stars in our galaxy (namely the spectral O-type stars) are formed in a similar manner as the low- and intermediate-mass stars, that is, through the presence of accreting disks and powerful outflows. Here, using sensitive observations of the Atacama Large Millimeter/Submillimeter Array (ALMA), we report a resolved Keplerian disk (with fifteen synthesized beams across its major axis) surrounding the deeply embedded O-type protostar IRAS165474247. The disk shows some asymmetries that could arise because of the disk is unstable and fragmenting or maybe because of different excitation conditions within the disk. The enclosed mass estimated from the disk Keplerian radial velocities is 253 M⊙. The molecular disk is at the base of an ionized thermal radio jet and is approximately perpendicular to the jet axis orientation. We additionally find the existence of a binary system of compact dusty objects at the center of the accreting disk, which indicates the possible formation of an O-type star and a companion of lower mass. This is not surprising due to the high binary fraction reported in massive stars. Subtracting the contribution of the dusty disk plus the envelope and the companion, we estimated a mass of 20 M⊙ for the central star.
1 Introduction
The first molecular structures reported to be surrounding deeply embedded O-type protostars were huge rotating toroids (Cesaroni et al., 2007; Beltrán et al., 2006; Torrelles et al., 1983). These non-equilibrium structures are large (10,000 au) and massive (about 100 solar masses) compared to the circumstellar disks around Solar-type stars, which have typical sizes of 100 au and masses of 0.1 M⊙ (Williams et al., 2011). The toroids are likely forming a group of stars in their centers. The detection of the toroids with these physical characteristics are a consequence of two limiting facts, the large distances of the massive star forming regions (typically kpc) and the habitual angular resolutions (1′′) of the first millimeter and submillimeter interferometers (e.g. BIMA, SMA, PdBI, and CARMA).
Recently, more sensitive and subarcsecond ALMA observations have revealed disk-like systems with sizes of about 1000-2000 au (Zapata et al., 2015; Johnston et al., 2015; Ilee et al., 2016; Sanna et al., 2018). Some of these disk-like structures show rotational Keplerian-like profiles with the resulting enclosed masses corresponding to young O-type stars (Sánchez-Monge et al., 2013; Johnston et al., 2015; Ilee et al., 2016; Sanna et al., 2018). However, is very important to mention that in these studies the molecular disks are only about a few synthesized beams in size, and the Keplerian profiles are roughly resolved. A more dedicated study using ALMA with an angular resolution of 0.2′′ and a high sensitivity to search for circumstellar, rotating disks around a small sample of six luminous ( 105 L⊙) young stellar objects revealed a low rate of Keplerian disks around the embedded O-type stars (Cesaroni et al., 2017), suggesting that maybe the detection rate could be sensitive to the evolutionary stage. Maud et al. (2018) proposed the presence of an SiO disk and disk wind from the O-type young star G17.640.16. The SiO emission appears to represent a disk-like structure perpendicular to a molecular outflow traced by the 13CO. The position-velocity profile of the SiO is consistent with the Keplerian rotation of a disk around an object with a mass between 10-30 M⊙. A more exotic premise came from recent ALMA observations of W51, where the authors claim a lack of Keplerian disks, and proposed that accretion should be multi-directional and unsteady as modeled in hydrodynamic simulations (Goddi et al., 2018).
IRAS165474247 is classified as a very embedded massive protostar with a total bolometric luminosity of 105 L⊙ (Garay et al., 2003), at a distance of 2.9 kpc. This luminosity is equivalent to a single O8-type zero-age main-sequence star (Panagia, 1973). Observations from single-dish telescopes revealed that the IRAS source coincides with a dense molecular clump with a mass of 103 M⊙, contained in a radius of 0.2 pc (Garay et al., 2003). More recent observations carried out with the Submillimeter Array resolved this dense molecular clump into two compact objects with sizes of 4000 au, IRAS16547-E and IRAS16547-W (Franco-Hernández et al., 2009; Hernández-Hernández et al., 2014). As IRAS16547-W has a very faint infrared emission in Ks band from the 2MASS catalogues and IRAS16547-E is the dominant source at these wavelengths (0.85 mm), the contribution to the total luminosity of IRAS16547-W should not be important. Further ALMA observations with an angular resolution of 0.3′′ resolved the two millimeter continuum sources (Zapata et al., 2015). The authors found that in the object IRAS16547-E, the SO2 line emission, with low-energy transitions, Eu 300 K, traces the innermost parts ( 3000 au) of a molecular NS outflow emanating from this region (Zapata et al., 2015). At smaller scales (1000 au) these ALMA observations also revealed a small and warm molecular disk-like structure that is likely driving the ionized jet and molecular outflow (Zapata et al., 2015). The axis of this disk-like structure is almost perpendicular to the radio jet at the base. However, these ALMA observations failed to reveal Keplerian motions (that is velocities that increase as the central source is approached) in the innermost parts of the disk-like structure (Zapata et al., 2015). The extended cavities carved by the powerful radio thermal jet can also be seen in recent CH3OH ALMA images (Higuchi et al., 2015) obtained with a similar spatial resolution than that in Zapata et al. (2015).
In this study, we carried out new ALMA observations with a high angular resolution at 0.85 mm ( 0.05′′) and a very good sensitivity to disclose the innermost structure of the disk candidate using high-energy transitions of Methyl Formate (CH3OCHO with Eu 713 K) and Carbon Monosulfide (CS with Eu 1896 K). We additionally present observations of the SO2 line that show the morphology of the outflow in the vicinity of the launching zone.
2 Observations
The observations of the IRAS 165474247 massive protostellar system were carried out with ALMA at Band 7 in 2017 August 21 and 22 as part of the Cycle 5 program 2016.1.00992.S. Both observations used 44 antennas with a diameter of 12 m, yielding baselines with projected lengths from 21 to 3696.5 m (24.7–4348.8 k). The primary beam at this frequency has a full width at half-maximum (FWHM) of about 17.6′′. The continuum and molecular line emission from the massive object IRAS 165474247 fall well inside of the FWHM or primary beam.
The integration time on-source was about 1.6 h, and 2.5 h was used for calibration. The continuum image was obtained averaging line-free channels from four spectral windows (of 1.875, 0.937, 0.468, 0.468 GHz width) centered at rest frequencies: 353.684 GHz (spw0), 351.644 GHz (spw1), 339.160 GHz (spw2), and 340.405 GHz (spw3), which cover a total bandwidth of 3.748 GHz. However, as there are many spectral lines detected in the spectral windows, we have likely contamination from faint lines. These windows were chosen to observe different molecular species, such as the vibrationally excited molecule CS(7-6) v=1 at a rest frequency of 340397.96 MHz, SO2 v=0 (30(2,28)-29(3,27) A) at a rest frequency of 340316.41 MHz, and CH3OCHO(37(13,25)-37(12,26) A) v=0 at a rest frequency of 339548.47 MHz. In this study, we concentrate on these spectral lines, which are outflow (Zhang et al., 2000) and disk (Sánchez-Monge et al., 2014; Zapata et al., 2010) tracers. The velocity width of each channel varied in every single spectral window: 0.430 km s-1 for the CH3OCHO, 0.321 km s-1 for the SO2, and finally 0.215 km s-1 for the CS.
The weather conditions were excellent and stable for observations at band 7 with an average precipitable water vapor that varied between 0.45 and 0.5 mm and an average system temperature of 125 K for the first day and 140 K for the second day. The ALMA calibration included simultaneous observations of the 183 GHz water line with water vapor radiometers, used to reduce the atmospheric phase noise. Quasars J16364102, J14274206, J1617-5848, and J1711-3744 were used to calibrate the bandpass, the atmosphere, the water vapor radiometers, and the gain fluctuations. J1617-5848 was also used for the flux amplitude calibration. The data were calibrated, imaged, and analyzed using the Common Astronomy Software Applications CASA (McMullin et al., 2007). To analyze the data, we also used the KARMA (Gooch et al., 1996) package. Imaging of the calibrated visibilities was done using the task CLEAN. The resulting image rms noise for the continuum was 1.0 mJy beam-1 at an angular resolution of with a PA = 82.9∘. This angular resolution corresponds to a spatial scale of about 150 au at the distance of IRAS 165474247 of 2.90.6 kpc (Rodríguez et al., 2018). This is an ideal resolution to resolve circumstellar disks with a spatial size of about 1000 au (Zapata et al., 2015).
We used the ROBUST parameter of CLEAN in CASA set to 2.0 in the continuum and for the line images. For the line emission, the resulting image rms noise was 10 mJy beam-1 km s-1 at an angular resolution of with a PA = 76.7∘. The resulting 0.85 mm continuum and CS, CH3OCHO, and SO2 line emission images are presented in Figure 1, 2, and 3. We self-calibrated in phase and amplitude using the resulting mm continuum image as model. We then applied the solutions for self-calibration of the continuum to the spectra data. The maximum recoverable scale for this ALMA observation is 87 ( 2500 au).
3 results and discussion
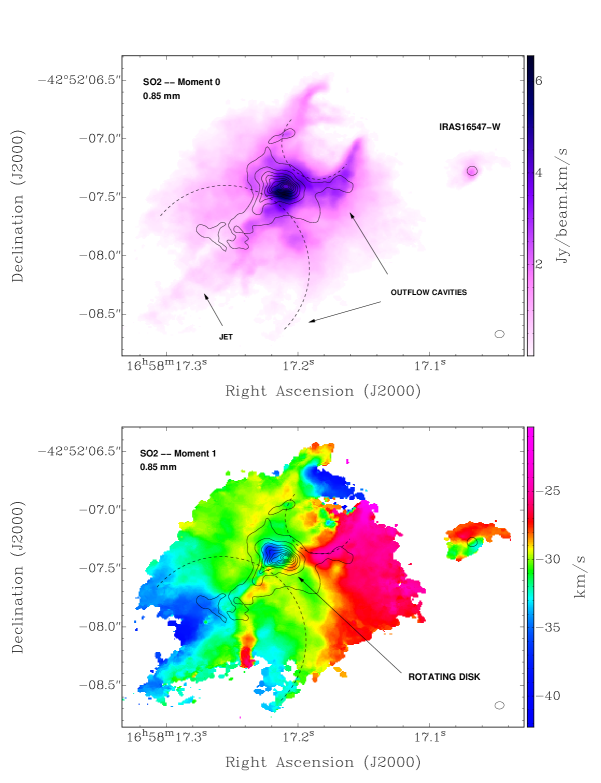
Figure 1 shows the moment zero (integrated intensity) and one (intensity weighted velocity) maps of the SO2 v=0 (30(2,28)-29(3,27) A) thermal emission overlaid with the 0.85 mm continuum emission as revealed by the new ALMA observations. The 0.85 mm continuum observations traces the dust from an extended envelope (with a spatial size of about a few 1000 au) and the disk-like structure surrounding IRAS16547-E. The observations also revealed small cavities present in the northern and southern parts of its dusty envelope, likely carved by the bipolar outflow. The bright continuum source is tracing the dusty disk-like structure, which is elongated in an orientation perpendicular to the orientation of the outflow at a Position Angle111Measured as usual counterclockwise from North to East. (PA) of 135∘. Additionally, a very compact continuum object associated with IRAS16547-W is also revealed. The position of IRAS16547-W is at . In the Appendix Section, we estimated a mass of the dusty envelope in IRAS16547-E of 3.550.05 M⊙ and for IRAS16547-W (the compact object reported here) of 0.20.1 M⊙.
The molecular emission from SO2 arising from IRAS16547-E is dramatically resolved as one can see in Figure 1. The dimensions ( 10,000 au), orientation (PA135∘), and gas kinematics of this structure are consistent with those reported in Zapata et al. (2015) in the same molecule. However, the image presented here reveals many new features from the outflow and the disk-like structure. Figure 1 shows the structure of the outflow very close to IRAS16547-E with two well-defined cavities with a PA of 135∘, and in the middle of the SE cavity a collimated molecular jet is emanating from IRAS16547-E. All these structures are connected to the disk-like structure traced by the continuum emission. In the very center of the continuum source there is absorption of the SO2, probably because the dust at that position is optically thick, and the molecular emission is blocked, as for example, in the disk of the low-mass protostar IRAS 162932224B (Zapata et al., 2013). The velocity field of SO2 is also shown in Figure 1, revealing the kinematics of the outflowing molecular gas, and the disk-like structure. The blueshifted emission is located mostly in the SE side of the outflow, while the redshifted emission is located at the NW side. This image also reveals hints of outflow rotation with a similar orientation to that of the central disk. This could be the reason why different LSR radial velocities are seen along the outflow. For example, some redshifted emission is present in the SW part of the outflow. The rotating disk traced by SO2 is clearly observed in the lower panel of Figure 1, right at the center of the outflow. It has a similar orientation (50∘), size (of about 1000 au), and gas kinematics to those values reported in Zapata et al. (2015). However, the emission from the disk overlaps with the emission arising from the outflow and this difficults to trace its inner gas kinematics.
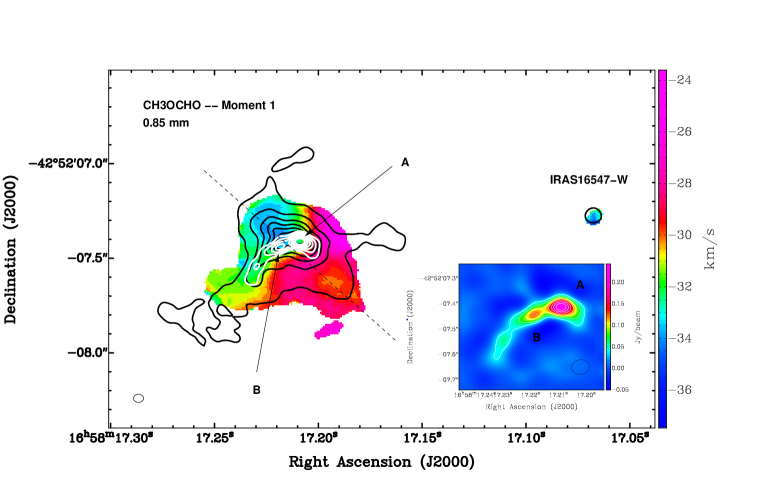
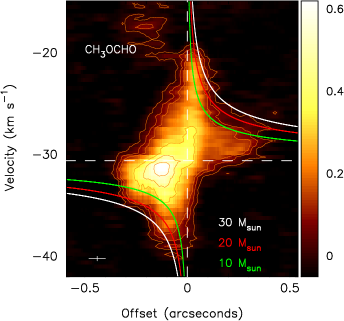
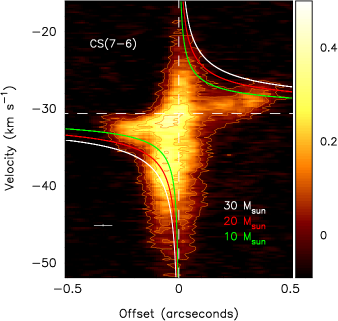
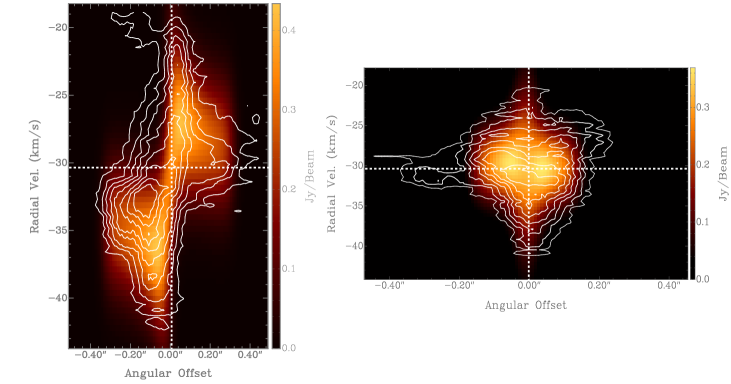
Zapata et al. (2015) noted that high-energy transitions (Eu 500 K) seem to trace mostly the compact disk. Therefore, we chose the molecules CH3OCHO and CS to trace the circumstellar disk surrounding this massive embedded protostar and to study its innermost gas kinematics. Figure 2 shows the moment one of the CH3OCHO emission overlaid on the dust continuum emission presented in Figure 1. The range of LSR radial velocities integration to construct this image is from 45 to 17 km s-1. The LSR systemic radial velocity of IRAS 16547-E is 30.6 km s-1 (Garay et al., 2003). The image reveals the rotating disk already mapped in Zapata et al. (2015). However, from this new image, the velocity gradient traced by the high-energy transitions reveals that there is more red- and blue-shifted velocities located close to its center. To study the kinematics of the molecular gas traced by the CH3OCHO and CS, we computed Position-Velocity (PV) diagrams along the major axis of this disk (PA=50∘) and they are shown in Figure 3. The PV-diagrams presented here probe scales of the same order as our beam size. These diagrams clearly revealed that the rotating disk is Keplerian with the LSR radial velocities close to its center increasing inversely proportional to the squared-root of the radius. However, the CS 7-6 line in particular seems to show two linear features in the PV diagram (connecting the high- and low-velocity ends of the emission, respectively) that look like they might describe orbital rings offset from one another and not following Keplerian motions. One can estimate the enclosed masses from the two putative rings assuming Keplerian velocities of Vint 10 km s-1 at a radius rint 0.05′′ (higher-velocity orbit), and Vext 2 km s-1 at a radius rext 0.3′′ (lower-velocity orbit). We obtain Mint 14.5 M⊙ and Mext 3.6 M⊙, respectively. We conclude that this interpretation must be incorrect because the enclosed mass from the exterior ring should be larger. We then suggest that the speeds are due to a single Keplerian disk. However, the disk shows some asymmetries that could be caused because the disk is unstable and fragmenting, as theoretically predicted for massive, large disks (Kratter & Matzner, 2006) and suggested in a similar system G11.92 in Ilee et al. (2016, 2018). Furthermore, some of these asymmetries could also be caused by different excitation conditions within the disk.
In these Figures, we additionally present three Keplerian rotation curves with enclosed masses of 30, 20, and 10 M⊙. These new probes (CH3OCHO and CS) are tracing even broader LSR radial velocities ( 40 km s-1) within the disk than the CH3SH line ( 20 km s-1) line because of the better sensitivity and angular resolution of the present observations (Zapata et al., 2015).
We compute a Keplerian thin disk model fitted to the CH3OCHO line data that is presented in Figure 4. We describe in detail this model in the Appendix section. The best fitted physical and geometrical parameters of the Keplerian disk surrounding IRAS 16547-E are presented in Table 1. With this disk model we obtained three important physical parameters with a relatively good accuracy: the inclination angle 55∘ 5.0∘, the size 0.3′′0.1′′ (1190290 au), and the enclosed mass 253.0 M⊙. These physical values and their errors were obtained from a minimum estimation between model and data.
The twenty-five solar masses correspond to a single main-sequence O7 type star (Martins et al., 2005). Subtracting the contribution of the dusty disk plus the envelope of about 4 M⊙ (see the Appendix), and the companion (0.2 to 2 M⊙, for a Mstar/Mdisk between 1 to 10, see: Rodríguez et al., 1998; Bate, 2018), we estimated a mass of about 20 M⊙ for the central star.
This is in very good agreement with the enclosed mass estimated in Zapata et al. (2015) with the Keplerian rotation, and with the rotation keplerian curves presented in Figure 3.
In Figure 4, we compare two PV-diagrams obtained from the disk thin model and the ALMA data from the CH3OCHO line. One PV-diagram is obtained along the disk major axis (50∘) and the other one along the perpendicular direction, i.e. the minor axis (140∘). From these two images we find a good correspondence between our model and the data. There is however some asymmetries present in the disk and revealed on these images. The two most clear features are the extra-emission close to central axis and at a radial LSR velocity of about 33 km s-1 and the emission close to the systemic velocities (see the left image of Figure 4). These gas structures could be originated from some extra contributions as for example: the outflow or the infalling envelope. This massive star is still very embedded. In the high-mass protostar IRAS 20126+4104, Palau et al. (2017) showed that very complex molecules could be excited by the outflow very close to the circumstellar disk. These observations argue in favor of a possible contribution from the outflow in the source IRAS 16547-E to the molecular disk. This extra CH3OCHO emission in the disk could be caused by shock-driven excitation at the interface between the outflow and the envelope/disk. Given the very small scales we are tracing with our ALMA observations (150 au), we now can reveal these new features.
Even when the nature of the massive Source I in Orion is uncertain (this object could be a merge of protostars, see Zapata et al. (2009); Bally et al. (2017)), it shows a Keplerian disk with a dynamical mass of about 7-15 M⊙ (Hirota et al., 2014; Ginsburg et al., 2018) and a comparison is warranted. As one can see, Source I is a less massive object, probably an early B-type, however, contrary to IRAS 16547-E its Keplearian disk is more smooth and coherent, with no obvious asymmetries. The Keplerian disk from Source I could harbor a close binary with a separation of only 2 au (Bally et al., 2017). As for IRAS 16547-E, its molecular disk also surrounds a binary but with a larger separation and misaligned with respect to the molecular disk axis, see below. These two different geometries could give us some hints of their formation processes.
Finally, in Figure 2, we also include a 0.85 mm continuum image of IRAS 165474247 constraining the -range (baselines 900 k). This allows us to resolve out the most extended emission from the continuum source, and leave only structures with a scale of approximately 0.07′′ (or 210 au). We find a binary source with an extended arm to its SE. We label these two sources A and B objects, with A being the brighter source at these wavelengths. The binary sources are separated about 0.1′′ or 300 au in projection, IRAS 16547-A has a size of 250 au. Following again the appendix, we estimated a mass for IRAS 16547E-A of 1 M⊙ and for IRAS 16547E-B of 0.3 M⊙. We thus suggest that we are tracing the inner densest part of the accreting disks detected at scales of 1000 au, showing that it is fragmented, with the source A likely to be related with a young O-type star, and IRAS 16547E-B associated with a lower mass object. These young stars are still accreting and it is difficult to estimate their final masses. In the case of IRAS 16547E-A if we assume that all the gas and dust in the compact structure surrounding it are accreted, the mass increase will be not significant. The high binary fraction reported in massive stars (Kobulnicky et al., 2007) is in agreement with our results.
It is interesting to note that the binary orientation is orthogonal to the CH3OCHO molecular disk axis, see Figure 2. This is contrary to what one expects from the conservation of angular momentum, where the binary should be oriented in the same direction as the molecular disk. Similar geometries have been observed in low mass and more evolved systems, see Fernández-López et al. (2017), and there is not yet a consensus of their nature.
Table 1.– Physical Parameters From The Best Keplerian Thin Disk
| Physical Parameter | Estimated Value from the Model |
|---|---|
| Line-width () | 7.70.6 km s-1 |
| Beam-width () | 0.06 arcsec (fixed) |
| Central velocity of the Disk (v0) | 30.10.5 km s-1 |
| Inclination Angle () | 55∘ 5.0∘ |
| Inner Disk Radius () | 0.005′′(fixed) |
| Outer Disk Radius () | 0.3′′0.1′′ |
| Infall Velocity (vi at ) | 0.40.2 km s-1 |
| Rotational Velocity (vr at ) | 11.64.0 km s-1 |
| Reference Radius () | 0.065′′ (188 au) |
| Enclosed Mass | 25 3.0 M⊙ |
Appendix A Dust Mass Estimation
Assuming that the dust emission is optically thin and isothermal, the dust mass (Md) is directly proportional to the flux density (Sν) as:
where is the distance to the object, is the dust mass opacity, and B is the Planck function for the dust temperature Td. Assuming a dust mass opacity () of 0.020 cm2 g-1 (taking a gas-to-dust ratio of 100) appropriate for these wavelengths (0.85 mm) for coagulated dust particles (Ossenkopf et al., 1994), as well as a characteristic dust temperature (Td) of 250 K (Hernández-Hernández et al., 2014), and for flux densities estimated from a Gaussian fit for IRAS16547-E of 1.05 Jy, and for IRAS16547-W of 0.020 Jy, we estimated a lower limit (because the emission is probably not optically thin) for the mass of the most compact part (i.e., not interferometrically filtered) of the disk and envelope system associated with IRAS16547-E of about 3.550.05 M⊙ and of 0.20.5 M⊙ for the most compact object associated with IRAS16547-W. The dust mass estimated here comes from several synthesized beams. The spectral index was estimated using the spw0 and spw3, with central frequencies of 353.684 and 340.405 GHz, respectively.
Following the radio observations presented in Rodríguez et al. (2005), we can estimate the expected radio emission associated with IRAS 16547-W at the submillimeter wavelengths. Rodríguez et al. (2005) reported that this source has a spectral index of 0.33, which they suggested to be related with a thermal jet. Hence, we estimate a density flux of 30 mJy for these wavelengths, a very small contribution ( 3%) at these wavelengths. We then conclude that most of the emission arise from thermal dust.
Here, with our spatial resolution of about 150 au, we resolved out part of the continuum emission, as it can be seen from recent ALMA observations, see Zapata et al. (2015). Note that the level of uncertainty in the given lower limits is only statistical. The actual uncertainty could be very large (a factor of up to 4) given the uncertainty in the opacity and in the dust temperature.
Appendix B Keplerian Thin Disk Model
We have used the model of a thin disk with a Keplerian and infall kinematics made by Robert Estalella222http://www.am.ub.edu/ robert/Documents/thindisk.pdf. This model considers a geometrically thin disk with an inner radius and an outer radius . The inclination angle of the disk is defined as the angle (i) formed by the line-of-sight and the disk axis ( for a face-on disk, for an edge-on disk). In this model two motions are considered: the first is the rotation velocity of the disk, which here, we assume is Keplerian and given by a power law of the radius, , where is the reference radius and is the rotation velocity at such radius; the second one is the infall toward the disk center, with an infall velocity also given by a power law, , where is the infall velocity at the reference radius.
The kinematics of the disk is computed by considering a cube of velocity channels and, for each channel, a grid of points onto the plane of the disk. For each point of the grid, the projection of its rotation and infall velocities onto the line of sight, , is calculated. A Gaussian line profile of width , centered on , and with an intensity proportional to , is added to the channels associated with the grid point. After the cube onto the plane of the disk is computed, its projection onto a cube with a grid onto the plane of the sky is estimated. Finally, each channel of the plane-of-the-sky cube is convolved with a Gaussian beam of width . The intensity scale depends on a factor scale, which is estimated by minimizing the sum of the squared differences between the data cube and the model cube.
The disk model depends on 13 parameters, however, here we assumed 5 of them, the position of the disk is at , the power-law indices of the rotation and infall velocities are equal to , and the power-law index of the intensity is . And some others can be guessed beforehand, such as and . Using a similar procedure as that described in Estalella et al. (2012) and Sánchez-Monge et al. (2013), the -dimensional parameter space is searched for the minimum of the rms fit residual for all the channel maps. Once a minimum of the rms fit residual is found, the uncertainty in the parameters fitted is found as the increment of each of the parameters of the fit necessary to increase the rms fit residual a factor of (Wall J. V. & Jenkins, 2003; Sánchez-Monge et al., 2013), where is the number of data points fitted, is the number of parameters fitted, and is the value of for degrees of freedom (the number of free parameters) and is the significance level, (equivalent to for a Gaussian error distribution).
In Table 1, we give the best fit values and their statistical errors. In Figure 4, we show the PV-diagrams (computed at the same PA as in Figure 3 and perpendicular) of the best fitted model, where it is revealed that the model and the data agree reasonably well. However, we note that there could be an extended infalling envelope surrounding the Keplerian disk, which could be producing the redshifted emission close to the disk center, see Figure 4, which is not present in our disk model.
As described in Girart et al. (2014), the model assumes that the intensity of the disk is directly proportional to the depth along the line of sight, or in other words the emission is optically thin, and that the density and temperature are described by a single temperature and density, respectively. At these wavelengths, the CH3OCHO and CS emission is most likely to be optically thick in the very center of the disk, so the inner disk radius found in the model could be due only to opacity effects.
References
- Bally et al. (2017) Bally, J., Ginsburg, A., Arce, H., et al. 2017, ApJ, 837, 60
- Bate (2018) Bate, M. R. 2018, MNRAS, 475, 5618
- Beltrán et al. (2006) Beltrán, M. T., & de Wit, W. J. 2016, A&A Rev., 24, 6
- Cesaroni et al. (2007) Cesaroni, R., Galli, D., Lodato, G., Walmsley, C. M., & Zhang, Q. 2007, Protostars and Planets V, 197
- Cesaroni et al. (2017) Cesaroni, R., Sánchez-Monge, Á., Beltrán, M. T., et al. 2017, A&A, 602, A59
- Estalella et al. (2012) Estalella, R., López, R., Anglada, G., et al. 2012, AJ, 144, 61
- Franco-Hernández et al. (2009) Franco-Hernández, R., Moran, J. M., Rodríguez, L. F., & Garay, G. 2009, ApJ, 701, 974
- Garay et al. (2003) Garay, G., Brooks, K. J., Mardones, D., & Norris, R. P. 2003, ApJ, 587, 739
- Garay et al. (2015) Garay, G., Mardones, D., Bronfman, L., et al. 2007, A&A, 463, 217
- Ginsburg et al. (2018) Ginsburg, A., Bally, J., Goddi, C., Plambeck, R., & Wright, M. 2018, ApJ, 860, 119
- Girart et al. (2014) Girart, J. M., Estalella, R., Palau, A., Torrelles, J. M., & Rao, R. 2014, ApJ, 780, L11
- Goddi et al. (2018) Goddi, C., Ginsburg, A., Maud, L., Zhang, Q., & Zapata, L. 2018, arXiv:1805.05364
- Gooch et al. (1996) Gooch, R. 1996, Astronomical Data Analysis Software and Systems V, 101, 80
- Hernández-Hernández et al. (2014) Hernández-Hernández, V., Zapata, L., Kurtz, S., & Garay, G. 2014, ApJ, 786, 38
- Higuchi et al. (2015) Higuchi, A. E., Saigo, K., Chibueze, J. O., et al. 2015, ApJ, 798, L33
- Hirota et al. (2014) Hirota, T., Kim, M. K., Kurono, Y., & Honma, M. 2014, ApJ, 782, L28
- Johnston et al. (2015) Johnston, K. G., Robitaille, T. P., Beuther, H., et al. 2015, ApJ, 813, L19
- Kobulnicky et al. (2007) Kobulnicky, H. A., & Fryer, C. L. 2007, ApJ, 670, 747
- Kratter & Matzner (2006) Kratter, K. M., & Matzner, C. D. 2006, MNRAS, 373, 1563
- Ilee et al. (2016) Ilee, J. D., Cyganowski, C. J., Nazari, P., et al. 2016, MNRAS, 462, 4386
- Ilee et al. (2018) Ilee, J. D., Cyganowski, C. J., Brogan, C. L., et al. 2018, ApJ, 869, L24
- Fernández-López et al. (2017) Fernández-López, M., Zapata, L. A., & Gabbasov, R. 2017, ApJ, 845, 10
- Martins et al. (2005) Martins, F., Schaerer, D., & Hillier, D. J. 2005, A&A, 436, 1049
- Maud et al. (2018) Maud, L. T., Cesaroni, R., Kumar, M. S. N., et al. 2018, arXiv:1810.03920
- McMullin et al. (2007) McMullin, J. P., Waters, B., Schiebel, D., Young, W., & Golap, K. 2007, Astronomical Data Analysis Software and Systems XVI, 376, 127
- Ossenkopf et al. (1994) Ossenkopf, V., & Henning, T. 1994, A&A, 291, 943
- Palau et al. (2017) Palau, A., Walsh, C., Sánchez-Monge, Á., et al. 2017, MNRAS, 467, 2723
- Panagia (1973) Panagia, N. 1973, AJ, 78, 929
- Sanna et al. (2018) Sanna, A., Koelligan, A., Moscadelli, L., et al. 2018, arXiv:1805.09842
- Rodríguez et al. (2018) Rodríguez, L. F., Moran, J. M., Franco-Hernández, R., et al. 2008, AJ, 135, 2370
- Rodríguez et al. (2005) Rodríguez, L. F., Garay, G., Brooks, K. J., & Mardones, D. 2005, ApJ, 626, 953
- Rodríguez et al. (1998) Rodríguez, L. F., D’Alessio, P., Wilner, D. J., et al. 1998, Nature, 395, 355
- Sánchez-Monge et al. (2013) Sánchez-Monge, Á., Cesaroni, R., Beltrán, M. T., et al. 2013, A&A, 552, L10
- Sánchez-Monge et al. (2013) Sánchez-Monge, Á., Palau, A., Fontani, F., et al. 2013b, MNRAS, 432, 3288
- Sánchez-Monge et al. (2014) Sánchez-Monge, Á., Beltrán, M. T., Cesaroni, R., et al. 2014, A&A, 569, A11.
- Torrelles et al. (1983) Torrelles, J. M., Rodríguez, L. F., Canto, J., et al. 1983, ApJ, 274, 214
- Wall J. V. & Jenkins (2003) Wall J. V. & Jenkins C. R. 2003, Practical statistics for astronomers, Cambridge observing handbooks for research astronomers, vol. 3. Cambridge, UK: Cambridge University Press, Ed. R. Ellis, J. Huchra, S. Kahn, G. Rieke, P. B.Stetson
- Williams et al. (2011) Williams, J. P., & Cieza, L. A. 2011, ARA&A, 49, 67
- Zapata et al. (2009) Zapata, L. A., Schmid-Burgk, J., Ho, P. T. P., Rodríguez, L. F., & Menten, K. M. 2009, ApJ, 704, L45
- Zapata et al. (2015) Zapata, L. A., Palau, A., Galván-Madrid, R., et al. 2015, MNRAS, 447, 1826
- Zapata et al. (2013) Zapata, L. A., Loinard, L., Rodríguez, L. F., et al. 2013, ApJ, 764, L14
- Zapata et al. (2010) Zapata, L. A., Tang, Y.-W., & Leurini, S. 2010, ApJ, 725, 1091.
- Zhang et al. (2000) Zhang, Q., Ho, P. T. P., & Wright, M. C. H. 2000, AJ, 119, 1345