MINERvA Collaboration
Neutron measurements from antineutrino hydrocarbon reactions
Abstract
Charged-current antineutrino interactions on hydrocarbon scintillator in the MINERvA detector are used to study activity from their final-state neutrons. To ensure that most of the neutrons are from the primary interaction, rather than hadronic reinteractions in the detector, the sample is limited to momentum transfers below 0.8 GeV/c. From 16,129 interactions, 15,246 neutral particle candidates are observed. The reference simulation predicts 64% of these candidates are due to neutrons from the antineutrino interaction directly, but also overpredicts the number of candidates by 15% overall. This discrepancy is beyond the standard uncertainty estimates for models of neutrino interactions and neutron propagation in the detector. We explore these two aspects of the models using the measured distributions for energy deposition, time of flight, position, and speed. We also use multiplicity distributions to evaluate the presence of a two-nucleon knockout process. These results provide critical new information toward a complete description of the hadronic final state of neutrino interactions, which is vital to neutrino oscillation experiments.
pacs:
13.15.+g, 25.30.PtI introduction
Neutrons are the last essential (anti)neutrino interaction final state particle to have their number and energy distribution studied in detail. Neutrons play a special role in those oscillation measurements which depend on comparing distortions of the antineutrino energy spectrum to the neutrino energy spectrum Abe et al. (2017); Adamson et al. (2016a, b); Acciarri et al. (2015a); Adams et al. (2013); Acciarri et al. (2015b). The antineutrino reactions’ calorimetric response is heavily suppressed relative to the neutrino case because of the prevalence of neutrons, consistent with their generic role in hadron calorimetry Wigmans (2017). The neutron energy deposits are not proportional to their kinetic energy and are not always observed at a location consistent with their initial trajectory from the interaction point. Sometimes they are not observed at all because they escape the detector volume unseen, their interaction products are below detection threshold, or they thermalize without producing enough ionization to be reconstructed. In addition to energy determination, neutrons’ presence in the final state also impacts event selection and background rejection for oscillation, interaction, and rare process analyses.
In this paper, we present the first direct measurements of the neutron content from neutron-rich antineutrino charged-current reactions. Neutrons with ten to hundreds of MeV kinetic energy are observed as they rescatter off hydrogen and carbon in the MINERvA detector. This study is done with a low three-momentum transfer sample Gran et al. (2018); Rodrigues et al. (2016a) but is otherwise inclusive with no selection on the number or type of hadrons in the final-state. Low overall hadronic activity means that neutron activity is easily separated and likely to be due to neutrons from the original neutrino interaction rather than secondary hadronic reactions. The results are compared to the predictions of a full simulation that consists of a modified version of the GENIE neutrino event generator Andreopoulos et al. (2010), a GEANT4 simulation of particle propagation in the detector material Agostinelli et al. (2003); Allison et al. (2006), and a simulation of the calibrated response of our scintillator and electronics Aliaga et al. (2014, 2015).
The energy deposit, time, position, speed, and multiplicity distributions are sensitive to the details of neutron production in the initial reaction and to models for neutron scattering in the detector. When the neutrino reaction occurs in a nucleus, modeling the hadronic final state is complicated. Different charged-current weak-interaction processes produce different numbers of neutrons after the final-state lepton gains its charge. The charge-changing antineutrino quasielastic (QE) and two-particle two-hole (2p2h) process must turn at least one proton into a neutron. Often the neutron has all of the hadronic final-state energy. In resonance production and deeply inelastic scattering (DIS) the charge can be exchanged with the resulting meson or the struck nucleon or quark, producing a higher number of neutrons per event than the equivalent neutrino case. These outcomes for carbon are summarized in Table 1. For antineutrino reactions on hydrogen, the 2p2h process and final-state interactions (FSI) do not occur; also charged-current neutrino-hydrogen QE reactions are not possible.
| neutron content | ||
|---|---|---|
| Process | Antineutrino | Neutrino |
| QE | 1 | 0 |
| Resonance | 1 or 0 | 0 or 1 |
| 2p2h | 2 or 1 | 1 or 0 |
| After FSI | 0 to 7 | 0 to 5 |
Sensitivity to the mix of reaction types is reduced and indirect because the resulting hadrons will frequently reinteract on their way out of the nucleus. In event generators, these rescattering processes are referred to as final-state interactions (FSI). Such reinteractions can be soft scatters that do not change the outgoing charge state, full charge exchange reactions where the energetic neutron becomes a proton or vice versa, and knockout reactions where multiple nucleons and mesons exit the nucleus. Calorimetric measurement of the interaction is affected and the hadron topology also changes.
Neutrons from neutrino and antineutrino reactions have been measured before. The earliest technique was tagging the capture of thermal and “fast” (up to 10 MeV) neutrons, used from the very first neutrino observations Cowan et al. (1956) to the present and near future Amsbaugh et al. (2007); Zhang et al. (2015); Back et al. (2017); Beacom and Vagins (2004). Higher-energy neutrons from neutrino reactions caused the most important background to the discovery Hasert et al. (1973, 1974) of weak neutral-current reactions in the freon-filled Gargamelle detector at CERN. The collaboration made measurements of “associated neutrons” and used a cascade simulation Fry and Haidt (1975) to translate that measurement into an estimate for neutron production from neutrinos interacting in the material upstream, and so obtained the crucial constraint on the background. Similar studies were needed for follow-up neutral-current measurements including those with two liquid scintillator detectors Entenberg et al. (1979); Horstkotte et al. (1982); Ahrens et al. (1987) in the Brookhaven National Laboratory neutrino beam, and the “dirt backgrounds” from MiniBooNE’s measurement Aguilar-Arevalo et al. (2010); Perevalov (2009). These neutrons’ time and spatial distributions in the detector were measured and simulated in order to constrain and subtract backgrounds, but were not correlated with simultaneous measurement of their original interaction in the material upstream of the detector. MiniBooNE’s paper presents a comparison to a modern Monte Carlo simulation using the NUANCE neutrino event generator Casper (2002), and GEANT3 Brun et al. (1987) using the GCALOR Zeitnitz and Gabriel (1994) option, and found that a 30% reduction of the neutron component was needed to describe the data.
Recently, a measurement Acciarri et al. (2019) was presented by ArgoNeuT for neutrino-argon reactions which is similar to the one in this paper. The ArgoNeuT analysis studied low-energy photons produced by the deexcitation of the argon nucleus struck by the neutrino and by the deexcitation of argon nuclei struck by neutrons generated in the neutrino reaction. Unlike the MINERvA antineutrino data described in this paper, the neutron component is only half the sample, and the photons from deexcitation of the argon nucleus struck by the neutrino are evident in the spatial and multiplicity distributions. In the ArgoNeuT study, both components were simulated by FLUKA Böhlen et al. (2014); Ferrari et al. (2005). Another recent paper Friedland and Li (2019) breaks down the simulation of neutrino and antineutrino reactions with argon to provide details of the pathways to missing energy, especially via neutrons.
MINERvA has several advantages relevant to detecting neutrons from (anti)neutrino interactions. The 5.3 ton, fully active tracking volume is much larger than the neutron-interaction length of approximately 10 cm for neutron kinetic energies near 20 MeV. Larger volumes have been used (Super-K and MiniBooNE) but their Cerenkov technique has too high a threshold for detecting the protons scattered by neutrons. MINERvA’s active volume is polystyrene , shortened to CH when used in nuclear and particle physics. For low-energy neutron detection, the hydrogen presents as significant a target as the carbon, despite a carbon nucleus having 12 nucleons. And MINERvA is sensitive down to a low threshold of 1 MeV because it is an underground detector with low noise overall and well-constrained contributions from other sources of neutron production in the beam.
II MINERvA experiment
MINERvA is a dedicated neutrino-nucleus cross section experiment. Its goals are to make cross section measurements needed for neutrino oscillation experiments and to probe the environment of the nucleus, complementary to what the electron scattering community has accomplished. The experiment is located in the high-intensity “Neutrinos at the Main Injector” (NuMI) beam at Fermilab.
The centerpiece of the detector Aliaga et al. (2014) is a 5.3 ton fully active scintillator tracker with excellent calorimetric properties of its own and surrounded by additional electromagnetic and hadronic calorimeters. The experiment also has passive targets made of iron, lead, water, graphite, and helium, which enable the study of the A-dependence of neutrino and antineutrino reactions.
The tracker is built from planes of polystyrene scintillator strips. With Lexan sheets, epoxy, tape, and reflective titanium dioxide, the target consists of 8.2%, 88.5%, and 2.5% hydrogen, carbon, and oxygen respectively (by mass), plus small amounts of heavier nuclei. The strips are triangular in shape with 3.3 cm base and 1.7 cm height and up to 245 cm length. The strips are nested with alternating orientation to make 1.7 cm thick planes. With this arrangement, ionization activity in the plane is split between strips and tracking resolution is improved. An entire plane is a hexagon containing 127 strips and one module consists of two planes. The second plane in one module is oriented with the strips vertical, producing an X-coordinate of the observed energy deposits. The plane in front of it is rotated 60 deg one way to form a U coordinate or the other way to form a V coordinate. The resulting modules are themselves alternated to produce repeating UX,VX sets of planes, with the detector Z axis running normal to these planes. The MINOS Near Detector Michael et al. (2008) is located 2 m downstream of MINERvA and measures the charge sign and momentum of muons selected in this analysis.
These data were obtained from the NuMI beam Adamson et al. (2016c) operating in antineutrino mode. The primary 120 GeV proton beam interacts in a graphite target producing pions and kaons. Two magnetic horns focus the the negatively charged mesons toward a decay pipe, leading to an antineutrino spectrum that peaks near 3.0 GeV. In total, these data are from an exposure of protons on target between November 2010 and February 2011. This beam configuration also produces neutrino charged-current interactions in the detector which are over 10% of the events in the antineutrino peak energy range used in this analysis. These are removed with high efficiency because their measured curvature in the MINOS Near Detector is the wrong direction.
The flux prediction is GEANT4 based Agostinelli et al. (2003); Allison et al. (2006) with central values and uncertainties adjusted Aliaga et al. (2016) using thin-target hadron production data Alt et al. (2007); Denisov et al. (1973); Carroll et al. (1979); Allaby et al. (1969) and an in situ neutrino-electron scattering constraint Park et al. (2016). The design of this analysis is relatively insensitive to the resulting 8 to 10% uncertainties in the energy spectrum or the absolute flux.
III Simulation
The reference simulation combines the GENIE 2.8.4 neutrino-interaction model Andreopoulos et al. (2010) with modifications, the GEANT4 9.4.p2 particle transport model Agostinelli et al. (2003); Allison et al. (2006) with modifications, a calibrated detector time and energy response model Aliaga et al. (2014, 2015), and an “overlay” of data events to reproduce the unrelated activity that might overlap in time with the simulated event.
III.1 GENIE event generator
GENIE’s simulation of the charged-current quasielastic process is from Llewellyn Smith Llewellyn Smith (1972) with vector form factors parametrized as in Ref. Bradford et al. (2006), and a dipole form factor with axial mass of 0.99 GeV. A relativistic Fermi gas model Smith and Moniz (1972) is implemented for interactions on carbon and other nuclei. The and higher resonances are from Rein and Sehgal Rein and Sehgal (1981), with a nonresonant component added from the DIS model as the resonances are phased out from invariant mass 1.4 W 2.0 GeV. The DIS cross section comes from the Bodek-Yang model Bodek et al. (2005), where the hadronic system Yang et al. (2009) is produced using Koba, Nielsen, and Olesen (KNO) scaling Koba et al. (1972) transitioning to PYTHIA Sjostrand et al. (2006) between 2.4 and 3.0 GeV.
Modifications are made to the above default GENIE 2.8.4 model. We refer to this set as MINERvA tune version 1.1 (MnvGENIE-v1.1). These modifications can also be applied to the default 2.12.6 version of GENIE. The QE process is modified to include a screening effect based on the random phase approximation (RPA) technique. The suppression is based on the calculations of Nieves and collaborators Nieves et al. (2004); Gran et al. (2013) for a Fermi-gas nucleus and implemented by reweighting GENIE QE events Gran (2017), including an uncertainty on the RPA screening derived from comparison to neutron capture data Valverde et al. (2006); Nieves and Sobczyk (2017). The uncertainty on the QE axial form factor is set to 9% following the analysis of Ref. Meyer et al. (2016); additional uncertainty on the highest component is not needed for this sample. Nonresonance pion production is reduced based on the reanalysis of bubble chamber neutrino data Rodrigues et al. (2016b); Wilkinson et al. (2014). Coherent pion production with pion kinetic energy below 450 MeV is also reduced based on analysis of MINERvA data Higuera et al. (2014); Mislivec et al. (2018) and consistent with the Berger-Sehgal Berger and Sehgal (2009) modifications of the original Rein-Sehgal model Rein and Sehgal (1983).
Of special interest is the interaction of the antineutrino with two nucleons, knocking them both out and leaving two holes (2p2h) in the nucleus. In this analysis, the base model for the 2p2h component with no pion is from the IFIC Valencia group Nieves et al. (2011); Gran et al. (2013) implemented in GENIE Schwehr et al. (2016). This process is further enhanced in the region between the QE and resonance components based on a fit Rodrigues et al. to the reconstructed neutrino data presented in Ref. Rodrigues et al. (2016a). In all but the last figure in this paper, the error band includes an uncertainty on this fit that varies the fraction of reactions on pn and pp initial states. This enhancement has been applied to this analysis and successfully describes a wide variety of data for other MINERvA observables Betancourt et al. (2017); Altinok et al. (2017); Patrick et al. (2018); Lu et al. (2018); Gran et al. (2018); Ruterbories et al. (2019).
Reinteractions of nucleons and mesons FSI as they exit the target nucleus are the other important mechanism for neutron production. The GENIE simulation of final-state reinteractions of hadrons leaving the nucleus is a parametrized, effective cascade model which is called “hA”, short for hadron-nucleus interaction. The model steps hadrons through a nucleus with its associated radius and nuclear density function. The hadron’s mean free path is then determined from tabulated hadron-proton and hadron-neutron cross sections from SAID SAI . The resulting probability of interacting within the nucleus is high, 73% for a neutron from a 3 GeV quasielastic event in carbon, and 88% in iron. Because the code originated with the MINOS experiment Michael et al. (2008), when an interaction is specified, the fates (absorption, pion production, knockout, charge exchange, elastic scatter) are chosen according to their proportions for iron. In-medium effects that might relatively favor particular fates in carbon or lead are not included in this original version, nor is multiple scattering. When one interaction occurs, the number of outgoing nucleons is drawn from a distribution that favors single nucleon, deuteron, and alpha states, but allows a chance for complete breakup.
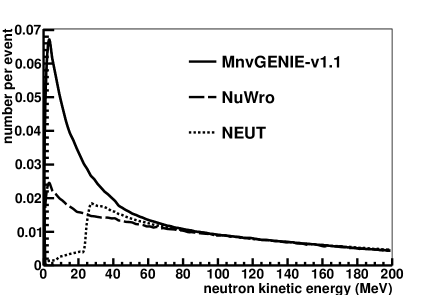
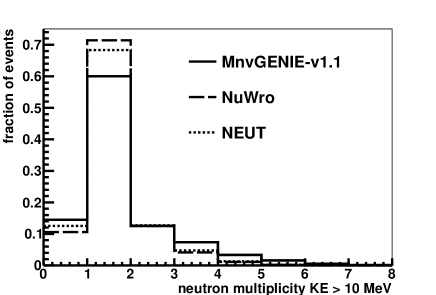
Compared to the cross sections for the initial reactions, the simulation of FSI differs the most among different event generators. The GENIE FSI model produces more low-energy nucleons than other commonly used neutrino event generators. Figure 1 shows the energy and multiplicity spectra for a newer (2.12.10) but equivalent version of GENIE with its models and modifications configured for the MnvGENIE-v1.1 tune. It is compared to two other common generators NEUT Hayato (2002, 2009) and NuWRO Golan et al. (2012), produced using the NUISANCE framework Stowell et al. (2017). The inputs are monoenergetic 3 GeV antineutrinos on a CH target, and the GeV selection is made. Neutrons below 2 MeV are not included in the kinetic energy distribution. Appropriate to this analysis, neutrons below 10 MeV are not included in the multiplicity distribution. Below 25 MeV, the NEUT generator stops any reinteraction process (cross section is set to zero), so those neutrons are placed outside the nucleus rather than producing yet more and lower-energy neutrons. In contrast, above 50 MeV, each generator is using similar models for the primary production of neutrons before FSI, and their predictions for the neutrons’ kinetic energy spectra converge.
III.2 GEANT4 neutron propagation model
Particles in the final state are passed to GEANT4 9.4.p2 with the Bertini cascade option (QGSP_BERT) which propagates them through a model of the MINERvA detector geometry and materials. Uncertainties in the charged hadron-interaction cross section in the scintillator are implemented using a reweighting scheme and an uncertainty of % based on our analysis of this version of GEANT and data for protons Dietrich et al. (2002); Menet et al. (1971); McGill et al. (1974); Renberg et al. (1972); Dicello et al. (1967); Zanelli et al. (1981); MacGregor et al. (1958); Bauhoff (1986) and pions Ashery et al. (1981); Wilkin et al. (1973); Clough et al. (1974); Allardyce et al. (1973); Gelderloos et al. (2000). Confidence in the proton and pion response at these energies also comes from analysis of calorimetric data taken with MINERvA detector elements in a test beam at Fermilab Aliaga et al. (2015). The charged hadron scattering cross sections in the detector are not major sources of uncertainty. The same study found the neutron inelastic scattering on nuclei also models the data Ibaraki et al. (2002); Schimmerling et al. (1973); Voss and Wilson (1956) at the 10% level, but the total cross section (elastic + inelastic) for this version does not describe the Abfalterer data Abfalterer et al. (2001).
The energy dependence of the total cross section for neutrons in GEANT4 has been improved since this older version. We have compared this version with a late 2016 release (v10.2.p2) to understand changes in the neutron-interaction code. The new versions now match the Abfalterer et al. high-precision neutron scattering total cross sections Abfalterer et al. (2001) on carbon and hydrogen from 5.2 to 560 MeV. Using the same reweighting tools as to evaluate hadron systematic uncertainties, the older GEANT4 cross section is changed to represent these same data. After making this correction we assign uncertainties of 25% below 10 MeV, 20% from 10 MeV to 25 MeV, and 15% above 25 MeV. These are applied to the total cross section, but are larger than the remaining discrepancy with the data. In this analysis they play the effective role of uncertainties on the elastic vs. inelastic components.
In principle, another uncertainty arises from the outcomes of the neutron-hydrogen and neutron-carbon interactions. The Abfalterer et al. total cross section includes elastic scatters that deflect the neutron as little as 0.12 degrees, which involve sub-keV scale energy transfers. Thus, the GEANT4 model also makes a prediction for the fraction of scatters that are above and below our experimental threshold. The accuracy of this feature of the prediction is not well constrained by available data.
A second, prominent feature of the GEANT4 neutron-scattering model is the production of deexcitation photons following neutron-carbon reactions. Such photons Compton scatter and account for 50% of the neutron candidates that originate from a GENIE neutron. The simulation predicts the rest are from protons and up to 5% from nuclear fragments. For comparison, three recent accountings of neutron induced activity are presented in Acciarri et al. (2019); Bhandari et al. (2019); Friedland and Li (2019) for argon; the latter has especially detailed discussion of simulated activity.
GEANT4 provides an alternate, high precision neutron simulation (HP in the GEANT4 option names), originally designed for studies of fission reactions up to about 20 MeV. After accounting for the Abfalterer cross sections, the differences between the fully simulated HP configuration and the default configuration appear where the lowest-energy neutrons are substantial parts of the sample, especially near the interaction point. But these differences are modest, similar to the other uncertainties, and difficult to disentangle from the rest of the GEANT4 predicted response.
III.3 Detector response
The simulation also must produce energy deposits consistent with our calibrated scintillator and electronics response. The photoelectron yield and absolute energy scale are tuned using a comparison of data and simulated muons at near-normal incidence to the planes. Nonlinearities for energy deposits above minimum ionizing muons are accounted for via individual calibration of the digitizing electronics Aliaga et al. (2014) and by the test beam calibration Aliaga et al. (2015) of Birk’s quenching in the scintillator.
The simulation reproduces the detailed response of light propagation in the scintillator bars and the photomultiplier tube, so that the simulated activity is reconstructed using identical steps as with the data. When a particle is fully tracked, every energy deposit’s location is known in all three dimensions. In this case, the reconstruction estimates the effect of light reflection and attenuation in the scintillator strip and optical fiber and produces a more accurate estimate of the actual energy deposit. This is rarely possible for the neutron energy deposits in this analysis. When not a part of the track, the reconstruction approximates each energy deposit to happen at a position halfway along the scintillator bar. Geometrical fluctuations will therefore be present in the energy and timing distributions in both data and simulation.
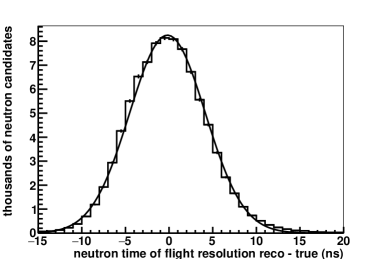
The width of the time distribution of digitized activity after light propagation depends on the photoelectron yield in the photomultiplier tube. The distribution used in the simulation is based on the observed distribution in data from fully tracked muons. Because averaging over the entire track yields a precise time and location for the passage of the muon through any one plane, the correlation of the fluctuations in time and the light yield in a single scintillator strip can be obtained directly, without resorting to individual photon modeling of the optical elements and photomultiplier tube response. The width of the time distribution is 10 ns for 1 to 2 photoelectrons and 3 ns for 6 to 12 (about 1 to 1.5 MeV in a single strip), then approaches the electronics limit of 2.2 ns. More detail on the nanosecond timing response and its use can be found in Ref. Marshall et al. (2016). With geometry-based fluctuations, the final time resolution for neutron candidates is 4.5 ns.
A subdominant contribution to neutron candidates in this analysis comes from other neutrino interactions inside and outside the detector, which produce their own neutrons and photons. They randomly happen at the same time as the charged-current reactions selected for this analysis. These “accidental” backgrounds are added directly to the simulation; 16 of activity from one pulse of the beam from data are selected randomly from the same months. This data activity is added on top of the activity from the simulated event. The resulting set of reconstructed times, locations, and energies are given to the same reconstruction algorithm. Thus this background and its dependence on the intensity of the beam are reproduced. Using alternate selections to isolate four regions that are predicted to be high (greater than 70%) in this particular background leads to the assignment of a 10% uncertainty applied to the simulation.
III.4 Further modifications of the simulation
The configurations within the simulation packages do not contain enough explicit uncertainties or tunable parameters to describe the data presented in this paper. Described in detail with the data in later sections, we will make two heuristic reductions in the number of neutron candidates in the simulation. One mimics a mismodeling of either or both the energy deposit spectrum and the number of deexcitation photons as simulated by GEANT4. The other reflects the wide range of predictions for low-energy neutrons from the neutrino interaction models suggested by Fig. 1. For this paper, the reductions allow us to quantitatively explore possible unknown effects, even though they do not represent a uncertainty.
IV Event sample and neutron selection
The sample of charged-current antineutrino events analyzed in this paper is the same inclusive sample from Ref. Gran et al. (2018) with reconstructed three-momentum transfer less than 0.8 GeV/c. This sample has high neutron content but little other charged hadronic activity to complicate the analysis of neutron activity. This allows us to use a low threshold of 1.5 MeV for neutron candidates.
IV.1 Selection of antineutrino events
Charged-current antineutrino interactions originate in the scintillator in the active tracker fiducial region. The resulting must be fully tracked to the end of the MINERvA detector and also reconstructed in the MINOS Near Detector Michael et al. (2008) where its positive charge and momentum are analyzed. To ensure a region of good geometrical acceptance we require GeV/c, and deg. The selected reconstructed neutrino energy range is GeV, so resulting data and simulated samples are the lower panels of Fig. 3 of Ref. Gran et al. (2018) and also match the selection used for the related neutrino-mode analysis Rodrigues et al. (2016a).
The muon energy and angle are combined with the observed hadronic energy deposits to form calorimetric estimates for the energy transfer (often called or by different groups in the literature), neutrino energy , square four-momentum transfer , and the magnitude of the three-momentum transfer (often simply called or ). The selection is inclusive because only the magnitude of reconstructed GeV/c enters the selection, not details of the number or type of hadrons observed.
We exploit the feature that this subsample can be divided into regions, hereafter called QE rich, dip, and rich. The QE-rich region has little or no observed hadronic energy and is predicted to be mostly 2p2h and QE. The -rich region has the most energy transfer and is predicted to be mostly resonance production and some 2p2h. The so-called dip region in between these two is a mix of all three processes, but also has the highest predicted concentration of 2p2h events. Again referring to the lower panels of Fig. 3 in Ref. Gran et al. (2018), boundaries are formed between the QE-rich, dip-region, and -rich subsamples. The reconstructed “available energy” is an estimator for a quantity that includes proton and charged pion kinetic energy and the total energy of neutral pions, photons, and electrons produced by a neutrino-interaction model. The latter, built from the model prediction for each generated event, explicitly does not include kinetic energy of neutrons nor the energy cost to remove nucleons from the nucleus, so it is always lower than the true energy transfer, and for some antineutrino reactions will be zero. The boundaries are at reconstructed available energy of 0.06 and 0.12 GeV for GeV/c and 0.08 and 0.18 GeV for GeV/c. For brevity many distributions in this paper are not divided this way and are presented as two regions.
IV.2 Selection of neutral particle induced candidates
Because the sample is limited to GeV/c, charged hadron activity is small and remains localized to the interaction point. The rest of the detector should have no hadronic activity except neutrons and photons, which this analysis considers signal. There are two backgrounds to neutron candidates to minimize: the “muon background” from electrons and bremsstrahlung photons and the “accidental background” from activity induced by the neutrino beam or cosmic rays and unrelated to the antineutrino reaction being analyzed.
Analysis of hadronic activity is done with reconstructed objects formed of “clusters” of energy deposits in one or multiple adjacent strips within the same plane. Each cluster is assigned a calibrated energy based on the sum of the individual energy deposits. A cluster also has a two-dimensional position, one from the location of the plane in the detector and one from estimating the transverse position in its plane based on energy-weighted average positions of activity in multiple strips. The calibrated time is the weighted average of hit times, taking into account the measured correlation between the number of photoelectrons and the width of the timing distribution of single strip activity from muons in data.
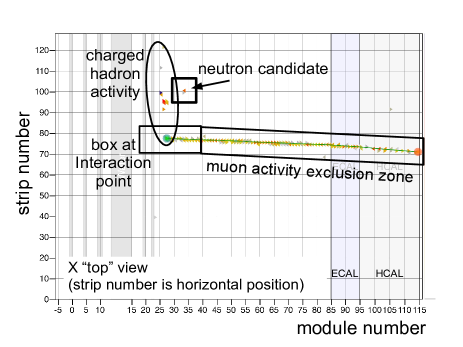
The criteria for spatially isolated clusters are designed to exclude four overlapping volumes in spatial proximity to the muon activity, the interaction point, other charged hadron activity, or to the outer boundary of the detector. An event display of the X-coordinate activity simulated event, Fig. 2, summarizes how activity in the first three categories is rejected and a single cluster neutron candidate is observed. Additional energy threshold and timing cuts complete the selection. Remaining clusters that are near each other, indicating they may be caused by the same neutral particle, are combined into multicluster candidates. The simulation is used to evaluate the effectiveness of these selections at reducing the muon and accidental backgrounds.
IV.2.1 Muon exclusion zone
The muon itself is fully tracked for all events in this sample, and most clusters are already assigned to the reconstructed track. Additional activity near the muon track is very likely caused by photons from bremsstrahlung and knock-on electrons (delta rays). From one module upstream of the interaction point to the back of the detector we exclude clusters within 17 cm (about ten strips) of the muon from consideration, about one mean free path for photons with energy of a few MeV. The simulation predicts that antimuon induced activity accounts for 90% of what would otherwise be candidates in this zone, but the simulation also underpredicts the data by 12%. This exclusion reduces the muon-induced background by a factor of 10.
This zone is increased to 24 cm starting 20 modules downstream from the interaction point, effectively a simplified implementation of an exclusion cone. The additional volume is predicted to be 65% muon activity and 3% accidental backgrounds and excluding it further reduces the muon background by another factor of 2. The simulation describes the activity in this outer zone well, contributing 3.5% fewer clusters than data. We assign twice this difference as the uncertainty on the muon contribution to the remaining selected clusters, which is negligible for this analysis.
IV.2.2 Interaction point exclusion zone box
Charged hadrons will produce activity near the neutrino-interaction point and the start of the muon track. The granularity of the detector imposes limits on separating muon, hadron, photon, and cross-talk activity when some or all of it fails to meet tracking criteria. This analysis follows our past analysis strategy Fields et al. (2013); Fiorentini et al. (2013); Patrick et al. (2018); Ruterbories et al. (2019) to avoid this region and its complicated systematic uncertainties for a primary analysis. The neutrino-interaction model is most challenged when asked to predict activity near the interaction point. This creates uncertain neutron detection efficiency effects and is deferred for future investigations.
Clusters of activity within a transverse “box” around this point are excluded from further consideration. Because of the three X,U,V orientations, the box has a pinwheel shape, but can be defined and coded simply when three-dimensional reconstruction is not available. This exclusion is for clusters within 17 cm transverse from a horizontal line parallel to the detector Z axis through the start of the muon track from ten modules upstream to fifteen modules downstream. In the downstream direction, it usually overlaps significantly with the muon exclusion zone. This region remains rich with neutron activity and may be explored in future neutron analyses.
IV.2.3 Charged particle exclusion zone
Some charged hadrons travel outside the interaction point exclusion zone. A spatial algorithm considers seed clusters near the interaction point and adds additional clusters to the total charged particle activity if they are nearby. This algorithm will follow such spatially connected activity arbitrarily far from the interaction point. This includes many and a few protons that are fully tracked but also activity from reinteractions in the detector that do not satisfy stricter requirements to form or extend a track object. This is the first full deployment of such an algorithm in a MINERvA analysis.
The procedure starts with a list of clusters that are inconsistent with cross-talk based on their energy and pixel location relative to other observed energy deposits within the same 64-pixel photomultiplier tube. Then, the two-dimensional distance to the neutrino-interaction point is formed. If at least one cluster is found within 250 mm, the list is searched again and any cluster within 100 mm of the first one is excluded from further consideration. Additional clusters are compared until no other cluster satisfies the 100 mm requirement with any prior cluster. Then it iterates five more times with the original 250 mm cluster test, which may identify additional hadrons going off in completely different directions.
For the many clusters near the interaction point, this procedure is largely redundant with the vertex exclusion box. However, it will follow spatially connected energy well outside the other exclusion zones. This trivially includes energy that was already part of a hadron track. It also includes energy produced when a hadron reinteracts creating additional untracked energy, and also hadrons from the interaction point that did not satisfy the stricter requirements to form a track object.
The performance of this selection can be illustrated by the situations that lead to a neutron candidate attributed to a from GENIE, which is one component of the signal and background that remain after all selections and summarized in Table 2. After inspecting the GEANT4 trajectory information, 85% of those neutron candidates from were caused by secondary neutrons, photons from nuclear deexcitation, and photons from the decay of neutral pions from charge exchange in the detector. The other 15% were not incorporated into the charged particle exclusion zone because some activity was highly transverse to the detector. There is such a simulated in the example in Fig. 2. Unlike this example, there is sometimes a cluster at high angle that did not meet the 100 mm tolerance to extend the exclusion zone. In total, these situations account for only 3% of the total candidate sample.
IV.2.4 Edge of detector, timing, and energy
Activity at the edges of the detector is excluded as follows: the first 20 planes and veto wall upstream, the last 10 planes in the downstream hadronic calorimeter, and the entire outer detector hadronic calorimeter. Most clusters are naturally found in the inner tracker region because it is near to the interaction point, has the largest fraction of the active scintillator in the detector, and the scintillator has the highest hydrogen content of all the detector materials.
A few additional selections reduce the already small accidental background. Clusters not yet excluded must be within a time window from 20 ns before to 35 ns after the interaction time determined largely from the muon track timing information. The clusters must also have at least 1.5 MeV of energy. The accidental background overtakes the predicted signal processes at cluster energies below 1.2 MeV. This energy cut also eliminates photomultiplier tube cross-talk effects in both selected data and simulated events. This version of the accidental background overlay technique is not perfect. For this early version it is checked against the data for accidental-rich subsamples leading to an uncertainty of 10%. This conservative uncertainty has negligible impact on the results.
IV.2.5 Aggregating spatially nearby clusters into candidates
Some isolated clusters can be spatially connected. Two clusters within three modules of each other are merged into one neutron candidate. This merging continues if additional clusters satisfy this requirement. Because there is so little hadronic activity in these low subsamples this simple requirement is effective. In this sample, 62% are candidates made of a single cluster, 18% are made of exactly two clusters; the simulation predicts 61% and 19% respectively.
IV.3 Signal and background
Neutrons that exit the nucleus where the neutrino interaction occurred are of the most interest. They are the aspect of the interaction model that has never before been directly tested. When referring to the GENIE simulation of this component, including direct production and via FSI, we will call them GENIE neutrons. Protons and charged pions produce real secondary neutrons as they travel through the detector. These are an irreducible background and no attempt is made to reject them. Table 2 quantifies the sources that cause the majority of neutron candidates.
| three-momentum transfer | ||
| GENIE particle | ||
| Neutron | 78.1% | 60.8% |
| Proton | 0.4% | 1.6% |
| 12.3% | 22.8% | |
| 2.6% | 10.3% | |
| Muon | 4.0% | 2.4% |
| Data overlay | 2.1% | 1.4% |
| Other | 0.6% | 0.6% |
| Events simulation | 4499 | 11651 |
| Events data | 4897 | 11263 |
| Cand/evt simulation | 0.647 | 1.284 |
| Cand/evt data | 0.584 | 1.103 |
Photons also produce energy deposits distant from the main parts of the event. Thus the decay products of are an electromagnetic component of candidates. The entries in Table 2 include 14% (so 1.7 and 3.2% of the respective column totals) which charge exchanged to in the detector. With such little hadronic energy in the final state, it is convenient to treat these also as irreducible backgrounds, and make no selection to reduce them. Because of the selection, these photons are relatively low energy. MINERvA’s and selection algorithms Altinok et al. (2017); Le et al. (2015) have an efficiency of 15% because identification requires two reconstructed photon candidates and an effective threshold of 25 MeV on the lower-energy photon. As will be seen, the electromagnetic component traveling at the speed of light will separate from slower neutrons in distributions that use time-of-flight information. Because no attempt is made to reject the backgrounds, the analysis of neutral particle activity remains inclusive of all hadronic final states.
The small “other” category originates with and kaons, mostly from DIS processes which feed down into the sample from higher reactions. This category also includes photons and electrons from production and decay. Photons from GENIE’s deexcitation of residual nuclei would be present and isotropic in the data sample, but are only simulated for oxygen, not carbon nor other nuclei. Radiative processes from the lepton exiting the nucleus might be collinear with the muon and are also not simulated in GENIE.
The backgrounds from the muon and accidentals are small. The effectiveness of the cuts can be illustrated quantitatively, relative to the base selection. Including the very ends of the detector doubles the accidental background. Not excluding the 17 to 24 cm outer volume around the muon doubles the muon background. Using an incident neutrino energy range up to 20 GeV increases the statistics of the total data and simulated sample by 17% and also all the simulated signal and irreducible background subcomponents. Compared to the base selection, these higher-energy reactions have 30% more in the other category from feed-down of higher DIS events. The muon component (because bremsstrahlung is more likely) is also higher by 22%.
Three other cuts could be relaxed to extend the physics reach, but doing so would increase the backgrounds. These samples are consistent with the main sample but do not further enhance the conclusions. Reducing the energy threshold for candidates from 1.5 down to 1.2 MeV increases the predicted rate by 10% overall, but the data rate increases only by 8%. The predicted muon and accidental background rate increase by 30% and 50% respectively, collectively accounting for 20% of the additional candidates. Allowing the timing to go out to 100 ns adds events that are predicted to be half from the accidental background.
IV.4 Efficiency
Focusing again on the most interesting signal process, the probability that a neutron from the GENIE model produces a cluster of activity is high because of the large volume of the fully active scintillator. The probability to survive the selection rises with kinetic energy from few to 60% . This is shown in Fig. 3, which also illustrates the predicted neutron kinetic energy spectrum for this antineutrino GeV/c sample.
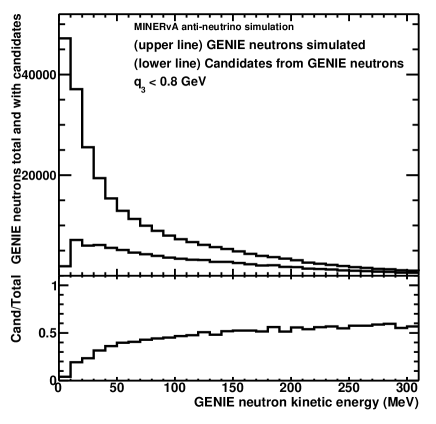
Details of the selection process sculpt the distribution. The region near the interaction point especially is a place where 45% of neutrons leave activity, as one would expect from a mean-free-path process. Some lower-energy neutrons are effectively below threshold after just one interaction, and the lowest-energy neutrons do not travel very far and thermalize locally. Higher-energy neutrons may still interact again and be visible.
The efficiency for detecting neutrons using plastic scintillator has been studied since the late 1950s. The 1962 measurement Wiegand et al. (1962) in a scintillator 15 cm thick with a simple discriminator-based 1.5 MeV electron-equivalent threshold is very similar to the conditions of this MINERvA measurement. They observed an efficiency of 20% at 76 MeV and 30% at 10 MeV. Below this the threshold reduces the efficiency significantly. These data have been compared to increasingly sophisticated simulations over the years, such as in Ref. Cecil et al. (1979). GEANT4 produces a similar efficiency for neutrons above 20 MeV, but predicts closer to 40% efficiency at 10 MeV.
The mix of hydrogen and carbon in the detector affects the efficiency for different ranges of neutron kinetic energy. A special purpose GEANT4 neutron simulation in the MINERvA detector with the same reconstruction as this analysis predicts that hydrogen produces more candidates per nucleus up to neutron kinetic energy of 20 MeV where it is equally probable as detectable scatters from carbon. The hydrogen-to-carbon ratio remains around 1:6 up to 100 MeV, then falls further past 1:12 at higher neutron kinetic energies. What is called neutron inelastic scattering in carbon begins around 10 MeV of neutron kinetic energy. (This includes single nucleon knockout, which is the strong-interaction analog to the processes called quasielastic electron scattering and neutral current elastic neutrino scattering.) At lower kinetic energy, neutrons are not able to transfer enough energy to a proton to remove it from the nucleus, yet elastic scattering off hydrogen can produce a proton above the detection threshold. A liquid argon detector would have significantly less acceptance below 20 MeV kinetic energy for the same threshold; a liquid scintillator (CH2) detector could have more.
Identifying the presence of a neutron is easier than guessing what the energy of the neutron was. The spectra of energy deposits for neutrons in three different kinetic energy ranges are shown in Fig. 4 (the same figure appears in Ref. Gran et al. (2018)). The reconstructed energy of a single cluster, or the sum of two or more clusters aggregated into a single candidate is mostly uncorrelated with the kinetic energy of the neutron. The most likely neutron candidate for all kinetic energies considered in this sample is just at the 1.5 MeV threshold.
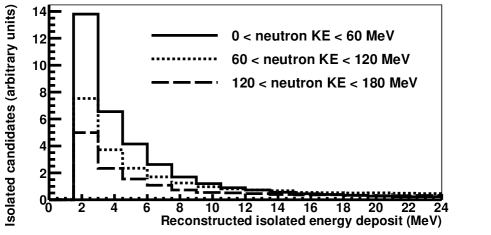
As the neutron energy rises, the probability it will produce an energetic proton that travels several planes and leaves tens to hundreds of MeV also rises, and populates the distribution at and beyond the right edge of the plot up to hundreds of MeV.
The converse is also relevant. Neutrons in the range 10 to 20 MeV can only make the smallest energy deposits. The presence of a small energy deposit does not automatically indicate a low-energy neutron. But the presence of many low-energy neutrons can only enhance the rate of the smallest energy deposits.
Overall, the presence of neutrons down to 50 MeV kinetic energy is determined with good efficiency and low backgrounds. Though the efficiency continues to fall, neutrons down to 10 MeV are predicted to cause a substantial part of the sample.
V Measurements of neutron activity
One observation already stands out from Table 2. There is an overall overprediction of neutron candidates in the simulation, further emphasized in Table 3. It appears in all subdivisions of the sample, despite different amounts of QE, 2p2h, and resonance, and their varying neutron final-state content. Because the efficiency is so high and the backgrounds are so low, either GENIE is producing too many neutrons per event or the GEANT4 neutron propagation plus detector response simulation is making them more visible than in the data. Compared to Table 3, before modifying the GEANT4 cross section to match the Abfalterer et al. measurements, the neutron candidates per event were 1.20 for each range of momentum transfer.
| three-momentum transfer | ||
|---|---|---|
| MC/data | ||
| Selected events | 0.92 | 1.03 |
| Neutron candidates | 1.02 | 1.20 |
| Neutron candidates/event | 1.11 | 1.16 |
| Statistical uncertainty | 0.02 | 0.01 |
| Systematic uncertainty | 0.07 | 0.04 |
In this section, distributions of deposited energy, time, and position upstream or downstream are shown. Then neutron speed (actually 1/) and multiplicity per event are used to draw final conclusions. Starting with the time distributions, the low-energy candidates and high-energy candidates are separated, and the oversimulation persists in the former.
In all cases, the reconstructed data distribution is shown with statistical uncertainties only (often too small to see) and the simulation is shown with model and detector systematic uncertainties. Some physics effects being tested with these data are not included in the systematic uncertainties and are described explicitly. Each figure is neutron candidates per event like Table 3, reducing systematics that affect the numerator and denominator equally, such as the flux and some cross section uncertainties. Discussion of specific uncertainties and resolutions are provided with each new distribution, if not previously described.
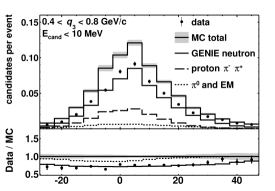
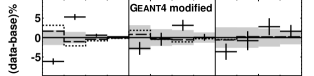
In each plot, the simulation is broken down into GENIE neutrons, other sources of neutrons, and the electromagnetic component. The muon and accidental backgrounds are often too small to see and are described in the text instead of being plotted. Each figure has a lower, ratio subpanel where the data-to-simulation ratio is compared to the reference model and its uncertainties, to emphasize the magnitude and location of discrepancies.

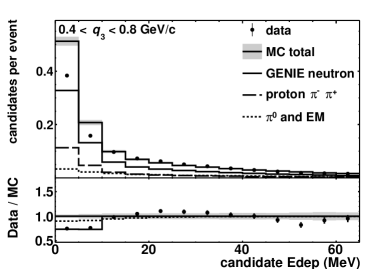
V.1 Spectrum of candidate deposited energy
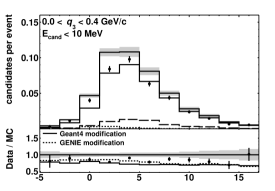
The energy deposit spectrum shown in Fig. 5 highlights that the extra neutron candidates in the simulation are limited to those with less than 10 MeV. They are unambiguously from neutron production. The predicted neutron components of the spectrum are much higher and peak much more strongly at threshold than the electromagnetic component, shown by the dotted line in Fig. 5. The estimate of the backgrounds is not subtracted and is a 12% contribution to the first bin in each histogram (not shown with its own line, but similar to the proton+pion population in those two bins), and negligible everywhere else. Above 10 MeV, the data are described by the simulation, allowing for the systematic uncertainties summarized by the shaded region.
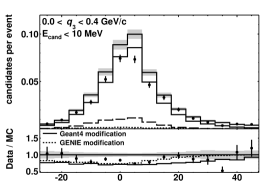
We use these data to probe for model features beyond the standard systematic uncertainties included in the error band. The ratio subpanel includes two modified models we will refer to as “benchmarks” throughout this section. For the solid “modified GEANT4” line, we eliminate a random 50% of neutron candidates with less than 10 MeV energy deposit and originating from neutron-producing GENIE particles (neutrons, protons, ). Without regard to the energy of the particle, this mimics moving part of the GEANT4 or detector response below our detection threshold, making these elastic scatters invisible, or reducing the number of photons produced by nuclear deexcitations in carbon following the nucleon knockout process. The dotted line implements a neutrino-interaction model change; 50% of candidates caused by GENIE neutrons below kinetic energy of 50 MeV are removed. This makes the prediction more like NuWRO in Fig. 1. These benchmark modifications are chosen empirically to have about the right size and allow the analysis to track their effects across the rest of the distributions.
Considering Fig. 4, neutron-caused candidates above 10 MeV are necessarily from higher kinetic energy neutrons, while the lowest-energy candidates are a mix of everything. By itself, the modified GENIE benchmark that reduces only the lowest-energy neutrons would provide a description the GeV/c region at the edge of the systematic error band. But its effects are not strong enough to describe the right panel. The GEANT4 benchmark that removes only low-energy candidates would describe both regions adequately, and the 5 to 10 MeV point in the left plot would remain slightly outside the error band.
Uncertainties
Signal response uncertainties that affect the probability a neutron will produce a cluster near the 1.5 MeV threshold are important. Neutron elastic scatters produce a low-energy proton of which the detector response is affected by a scintillator quenching effect parametrized using Birks’s Law Birks (1951, 1964). Our parameter and its uncertainties are calibrated using test beam data from stopping protons Aliaga et al. (2015) especially the last 40 MeV of their energy deposits. The uncertainty is doubled for neutron-induced candidates with less than 5 MeV, which are not well constrained by the test beam data. The total Birks’ uncertainty changes the response as much as 25% for candidates near threshold. Increasing the Birks suppression migrates events down in these distributions and some fall below the 1.5 MeV threshold. Modern studies of Birks’s quenching in liquid and plastic scintillators von Krosigk et al. (2013, 2016), made for supernova and solar neutrino detection, are also at these energies and confirm the predicted scintillator response. This uncertainty is the largest single contribution in the first bin of Fig. 5, but is only 4%.
The GEANT4 cross section model uncertainties play a lesser role in this distribution than they do in the time and spatial distributions later. An increase in the cross section (decrease in the mean free path) makes candidates interact earlier. Candidates are more likely in and near the interaction exclusion region and there are fewer candidates overall. It contributes 4% to the uncertainty but only 2% in the first bin. The GEANT4 energy deposit model and photon yield are further explored using the benchmark modification shown with the solid black line in the ratio panels.
Large rate uncertainties on the QE, 2p2h, and resonance models combine for 3% uncertainty on this distribution, but less than 1% uncertainty in the first two bins, and are the largest source for most bins for GeV/c. All these antineutrino processes produce some neutrons with similar energies. Distortions of the energy transfer spectrum for these processes, such as the uncertainty assigned to the RPA screening effect for QE used in the reference model Nieves et al. (2004); Gran (2017) are at 4% and only important for the GeV/c subsample beyond the first two bins.
Effects related to the hadronic energy scale act in a special way and are significant for energy deposits above 10 MeV. They cause a migration of events up and down the range of . This migration effect is most significant and dominates parts of the error band for . The subsample is lower statistics, has fewer candidates per event overall, and does not have compensating event feed-in/-out at its lower boundary. The hadronic energy scale uncertainties are assigned based on test beam data with an enhanced uncertainty for the neutron response that was not directly tested. The GENIE FSI uncertainties also play this same migration role, in addition to directly changing the number of candidates in each event, and contribute a similar amount to total uncertainty.
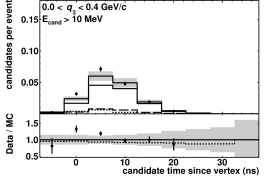
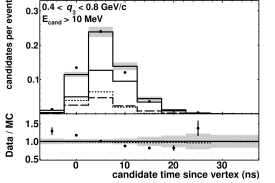
V.2 Time-of-flight distribution
The time difference between the neutron candidate and the interaction time, shown in Fig. 6 produces separation of the prompt electromagnetic component from the slowest neutron component. Because the simulated overprediction is so prominent in the first two bins, the following distributions will be separated into subsamples below and above 10 MeV of candidate energy deposit . The simulation’s overprediction for candidates with reconstructed energy less than 10 MeV in the upper panels appears roughly uniform across all high-statistics bins of time-of-flight. For higher-energy candidates in the lower panels there are trends beyond the edge of the error band to relatively overpredict the latest times, either from neutrons that traveled either the farthest or the slowest. The modified GEANT4 response model describes the data better than the modified GENIE model for the GeV/c top-right panel. By construction the GEANT4 benchmark has no effect on the lower panels, though the GEANT4 cross section uncertainties are significant in the error band. The GENIE modification reduces the slowest neutrons in the sample and has a slight shape effect smaller than the predicted error band.
Fluctuations to negative times are compatible with the time resolution of 4.5 ns for single-cluster candidates (shown later in Fig. 9): about one bin in these histograms. Systematic uncertainties directly from the measurement of time of flight for an individual event contribute negligibly. The simulation of the timing distribution is taken from a separate, in situ muon sample. The lack of bias is independently confirmed using clusters on the muon tracks of interactions in the selected sample and reconstructed the same as neutron clusters.
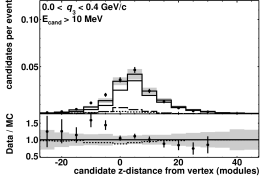
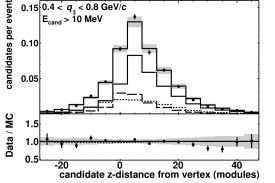
The same systematics described in the previous section are evaluated for this distribution. The GEANT4 neutron cross section model uncertainties enhance or reduce the appearance of neutrons that travel the farthest, and so have the longest times. It dominates the error bar in all bins beyond 15 ns. The other uncertainties described previously contribute roughly equal amounts in the center of the distribution.
V.3 Position upstream or downstream
The overprediction of candidates with energy deposits less than 10 MeV appear broadly around the interaction point, shown in Fig. 7. In the MeV samples, the oversimulation may be prominent near the interaction point in the top left plot, while it spans the detector for the higher momentum transfer sample in the top right plot. For higher-energy candidates, the simulation does well overall except for two underpredicted bins in the backward direction of the GeV/c panel (lower left).
There are more neutron candidates in the forward direction, where the QE process is especially relevant. In contrast, candidates from any process involving multiple particles can end up going backward from the interaction point. This includes multibody reactions 2p2h, , and FSI in the nucleus, and neutrons produced when protons and pions and neutrons reinteract in the detector.
The cross section for neutron reinteractions is the direct and dominant uncertainty in the downstream region, as it was for long times. Again, the other uncertainties contribute roughly equally in the peak of the distribution.
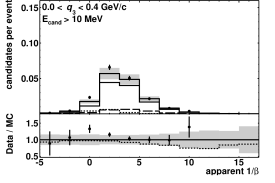

V.4 Particle speed
We estimate the apparent speed of the particle as a fraction of the speed of light, . Because the timing resolution plays a crucial role, and for better treatment of zero and negative times, it is more clear to present
The result is shown in Fig. 8.
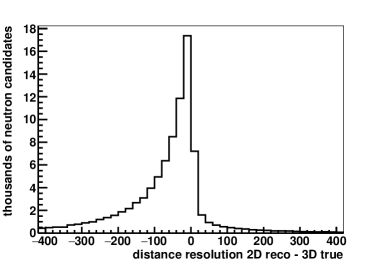
The estimate of a two-dimensional (2D) distance can be made of the hypotenuse of the distance in Z shown Fig. 7 and the distance along the one X, U, or V transverse direction measured for single-cluster candidates. This distance is transverse from the neutrino’s path, not from the muon. If the neutron candidate is made of activity in more than one plane, the longest transverse position is used. This distance estimator is necessarily smaller than the true distance the neutron traveled, because it is missing the third of three coordinates, and because some neutrons bounce and take an indirect path to the point where an energy deposit is observed. This distribution has properties similar to the one in Fig. 7, and is not shown.
The systematic underestimate of the 2D distance means a systematic overestimate of of about 0.8 and a rms resolution between 2 and 3, driven largely by the timing resolution. The resolution for the slowest particles with true is the worst because they do not travel very far and are observed closest to the interaction point. They have a resolution of around 4 and a bias of -0.8. The detector-only (without the effect of neutron multiple scatter) time and 2D distance resolutions are shown in Fig. 9. For neutrons, implies 20 MeV and implies 5 MeV; however the latter are expected to rarely produce candidates (see again Fig. 3) and the population beyond must be from fluctuations in the assigned time and distance. The resolutions and thresholds are such that the apparent is not usefully transformed into a kinetic energy distribution.
The GEANT4 cross section uncertainty, prominent in the time and z distance distributions separately, is much reduced and has little shape. A smaller or larger mean free path in the simulation affects both the time and the distance simultaneously. Other uncertainties contribute similarly across these distributions. The hadronic energy scale and FSI uncertainties (migrations in ) are especially significant in the first four bins of both the MeV (lower plots), which is where discrepancies remain.
The electromagnetic component peaks near , shown as the dotted line in the upper panels of each figure. The neutron component peaks instead near for candidates from the lowest kinetic energy neutrons and for faster neutrons. The GENIE benchmark modification produces a reduction in the slowest neutron component that goes in the direction of the data, but again does not match the overall magnitude of the discrepancy in the upper right panel.
V.5 Neutron multiplicity
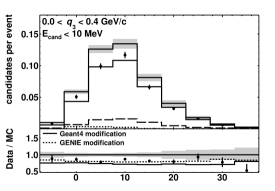
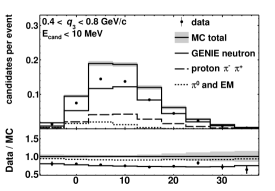
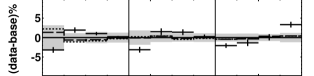
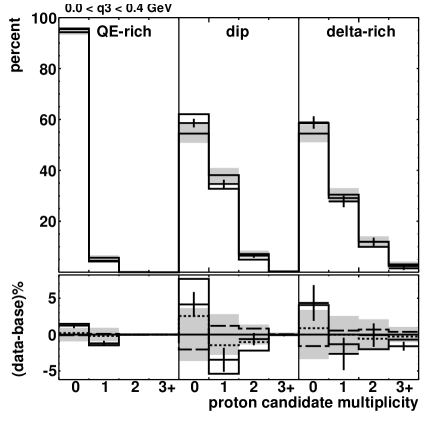
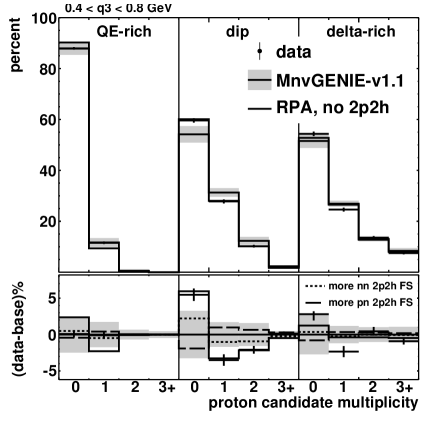
The overprediction of neutron candidates per event in the simulation also distorts the multiplicity of candidates per event, shown as a percent of the total in Fig. 10. The difference in percent (not the ratio) between the data and the reference simulation is shown in the first panel below the main distributions for compact comparison. The overprediction of neutrons masks the presence of the 2p2h component and RPA screening because both also enhance the percent of events with neutron candidates. Again, the GENIE and GEANT4 serve as benchmark modifications showing the (modified simulation - reference) in percent in the lower two rows, but now to expose these multinucleon features of the data. The two regions of shown in the previous figures are subdivided according to hadronic energy to produce distributions for QE-rich, dip, and -rich subsamples, six in total. In the top panels the oversimulation of neutron candidates is most evident in the dip and -rich subsamples where the simulation significantly overpredicts how many events have three or more neutron candidates and underpredicts how many have none.
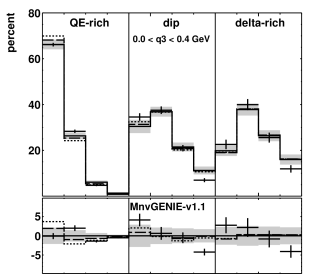
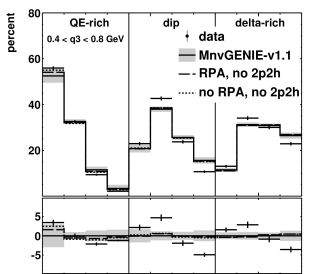

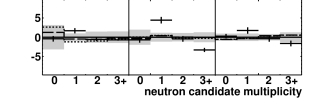
The QE-rich subsets uniquely offer predicted sensitivity to multinucleon effects. The long dashed line in Fig. 10 completely removes the simulated 2p2h component. These events preferentially had multiple neutrons in the first place, so removing them increases the bin with zero candidates. The short-dashed line shows that removing also the QE RPA screening effect adds back events of which the outgoing neutron was lower energy and less likely to make a candidate, also increasing the bin with zero candidates. In contrast to the QE-rich panels, there is no sensitivity to these multinucleon effects in the other panels; all reactions produce similar numbers of neutrons after FSI. Variations of RPA and 2p2h processes are the same size as the uncertainty bands in those panels.
A different way to summarize the subdivision of the data: neutrino model details in Fig. 10 are orthogonal to the neutron details in the previous figures. Modifications to the QE and 2p2h models show up in QE-rich region here while the excess of neutrons distorts all six panels similarly. The opposite happens in the previous figures; distortions of the spectra due to neutron production details are evident, but modifications to the 2p2h and QE models are largely flat with neutron candidate time, position, and speed.
What is desirable is to tune the neutron model to the dip and -rich regions, a common technique when there are sidebands to a signal selection. Such a tune would correct and constrain the mismodeled neutron effects in the multinucleon sensitive distributions. Though we do not directly have tunable parameters, a simplified version is obtained by remaking the distributions while applying the benchmark modifications to GEANT4 (third row) and GENIE (bottom row). The resulting dip and -rich regions are now consistent with uncertainties for GeV/c. The GEANT4 modification produces better distributions for GeV/c, perhaps overcorrecting, while the GENIE modification produces mild improvement that does not go far enough. Both roughly mimic the behavior of these benchmarks in the energy, time, position, and speed distributions.
The benchmark modifications also reduce the preponderance of simulated neutron candidates in the QE-rich signal region. This enables further interpretation of the presence of multinucleon effects and other unsimulated processes. Especially in the leftmost two bins in the lower two rows of panels, the modified simulations now have a 6% to 8% underprediction of events with one neutron candidate and an overprediction of events with none. This is roughly two times the combined effects of our current RPA, 2p2h multinucleon models and all systematic uncertainties. In both cases, the resulting new predictions hint the data want even more 2p2h interactions or RPA screening than the reference MnvGENIE-v1.1 simulation.
Sideband tuning usually takes a poor model and improves it before extracting the physics quantities of primary interest. In this case, it takes what was naively a reasonable description in the QE-rich sample and indicates disagreement beyond the available multinucleon effect models. However, all the relative trends (not shown) of the whole sample in energy, distance, time, and speed shown in previous figures are also present for the QE-rich sample, suggesting that the sideband adjustment will succeed and the new disagreement is a robust observation. Alternatives to simply adding more 2p2h or RPA screening that would correct the resulting model disagreement are to add an additional process like deexcitation photons from carbon, or a more nuanced, QE-specific version of either of the benchmark modifications.
In all the previous distributions, the current error bands preclude further detailed tests of the magnitude of RPA, the relative proton+neutron and neutron+neutron content of the 2p2h process, and the need for a low suppression of resonances Adamson et al. (2015). The sensitivity would be limited even if there were no large discrepancy, but modified RPA, 2p2h, or resonances would not explain the in the whole sample nor in the QE-rich sample on its own.
Prior MINERvA measurements show distributions with sensitivity to the RPA and 2p2h multinucleon models that may also be sensitive to neutron effects. In Fig. 3 of Ref. Gran et al. (2018) the reconstructed hadronic energy for this same sample is improved with the addition of RPA and a tuning of 2p2h to the neutrino data in Ref. Rodrigues et al. (2016a), but the antineutrino agreement is not perfect. The untracked energy within 100 mm from the interaction point of antineutrino reactions in Fig. 25 of Ref. Patrick et al. (2018) is effectively in the excluded region of this analysis. That distribution is also not as well described by MnvGENIE-v1 compared to the equivalent Figs. 35-36 of Ref. Ruterbories et al. (2019). In both examples, and based on the neutron observations in this paper, the description of the antineutrino data could be improved with reduction of the neutron component of the reconstructed energy in the simulation, while having a smaller effect on the neutrino-mode data. Such a mechanism supposes the reduced neutron energy goes missing rather than being offset by additional charged hadron energy.
V.6 Protons
This final study is the analog to the untracked protons reported for the related neutrino interaction sample of Ref. Rodrigues et al. (2016a), where the proton multiplicity with an untuned Valencia 2p2h process is at the edge of the error band of a prediction without it. Protons are counted by observing single strips with at least 20 MeV near the interaction point, indicating the Bragg peak at the end of the proton range. Because the single strip could be at the interaction point itself, the threshold is effectively just above 20 MeV. T2K has recently presented results for proton multiplicity Abe et al. (2018) using a tracking threshold kinetic energy of 100 MeV
Protons are also more common in the final state of a 2p2h antineutrino reaction, relative to antineutrino QE reactions. Repeating that earlier strategy reveals marginal sensitivity, shown in Fig. 11. The reference simulation is shown with a solid line and systematic error band, a simulation with no 2p2h process at all is shown with the second solid line that has fewer proton candidates and more zero-proton events. The RPA screening applied to the QE process has negligible effect on this proton distribution, and an additional line without it is not included. Two additional model variations are shown in the lower panels as the difference from the reference simulation. The dotted line enhances (above the Valencia 2p2h model) only the pn initial states which lead to nn final states and predict a higher fraction of events with no protons. The dashed line enhances only the pp initial states which lead to pn final states and produce more detectable protons.
Given the uncertainties, the proton multiplicity data are consistent with all model variations presented. Visually, the preference is for models that have fewer protons, either from less 2p2h overall or from 2p2h reactions that favor neutron only final states. The latter is also the conclusion from electron scattering results that indicate that pn short-range correlated pairs are significantly more common Subedi et al. (2008) than like-nucleon pairs. The GENIE FSI model uncertainties play the most significant role in degrading the sensitivity, because they control how many additional protons are ejected from the nucleus, especially for QE reactions. This sensitivity was not as strong in the neutrino case Rodrigues et al. (2016a) where outgoing protons are the direct products of the reaction. Both FSI and calibrated hadronic energy scale uncertainties have a significant effect on the QE-rich panel where a higher-energy scale causes a migration of events to the dip region or higher three-momentum transfer panel. Finally, the Birks’ suppression uncertainty is also significant throughout these distributions, its size is half the total uncertainty shown. It makes simulated protons more or less likely to pass the 20 MeV selection. Because 2p2h variations are shown explicitly, no uncertainty on the 2p2h process is included in the error band.
Liquid argon experiments Acciarri et al. (2014); Partyka (2015); Palamara (2016); Adams et al. (2019) have shown more low-energy, charged proton tracks in the simulation compared to data. Under ideal circumstances, this detector technology permits tracking of protons with as little kinetic energy as 21 MeV. The GENIE model also produces more low-energy protons than other neutrino event generators, correlated with its behavior for neutrons. This supports that the GENIE benchmark modification may be part of resolving these discrepancies. In MINERvA, protons under 20 MeV would not meet the threshold for detection. They would usually deposit all their energy in the same scintillator strip in which the reaction occurred, and it takes 100 MeV before protons start to be trackable. So unlike neutrons and unlike protons in liquid argon detectors, multiple low-energy protons in a single scintillator strip in MINERvA would be counted only once, if at all.
VI Conclusion
We have obtained the first time of flight, spatial, and speed (1/) distributions of neutrons from antineutrino interactions. The reference simulation, the components of which are widely used by neutrino oscillation experiments, overestimates the number of neutron candidates by 15% overall but by 25% for energy deposits less than 10 MeV, shown in the upper figures of Figs. 6-9. A possible interpretation is that the GENIE neutrino event generator and its FSI model are overproducing the lowest-energy neutrons. Also likely, the GEANT4 and detector models turn too many neutron interactions into measurable activity. Combinations and variations of these two benchmark modifications are paths forward. The discrepancy is around two standard deviations from the combination of the other sources of uncertainty.
Additional distortions may be present for candidates with energy deposits more than 10 MeV. The MC overestimates long times of flight relative to short in Fig. 6, far and forward relative to near and backward in Fig. 7, and slow relative to prompt in Fig. 8. These discrepancies are just beyond the error band, suggesting one or more of the uncertainties come close to accounting for these data.
It is a reasonable assumption that similar overproduction of small energy deposit neutron candidates is present for all subcomponents of the sample. In this case, the multiplicity distribution in the QE-rich subsamples indicates a preference for a model that has a combination of RPA screening and a 2p2h component, both of which reduce the relative proportion of events with zero neutron candidates.
Acknowledgements.
We are grateful to Juan Nieves, Ignacio Ruiz Simo, and Manuel Vicente Vacas for making their RPA and 2p2h code available for study and incorporation into this analysis. Samples of other neutrino event generator neutron predictions were prepared by Jake Calcutt, Luke Pickering, and Kendall Mahn using the NUISANCE framework. This document was prepared by members of the MINERvA Collaboration using the resources of the Fermi National Accelerator Laboratory, a U.S. Department of Energy, Office of Science, HEP User Facility. Fermilab is managed by Fermi Research Alliance, LLC (FRA), acting under Contract No. DE-AC02-07CH11359. These resources included support for the MINERvA construction project, and support for construction also was granted by the United States National Science Foundation under Grant PHY-0619727 and by the University of Rochester. Support for scientists for this specific publication was granted by the United States National Science Foundation under Grants PHY-1306944 and PHY-1607381. We are grateful for the United States National Science Foundation’s decade of direct support to the Soudan Underground Lab outreach program, including Grant PHY-1212342; this analysis originated as the research component for two summer undergraduate outreach interns. Support for participating scientists was provided by NSF and DOE (USA) by CAPES and CNPq (Brazil), by CoNaCyT (Mexico), by Proyecto Basal FB 0821, CONICYT PIA ACT1413, Fondecyt 3170845 and 11130133 (Chile), by CONCYTEC (Consejo Nacional de Ciencia, Tecnología e Innovación Tecnológica), DGI-PUCP (Dirección de Gestión de la Investigación - Pontificia Universidad Católica del Peru), and VRI-UNI (Vice-Rectorate for Research of National University of Engineering) (Peru); by the Latin American Center for Physics (CLAF); and NCN Opus Grant No. 2016/21/B/ST2/01092 (Poland). We thank the MINOS Collaboration for use of its near detector data. Finally, we thank the staff of Fermilab for support of the beamline, the detector, and the computing infrastructure.References
- Abe et al. (2017) K. Abe et al. (T2K Collaboration), Combined Analysis of Neutrino and Antineutrino Oscillations at T2K, Phys. Rev. Lett. 118, 151801 (2017), arXiv:1701.00432 .
- Adamson et al. (2016a) P. Adamson et al. (NOvA Collaboration), First measurement of muon-neutrino disappearance in NOvA, Phys. Rev. D 93, 051104 (2016a), arXiv:1601.05037 .
- Adamson et al. (2016b) P. Adamson et al. (NOvA Collaboration), First measurement of electron neutrino appearance in NOvA, Phys. Rev. Lett. 116, 151806 (2016b), arXiv:1601.05022 .
- Acciarri et al. (2015a) R. Acciarri et al. (Fermilab Short Baseline Collaboration), A Proposal for a Three Detector Short-Baseline Neutrino Oscillation Program for the Fermilab Booster Neutrino Beam, (2015a), arXiv:1503.01520 .
- Adams et al. (2013) C. Adams et al. (LBNE Collaboration), The Long-Baseline Neutrino Experiment: Exploring Fundamental Symmetries of the Universe, (2013), arXiv:1307.7335 .
- Acciarri et al. (2015b) R. Acciarri et al. (DUNE Collaboration), Long-Baseline Neutrino Facility (LBNF) and Deep Underground Neutrino Experiment (DUNE), (2015b), arXiv:1512.06148 .
- Wigmans (2017) R. Wigmans, Calorimetry, International Series of Monographs on Physics (Oxford University Press, 2017).
- Gran et al. (2018) R. Gran, M. Betancourt, M. Elkins, P. Rodrigues, et al. (MINERvA Collaboration), Anti-Neutrino Charged-Current Reactions on Hydrocarbon with Low Momentum Transfer, Phys. Rev. Lett. 120, 221805 (2018), arXiv:1803.09377 .
- Rodrigues et al. (2016a) P. A. Rodrigues, J. Demgen, E. Miltenberger, et al. (MINERvA Collaboration), Identification of nuclear effects in neutrino-carbon interactions at low three-momentum transfer, Phys. Rev. Lett. 116, 071802 (2016a), arXiv:1511.05944 .
- Andreopoulos et al. (2010) C. Andreopoulos et al., The GENIE neutrino monte carlo generator, Nucl. Instrum. Meth. A 614, 87 (2010), Program version 2.8.4, with private modifications, used here.
- Agostinelli et al. (2003) S. Agostinelli et al., Geant4 simulation toolkit, Nucl. Instrum. Meth. A 506, 250 (2003).
- Allison et al. (2006) J. Allison et al., Geant4 developments and applications, Nuclear Science, IEEE Transactions on 53, 270 (2006).
- Aliaga et al. (2014) L. Aliaga et al. (MINERvA Collaboration), Design, Calibration, and Performance of the MINERvA Detector, Nucl. Instrum. Meth. A 743, 130 (2014), arXiv:1305.5199 .
- Aliaga et al. (2015) L. Aliaga et al. (MINERvA Collaboration), MINERvA neutrino detector response measured with test beam data, Nucl. Instrum. Meth. A 789, 28 (2015), arXiv:1501.06431 .
- Cowan et al. (1956) C. L. Cowan, F. Reines, F. B. Harrison, H. W. Kruse, and A. D. McGuire, Detection of the free neutrino: A Confirmation, Science 124, 103 (1956).
- Amsbaugh et al. (2007) J. F. Amsbaugh et al., An Array of low-background He-3 proportional counters for the Sudbury neutrino observatory, Nucl. Instrum. Meth. A579, 1054 (2007), arXiv:0705.3665 .
- Zhang et al. (2015) H. Zhang et al. (Super-Kamiokande Collaboration), Supernova Relic Neutrino Search with Neutron Tagging at Super-Kamiokande-IV, Astropart. Phys. 60, 41 (2015), arXiv:1311.3738 .
- Back et al. (2017) A. R. Back et al. (ANNIE Collaboration), Accelerator Neutrino Neutron Interaction Experiment (ANNIE): Preliminary Results and Physics Phase Proposal, (2017), arXiv:1707.08222 .
- Beacom and Vagins (2004) J. F. Beacom and M. R. Vagins, GADZOOKS! Anti-neutrino spectroscopy with large water Cherenkov detectors, Phys. Rev. Lett. 93, 171101 (2004), arXiv:hep-ph/0309300 .
- Hasert et al. (1973) F. J. Hasert et al. (Gargamelle Neutrino Collaboration), Observation of Neutrino Like Interactions Without Muon Or Electron in the Gargamelle Neutrino Experiment, 30 years of weak neutral currents, Phys. Lett. B 46, 138 (1973).
- Hasert et al. (1974) F. J. Hasert et al. (Gargamelle Neutrino Collaboration), Observation of Neutrino Like Interactions without Muon or Electron in the Gargamelle Neutrino Experiment, Nucl. Phys. B73, 1 (1974).
- Fry and Haidt (1975) W. F. Fry and D. Haidt, Calculation of the Neutron Induced Background in the Gargamelle Neutral Current Search, Report CERN-75-01 (1975).
- Entenberg et al. (1979) A. Entenberg, J. Horstkotte, W. Kozanecki, A. K. Mann, C. Rubbia, J. Strait, L. Sulak, P. J. Wanderer, and H. H. Williams, Measurement of the Elastic Scattering of Neutrinos and Anti-neutrinos by Protons, Phys. Rev. Lett. 42, 1198 (1979).
- Horstkotte et al. (1982) J. Horstkotte, A. Entenberg, R. S. Galik, A. K. Mann, H. H. Williams, W. Kozanecki, C. Rubbia, J. Strait, L. Sulak, and P. J. Wanderer, Measurement of Neutrino - Proton and Anti-neutrinos - Proton Elastic Scattering, Phys. Rev. D 25, 2743 (1982).
- Ahrens et al. (1987) L. A. Ahrens et al., Measurement of neutrino - proton and anti-neutrino - proton elastic scattering, Phys. Rev. D 35, 785 (1987).
- Aguilar-Arevalo et al. (2010) A. A. Aguilar-Arevalo et al. (MiniBooNE Collaboration), Measurement of the Neutrino Neutral-Current Elastic Differential Cross Section on Mineral Oil at GeV, Phys. Rev. D 82, 092005 (2010), arXiv:1007.4730 .
- Perevalov (2009) D. Perevalov, Neutrino-nucleus neutral current elastic interactions measurement in MiniBooNE, Ph.D. thesis, Alabama U., FERMILAB-THESIS-2009-47 (2009).
- Casper (2002) D. Casper, The Nuance neutrino physics simulation, and the future, Nucl. Phys. Proc. Suppl. 112, 161 (2002), arXiv:hep-ph/0208030 .
- Brun et al. (1987) R. Brun, F. Bruyant, M. Maire, A. C. McPherson, and P. Zanarini, GEANT3: user’s guide, CERN-DD-EE-84-1 (1987).
- Zeitnitz and Gabriel (1994) C. Zeitnitz and T. Gabriel, The GEANT-CALOR interface and benchmark calculations of ZEUS test calorimeters, Nucl. Instrum. Meth. A 349, 106 (1994).
- Acciarri et al. (2019) R. Acciarri et al. (ArgoNeuT), Demonstration of MeV-Scale Physics in Liquid Argon Time Projection Chambers Using ArgoNeuT, Phys. Rev. D 99, 012002 (2019), arXiv:1810.06502 .
- Böhlen et al. (2014) T. T. Böhlen, F. Cerutti, M. P. W. Chin, A. Fassò, A. Ferrari, P. G. Ortega, A. Mairani, P. R. Sala, G. Smirnov, and V. Vlachoudis, The FLUKA Code: Developments and Challenges for High Energy and Medical Applications, Nucl. Data Sheets 120, 211 (2014).
- Ferrari et al. (2005) A. Ferrari, P. R. Sala, A. Fasso, and J. Ranft, FLUKA: A multi-particle transport code (Program version 2005), CERN-2005-010, SLAC-R-773, INFN-TC-05-11 (2005).
- Friedland and Li (2019) A. Friedland and S. W. Li, Understanding the energy resolution of liquid argon neutrino detectors, Phys. Rev. D 99, 036009 (2019), arXiv:1811.06159 .
- Michael et al. (2008) D. G. Michael et al. (MINOS Collaboration), The Magnetized steel and scintillator calorimeters of the MINOS experiment, Nucl. Instrum. Meth. A 596, 190 (2008), arXiv:0805.3170 .
- Adamson et al. (2016c) P. Adamson et al., The NuMI Neutrino Beam, Nucl. Instrum. Meth. A 806, 279 (2016c), arXiv:1507.06690 .
- Aliaga et al. (2016) L. Aliaga et al. (MINERvA Collaboration), Neutrino Flux Predictions for the NuMI Beam, Phys. Rev. D 94, 092005 (2016), [Addendum: Phys. Rev.D 95,no.3,039903(2017)], arXiv:1607.00704 .
- Alt et al. (2007) C. Alt et al. (NA49 Collaboration), Inclusive production of charged pions in p+C collisions at 158-GeV/c beam momentum, Eur. Phys. J. C 49, 897 (2007), arXiv:hep-ex/0606028 .
- Denisov et al. (1973) S. P. Denisov, S. V. Donskov, Yu. P. Gorin, R. N. Krasnokutsky, A. I. Petrukhin, Yu. D. Prokoshkin, and D. A. Stoyanova, Absorption cross-sections for pions, kaons, protons and anti-protons on complex nuclei in the 6-GeV/c to 60-GeV/c momentum range, Nucl. Phys. B 61, 62 (1973).
- Carroll et al. (1979) A. S. Carroll et al., Absorption Cross-Sections of pi, K, p and anti-p on Nuclei Between 60-GeV/c and 280-GeV/c, Phys. Lett. B 80, 319 (1979).
- Allaby et al. (1969) J. V. Allaby et al. (IHEP-CERN Collaboration), Total cross-sections of pi-minus, k-minus, and anti-p on protons and deuterons in the momentum range 20-65 gev/c, Phys. Lett. B 30, 500 (1969).
- Park et al. (2016) J. Park et al. (MINERvA Collaboration), Measurement of Neutrino Flux from Neutrino-Electron Elastic Scattering, Phys. Rev. D 93, 112007 (2016), arXiv:1512.07699 .
- Llewellyn Smith (1972) C. H. Llewellyn Smith, Neutrino Reactions at Accelerator Energies, Phys. Rept. 3, 261 (1972).
- Bradford et al. (2006) R. Bradford, A. Bodek, H. S. Budd, and J. Arrington, A new parameterization of the nucleon elastic form-factors, Nucl. Phys. Proc. Suppl. 159, 127 (2006), arXiv:hep-ex/0602017 .
- Smith and Moniz (1972) R. A. Smith and E. J. Moniz, Neutrino Reactions On Nuclear Targets, Nucl. Phys. B 43, 605 (1972).
- Rein and Sehgal (1981) D. Rein and L. M. Sehgal, Neutrino Excitation of Baryon Resonances and Single Pion Production, Annals Phys. 133, 79 (1981).
- Bodek et al. (2005) A. Bodek, I. Park, and U.-K. Yang, Improved low Q**2 model for neutrino and electron nucleon cross sections in few GeV region, Nucl. Phys. Proc. Suppl. 139, 113 (2005), arXiv:hep-ph/0411202 .
- Yang et al. (2009) T. Yang, C. Andreopoulos, H. Gallagher, K. Hoffmann, and P. Kehayias, A Hadronization Model for Few-GeV Neutrino Interactions, Eur. Phys. J. C 63, 1 (2009), arXiv:0904.4043 .
- Koba et al. (1972) Z. Koba, H. B. Nielsen, and P. Olesen, Scaling of multiplicity distributions in high-energy hadron collisions, Nucl. Phys. B40, 317 (1972).
- Sjostrand et al. (2006) T. Sjostrand, S. Mrenna, and P. Z. Skands, PYTHIA 6.4 Physics and Manual, JHEP 05, 026 (2006), arXiv:hep-ph/0603175 .
- Nieves et al. (2004) J. Nieves, J. E. Amaro, and M. Valverde, Inclusive quasi-elastic neutrino reactions, Phys. Rev. C 70, 055503 (2004), arXiv:nucl-th/0408005 .
- Gran et al. (2013) R. Gran, J. Nieves, F. Sanchez, and M. Vicente Vacas, Neutrino-nucleus quasi-elastic and 2p2h interactions up to 10 GeV, Phys. Rev. D 88, 113007 (2013), arXiv:1307.8105 .
- Gran (2017) R. Gran, Model uncertainties for Valencia RPA effect for MINERvA, (2017), arXiv:1705.02932 .
- Valverde et al. (2006) M. Valverde, J. E. Amaro, and J. Nieves, Theoretical uncertainties on quasielastic charged-current neutrino-nucleus cross sections, Phys. Lett. B 638, 325 (2006), arXiv:hep-ph/0604042 .
- Nieves and Sobczyk (2017) J. Nieves and J. E. Sobczyk, In medium dispersion relation effects in nuclear inclusive reactions at intermediate and low energies, Annals Phys. 383, 455 (2017), arXiv:1701.03628 .
- Meyer et al. (2016) A. S. Meyer, M. Betancourt, R. Gran, and R. J. Hill, Deuterium target data for precision neutrino-nucleus cross sections, Phys. Rev. D 93, 113015 (2016), arXiv:1603.03048 [hep-ph] .
- Rodrigues et al. (2016b) P. A. Rodrigues, C. Wilkinson, and K. S. McFarland, Constraining the GENIE model of neutrino-induced single pion production using reanalyzed bubble chamber data, Eur. Phys. J. C 76, 474 (2016b), arXiv:1601.01888 .
- Wilkinson et al. (2014) C. Wilkinson, P. A. Rodrigues, S. L. Cartwright, L. F. Thompson, and K. S. McFarland, Reanalysis of bubble chamber measurements of muon-neutrino induced single pion production, Phys. Rev. D 90, 112017 (2014), arXiv:1411.4482 .
- Higuera et al. (2014) A. Higuera, A. Mislivec, et al. (MINERvA Collaboration), Measurement of Coherent Production of in Neutrino and Antineutrino Beams on Carbon from of to GeV, Phys. Rev. Lett. 113, 261802 (2014), arXiv:1409.3835 .
- Mislivec et al. (2018) A. Mislivec, A. Higuera, et al. (MINERvA Collaboration), Measurement of total and differential cross sections of neutrino and antineutrino coherent production on carbon, Phys. Rev. D 97, 032014 (2018), arXiv:1711.01178 .
- Berger and Sehgal (2009) C. Berger and L. Sehgal, PCAC and coherent pion production by low energy neutrinos, Phys. Rev. D 79, 053003 (2009), arXiv:0812.2653 .
- Rein and Sehgal (1983) D. Rein and L. M. Sehgal, Coherent pi0 Production in Neutrino Reactions, Nucl. Phys. B 223, 29 (1983).
- Nieves et al. (2011) J. Nieves, I. Ruiz Simo, and M. Vicente Vacas, Inclusive Charged–Current Neutrino–Nucleus Reactions, Phys. Rev. C 83, 045501 (2011), arXiv:1102.2777 .
- Schwehr et al. (2016) J. Schwehr, D. Cherdack, and R. Gran, GENIE implementation of IFIC Valencia model for QE-like 2p2h neutrino-nucleus cross section, (2016), arXiv:1601.02038 .
- (65) P. A. Rodrigues et al. (MINERvA Collaboration), , in preparation .
- Betancourt et al. (2017) M. Betancourt, A. Ghosh, T. Walton, et al. (MINERvA Collaboration), Direct Measurement of Nuclear Dependence of Charged Current Quasielasticlike Neutrino Interactions Using MINERA, Phys. Rev. Lett. 119, 082001 (2017), arXiv:1705.03791 .
- Altinok et al. (2017) O. Altinok, T. Le, et al. (MINERvA Collaboration), Measurement of charged-current single production on hydrocarbon in the few-GeV region using MINERvA, Phys. Rev. D 96, 072003 (2017), arXiv:1708.03723 .
- Patrick et al. (2018) C. E. Patrick et al. (MINERvA Collaboration), Measurement of the muon antineutrino double-differential cross section for quasielastic-like scattering on hydrocarbon at GeV, Phys. Rev. D 97, 052002 (2018), arXiv:1801.01197 .
- Lu et al. (2018) X. G. Lu, M. Betancourt, T. Walton, et al. (MINERvA), Measurement of final-state correlations in neutrino muon-proton mesonless production on hydrocarbon at GeV, Phys. Rev. Lett. 121, 022504 (2018), arXiv:1805.05486 .
- Ruterbories et al. (2019) D. Ruterbories, K. Hurtado, J. Osta, et al. (MINERvA), Measurement of Quasielastic-Like Neutrino Scattering at GeV on a Hydrocarbon Target, Phys. Rev. D 99, 012004 (2019), arXiv:1811.02774 .
- (71) The SAID [http://gwdac.phys.gwu.edu] website provides access to both fits, models and the associated databases.
- Hayato (2002) Y. Hayato, NEUT, Proceedings, 1st International Workshop on Neutrino-nucleus interactions in the few GeV region (NuInt 01): Tsukuba, Japan, December 13-16, 2001, Nucl. Phys. Proc. Suppl. 112, 171 (2002), [,171(2002)].
- Hayato (2009) Y. Hayato, A neutrino interaction simulation program library NEUT, Neutrino interactions: From theory to Monte Carlo simulations. Proceedings, 45th Karpacz Winter School in Theoretical Physics, Ladek-Zdroj, Poland, February 2-11, 2009, Acta Phys. Polon. B 40, 2477 (2009).
- Golan et al. (2012) T. Golan, C. Juszczak, and J. T. Sobczyk, Final State Interactions Effects in Neutrino-Nucleus Interactions, Phys. Rev. C 86, 015505 (2012), arXiv:1202.4197 .
- Stowell et al. (2017) P. Stowell et al., NUISANCE: a neutrino cross-section generator tuning and comparison framework, JINST 12, P01016 (2017), arXiv:1612.07393 .
- Dietrich et al. (2002) F. Dietrich, E. Hartouni, S. Johnson, G. Schmid, R. Soltz, W. Abfalterer, R. Haight, L. Waters, A. Hanson, R. Finlay, and G. Blanpied, Proton reaction cross sections measured in the BNL/AGS E943 experiment, Journal of Nuclear Science and Technology 39, 269 (2002).
- Menet et al. (1971) J. J. H. Menet, E. E. Gross, J. J. Malanify, and A. Zucker, Total-Reaction-Cross-Section Measurements for 30-60-MeV Protons and the Imaginary Optical Potential, Phys. Rev. C 4, 1114 (1971).
- McGill et al. (1974) W. F. McGill, R. F. Carlson, T. H. Short, J. M. Cameron, J. R. Richardson, I. Slaus, W. T. H. Van Oers, J. W. Verba, D. J. Margaziotis, and P. Doherty, Measurements of the proton total reaction cross section for light nuclei between 20 and 48 MeV, Phys. Rev. C 10, 2237 (1974).
- Renberg et al. (1972) P. U. Renberg, D. F. Measday, M. Pepin, P. Schwaller, B. Favier, and C. Richard-Serre, Reaction cross-sections for protons in the energy range 220-570 mev, Nucl. Phys. A 183, 81 (1972).
- Dicello et al. (1967) J. F. Dicello, G. J. Igo, and M. L. Roush, Proton Total Reaction Cross Sections for 22 Isotopes of Ti, Fe, Ni, Cu, Zn, Zr, and Sn at 14.5 MeV, Phys. Rev. 157, 1001 (1967).
- Zanelli et al. (1981) C. I. Zanelli, P. P. Urone, J. L. Romero, F. P. Brady, M. L. Johnson, et al., Total non-elastic cross sections of neutrons on C, O, Ca, and Fe at 40.3 and 50.4 MeV, Phys. Rev. C 23, 1015 (1981).
- MacGregor et al. (1958) M. H. MacGregor, W. P. Ball, and R. Booth, Neutron Nonelastic Cross Sections at 21.0, 25.5, and 29.2 MeV, Phys. Rev. 111, 1155 (1958).
- Bauhoff (1986) W. Bauhoff, Tables of reaction and total cross sections for proton-nucleus scattering below 1 GeV, Atom. Data Nucl. Data Tabl. 35, 429 (1986).
- Ashery et al. (1981) D. Ashery, I. Navon, G. Azuelos, H. Walter, H. Pfeiffer, and F. Schlepütz, True Absorption and Scattering of Pions on Nuclei, Phys. Rev. C 23, 2173 (1981).
- Wilkin et al. (1973) C. Wilkin, C. R. Cox, J. J. Domingo, K. Gabathuler, E. Pedroni, J. Rohlin, P. Schwaller, and N. W. Tanner, A comparison of pi+ and pi- total cross-sections of light nuclei near the 3-3 resonance, Nucl. Phys. B 62, 61 (1973).
- Clough et al. (1974) A. S. Clough et al., Pion-Nucleus Total Cross-Sections from 88-MeV to 860-MeV, Nucl. Phys. B 76, 15 (1974).
- Allardyce et al. (1973) B. Allardyce, C. Batty, D. Baugh, E. Friedman, G. Heymann, et al., Pion reaction cross-sections and nuclear sizes, Nucl. Phys. A 209, 1 (1973).
- Gelderloos et al. (2000) C. J. Gelderloos, J. T. Brack, M. D. Holcomb, M. V. Keilman, D. J. Mercer, R. J. Peterson, R. A. Ristinen, and A. Saunders, Reaction and total cross-sections for 400-MeV 500-MeV pi- on nuclei, Phys. Rev. C 62, 024612 (2000).
- Ibaraki et al. (2002) M. Ibaraki, M. Baba, T. Miura, T. Aqki, T. Hiroishi, H. Nakashima, S.-I. Meigo, and S. Tanaka, Measurement of neutron non-elastic cross sections of C, Si, Fe, Zr and Pb in 40 - 80 MeV region, Journal of Nuclear Science and Technology 39, 405 (2002).
- Schimmerling et al. (1973) W. Schimmerling, T. J. Devlin, W. W. Johnson, K. G. Vosburgh, and R. E. Mischke, Neutron-nucleus total and inelastic cross-sections - 900 to 2600 MeV/c, Phys. Rev. C 7, 248 (1973).
- Voss and Wilson (1956) R. G. P. Voss and R. Wilson, Proc. Roy. Soc. A 236, 41 (1956).
- Abfalterer et al. (2001) W. P. Abfalterer, F. B. Bateman, F. S. Dietrich, R. W. Finlay, R. C. Haight, et al., Measurement of neutron total cross-sections up to 560-MeV, Phys. Rev. C 63, 044608 (2001).
- Bhandari et al. (2019) B. Bhandari et al. (CAPTAIN), First Measurement of the Total Neutron Cross Section on Argon Between 100 and 800 MeV, (2019), arXiv:1903.05276 [hep-ex] .
- Marshall et al. (2016) C. M. Marshall et al. (MINERvA Collaboration), Measurement of production in charged-current interactions, Phys. Rev. D 94, 012002 (2016), arXiv:1604.03920 .
- Fields et al. (2013) L. Fields, J. Chvojka, et al. (MINERvA Collaboration), Measurement of Muon Antineutrino Quasi-Elastic Scattering on a Hydrocarbon Target at 3.5 GeV, Phys. Rev. Lett. 111, 022501 (2013), arXiv:1305.2234 .
- Fiorentini et al. (2013) G. Fiorentini, D. Schmitz, P. Rodrigues, et al. (MINERvA Collaboration), Measurement of Muon Neutrino Quasi-Elastic Scattering on a Hydrocarbon Target at 3.5 GeV, Phys. Rev. Lett. 111, 022502 (2013), arXiv:1305.2243 .
- Le et al. (2015) T. Le, J. Palomino, et al. (MINERvA Collaboration), Single Neutral Pion Production by Charged-Current Interactions on Hydrocarbon at 3.6 GeV, Phys. Lett. B 749, 130 (2015), arXiv:1503.02107 .
- Wiegand et al. (1962) C. E. Wiegand, T. Elioff, W. B. Johnson, L. B. Auerbach, J. Lach, and T. Ypsilantis, Detection efficiency of plastic scintillator for neutron energies 4 to 76 MeV, Review of Scientific Instruments 33, 526 (1962), https://doi.org/10.1063/1.1717908 .
- Cecil et al. (1979) R. A. Cecil, B. D. Anderson, and R. Madey, Improved Predictions of Neutron Detection Efficiency for Hydrocarbon Scintillators from 1-MeV to About 300-MeV, Nucl. Instrum. Meth. 161, 439 (1979).
- Birks (1951) J. B. Birks, Scintillations from organic crystals: Specific flourescence and relative response to different radiations, Proc. Phys. Soc. A 64, 874 (1951).
- Birks (1964) J. B. Birks, The Theory and Practice of Scintillation Counting, The Theory and Practice of Scintillation Counting, International Series of Monographs on Physics (1964), https://doi.org/10.1016/C2013-0-01791-4.
- von Krosigk et al. (2013) B. von Krosigk, L. Neumann, R. Nolte, S. Rottger, and K. Zuber, Measurement of the proton light response of various lab based scintillators and its implication for supernova neutrino detection via neutrino-proton scattering, Eur. Phys. J. C 73, 2390 (2013), arXiv:1301.6403 .
- von Krosigk et al. (2016) B. von Krosigk et al., Measurement of -particle quenching in LAB based scintillator in independent small-scale experiments, Eur. Phys. J. C 76, 109 (2016), arXiv:1510.00458 .
- Adamson et al. (2015) P. Adamson et al. (MINOS Collaboration), Study of quasielastic scattering using charged-current -iron interactions in the MINOS Near Detector, Phys. Rev. D 91, 012005 (2015), arXiv:1410.8613 .
- Abe et al. (2018) K. Abe et al. (T2K), Characterization of nuclear effects in muon-neutrino scattering on hydrocarbon with a measurement of final-state kinematics and correlations in charged-current pionless interactions at T2K, Phys. Rev. D 98, 032003 (2018), arXiv:1802.05078 .
- Subedi et al. (2008) R. Subedi, R. Shneor, P. Monaghan, B. D. Anderson, K. Aniol, et al., Probing Cold Dense Nuclear Matter, Science 320, 1476 (2008), arXiv:0908.1514 .
- Acciarri et al. (2014) R. Acciarri et al. (ArgoNeuT Collaboration), Detection of back-to-back proton pairs in charged-current neutrino interactions with the ArgoNeuT detector in the NuMI low energy beam line, Phys. Rev. D 90, 012008 (2014), arXiv:1405.4261 .
- Partyka (2015) K. Partyka (ArgoNeuT Collaboration), Exclusive +Np topologies with ArgoNeuT, Proceedings, 8th International Workshop on Neutrino-Nucleus Interactions in the Few GeV Region (NuInt 12): Rio de Janeiro, Brazil, October 22-27, 2012, AIP Conf. Proc. 1663, 080007 (2015).
- Palamara (2016) O. Palamara (ArgoNeuT Collaboration), Exclusive Muon Neutrino Charged Current Pion-less Topologies. ArgoNeuT Results and Future Prospects in LAr TPC Detectors, Proceedings, 10th International Workshop on Neutrino-Nucleus Interactions in the Few GeV Region (NuInt15): Osaka, Japan, November 16-21, 2015, JPS Conf. Proc. 12, 010017 (2016).
- Adams et al. (2019) C. Adams et al. (MicroBooNE), Comparison of -Ar multiplicity distributions observed by MicroBooNE to GENIE model predictions, Eur. Phys. J. C79, 248 (2019), arXiv:1805.06887 [hep-ex] .