∎
muCool: A novel low-energy muon beam for future precision experiments
Abstract
Experiments with muons () and muonium atoms () offer several promising possibilities for testing fundamental symmetries. Examples of such experiments include search for muon electric dipole moment, measurement of muon and experiments with muonium from laser spectroscopy to gravity experiments. These experiments require high quality muon beams with small transverse size and high intensity at low energy.
At the Paul Scherrer Institute, Switzerland, we are developing a novel device that reduces the phase space of a standard beam by a factor of with efficiency. The phase space compression is achieved by stopping a standard beam in a cryogenic helium gas. The stopped are manipulated into a small spot with complex electric and magnetic fields in combination with gas density gradients. From here, the muons are extracted into the vacuum and into a field-free region. Various aspects of this compression scheme have been demonstrated. In this article the current status will be reported.
1 Introduction
Muon beams have important applications in particle and solid state physics Nagamine2003a . In solid state physics muon beams are used to study magnetic properties of materials using technique called muon spin rotation () Reotier1997 . In particle physics, experiments with muons allow us to perform fundamental physics research, e.g. testing electroweak interaction and searching for physics beyond the Standard Model KlausP.Jungmann2002a . Such experiments include measurements of the anomalous muon magnetic moment Bennett2004a or searches for the muon electric dipole moment Bennett2009 and charged lepton flavor violation in forbidden muon decays Adam2010 ; Berger2014 .
Furthermore, the experiments with muonium atoms ( bound system) open possibilities for high precision spectroscopy measurements Jungmann2006 . The unique feature of the muonium atom is that hadronic (finite-size) effects are absent since it consists of only two leptons. This allows precise tests of the bound-state QED and measurements of fundamental constants, e.g. muon mass, muon magnetic moment and fine structure constant Cr . The muonium atom can also be used to search for CPT-invariance violation and muonium-antimuonium conversion, which violates lepton number conservation. The measurement of the gravitational acceleration of antimatter could also be achievable with muonium Kirch2014 ; Kaplan2018 .
All these experiments could benefit from better quality (higher intensity, small phase space) muon beam at low energy (eV-MeV) KlausP.Jungmann2002a ; Nagamine2014 . Furthermore, better quality muon beams would lead to better quality muonium beams.
At the Paul Scherrer Institute we are developing a device that transforms standard beam into a low-energy brilliant beam Taqqu2006 . The working principle of this device is explained in the next section.
2 Working principle of the proposed compression scheme
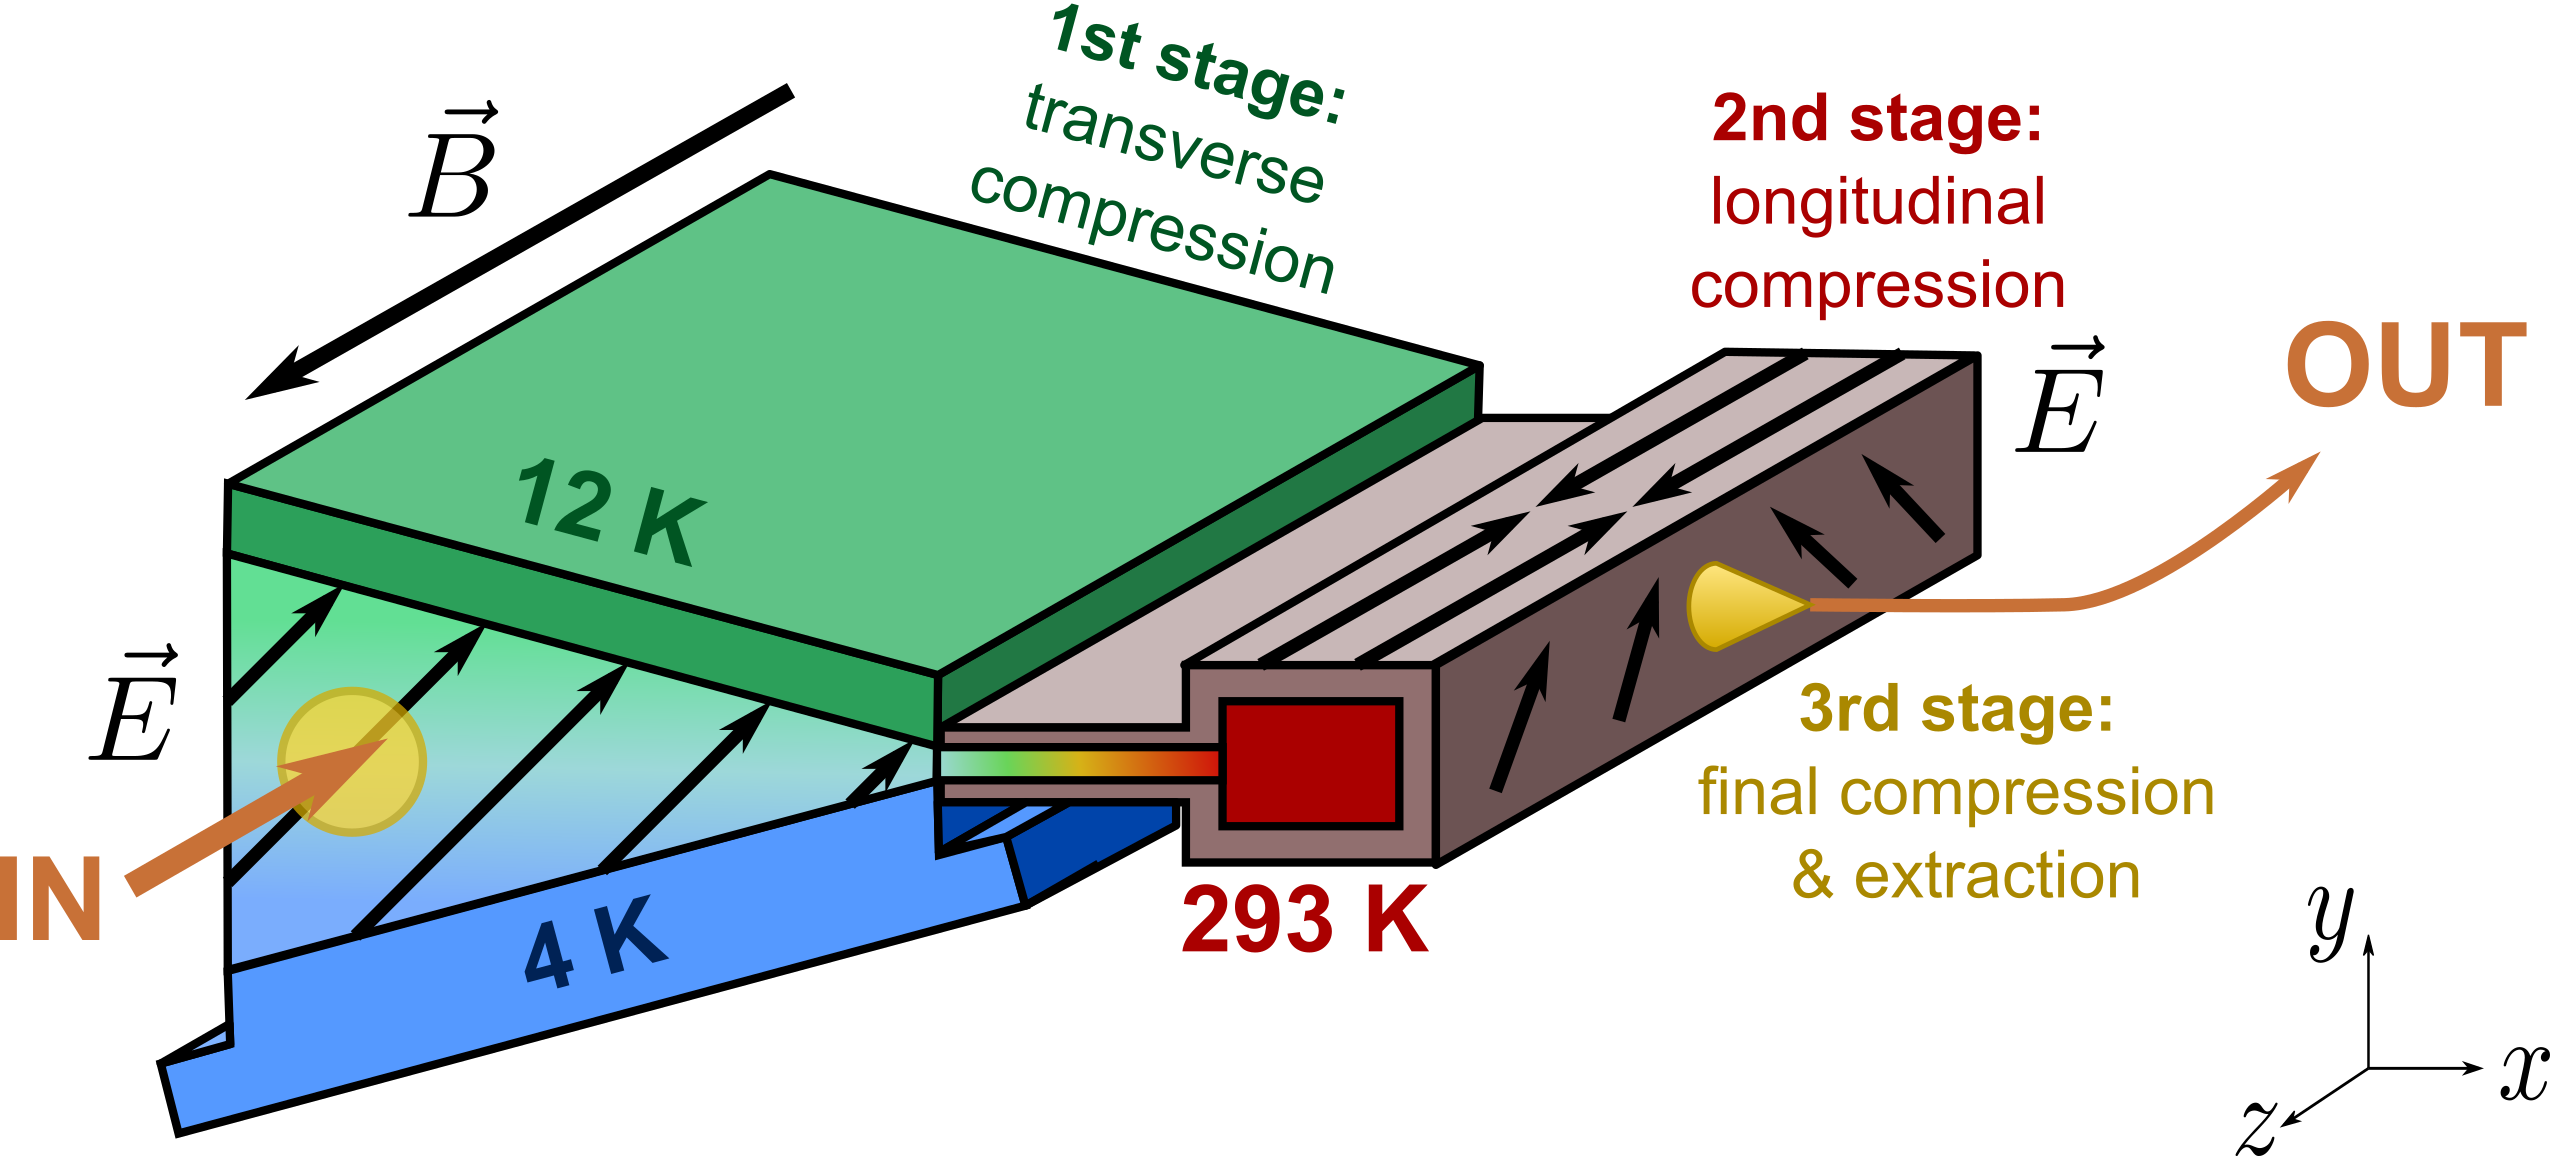
In the proposed scheme a standard beam is stopped in a helium gas target consisting of three stages (see Fig. 1). Compression in all stages is achieved by manipulating stopped muons with complex electric and magnetic fields in combination with gas density gradients.

1st stage: transverse compression
In the first stage, the standard beam is stopped in a cryogenic helium gas target at few mbar pressure, placed in a magnetic field of T pointing in the -direction. An electric field with is applied perpendicular to the magnetic field.
In vacuum, applying such crossed electric and magnetic fields would cause muons to drift in direction, performing cycloid motion characterized with the cyclotron frequency . However, the presence of the He gas leads to -He collisions that modify the muon motion. The deviation from the direction (averaged over many collisions) will be proportional to the collision frequency between muons and He atoms, as described by the following equation Heylen1980 :
| (1) |
where is angle of the muon drift velocity relative to the direction. Thus, we can manipulate the muon drift direction by changing the collision frequency .
The collision frequency can be made position dependent by having different gas densities in different regions of our setup. In the transverse compression target this is achieved by keeping the upper wall of the target at K and the lower at K which creates a temperature gradient and therefore also density gradient in the -direction Wichmann2016a .
In the middle of the target (at , see Fig. 2 (left)), the gas density is chosen such that . According to the Eq. (1), at this condition the muons drift at angle with respect to direction, which in our case corresponds to the direction (see gray trajectory in Fig. 2 (left)).
In the top part of the target, the gas density is lower, which means that and muons move essentially in the direction. With our field configuration, this corresponds to muons moving -direction while drifting in the direction (red trajectory in Fig. 2 (left)).
In the lower part of the cell, at larger gas densities, , the muons drift mostly in electric field direction, i.e in and directions (blue trajectory in Fig. 2 (left)). The result is transverse (in -direction) compression of the muon beam.
The GEANT4 simulation of the muon trajectories under such conditions is shown in Fig. 2 (right). Muons start at around mm with about 10 mm spread in the -direction and drift in -direction while simultaneously compressing in the -direction. At mm, the muon spread in -direction is reduced to about 1 mm.

2nd stage: longitudinal compression

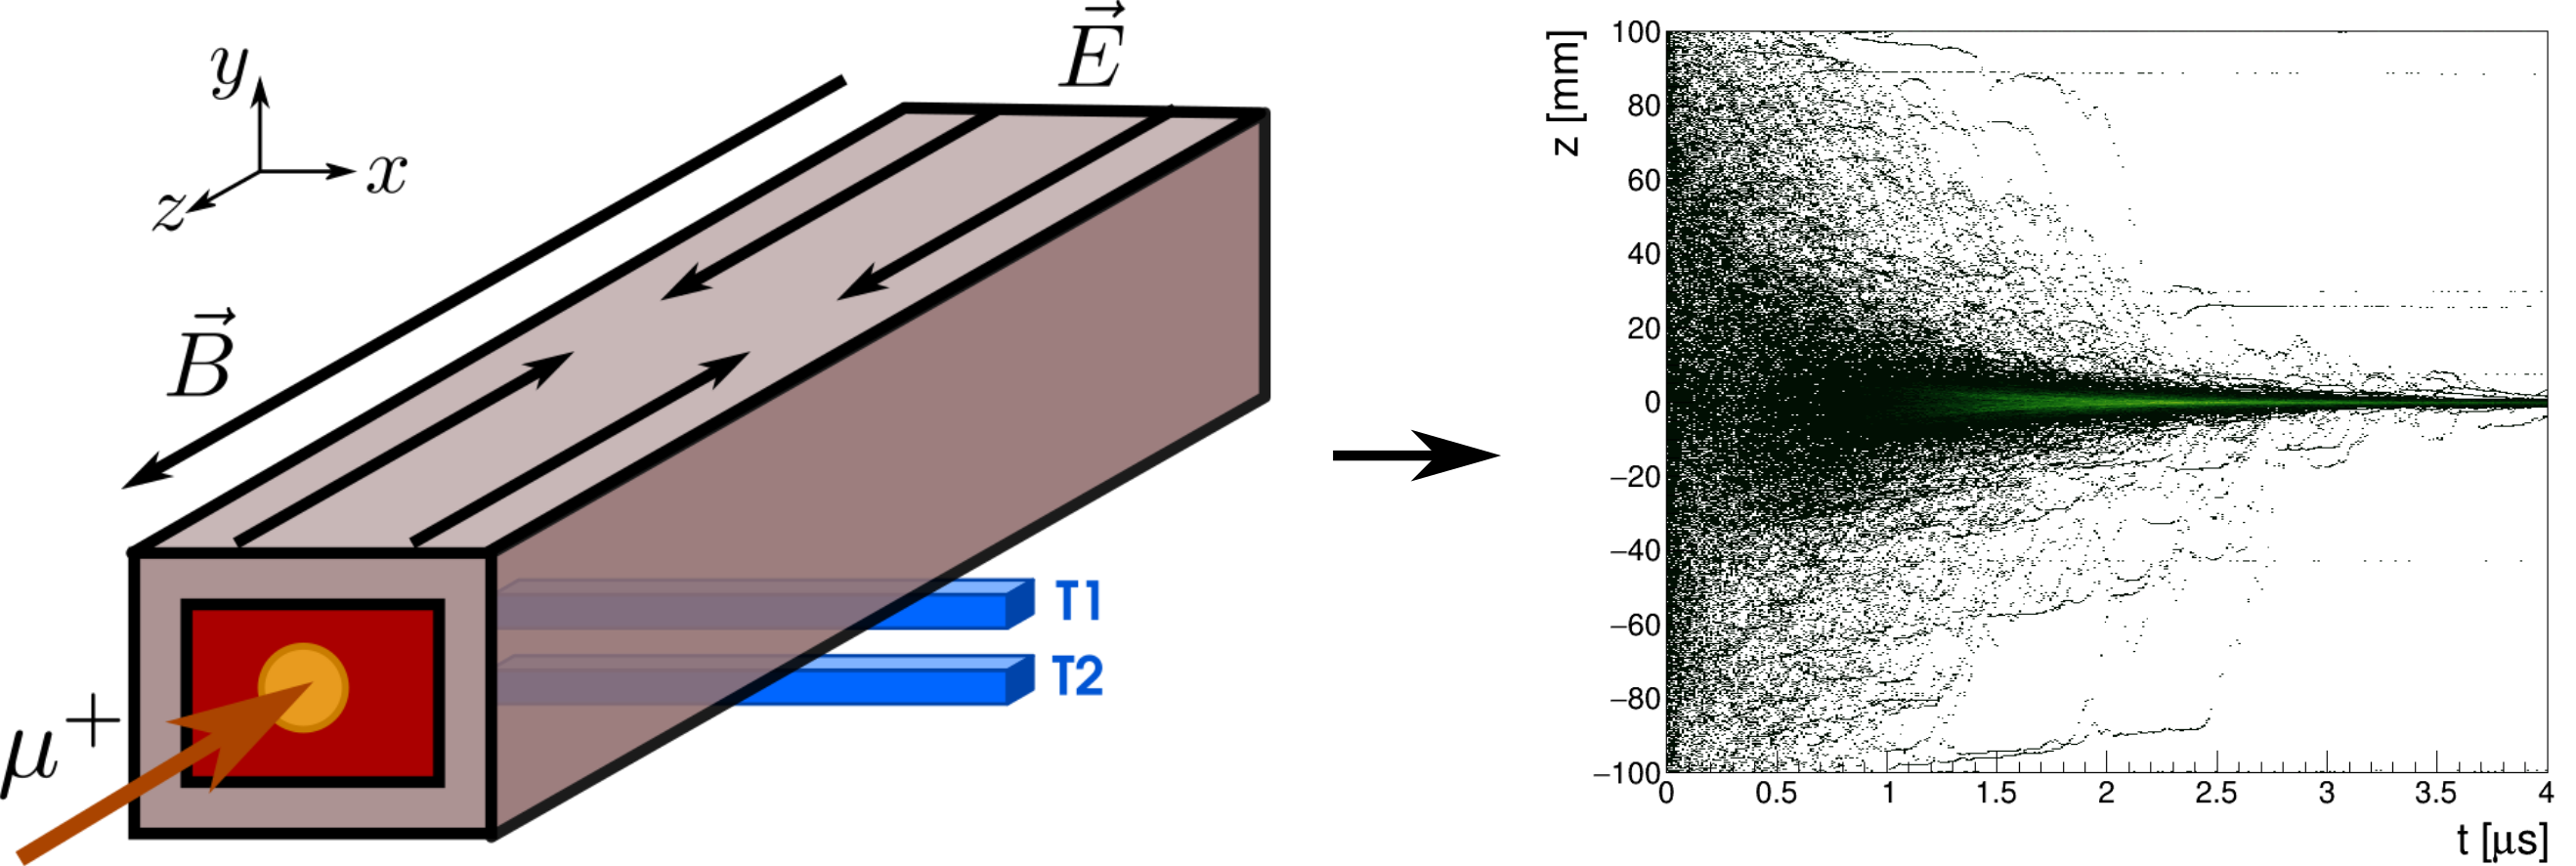
After the transverse compression stage, muons enter the second compression stage, which is at room temperature. The electric field now has a component parallel to the magnetic field and points towards the center of the target, which causes a muon drift into the center of the target, giving rise to the longitudinal (in -direction) compression of the muon beam (see Fig. 3).
Additionally, there is a component of the electric field perpendicular to the magnetic field, in direction. Therefore, muons also drift in direction, which in this case points in direction, towards the final compression stage and extraction into the vacuum.
3 Transverse compression demonstration
To demonstrate transverse compression a 13 MeV/c muon beam was injected into the transverse target (as schematically shown in Fig. 2 (left)). The measurements were performed at the E1 beam line at the Paul Scherrer Institute. This beam line provides about /s at 13 MeV/c. Before entering the transverse target muons had to pass through a 55 thick entrance detector in front of the target, giving the initial time .
Several detectors were mounted around the target, as sketched in Fig. 2 (right), to monitor the motion of the muons by detecting a positron from the muon decay. The detectors consisted of plastic scintillators in which a wavelength shifting fiber was glued. The wavelength shifting fibers transport the scintillating light from the cold to room temperature where the light is read-out by silicon photomultiplier (SiPM). Different detectors are sensitive to different regions of the transverse target (close to the detector). By recording the time difference between the positron hit in various detectors and the entrance detector, time-spectra that carry the information about the muon motion are obtained.
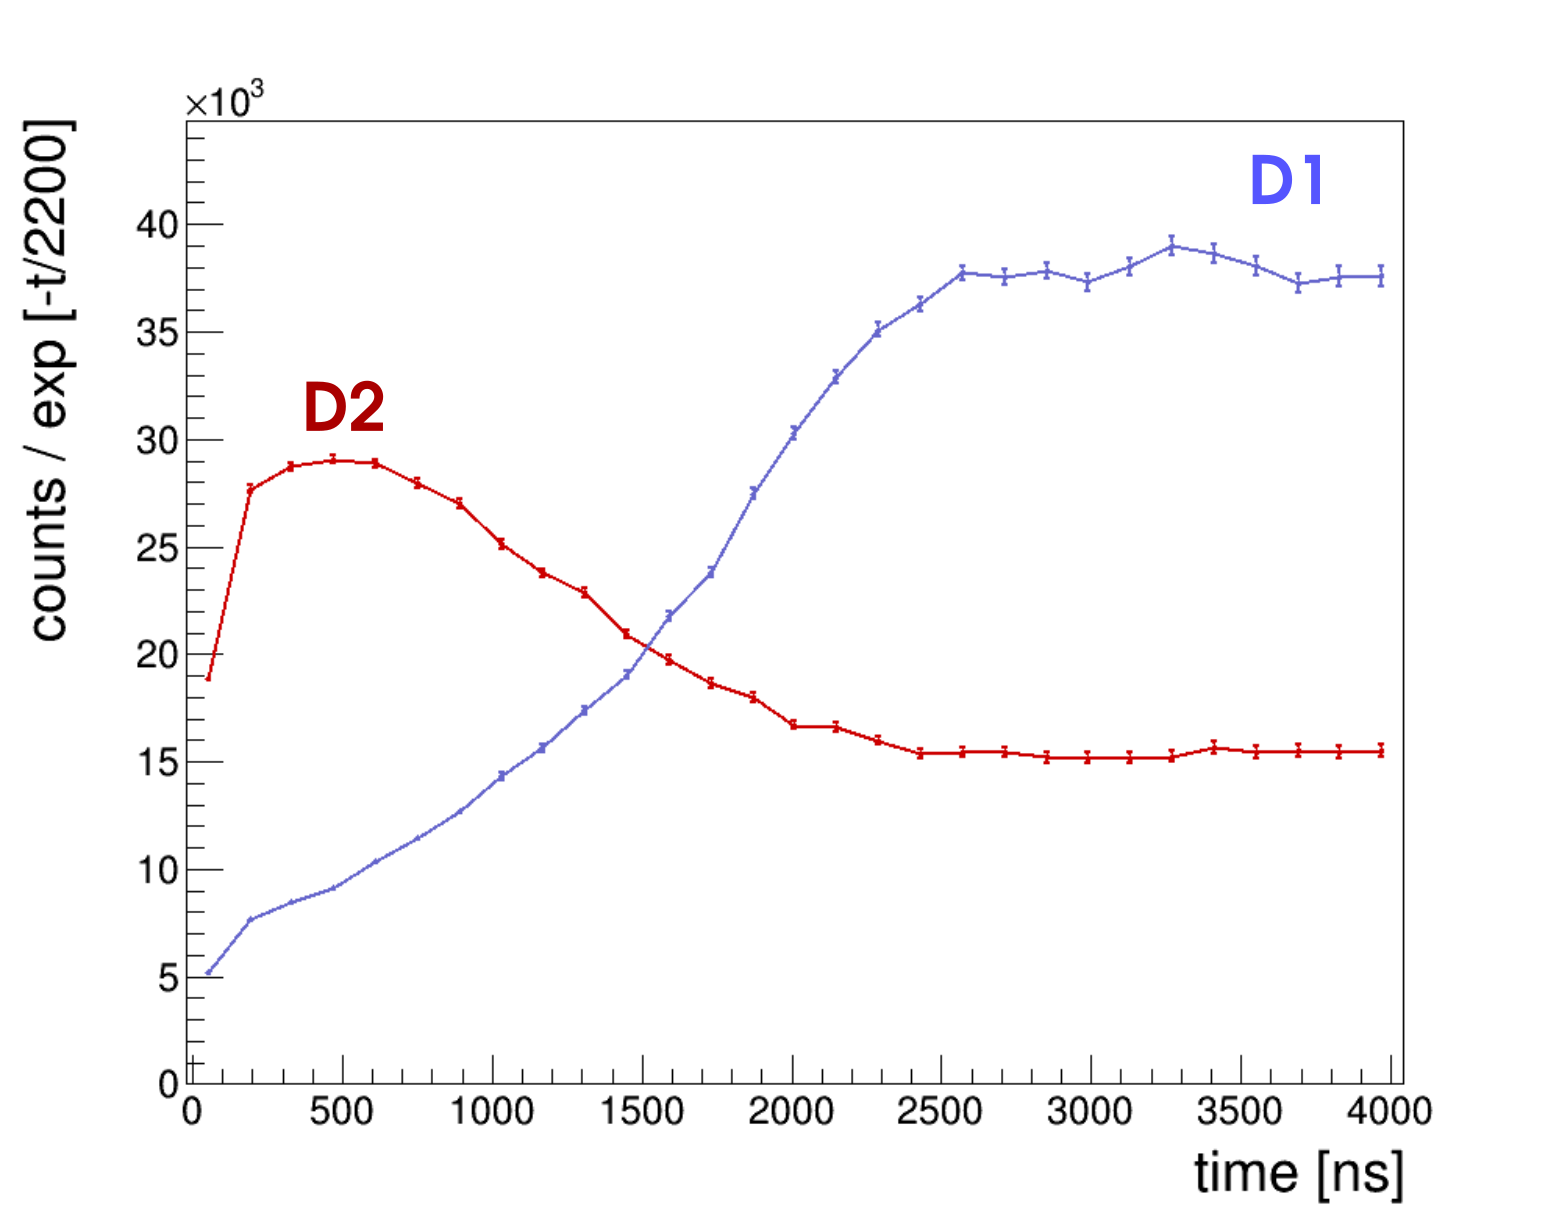
Two measured time-spectra are presented in Fig. 4 . The number of counts in each detector was corrected for the muon decay by multiplying the counts with . The number of counts in D1 (blue curve) increases with the time until about 2500 ns. This indicates that the muons were gradually moving closer to the detector acceptance region, i.e. closer to the tip of the target. After about 2500 ns the number of counts does not change with the time, which tells us that the muons were not moving anymore. On the other hand, the number of counts in the D2 detector (red curve) first rises and then decreases with time, which tells us that the muons first entered and then exited the acceptance region of the detector (they ”flew by” the detector). These measured time-spectra are consistent with the simulated muon trajectories of Fig. 2 (right).

4 Longitudinal compression demonstration
Test of the longitudinal compression was done by injecting a 11 MeV/c muon beam into a target containing 5 mbar of He gas at room temperature, as sketched in the Fig. 3 (left). The measurements were again performed at E1 beam line at Paul Scherrer Institute. Similar as before, the initial time was produced by muon passing the 55 thick entrance detector in front of the target.
The longitudinal compression target with dimensions was lined with metallic electrodes that created a V-shaped electric potential with a minimum at the center of the target cell at . Such potential caused the muons to move along the -direction towards the potential minimum, as shown in the Fig. 3 (right).
The muon motion was monitored with the two telescope detectors T1 & T2 in coincidence that were placed at , below the target, as shown in Fig. 3 (left). Massive brass shielding all around the target ensured that coincidence hits in T1 & T2 originated only from muons decaying within a small region close to the center of the target, between about . From the time difference between the positron hit in T1 & T2 in coincidence and the entrance detector, a time-spectrum is obtained.

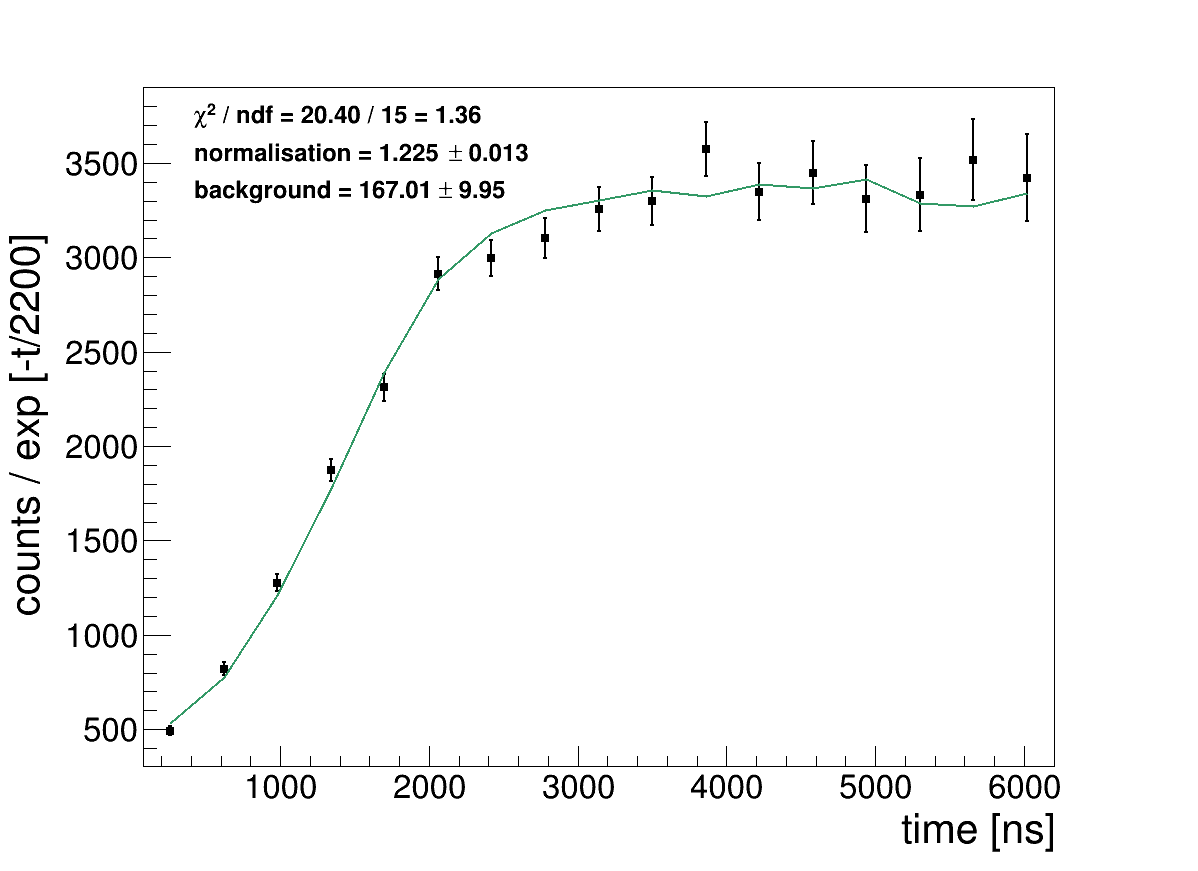
Figure 5 shows measured and simulated time-spectra when -500 V are applied in the center of the target cell. The measured number of counts (black points) increases with time which means that muons were moving closer to the acceptance region of T1 & T2, corresponding to the center of the target. Thus, the 200 mm long muon swarm has been shrunk to below 6 mm length in -direction within 4000 ns. For more details see Bao2014 ; Antognini2018 .
The simulated time-spectrum (green line) was fitted to the data assuming two free parameters: normalization, to account for stopping and detection efficiency uncertainties, and flat background, to account for possible misalignment between the target and magnetic field axis. Measured time-spectra are in good agreement with the simulated time-spectra with reduced chi-square of 1.36 for 15 degrees of freedom.
5 Conclusions
Several stages of the muon phase space compression beam line that we are developing at Paul Scherrer Institute have been tested. The muon transverse and longitudinal compression have been demonstrated independently. The measurements are consistent with GEANT4 simulations. The efficiencies assumed in the proposal Taqqu2006 have been confirmed by measurements for both stages. The merging of these two stages and the extraction of the muon beam into vacuum are currently under development and will be tested in the near future.
Acknowledgements.
This work was supported by the SNF grants No. 200020_159754 and 200020_172639.References
- (1) K. Nagamine, Introductory muon science (Cambridge University Press, 2003)
- (2) P.D. de Réotier, A. Yaouanc, J. Phys. Condens. Matter 9(43), 9113 (1997)
- (3) K.P. Jungmann, Nucl. Phys. News 12(3), 23 (2002)
- (4) G.W. Bennett, B. Bousquet, et al., Phys. Rev. Lett. 92(16), 161802 (2004)
- (5) G.W. Bennett, B. Bousquet, et al., Phys. Rev. D 80(5), 052008 (2009)
- (6) J. Adam, X. Bai, et al., Nucl. Phys. B 834(1-2), 1 (2010)
- (7) N. Berger, et al., Nucl. Phys. B - Proc. Suppl. 248-250, 35 (2014)
- (8) K.P. Jungmann, Nucl. Phys. B-Proceedings Suppl. 155, 355 (2006)
- (9) P. Crivelli, Hyperfine Interact. 239(1), 49 (2018)
- (10) K. Kirch, K.S. Khaw, Int. J. Mod. Phys. Conf. Ser. 30(1460258) (2014)
- (11) D. Kaplan, A. Antognini, et al., Atoms 6(2), 17 (2018)
- (12) K. Nagamine, JPS Conf. Proc. 2, 1 (2014)
- (13) D. Taqqu, Phys. Rev. Lett. 97, 10 (2006)
- (14) A.E.D. Heylen, IEE Proc. A 127(4), 221 (1980)
- (15) G. Wichmann, A. Antognini, et al., Nucl. Instruments Methods Phys. Res. Sect. A Accel. Spectrometers, Detect. Assoc. Equip. 814, 33 (2016)
- (16) Y. Bao, A. Antognini, et al., Phys. Rev. Lett. 224801, 1 (2014)
- (17) I. Belosevic, A. Antognini, et al., arXiv e-prints arXiv:1811.08332 (2018)