Characterizing circumgalactic gas around massive ellipticals at III. The galactic environment of a chemically-pristine Lyman limit absorber
Abstract
This paper presents a study of the galactic environment of a chemically-pristine (% solar metallicity) Lyman Limit system (LLS) discovered along the sightline toward QSO SDSSJ 135726.27043541.4 () at projected distance physical kpc (pkpc) from a luminous red galaxy (LRG) at . Combining deep Hubble Space Telescope images, MUSE integral field spectroscopic data, and wide-field redshift survey data has enabled an unprecedented, ultra-deep view of the environment around this LRG-LLS pair. A total of 12 galaxies, including the LRG, are found at pkpc and line-of-sight velocity km s-1 of the LLS, with intrinsic luminosity ranging from to and a corresponding stellar mass range of . All 12 galaxies contribute to a total mass of with % contained in the LRG. The line-of-sight velocity dispersion of these galaxies is found to be km s-1 with the center of mass at pkpc and line-of-sight velocity offset of km s-1 from the LLS. Three of these are located at pkpc from the LLS, and they are all faint with intrinsic luminosity and gas phase metallicity of % solar in their interstellar medium. The disparity in the chemical enrichment level between the LLS and the group members suggests that the LLS originates in infalling intergalactic medium and that parts of the intergalactic gas near old and massive galaxies can still remain chemically pristine through the not too distant past.
keywords:
haloes – galaxies: elliptical and lenticular, cD – quasars: absorption lines – intergalactic medium – galaxies: formation1 Introduction
Luminous red galaxies (LRGs) are selected based on their photometric and spectroscopic properties that resemble nearby elliptical galaxies (e.g., Eisenstein et al. 2001). These galaxies comprise primarily old stars with little/no on-going star formation (e.g., Roseboom et al. 2006; Gauthier & Chen 2011) and represent more than 90% of massive galaxies with stellar mass (e.g., Peng et al. 2010; Tinker et al. 2013) with a corresponding dark matter halo mass of (Blake et al. 2008). Therefore, they offer an ideal laboratory for studying feeding and feedback in massive halos that are generally free of complex starburst driven winds (see Chen 2017 for a recent review).
Motivated by previous studies that reported abundant chemically-enriched cool gas in LRG halos (e.g., Gauthier et al. 2009, 2010, Lundgren et al. 2009; Gauthier & Chen 2011; Bowen & Chelouche 2011; Zhu et al. 2014; Huang et al. 2016), we are carrying out a UV absorption-line survey to study the circumgalactic medium (CGM) around 16 LRGs using the Cosmic Origins Spectrograph (COS) on board the Hubble Space Telescope (HST) (Chen et al. 2018; hereafter Paper I). The LRGs in this COS-LRG sample were selected uniformly with stellar mass and no prior knowledge of the presence/absence of any absorption features. The program was designed to enable accurate measurements of the neutral hydrogen column density based on observations of the full Lyman series. This COS-LRG sample therefore allows a systematic study of the ionization state and chemical enrichment of the CGM in massive quiescent halos.
The main findings from our initial analysis presented in Paper I can be summarized as follows. First, high- gas is common in these massive quiescent halos with a median of at projected distances physical kpc (pkpc). For all but three LRGs the associated Lyman absorption series is detected. The mean covering fraction of optically-thick absorbers with is found to be at pkpc and at pkpc. Secondly, the gas has been enriched with heavy elements with C III and Si III absorption lines being the most dominant features. The observed high covering fraction of C III absorbing gas in LRG halos is statistically consistent with what is seen in COS-Halos blue galaxies. The “bimodality” observed in O VI-absorbing gas between star-forming and quiescent galaxies (e.g., Chen & Mulchaey 2009; Tumlinson et al. 2011) is not seen in these intermediate ions. Finally, while the line-of-sight velocity separations between the H I absorbing gas and LRGs are characterized by a mean and dispersion of km s-1 and km s-1, eight of the 13 LRG halos with detected absorption features were resolved into multiple components with velocities separated by as much as km s-1.
In a follow-up study, Zahedy et al. (2018; hereafter Paper II) performed a detailed component by component analysis that simultaneously incorporated multiple ionic transitions for constraining the density, , and metallicity, [M/H], of the CGM in LRG halos based on comparisons with a grid of Cloudy (Ferland et al. 2013; v13.03) ionization models. An interesting finding of Paper II is that the derived gas metallicities of individual components can vary by more than an order of magnitude in a single LRG halo, from solar to solar or super solar irrespective of the adopted ionizing spectrum. This applies to gas both at pkpc and beyond. In addition, solar-metallicity gas is observed out to pkpc in half of the COS-LRG sample, while metal-poor gas of metallicity solar is also found in at least three cases. Similarly, the inferred gas densities vary by two orders of magnitude between individual components in a single halo, from to , while the mean gas density averaged over all components is for the majority of LRG halos at pkpc.
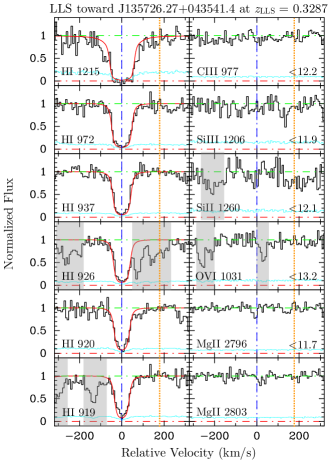
In one particular LRG halo, SDSSJ 135727.27043603.3 at , we detected a strong absorber of 111The error quoted above represents only statistical uncertainties. Systematic uncertainties due to continuum placement errors are not included. For comparison, Lehner et al. (2018) reports for this system., a Lyman limit system (LLS), at pkpc and which yields a line-of-sight velocity offset of km s-1. This LLS is characterized by a single component of Doppler parameter km s-1 and no associated metal ion features down to sensitive column density limits (Figure 1). The observed simple absorption profiles of the hydrogen lines place a strong constraint on the gas temperature at K. A 95% upper limit to the gas metallicity of [M/H] was obtained for the LLS based on the non-detections of any metal transitions and a size limit of kpc for the absorber (Paper II). The low metallicity limit is also confirmed by Lehner et al. (2018), who report for this absorber. Not only is the observed metal content significantly lower than the typical solar metallicity found in nearby elliptical galaxies (e.g., Mathews & Brighenti 2003) or the near-solar metallicity of the interstellar medium (ISM) of an intermediate-redshift elliptical (Zahedy et al. 2017), it is also among the most metal-poor LLSs found at (e.g., Ribaudo et al. 2011; Lehner et al. 2018). The observed chemically-pristine gas near a massive quiescent galaxy strongly suggests that the LLS originates in infalling gas clouds from the intergalactic medium (IGM).
Here we present deep wide-field integral field spectroscopic data from the MUSE-QuBES program (PI: Schaye; see also Segers et al. 2018 & Straka et al. 2018, in preparation), wide-field multi-object spectroscopic data obtained using the Low Dispersion Survey Spectrograph 3 (LDSS3) on the Magellan Clay Telescope, and exquisite Hubble Space Telescope (HST) imaging data (PI: Straka) of the field. These imaging and spectroscopic data together provide a high-definition view of the galaxy environment around the chemically-pristine LLS and the LRG at , and offer valuable insights into the origin of chemically-pristine gas observed near a massive, quiescent galaxy. The paper is organized as follows. In Section 2, we describe the imaging and spectroscopic observations, and the construction of photometric and spectroscopic catalogs of faint galaxies in the field. In Section 3, we present properties of all galaxies identified in the vicinity of the chemically-pristine LLS at . In Section 4, we discuss the implications of our findings. Throughout the paper, we adopt for the solar oxygen abundance (Asplund et al. 2009), and a standard cosmology, = 0.3 and =0.7 with a Hubble constant .
2 Observations and Data Analysis
To carry out a deep galaxy survey around the LRG and the associated chemically-pristine LLS at , we have assembled deep imaging and spectroscopic data both from our own observations and from the public archives. Here we describe the observations and data analysis.
2.1 Imaging observations and the object catalog
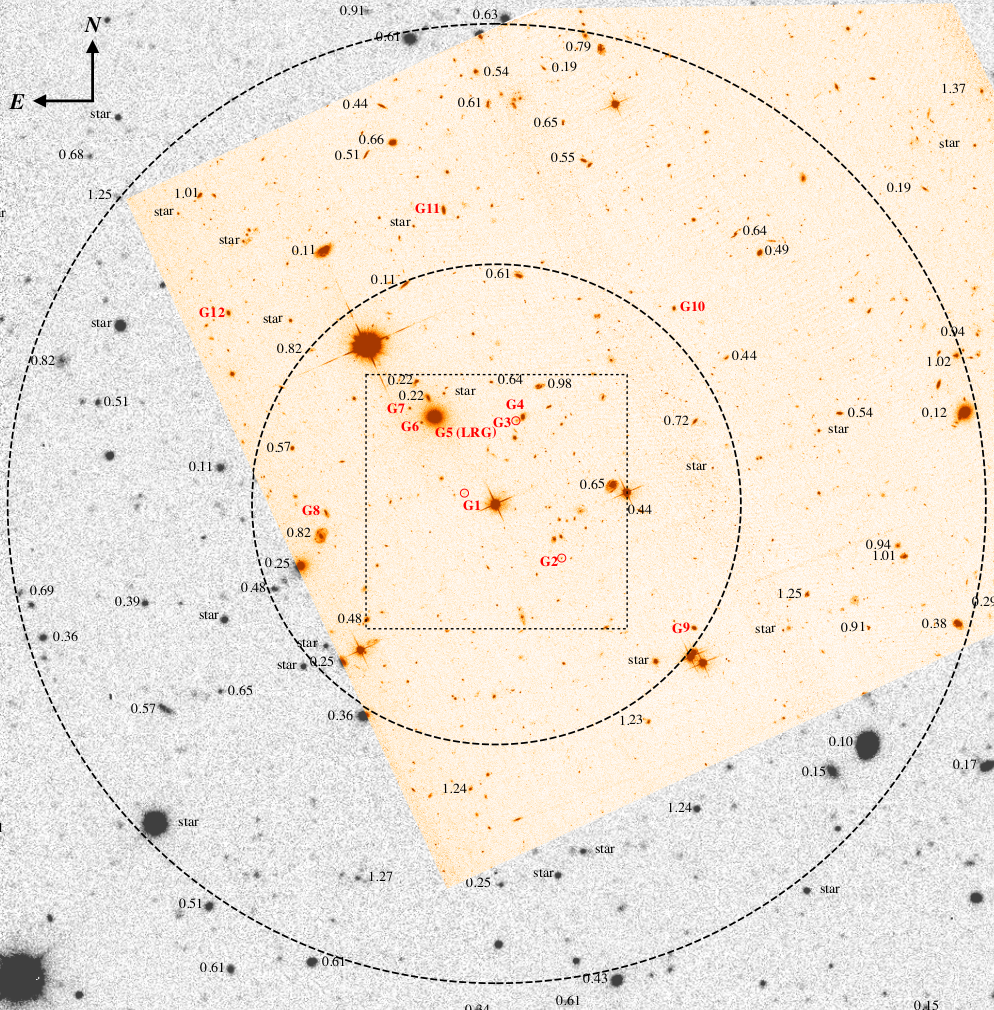
The field around QSO, SDSSJ 135726.27043541.4, at is covered by the public DECam Legacy Survey (DECaLS; PI: Schlegel and Dey; http://legacysurvey.org/decamls/; see also Dey et al. 2018), which images equatorial fields in the -, -, and -bands. Between five and eight individual exposures in each of the -, -, and -bands were obtained for this field, reaching 5- imaging depths of , and mag for extended sources. Coadded -, -, and -band images of the field and the associated object catalog were retrieved from the DECaLS data release 5 website. The mean seeing conditions in the coadded images are characterized by a full-width-at-half-maximum (FWHM) for point sources of , , and in the -, -, and -band, respectively. The available -, -, and -band photometric measurements provide constraints for the broad-band spectral energy distributions of relatively bright objects. The stacked -band image is presented in Figure 2.
We have also obtained high-quality Hubble Space Telescope (HST) images of the field using the Wide Field Channel (WFC) in the Advanced Camera for Surveys (ACS) and the F814W filter (PID14660; PI: Straka). The observations were carried out on 2017 July 5 UT. Four exposures of 543 s each were obtained and processed using the standard HST reduction pipeline. Individual frames were corrected for geometric distortion using drizzle, registered to a common origin, filtered for deviant pixels, and combined to form a final stacked image. The final stacked F814W image covers a region of roughly and reaches a 5- limiting magnitude of over a -diameter aperture, significantly deeper than the public -, -, and -band images from DECaLS. The F814W image replaces the DECaLS -band image in Figure 2 in the overlapping region. In addition to resolving galaxy morphologies, the HST ACS/F814W image uncovers more than twice as many faint galaxies as found in the DECaLS images.
While the greater depth and higher spatial resolution of the HST/ACS F814W image make the F814W an ideal choice for detections of faint galaxies, the available DECaLS data provide a wider field coverage for studying the large-scale environment. To construct the object catalog, we first adopted the public photometric catalog from DECaLS. For the area that is also covered by the HST/ACS F814W image, we performed source detections in the F814W image using the SExtractor program (Bertin &Arnouts 1996) and identified additional faint objects with mag. We then combined the DECaLS and F814W catalogs to form a master catalog by matching object coordinates. Nearly all objects with mag have an entry in the DECaLS catalog. For objects that are not detected in the DECaLS images, the 5- limiting magnitudes computed for extended sources in this region by the DECaLS team are adopted (see e.g., Dey et al. 2018).
2.2 MUSE integral field spectroscopic observations
Wide-field integral field spectroscopic data of the QSO field have been obtained using the Multi-Unit Spectroscopic Explorer (MUSE; Bacon et al. 2010), as part of the MUSE Quasar-field Blind Emitter Survey (MUSE-QuBES; PI: Schaye). MUSE observes a field of at a pixel scale of and a spectral resolution of km s-1 at 7000 Å. It enables a deep search of faint galaxies within 140 pkpc in projected distance of the QSO sightline at . The observations were carried out in May of 2015, in blocks of one hour each for a total of two hours. Each observing block was split into four exposures of 900 s each. Small dithers of a few arcseconds in the telescope pointing and offsets in the position angle in steps of 90 degrees were applied between exposures to smooth out the tiling pattern in the combined data cube. Individual exposures were first reduced using the standard MUSE data reduction pipeline (v1.2; Weibacher et al. 2012) and further processed using the CubExtractor package (Cantalupo et al., in prep; see also Borisova et al. 2016; Marino et al. 2018), which include bias subtraction, flat-fielding, illumination correction, and wavelength and flux calibrations. (see Segers et al. 2018 for a detailed description).
Within the MUSE field of view, we identified 110 objects of mag, of which 47 are identified in the DECaLS photometric catalog. All but one of the remaining 63 objects are faint with mag and do not have an entry in the DECaLS catalog. The only exception is J135727.50043601.98 (G6 in Figures 2 & 3) with mag, which occurs at from the LRG (G5) with mag and mag. The close proximity to a bright galaxy may have made object deblending challenging in ground-based images. As discussed below, the MUSE spectrum of this galaxy exhibits absorption features that are consistent with a passive galaxy at , similar to the LRG but nearly four magnitudes fainter. We therefore estimated the -, -, and -band magnitudes of this faint satellite based on the observed brightness of the LRG in these bandpasses.
For every object detected in the F814W image, we extracted a mean spectrum and the associated error spectrum over a circular aperture centered at the object position in the MUSE data cube. The aperture size was adjusted according to the object brightness. Within the MUSE field, two objects (the QSO and LRG) have optical spectra available from the SDSS spectroscopic archive. Comparisons of SDSS spectra and our own MUSE spectra of these objects show good agreement both in the locations of the line features and in the relative fluxes across the full spectral range from Å to Å, confirming the accuracy of wavelength and flux calibrations in the MUSE data cube.
2.3 LDSS3 multi-object spectroscopic observations
Multi-object spectroscopic observations of the QSO field were obtained using the Low Dispersion Survey Spectrograph 3 (LDSS3) and the VPH-all grism on the Magellan Clay telescope. LDSS3 observes a field of in radius at a pixel scale of , expanding the redshift survey beyond the MUSE field of view and providing a wider view of the large-scale galactic environment around the LRG and the pristine LLS at . The VPH-all grism covers a wavelength range of Å with a spectral resolution of km s-1. Multiple slitmasks were designed to observe a total of 247 objects with mag which, at , corresponds to in intrinsic luminosity. Objects at in angular distance from the QSO sightline were excluded from the LDSS3 observations to minimize duplicated spectroscopic follow-up effort, given the existing MUSE data. The observations were carried out in March 2018 and each mask was exposed for a total of 80 minutes under sub-arcsecond seeing conditions. The data were reduced using the COSMOS pipeline described in Chen & Mulchaey (2009).
2.4 The redshift survey
To determine the redshift of each object, we performed a fitting routine that compares the observed spectrum with models formed from a linear combination of four eigenspectra from the SDSS at different redshifts (see Chen & Mulchaey 2009 and Johnson et al. 2013 for a detailed description). The best-fit redshift of each object returned from the routine was visually inspected for confirmation.
From the MUSE data, we were able to obtain robust redshift measurements for 67 F814W-identified objects. Redshift uncertainties based on MUSE spectra are typically for emission-line galaxies and for absorption-line galaxies. All but one of the 42 objects brighter than mag in the MUSE field are identified with a spectroscopic redshift, reaching nearly 100% survey completeness for objects with mag. In addition, 26 galaxies fainter than mag have redshift identifications based on observations of strong emission lines, maintaining a 50% completeness level for objects with mag. The faintest spectroscopically identified galaxy is J135726.81043544.27 of mag at , close in redshift and projected distance to the LRG and the LLS.
From the LDSS3 observations, we were able to obtain robust redshift measurements for 146 objects of mag at angular separations of from the QSO sightline, including six objects that were also covered by the MUSE observations. Redshift uncertainties based on LDSS3 spectra are typically . Over the annulus of radius of the QSO sightline, corresponding to pkpc at , the LDSS3 survey reached % completeness for extended sources of mag, % for objects of mag, and % for objects of mag.
The results of the LDSS3 survey are summarized in Figure 2 with each spectroscopically identified object marked by the best-fit redshift. The redshift measurements are shown to two decimal places to avoid crowding. Galaxies found near the LLS from the combined LDSS3 and MUSE survey are labeled G1 through G12 in red. Redshift measurements of these galaxies are presented in column (4) of Table 1. Figure 2 shows that the LDSS3 and MUSE survey data together have uncovered an overdensity of galaxies near the LLS within 500 pkpc in radius.
The results of the MUSE survey in the inner field around the QSO are summarized in Figure 3, which demonstrates that the high-throughput and dense sampling of MUSE enable a high survey completeness to faint magnitudes (see § 3 below). The left panel shows the HST/ACS F814W image, while the right panel displays a narrow-band image of 20 Å wide, centered at 6660 Å from the combined MUSE data cube. The wavelength range is chosen to match the expected wavelength of [O III] at the redshift of this galaxy group, . The circles highlight the three line-emitting objects that are barely detected in the F814W band.
![[Uncaptioned image]](/html/1901.04488/assets/Q1354_comb_v3.png) Figure 3: Zoom-in view of the
field centered on QSO SDSSJ 135726.27043541.4 at , with the HST/ACS F814W image displayed on the
left and a narrow-band image of 20 Å wide, centered at
6660 Å from the combined MUSE data cube displayed on the right. North is up and east to the left. At , the
wavelength range of the narrow-band image corresponds to the
observed wavelength of [O III] . The dashed circle
marks the radius from the QSO sightline, corresponding to
pkpc at . Similar to Figure 2,
spectroscopically identified objects are marked with their
redshift measurements and galaxies associated with the pristine
LLS at are highlighted in red. In the MUSE narrow-band
image, precise redshifts of the galaxies in the vicinity of the
LLS (G1 through G7) are presented. The F814W image and MUSE data
together provide a detailed view of additional neighbors closer in
projected distance to the LLS than the LRG (G5), three of which
are emission-line dominated galaxies with exceedingly faint
continuum fluxes (G1, G2, and G3; also marked in circles).
Figure 3: Zoom-in view of the
field centered on QSO SDSSJ 135726.27043541.4 at , with the HST/ACS F814W image displayed on the
left and a narrow-band image of 20 Å wide, centered at
6660 Å from the combined MUSE data cube displayed on the right. North is up and east to the left. At , the
wavelength range of the narrow-band image corresponds to the
observed wavelength of [O III] . The dashed circle
marks the radius from the QSO sightline, corresponding to
pkpc at . Similar to Figure 2,
spectroscopically identified objects are marked with their
redshift measurements and galaxies associated with the pristine
LLS at are highlighted in red. In the MUSE narrow-band
image, precise redshifts of the galaxies in the vicinity of the
LLS (G1 through G7) are presented. The F814W image and MUSE data
together provide a detailed view of additional neighbors closer in
projected distance to the LLS than the LRG (G5), three of which
are emission-line dominated galaxies with exceedingly faint
continuum fluxes (G1, G2, and G3; also marked in circles).
| ID | Coordinates | (′′) | (pkpc) | |||||
| (1) | (2) | (3) | (4) | (5) | (6) | (7) | (8) | (9) |
| G1 | J135726.81043544.27 | 8.2 | 0.3313 | 39 | 26.890.17 | |||
| G2 | J135725.20043527.99 | 21.2 | 0.3287 | 100 | 25.440.21 | 24.790.18 | 25.090.63 | 24.740.04 |
| G3 | J135725.91043602.48 | 21.6 | 0.3294 | 102 | 23.800.03 | |||
| G4 | J135725.81043603.42 | 22.9 | 0.3300 | 109 | 23.150.04 | 21.690.02 | 20.880.02 | 21.310.01 |
| G5a | J135727.28043603.38 | 26.5 | 0.3295 | 126 | 20.610.01 | 18.950.01 | 18.070.01 | 18.600.01 |
| G6b | J135727.50043601.98 | 27.4 | 0.3303 | 130 | 22.290.01 | |||
| G7 | J135727.69043605.55 | 32.0 | 0.3289 | 152 | 24.610.11 | 23.030.05 | 22.240.04 | 22.610.01 |
| G8 | J135729.10043539.23 | 42.1 | 0.3268 | 199 | 22.850.04 | 22.330.04 | 22.100.06 | 22.310.01 |
| G9 | J135723.01043510.54 | 58.1 | 0.3292 | 276 | 23.450.05 | 22.230.03 | 21.490.04 | 21.830.01 |
| G10 | J135723.27043630.66 | 66.6 | 0.3293 | 316 | 23.680.06 | 22.640.04 | 22.080.06 | 22.220.01 |
| G11 | J135727.09043655.27 | 74.6 | 0.3294 | 354 | 23.380.06 | 22.230.04 | 21.500.04 | 21.810.01 |
| G12 | J135730.69043629.38 | 81.3 | 0.3290 | 386 | 23.740.06 | 22.350.04 | 21.600.04 | 21.970.01 |
| aThe LRG identified in the SDSS spectroscopic sample. The redshift determined from MUSE data agrees | ||||||||
| very well with the SDSS measurement. | ||||||||
| bThis object is not identified in the DECaLS catalog, possibly due to blending with the LRG at away. | ||||||||
| We estimate the magnitudes based on its observed flux ratio relative to the LRG in the F814W band. | ||||||||
3 Galactic Environment of the LLS at
The analysis presented in § 2 yielded a highly complete spectroscopic sample of galaxies in the field around QSO SDSSJ 135726.27043541.4. Specifically at angular distances from the sightline, the MUSE survey reached nearly 100% completeness for objects with mag and 50% completeness for objects with mag. At , the observed F814W bandpass corresponds well with rest-frame -band, and from Cool et al. (2012) blue galaxies at this redshift are found to have a characteristic rest-frame absolute -band magnitude of and red galaxies have . An observed brightness of (25) mag therefore corresponds to at .
Over the angular distance range from to , the LDSS3 survey reached % completeness for objects with mag and % completeness for objects with mag. At , the survey limit at mag corresponds to for quiescent galaxies and for star-forming galaxies. The highly complete imaging and spectroscopic data therefore provide an ultra deep view of the galactic environment of the chemically-pristine LLS and the nearby LRG.
Indeed, our imaging and spectroscopic survey of this field has uncovered a group of 12 galaxies in the vicinity of the LLS at . The photometric properties of these galaxies are presented in columns (6) through (9) of Table 1, in increasing angular distance from the QSO ( in column 3). For objects that are not detected in the DECaLS images, the 5- limiting magnitudes computed for extended sources in this region by the DECaLS team (e.g., Dey et al. 2018) are provided in Table 1.
In addition to the previously identified LRG at pkpc, our survey yielded 11 new galaxies with rest-frame absolute -band magnitude ranging from to (corresponding to a luminosity range of ) at pkpc, and no additional member at pkpc. In comparison to the LRG, a evolved galaxy (estimated based on the observed F814W brightness and % less luminous than the previous estimate from SDSS) with an implied virial radius of pkpc (e.g., Gauthier et al. 2009; Huang et al. 2016), the newly identified galaxies are all significantly fainter and the three galaxies closest to the QSO sightline are line emitters with exceedingly faint optical continuum magnitudes, mag (galaxies G1, G2, & G3 circled in Figure 3).
We infer a stellar mass, , for each member of the galaxy ‘group’ based on and the rest-frame color following the prescription provided in Johnson et al. (2015). The relation is calibrated for a Chabrier (2003) initial mass function with typical uncertainties in of less than 0.15 dex (see Johnson et al. 2015 for a detailed discussion). While the three line-emitters, G1, G2, & G3, are not detected in the DECaLS images, the MUSE spectra display blue continua. We adopt the blue branch from Johnson et al. (2015), when inferring for these galaxies. For the remaining member galaxies, we estimate based on the rest-frame color computed from available DECaLS photometry. Independent estimates using the FAST code (Kriek et al. 2009) are also available for objects observed in the MUSE frame (see Segers et al. 2018). Comparisons between our estimates and those from FAST show good agreements to within measurement uncertainties for all but one object. Galaxy G3 is the only exception with a FAST-estimated 0.6 dex higher than ours. But because G3 is merely from G4, object blending in MUSE data may impose additional systematic uncertainties in the measurement. In what follows, we describe the properties of individual group members.
| EW(H)b | SFRc | ISM | |||||||
| Galaxy | (pkpc) | (km s-1) | a | Type | (Å) | () | (O/H)d | ||
| (1) | (2) | (3) | (4) | (5) | (6) | (7) | (8) | (9) | (10) |
| G1 | 0.3313 | 39 | 587 | 6.9 | SF | 0.005 | |||
| G2 | 0.3287 | 100 | 0 | 7.8 | SF | 0.10 | |||
| G3 | 0.3294 | 102 | 158 | 8.1 | SF | 0.03 | |||
| G4 | 0.3300 | 109 | 294 | 10.0 | passive | … | |||
| G5 | 0.3295 | 126 | 181 | 11.1 | passive | … | |||
| G6 | 0.3303 | 130 | 361 | 9.6 | passive | … | |||
| G7 | 0.3289 | 152 | 45 | 9.5 | passive | … | |||
| G8 | 0.3268 | 199 | 429 | 8.7 | SF | 0.30 | |||
| G9 | 0.3292 | 276 | 112 | 9.7 | passive | … | |||
| G10 | 0.3293 | 316 | 135 | 9.3 | post SB | 0.04 | … | ||
| G11 | 0.3294 | 354 | 158 | 9.7 | passive | … | |||
| G12 | 0.3290 | 386 | 68 | 9.6 | passive | … | |||
| aAt , star-forming galaxies have a characteristic rest-frame absolute -band magnitude of and passive galaxies | |||||||||
| have (e.g., Cool et al. 2012). | |||||||||
| bRest-frame H equivalent width. Negative values represent emission, while positive values represent absorption. | |||||||||
| cFor star-forming (SF) galaxies, SFR is estimated based on , while for passive galaxies a 2- upper limit is | |||||||||
| estimated from the non-detection of [O II] . | |||||||||
| dFor comparison, the oxygen abundance of the Sun is (Asplund et al. 2009). | |||||||||
| eBased on the mass-metallicity relation of local dwarf galaxies from Berg et al. (2012) with a dispersion of dex. | |||||||||
G1 is an ultra faint dwarf galaxy found at and , with corresponding projected distance pkpc and line-of-sight velocity km s-1 from the LLS. The galaxy has , corresponding to , and . The optical spectrum of this galaxy is dominated by emission-line features, typical of a star-forming galaxy. We measure a rest-frame H equivalent width of Å, a total line flux of , and a luminosity of which, following the calibration of Kennicutt & Evans (2012), leads to a star formation rate (SFR) of M⊙ yr-1. To estimate the ISM gas phase metallicity, we consider both the index and the index. However, the expected location for the [N II] line is contaminated by strong OH lines. In addition, while the lines are detected at a high confidence level, the spectrum has insufficient quality for detecting H and [O II] . Although we are unable to obtain a direct measurement of the gas-phase metallicity in the interstellar medium (ISM) of this object, we infer a gas-phase metallicity of based on its and the best-fit mass-metallicity relation of low-mass dwarf galaxies from Berg et al. (2012).
G2 is a faint dwarf galaxy found at and , with corresponding projected distance pkpc and line-of-sight velocity km s-1 from the LLS. The galaxy has , corresponding to , and . The optical spectrum of this galaxy is dominated by emission-line features, typical of a star-forming galaxy. We measure a rest-frame H equivalent width of Å, a total H line flux of , and a luminosity of , which leads to . Based on the non-detection of [N II] and the calibration from Marino et al. (2013), , we infer a 2- upper limit to the ISM gas-phase metallicity of . The observed H/H ratio indicates that dust extinction is negligible in this galaxy. We therefore estimate the oxygen abundance from , assuming no extinction corrections. Based on the calibration of Yin et al. (2007), , we find for the observed flux ratio of with the error in gas metallicity dominated by the uncertainty in the calibration.
G3 is a faint dwarf galaxy found at and , with corresponding projected distance pkpc and line-of-sight velocity km s-1 from the LLS. The galaxy has , corresponding to , and . The optical spectrum of this galaxy is dominated by emission-line features, typical of a star-forming galaxy. We measure a rest-frame H equivalent width of Å, a total H line flux of , and a luminosity of , which leads to . Based on the non-detection of [N II] , we infer a 2- upper limit to the ISM gas-phase metallicity of . Applying no extinction corrections based on the observed H/H ratio, we find based on the index an oxygen abundance of for the observed flux ratio of .
Galaxies G4, G5 (the LRG), G6, and G7 at pkpc and km s-1 all exhibit strong absorption features such as Ca II H&K, G-band, Mg I triplet, and Balmer transitions, with no trace of emission lines. These galaxies have , corresponding to , and . The rest-frame H equivalent width ranges from Å to 5.2 Å. The observed spectral features confirm that these are evolved galaxies with little/no ongoing star formation. We infer 2- upper limits on the underlying SFR based on the absence of [O II] emission and the star formation calibrator of Kewley et al. (2004), assuming that no dust extinction correction is necessary for these quiescent galaxies. To gauge the chemical enrichment in these early-type galaxies, we estimate their stellar metallicities based on the Fe I line at 4668 Å and H that are known to be sensitive to the underlying stellar age and metallicity. Following the definitions of these indices from Kuntschner & Davies (1998), we find that the C4668 equivalent width of these four galaxies ranges from 4.2 Å to 6.3 Å, and the H equivalent width ranges from Å to Å, leading to a mean stellar metallicity that exceeds solar and a mean stellar age of Gyr for these galaxies (see Figure 2 of Kuntschner & Davies 1998).
G8 is a star-forming dwarf galaxy found at and , with corresponding projected distance pkpc and line-of-sight velocity km s-1 from the LLS. The galaxy has , corresponding to , and . The optical spectrum of this galaxy exhibits strong emission-line features, typical of a star-forming galaxy. We measure a rest-frame H equivalent width of Å, a total H line flux of , and a luminosity of , which leads to . Based on the observed [N II] /H ratio, we infer an ISM gas-phase metallicity of , % solar.
Galaxies G9 and G11 at and 354 pkpc and and km s-1 both exhibit strong absorption features such as Ca II H&K, G-band, Mg I triplet, typical of a quiescent galaxy. At the same time, the spectra also displays H and strong [N II] in emission, resembling nearby LINER-like galaxies (e.g., Sarzi et al. 2006; Yan et al. 2006). We measure a rest-frame H equivalent width of Å and Å for G9 and Å and Å for G11. These two galaxies have , corresponding to , and . Given the likely presence of additional ionizing sources that generated the emission features observed in the galaxy, we infer an upper limit on the underlying SFR of for G9 and for G11 based on the observed H line flux.
G10 is a post-starburst galaxy at and , with corresponding projected distance pkpc and line-of-sight velocity km s-1 from the LLS. The optical spectrum of this galaxy exhibits a combination of strong Ca II H&K and the Balmer absorption series, and weak emission features. The galaxy has , corresponding to , and . We measure a rest-frame H equivalent width of Å after correcting for stellar absorption, and find a corresponding total H line flux of , and a luminosity of , which leads to . The spectrum does not have sufficient quality for placing a sensitive constraint for the associated [N II] lines. Based on the non-detection of [N II] , we infer a 2- upper limit to the ISM gas-phase metallicity of .
G12 is another quiescent galaxy at pkpc and km s-1 with strong absorption features such as Ca II H&K, G-band, and Mg I triplet and no trace of emission lines. This galaxy has , corresponding to , and . We infer an upper limit on the underlying SFR of based on the absence of H line.
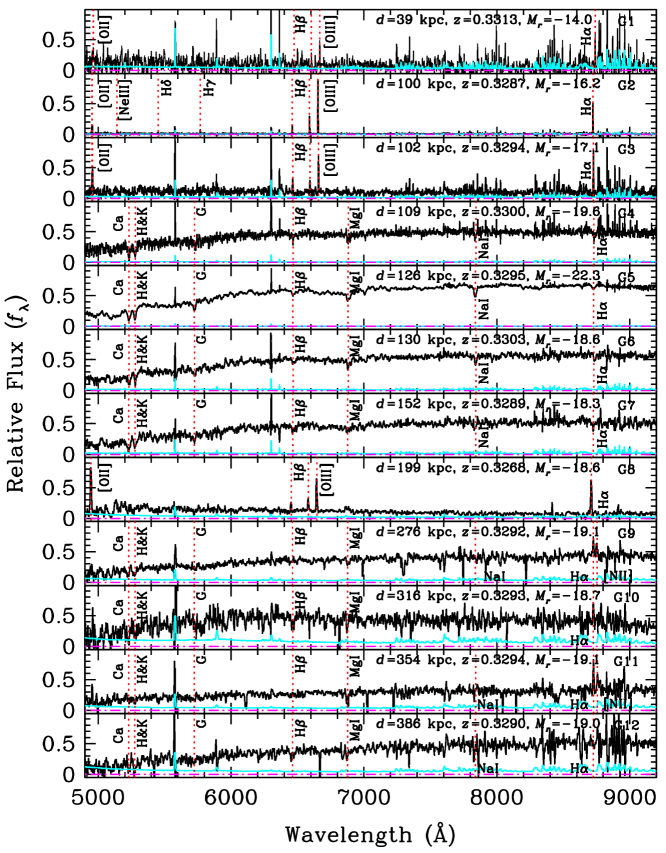
We summarize the properties of all 12 galaxies in Table 2, which lists the redshift , projected distance , line-of-sight velocity offset from the LLS , rest-frame -band magnitude , stellar mass , galaxy type (star-forming versus passive), rest-frame H equivalent width , star formation rate SFR, and ISM gas-phase metallicity in columns (2) through (10). The extracted optical spectra of galaxies are also presented in Figure 4, along with the 1- error spectra.
4 Discussion and Conclusions
The analysis presented in § 3 demonstrates that combining deep HST images, MUSE observations, and wide-field survey data enables an unprecedented, ultra-deep view of the galactic environment of a chemically-pristine LLS at . Previous efforts in characterizing the galactic environment of strong H I absorbers at include the identification of a gas-rich galaxy group near a damped absorber (DLA) of and % solar metallicity at (Chen & Lanzetta 2003; Kacprzak et al. 2010), the discovery of a metal-poor () strong LLS of at in the outskirts of the Virgo cluster (Tripp et al. 2005), and a star-forming galaxy at kpc from a strong LLS of and % solar metallicity at (Rahmani et al. 2018). In the first case, the metallicity of the DLA was found to be similar to the ISM metallicity in some of the group members, indicating that the DLA originates in tidal debris in the group environment. In the second case, the LLS was found to be associated with the NGC 4261 group with the nearest galaxy being a star-forming galaxy of at kpc from the absorber, and the metal-poor LLS was attributed to the ISM removed from dwarf satellites (however, see Chengalur et al. 2015 for more discussions). In the third case, the LLS was moderately enriched and was attributed to galactic winds from the disk galaxy. In all cases, the galaxy survey data are too incomplete to place stringent constraints for the possible presence of ultra-faint dwarf satellites.
Our spectroscopic survey in the inner 150 pkpc radius of the QSO sightline reaches a 100% completeness level for galaxies of luminosity at the redshift of the absorber, and maintains a 50% completeness level for galaxies as faint as . Beyond kpc, the LDSS3 survey reaches % completeness for galaxies of . A group of 12 galaxies are found at pkpc and km s-1 of the optically-thick absorber, with intrinsic luminosity ranging from to and a corresponding stellar mass range of . The wide-area LDSS3 survey covered an area out to Mpc in projected distance from the QSO sightline, but it did not uncover additional galaxies associated with the galaxy ‘group’ at pkpc.
The group of 12 galaxies in the vicinity of the LLS contains a total stellar mass of , % of which resides in the LRG. Considering all 12 galaxies together, we calculate the location of the projected center of mass of the galaxy ‘group’ and find that it is located at (, ) from the QSO sightline. The corresponding projected distance of the ‘group’ is therefore pkpc and the -weighted line-of-sight velocity offset is km s-1 between the galaxy ‘group’ and the LLS. We also calculate a line-of-sight velocity dispersion of km s-1 between these 12 galaxies, implying a dynamical mass of , consistent with the LRG halo mass inferred from the mean stellar mass to halo mass relation (e.g., Behroozi et al. 2013). It is clear that the LRG (G5) dominates the mass of the ‘group’ and that the line-of-sight velocity offset between the LLS and the LRG is within the bound of the halo velocity dispersion.
While our survey has uncovered three previously unknown galaxies at closer projected distances, pkpc, from the LLS than the massive LRG, all three galaxies combined contribute to no more than 0.2% of seen in the LRG at pkpc. In addition, while the three group members at pkpc are faint with intrinsic luminosity , the inferred ISM gas phase metallicity of solar is still more than 10 times higher than the 95% upper limit derived for the LLS. In principle, effective mixing between chemically-enriched ISM ejecta and chemically-pristine IGM can result in a significant dilution in the metallicity of the LLS (e.g., Schaye et al. 2007). To evaluate the effect of chemical dilution, we first recall the definition of gas metallicity as the mass fraction of heavy elements, . The mean gas metallicity of a LLS originating in a cloud of well-mixed ISM and IGM is therefore
| (1) |
where and represent the total mass of interstellar and intergalactic gas in the LLS, and the ISM metallicity is expected to be much greater than what is seen in the IGM, .
Following Equation (1), it is immediately clear that if ISM ejecta dominates in mass over accreted IGM in the LLS, , then . If both ISM ejecta and IGM contribute comparably to the LLS, , then . However, if metal-poor IGM dominates in the LLS, , then which is what we see for the LLS at .
Consequently, the observed disparity in the chemical enrichment level between the LLS and the group members has two important implications. First, it is unlikely that the LLS originates in ejecta from these faint galaxies either by stellar feedback or by ram-pressure stripping (cf. Whiting et al. 2006; Kacprzak et al. 2010; Gauthier 2013; Bielby et al. 2017). Observations of nearby low-mass galaxies have established a mass-metallicity relation of with a scatter of dex over a mass range of (Berg et al. 2012), similar to the mass range of the low-mass galaxies found near the LLS. At , the ISM metallicity is % solar following this mean relation. Recently, Hsyu et al. (2018) extended this effort to lower mass with a minimum mass of . The mass-metallicity relation of these ultra-low mass dwarfs is in good agreement with the best-fit relation of Berg et al., and remains at % solar for the lowest-mass galaxy of in their sample. With a lack of metallicity gradient observed in low-mass galaxies (e.g., Pérez-Montero et al. 2016; Belfiore et al. 2017), the ISM metallicity in the outskirts of these dwarf galaxies is likely at a similar level, still more than a factor of four higher than the LLS. Condensed cool clumps from the hot halo are also an unlikely explanation (cf. Gauthier & Chen 2011; Huang et al. 2016) under the expectation that gaseous halos around low-redshift elliptical galaxies are chemically enriched to solar or near solar metallicities (e.g., Mathews & Brighenti 2003; Mernier et al. 2017). Therefore, the LLS is likely to originate in infalling gas from the IGM in the LRG halo. Second, the detection of an extremely low-metallicity LLS in a massive quiescent halo at , among the most metal-poor LLS found at (e.g., Ribaudo et al. 2011), also indicates that parts of the IGM near old and massive galaxies still remain chemically pristine through the not too distant past.
While accretion is necessary to sustain galaxy growth, direct observational evidence of gas accretion remains scarce (e.g., Heitsch & Putman 2009; Turner et al. 2017; see also Putman 2017 for a recent review). Numerical simulations have suggested that gas accretion proceeds along the disk plane with a limited sky covering fraction of % (e.g., Faucher-Giguère& Kereš 2011), making frequent detections challenging. Although the study presented here focuses on a single LLS, the implication is broad. Recall that the LLS is one of the seven optically-thick absorbers uncovered from the COS-LRG program, which was designed to for a systematic survey of the CGM at pkpc of 16 random LRGs (Paper I). Three of these optically-thick absorbers are metal-poor with gas metallicity % solar (Paper II). Attributing these chemically-pristine LLS to cold streams accreted from the IGM would imply a mean covering fraction of for these cold streams, which is significantly higher than the expectation of few percents for massive halos at low redshifts from cosmological simulations (cf. Hafen et al. 2017). A larger sample of LLS with deep galaxy survey data available will be helpful to better quantify the incidence of IGM accretion galactic halos.
Acknowledgements
HWC and FSZ acknowledge partial support from HST-GO-14145.01A and NSF AST-1715692 grants. SDJ is supported by a NASA Hubble Fellowship (HST-HF2-51375.001-A). SC gratefully acknowledges support from Swiss National Science Foundation grant PP00P2_163824. This work is based on observations made with ESO Telescopes at the Paranal Observatory under programme ID 095.A-0200(A), data gathered with the 6.5m Magellan Telescopes located at Las Campanas Observatory, and imaging data gathered under the GO-14660 program using the NASA/ESA Hubble Space Telescope operated by the Space Telescope Science Institute and the Association of Universities for Research in Astronomy, Inc., under NASA contract NAS 5-26555. We acknowledge the use of DECaLS survey products.
References
- Asplund et al. (2009) Asplund, M., Grevesse, N., Sauval, A. J., & Scott, P. 2009, ARA&A, 47, 481
- Bacon et al. (2010) Bacon, R., Accardo, M, Adjali, L. et al. 2010, in Ground-based and Airborne Instrumentation for Astronomy III. p. 773508
- Behroozi et al. (2013) Behroozi, P. S., Wechsler, R. H., Conroy, C., 2013, ApJ, 770, 36
- Belfiore et al. (2017) Belfiore, F., Maiolino, R., Tremonti, C., Sánchez, S. F., Bundy, K., Bershady, M., Westfall, K., Lin, L., Drory, N., Boquien, M., Thomas, D., & Brinkmann, J. 2017, MNRAS, 469, 151
- Berg et al. (2012) Berg, Danielle A., Skillman, Evan D., Marble, Andrew R., van Zee, Liese, Engelbracht, Charles W., Lee, Janice C., Kennicutt, Robert C., Jr., Calzetti, Daniela, Dale, Daniel A., & Johnson, Benjamin D. 2012, ApJ, 754, 98
- Bertin & Arnouts (1996) Bertin, E., & Arnouts, S. 1996, A&AS, 117, 393
- Bielby et al. (2017) Bielby, R., Crighton, N. H. M., Fumagalli, M., Morris, S. L., Stott, J. P., Tejos, N., Cantalupo, S. 2017, MNRAS, 468, 1373
- Blake et al. (2008) Blake C., Collister A., Lahav O., 2008, MNRAS, 385, 1257
- Borisova et al. (2016) Borisova, E., Cantalupo, S., Lilly, S. J., Marino, R. A., Gallego, S. G., Bacon, R., Blaizot, J., Bouché, N., Brinchmann, J., Carollo, C. M., Caruana, J., Finley, H., Herenz, E. C., Richard, J., Schaye, J., Straka, L. A., Turner, M. L., Urrutia, T., Verhamme, A., & Wisotzki, L. 2016, ApJ, 831, 39
- Bowen & Chelouche (2011) Bowen, D. V., & Chelouche, D. 2011, ApJ, 727, 47
- Chabrier (2003) Chabrier, G. 2003, PASP, 115, 763
- Chen and Lanzetta (2003) Chen, H.-W. & Lanzetta, K. M. 2003, ApJ, 597, 706
- Chen and Mulchaey (2009) Chen, H.-W. & Mulchaey, J. S. 2009, ApJ, 701, 1219
- Chen (2017) Chen, H.-W. 2017, Gas Accretion onto Galaxies, 430, 167
- Chen et al. (2018) Chen, H.-W., Zahedy, F. S., Johnson, S. D., Pierce, R. M., Huang, Y.-H., Weiner, B. J., & Gauthier, J.-R. 2018, MNRAS, 479, 2547
- Chengalur et al. (2015) Chengalur, J. N., Ghosh, T., Salter, C. J., Kanekar, N., Momjian, E., Keeney, B. A., Stocke, J. T. 2015, MNRAS, 453, 3135
- Coleman et al. (1980) Coleman G. D., Wu C.-C., Weedman D. W., 1980, ApJS, 43, 393
- Cool et al. (2012) Cool, R. J., Eisenstein, D. J., Kochanek, C. S., Brown, M. J. I., Caldwell, N., Dey, A., Forman, W. R., Hickox, R. C., Jannuzi, B. T., Jones, C., Moustakas, J., & Murray, S. S. 2012, ApJ, 748, 10
- Dey et al. (2018) Dey, A., Schlegel, D. J., & Lang, D. et al. 2018, AJ submitted (arXiv:1804.08657)
- Eisenstein et al. (2001) Eisenstein, D. J., Annis, J., Gunn, J. E., et al. 2001, AJ, 122, 2267
- Faucher et al. (2011) Faucher-Giguère C.-A. & Kereš D., 2011, MNRAS, 412, L118
- Ferland et al. (2013) Ferland, G. J., Porter, R. L., van Hoof, P. A. M., et al. 2013, Rev. Mexicana Astron. Astrofis., 49, 137
- Gauthier et al. (2009) Gauthier J.-R., Chen H.-W., Tinker J. L., 2009, ApJ, 702, 50
- Gauthier et al. (2010) —, 2010, ApJ, 716, 1263
- Gauthier & Chen (2011) Gauthier J.-R., Chen H.-W., 2011, MNRAS, 418, 2730
- Gauthier (2013) Gauthier, J.-R. 2013, MNRAS, 432, 1444
- Hafen et al. (2017) Hafen, Z., Faucher-Giguère, C.-A., Anglés-Alcázar, D., Kereš, D., Feldmann, R., Chan, T. K., Quataert, E., Murray, N., & Hopkins, P. F. 2017, MNRAS, 469, 2292
- Heitsch and Putman (2009) Heitsch, F. & Putman, M. E. 2009, ApJ, 698, 1485
- Hsyu et al. (2018) Hsyu, T., Cooke, R. J., Prochaska, J. X., & Bolte, M. 2018, ApJ in press (arXiv:1807.04289)
- Huang et al. (2016) Huang, Y.-H., Chen, H.-W., Johnson, S. D., & Weiner, B. J. 2016, MNRAS, 455, 1713
- Johnson et al. (2013) Johnson, S. D., Chen, H.-W., & Mulchaey, J. S. 2013, MNRAS, 434, 1765
- Johnson et al. (2015) Johnson, S. D., Chen, H.-W., & Mulchaey, J. S. 2015, MNRAS, 449, 3263
- Kacprzak et al. (2010) Kacprzak, G. G., Murphy, M. T., Churchill, C. W. 2010, MNRAS, 406, 445
- Kennicutt and Evans (2012) Kennicutt, R. C. & Evans, N. J. 2012, ARA&A, 50, 531
- Kewley et al. (2004) Kewley L. J., Geller M. J., & Jansen R. A. 2004 AJ 127 2002
- Kriek et al. (2009) Kriek, M., van Dokkum, P. G., Labbé, I., Franx, M., Illingworth, G. D., Marchesini, D., & Quadri, R. F., 2009, ApJ, 700, 221
- Kuntschner and Davies (1998) Kuntschner, H. & Davies, R. L. (1998), MNRAS, 295, L29
- Lehner et al. (2018) Lehner, N., Wotta, C. B., Howk, J. C., O’Meara, J. M., Oppenheimer, B. D., Cooksey, K. L. 2018, ApJ, 866, 33
- Lundgren et al. (2009) Lundgren B. F., Brunner R. J., York D. G., et al. 2009, ApJ, 698, 819
- Marino et al. (2013) Marino, R. A., Rosales-Ortega, F. F., Sánchez, S. F., Gil de Paz, A., Vílchez, J., Miralles-Caballero, D., Kehrig, C., Pérez-Montero, E., Stanishev, V., Iglesias-Páramo, J., Díaz, A. I., Castillo-Morales, A., Kennicutt, R., López-Sánchez, A. R., Galbany, L., García-Benito, R., Mast, D., Mendez-Abreu, J., Monreal-Ibero, A., Husemann, B., Walcher, C. J., García-Lorenzo, B., Masegosa, J., Del Olmo Orozco, A., Mourão, A. M., Ziegler, B., Mollá, M., Papaderos, P., Sánchez-Blázquez, P., González Delgado, R. M., Falcón-Barroso, J., Roth, M. M., van de Ven, G., and Califa Team 2013, A&A, 559, 114
- Marino et al. (2018) Marino, R. A., Cantalupo, S., Lilly, S. J., Gallego, S. G., Straka, L. A., Borisova, E., Pezzulli, G., Bacon, R., Brinchmann, J., Carollo, C. M., Caruana, J., Conseil, S., Contini, T., Diener, C., Finley, H., Inami, H., Leclercq, F., Muzahid, S., Richard, J., Schaye, J., Wendt, M., Wisotzki, L. 2018, ApJ, 859, 53
- Mathews & Brighenti (2003) Mathews, W. G., & Brighenti, F. 2003, ARA&A, 41, 191
- Mernier et al. (2017) Mernier, F., de Plaa, J., Kaastra, J. S., Zhang, Y.-Y., Akamatsu, H., Gu, L., Kosec, P., Mao, J., Pinto, C., Reiprich, T. H., Sanders, J. S., Simionescu, A., & Werner, N. 2017, A&A, 603, A80
- Peng et al. (2010) Peng, Y.-j., Lilly, S. J., Kovač, K., et al. 2010, ApJ, 721, 193
- Pérez-Montero et al. (2016) Pérez-Montero, E., García-Benito, R., Vílchez, J. M., Sánchez, S. F., Kehrig, C., Husemann, B., Duarte Puertas, S., Iglesias-Páramo, J., Galbany, L., Mollá, M., Walcher, C. J., Ascasíbar, Y., González Delgado, R. M., Marino, R. A., Masegosa, J., Pérez, E., Rosales-Ortega, F. F., Sánchez-Blázquez, P., Bland-Hawthorn, J., Bomans, D., López-Sánchez, Á. R., Ziegler, B., and Califa Collaboration 2016, A&A, 595, 62
- Prochaska et al. (2017) Prochaska, J. X., Werk, J. K., Worseck, G., et al. 2017, ApJ, 837, 169
- Putman (2017) Putman, M. E. 2017, Gas Accretion onto Galaxies, 430, 1
- Rahmani et al. (2018) Rahmani, H., Péroux, C., Schroetter, I., Augustin, R., Bouché, N., Krogager, J.-K., Kulkarni, V. P., Milliard, B., Møller, P., Pettini, M., Vernet, J., York, D. G. 2018, MNRAS, 480, 5046
- Ribaudo et al. (2011) Ribaudo, J., Lehner, N., Howk, J. C., et al. 2011, ApJ, 743, 207
- Roseboom et al. (2006) Roseboom I. G., Pimbblet K. A., Drinkwater M. J., et al. 2006, MNRAS, 373, 349
- Sarzi et al. (2006) Sarzi M., Falcón-Barroso J., Davies R. L., et al. 2006, MNRAS, 366, 1151
- Schaye et al. (2007) Schaye, J., Carswell, R. F., & Kim, T. S. 2007, MNRAS, 379, 1169
- Tinker et al. (2013) Tinker, J. L., Leauthaud, A., Bundy, K., et al. 2013, ApJ, 778, 93
- Tripp et al. (2005) Tripp, T. M., Jenkins, E. B., Bowen, D. V., Prochaska, J. X., Aracil, B., Ganguly, R. 2005, ApJ, 619, 714
- Tumlinson et al. (2011) Tumlinson, J., Thom, C., Werk, J. K., et al. 2011, Science, 334, 948
- Turner et al. (2017) Turner, M. L., Schaye, J., Crain, R. A., Rudie, G., Steidel, C. C., Strom, A., & Theuns, T. 2017, MNRAS, 471, 690
- Weilbacher et al. (2012) Weilbacher P. M., Streicher O., Urrutia T., Jarno A., Pécontal-Rousset A., Bacon R., Böhm P., 2012, in Software and Cyberinfrastructure for Astronomy II. p. 84510B
- Whiting et al. (2006) Whiting, M. T., Webster, R. L., Francis, P. J. 2006, MNRAS, 368, 341
- Yang et al. (2006) Yang X., van den Bosch F. C., Mo H. J., Mao S., Kang X., Weinmann S. M., Guo Y., Jing Y. P., 2006, MNRAS, 369, 1293
- Yin et al. (2007) Yin, S. Y., Liang, Y. C., Hammer, F., Brinchmann, J., Zhang, B., Deng, L. C., & Flores, H. 2007, A&A, 462, 535
- Zhu et al. (2014) Zhu, G., Ménard, B., Bizyaev, D., et al. 2014, MNRAS, 439, 3139
- Zahedy et al. (2017) Zahedy, F. S., Chen, H.-W., Rauch, M., & Zabludoff, A. 2017, ApJ, 846, L29
- Zahedy et al. (2018) Zahedy, F. S., Chen, H.-W., Johnson, S. D., Pierce, R. M., Rauch, M., Huang, Y.-H., Weiner, B. D., Gauthier, J.-R. 2018, MNRAS submitted (arXiv:1809.05115)