Loss Factor of Supercooled Water at the Frequencies of 11180 GHz
Abstract
The loss factor of supercooled water at the frequencies GHz has been measured. A measuring technique has been proposed, in which wetted nanoporous silicate materials, silica gels, with the mean diameter of the pores being nm, were used to obtain deeply supercooled water. Results have been obtained for the loss factor of supercooled water, close to volume water for its properties, when cooled down to C. To ascertain the mechanism of pore water losses, measurements have been made in the range of temperatures C. The results obtained have demonstrated the existence of significant excessive losses at the temperatures below C, compared to the results of computations based on the known models. To allow mathematical description of the increment loss factor, a new addend has been introduced as a sum of two Gaussian functions in the formula described in [T. Meissner, F. J. Wentz, IEEE Trans. Geosci. Remote Sens. 2004. vol. 42, p. 1836]. One of these functions has the extremum near C, and the second one has the extremum in the range of C. Additional attenuation at C is supposed to be connected with the second critical point of water. Attenuation with the center in the range of temperatures C is determined by the emergence of conductive films at the boundary between the hard matrix and ferroelectric ice 0. This modification is a transitional form to ice Ih or ice Ic and is formed at the temperature below C.
Introduction
The knowledge of the dielectric parameters of supercooled metastable water is required for solving the problems of transfer of radiation in atmospheric aerosol, as well as in the frozen Earth cover. In a number of studies, models have been proposed for finding complex dielectric permittivity of water microwaves in the range of temperatures C Ellison (2007); Meissner and Wentz (2004); Rosenkranz (2015); Kutuza et al. (2016); Caddedu and Turner (2011). These models were based on a limited amount of experimental data Bertolini et al. (1982); Hodge and Angell (1978); Ronne et al. (1997), especially relating to the temperature range C. For example, in Bertolini et al. (1982) the lowest temperature at which measurements were made was C, and it was obtained in the micro emulsion of water. Different formulae presented in Ellison (2007); Meissner and Wentz (2004); Rosenkranz (2015); Kutuza et al. (2016); Caddedu and Turner (2011) demonstrate significant differences in the loss factor values () at the temperatures below C. Therefore, experiments were made relating to finding this value in a broad range of frequencies and at the temperatures C.
The main challenge in finding is to obtain the sufficient amount of supercooled water required for making the experiments. At the same time, it is known that deep supercooling of water is possible in porous bodies with nanopores Schreiber et al. (2001); Limmer and Chandler (2012). In Mtzler et al. (2010), it was proposed to use such media for microwave measurements of the parameters of supercooled water. This idea was implemented in Bordonsky et al. (2017); Bordonskiy et al. (2017), in which silicate materials were used as porous media. The measurements of were made at certain frequencies and within the relatively narrow frequency ranges up to temperatures C. The main result of these studies consists in the fact that, as opposed to Meissner and Wentz (2004), in the range of temperatures from to C, redundant absorption of microwave radiation is observed. However, in Meissner and Wentz (2004) the calculations of below C were not planned, as (at C). Therefore, in comparing the calculations with the results of this study, the loss factor was taken to be zero for temperatures below C. The studies performed Bordonsky et al. (2017); Bordonskiy et al. (2017) resulted in obtaining approximations of the coefficients in the formula of for certain ranges of frequencies.
The goal of this study was to make measurements of the loss factor for pore water close to olume water for its parameters, at the frequencies GHz and, using the previously obtained data, to find the analytical relation of within the frequency range from to GHz and within the temperature range from to C.
Among the papers published, the model proposed in Meissner and Wentz (2004) seems to be quite suitable for low temperatures, as it makes use of the concept of singularity at C. Therefore, it was used for comparison with the new results.
Experiment
.1 Analysis of the techniques of measuring the dielectric characteristics of pore water
As shown in Bordonsky et al. (2017); Bordonskiy et al. (2017), the main causes of the errors made in using porous media for obtaining data on dielectric parameters of supercooled pore water close to volume water for its properties are the following:
1. The absence of data on the fraction of the pore water close to volume water for its properties in the total amount of pore water.
2. Slow freezing of the pore water in a certain range of temperatures without a sharp phase transition, which makes determining the freezing point of the pore water difficult.
3. The emergence of cryogenic structures and of the related spatial dispersion in the medium. Spatial dispersion emerges due to arising inhomogeneity of the medium caused by migration of water to the freezing areas with the temperature gradient. At that, the microwave characteristics of the medium essentially change.
4. The structures emerging at the freezing of the medium may display special electric properties. An example is emergence of percolation due to cross-cutting electric conductivity. For example, percolation was observed at microwave measurements of wetted sand at the frequency of GHz as its wetness changed Bordonskiy and Orlov (2011).
It seems that the totality of these causes did not allow the researchers previously to use porous materials to measure the parameters of deeply supercooled water. As a result of our studies, a conclusion was made that, in order to eliminate the effects of the cryogenic structure and of percolation in studying the properties of supercooled pore water, nanoporous materials should be used with a low degree of wetness (with the moisture content %). In this case, there is practically no water in the space among the granules of the porous medium, which rules out migration of moisture and formation of inhomogeneities.
As noted in Schreiber et al. (2001); Cerveny et al. (2016) water gets easily supercooled in small pores. Thus, media with a low own loss factor, like silicates, are convenient for microwave measurements. Therefore, as porous matrix, nanoporous silicate materials, silica gels, with the average pore size nm, were used in Bordonskiy and Krylov (2012). For them, we obtained good agreement between the loss factor of pore water and the computational data according to formulas described in Meissner and Wentz (2004) for volume (free) water. It is quite important to indicate that this conclusion is corroborated by the studies conducted on clusters consisting of hundreds of water molecules contained in silicate pores by the methods of molecular dynamics Limmer and Chandler (2012); Cerveny et al. (2016); Castrillon et al. (2009). It was shown that primarily the first layer of water molecules ( nm thick) adsorbed on the surface of the silicate pores is strongly connected with the material of the silicate pore walls. The subsequent layers of the water molecules, unlike in other materials, have parameters coinciding with the parameters of volume water. Hence, water in the pores of silicate materials may be considered as an object having the properties of volume water. Although before the moment of the phase transition at negative temperatures the liquid pore water is in equilibrium state, the main volume of water in the pores of the silicate materials may be considered as an object having the qualities of volume (metastable) water. For example, for pore diameters nm, a considerable part of water in the pore volume will be 67% for the given case, which follows from the calculation of the volumes. For other materials, a special study is required, as well as measuring the thickness of the layer of interstitial water, in order to identify the fraction of the volume water.
Supercooling of water in the pores of silicate materials may be determined from the Gibbs-Thomson equation Schreiber et al. (2001); Cerveny et al. (2016). , where is the melting point of macroscopic samples of ice in free space, is the melting temperature of ice in the pores, (degreesnm); is a pore radius in nm; nm. It is also known that during the processes of water cooling and heating in pores, hysteresis takes place, at which the freezing temperature proves to be lower than the melting temperature by approximately C in the pores sized nm. At incomplete (%) filling of the pores with water, further decrease of the water freezing temperature in silicate materials was observed to constitute about C Schreiber et al. (2001). As a result, it was found that for pores nm in diameter, given their volume was less than % complete, water can be supercooled to C.
As noted above, a cryogenic structure emerges in freezing wetted medium, which does not allow the properties of pore water to be restored using standard methods. That was found during measurements of the reflection coefficient from freezing disperse medium in waveguides depending on temperature. Anomalies were observed also for the shape of resonance curves of the resonators completely filled with wetted frozen medium. As clusters emerge in the medium, its properties may be also affected by formation of ferroelectric ice 0 at the temperatures below C. The existence of this ice was discovered at computer simulation Russo et al. (2014); Quigley et al. (2014), and its influence on the microwave properties of porous media was experimentally established in Bordonskiy and Orlov (2017). During interaction with the matrix material, ice 0 forms a thin conductive layer at the boundary of the media due to the sharp difference in the values of static dielectric permittivity () Korobeynikov et al. (2002, 2005). Hence, at occurrence of the phase transition of water into ice 0 at temperatures below C, for porous medium with the pore diameter nm, we can expect increment of due to emerging conductivity in the samples.
.2 Experiment
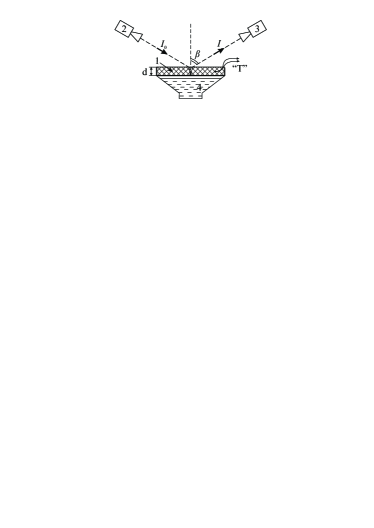
In conducting the experiments, we used finely disperse nanoporous silicates (silica gels) with the moisture content %, which corresponded to % filling of the pore volume. In addition, other methods of eliminating the influence of the possible inhomogeneity of the structure were used, which consisted in averaging the radiation in the space and by the frequency. For this purpose, flat samples placed in free space and samples placed in long waveguide cells were used, as well as broad-band microwave radiation in the frequency range of % of the average frequency. We measured intensity of microwave radiation which passed through the medium (), by the change of which we determined the power attenuation coefficient () without considering the radiation scattering: , where is the initial value of the radiation intensity, is the layer thickness. From the values of , we determined the loss factor depending on the frequency using the a priori information about the values of and (the real part of the relative dielectric permittivity) at C Meissner and Wentz (2004). The measurements were made at 16 frequencies within the range from to GHz. The layouts of the measurement setups are shown in Fig. 1.
During the studies, the refraction model for the mixture of the porous matrix material and water was used. For this model, refractions Sharkov (2003) were added. For the two-component medium:
| (1) |
where , , are complex refractive indexes of disperse medium, water and matrix material, respectively; is the bulk concentration of water. Hence:
where and are the equivalent thicknesses of water and of the matrix material, and are the respective attenuation coefficient. After transformation, we find :
Assuming that , and do not depend on temperature and do not vary in the given experiment, we obtain:
| (2) |
Disperse medium also contains air and adsorbed water (interstitial water). For interstitial water and for positive temperatures, the relaxation time is s, which is essentially lower than for volume water Komarov et al. (2005). We can expect this time to grow for interstitial water as it cools down. Therefore, the finite Eq. (2) does not change when the refraction model is used for the number of components greater than two.
For the case of measuring in free space (Fig. 1(a)), in Eq. (2) should be substituted for , where is the refraction angle. The presented layout of measurements was used in Mtzler and Wegmuller (1987); Bordonski and Krylov (1998). The factor “2” accounts for double passing of radiation through the layer.
For measurements, a microwave radiometer with the frequency band width GHz was used. As noise generators, diode generators of microwave radiation noise were used. The following silicate materials were used: silica gel KSKG (made in China) and Acros silica gel (made in Belgium) with the average pore sizes nm, the pore volume cm3/g and the pore surface area m2/g. The granules of the Acros silica gel were sized from to m, while the KSKG gel was crushed into granules sized m. The values of the linear dimensions in the trough plane were chosen within 30 wavelengths, and it was placed in the far zone of the antennas. The angles of incidence and observation were chosen to be equal to Brewster’s angle on vertical polarization. Due to small changes of in cooling of the medium, a change in this angle at the fixed position of the antennas results in a measurement error % due to increment in the reflection coefficient.
.3 Processing of data
In order to obtain from , it is necessary to determine the value of “const” in Eq. (2), i.e., the contribution of the losses in the silicate material and in adsorbed water. For this purpose, we subtracted the value of from the measured values of , as at C, liquid volume water in the pores turns into ice Limmer and Chandler (2012), and only the residual layer of adsorbed water remains. The obtained values of turned out to be lower than the computed model values Meissner and Wentz (2004) at the temperatures close to C, as in determining by the thermostatic-gravimetric method, over-estimated values were obtained of the thickness of the layer of water, as not all the water was free. To adjust , we used a priori information about the value of the attenuation factor of water at the temperature of C (C) obtained by calculating and from the known values for liquid water Meissner and Wentz (2004). We determined a certain factor (), which was multiplied by to average the experimental and simulated values of the attenuation factors: . Such a method of taking adsorbed water into account was used, for example, in monograph Benzar’ (1974).
As a result, the values () proved to agree well with the simulated values of according to model Meissner and Wentz (2004) to the temperature C. From the known ratios for the attenuation coefficient and , Sharkov (2003) for a medium without dissipation, we found the loss factor of supercooled pore water .
where is the wavelength in free space; is the imaginary part of the complex refractive index.
In finding the values of were used from Meissner and Wentz (2004) in the temperature range of C. In the temperature range of C, the value from to (depending on frequency) was used, in accordance with the calculation from Meissner and Wentz (2004) for the temperature of C.
The assumed approximation was verified, as the values of at the temperatures below C did not have experimental confirmation. For this purpose, the errors of determining at changing were assessed. The used values of were changed two times from to at the frequencies from GHz to GHz and in the temperature range from to C. The minimum calculated value was % at GHz at C. At the same frequency and at the temperature of C the operational margin reached %. As the frequency rose to GHz, the operational margin, with the used error in the knowledge of , gradually rose to constitute % at C and % at C. However, possible deviations of from the used values are not so high, therefore, the expected errors of determining are to be less by a factor of , compared to the estimations provided.
The operational margin of the relative measurements of of the medium by Eq. (2) was %, and that for % at lower frequencies at C. As temperature decreased to C, the operational margin of measuring rose to %. In the upper part of the studied range of temperatures, this error was % for C and % for C. The operational margin of measuring at the temperatures below C rose due to transition of a part of the water into a solid state. To reduce the errors of determining , it is necessary to measure , which is an specific task. However, this range of temperatures requires a special study.
.4 The measurement results
The results of determining depending on frequency for several frequencies are provided in Fig. 2(a, b, c).
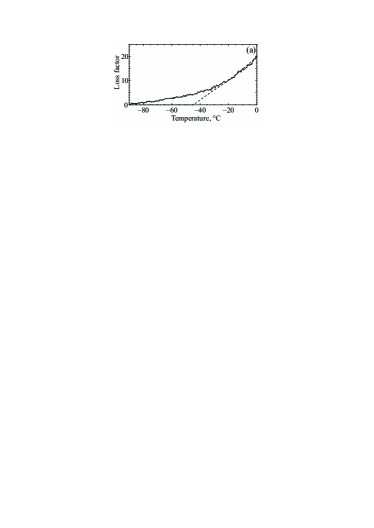
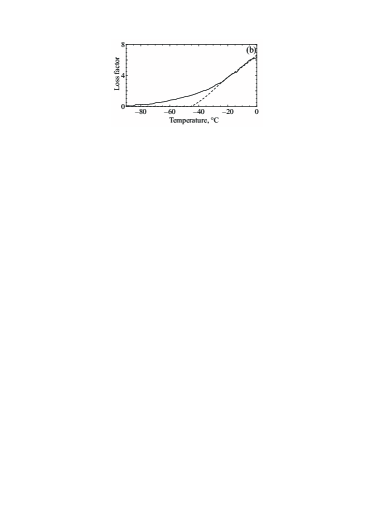
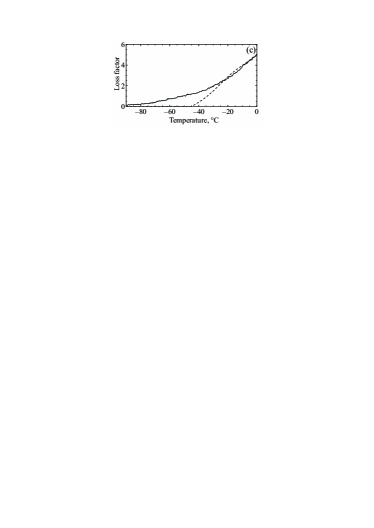
Altogether, we made measurements for different samples within the range of frequencies from GHz to GHz and the range of temperatures C. As it follows from the measurements, in the range of temperatures below C, significant difference between the obtained data and the simulation results was observed. We found the difference between the experimental values and the model values according to model Meissner and Wentz (2004), which has a look close to a bell-shaped curve with a characteristic extremum near C and certain asymmetry. The diagram of of dependence on temperature for frequency of GHz is shown in Fig. 3.
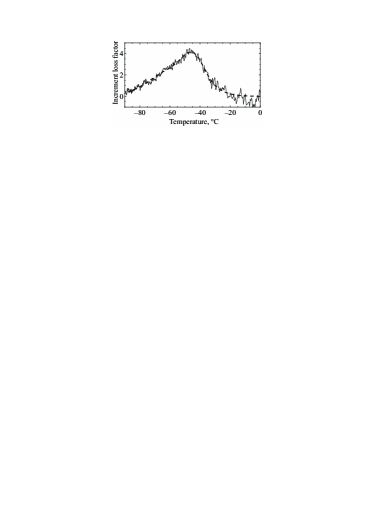
Additionally, was considered equal to zero in the model Meissner and Wentz (2004) at C.
The curve is well approximated by a sum of two Gaussian functions in the temperature range C.
| (3) |
where is in Centigrade degrees. C, for the value of C was used. In the general case, within one degree matched C, varied within C.
To ensure analytical description of depending not only on temperatures but also on frequency we found, by way of optimization, dependences , , , in Eq. (3) for the frequency range of GHz. The functions which are closest to the experimental data are the following:
| (4) |
where is in GHz. C, C.
Thus, the loss factor of supercooled water within the range of temperatures C was shown as:
| (5) |
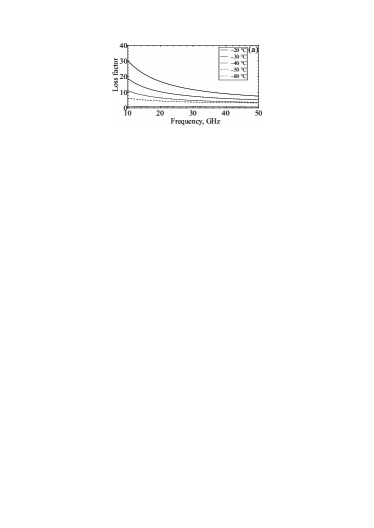
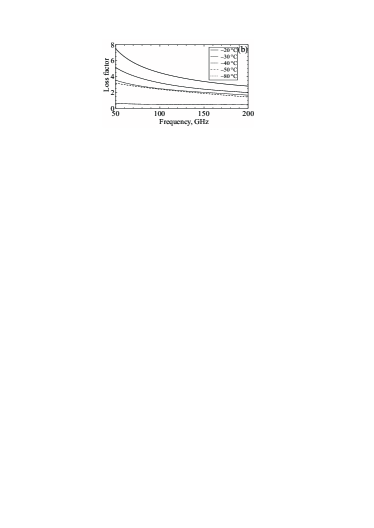
The results of calculations for depending on frequency () and of several values of temperature are shown in Fig. 4.
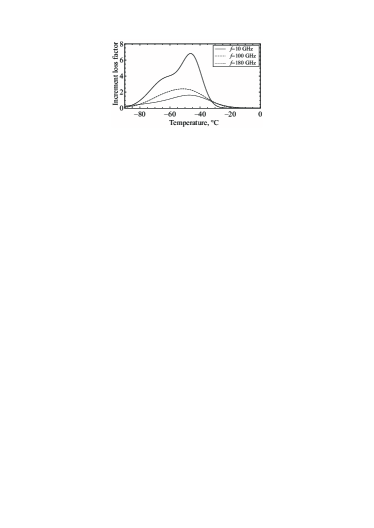
Shown in Fig. 5 are the curves of dependences on temperature for three values of frequencies.
Discussion of results
It is to be noted that volume water does not exist below C Franzese et al. (2009). In the experiment described in Kim et al. (2017), minimum temperature of C was achieved for nano drops within microseconds. In clouds the temperature C was observed Rosenfeld and Woodley (2000), corresponding to the temperature range of “no man’s land” (C). Therefore, the obtained results of microwave measurements for the temperature of C and below correspond to pore water close to volume water for its properties, but in which formation of nucleating centers is suppressed due to interaction between the water and the pore walls. To a certain extent, this effect should take place also in micro emulsions, for which measurements were made in Bertolini et al. (1982), and also in the micro droplets liquid in the atmosphere.
On the other hand, these data for the range of temperatures C are also of certain interest due to the possibility of deep supercooling of water in hard porous aerosol particles in the atmosphere with nanopores. Unfrozen water also exists at these temperatures in soils, vegetation cover, and other porous media.
Analyzing the experimental data, we found out that in all the experiments the parameter for two brands of silica gel is close to the value of C within the temperature range of about C. This is not related to the special shape of functions and its kink, as we observed a weak extremum near C in the original data of a number of experiments for . In most cases, parameter was within C. In formula (3) it was taken to be equal to C. In the experiments using the silicate material SBA-15, the extremum of losses at deep supercooling of water was revealed at C. Granted that two addends in (3) with extremum values at certain temperatures correspond to two mechanisms of electromagnetic losses, the first addend refers to properties manifested by purely volume water, while the second addend is related to the influence of the pore space (the pore material, the character of wetting, the geometry of pores, and the thermal history of the sample).
The specifics of electromagnetic losses of supercooled water in pores determined by the first addend in (3) at C may be related to the existence of the second critical point of water at the temperature of C and the pressure MPa Anisimov (2012). In accordance with Widom (1963), for the case of the liquid-liquid critical point, in the phase diagram a special line named the Widom line come from it. In this line, fluctuations of entropy and water density rise sharply. At the pressure of MPa, the temperature in the Widom line for water is equal to C Anisimov (2012); Franzese and Stanley (2007). In the experiments conducted on measuring the thermal capacity at constant pressure, isothermal compressibility and several other values to the temperature of C Angell et al. (1982), sharp increase of those values was discovered at approximation to C, reminding of the singularity. For the case of pore water, for which deeper supercooling is possible, extremum with the end value of at C were discovered for nanopores, but not singularity Nagoe et al. (2010).
The increase of for supercooled pore water at this temperature and in a certain range of temperatures may be attributed to the increase in the entropy fluctuations, i.e., to fluctuations of the structure of the dipole liquid.
The second addend in (3) may be related to the result of interaction between the molecules of water with the material of the pore surface. In Korobeynikov et al. (2002, 2005) emergence of a conductive layer nm thick on the boundary of dielectrics with a large difference of static dielectric permittivity values (). Its conductivity may rise times, compared to boundary media for the contrast . The degree of the influence of this layer on is determined by the area of the surface of the media boundary in a unit of volume.
The recent theoretical studies of water freezing stated the emergence of ferroelectric ice named ice 0, which may be formed only from supercooled water, followed by formation of ice Ih or Ic Russo et al. (2014); Quigley et al. (2014). This process may take place, according to the cited studies, at temperatures below C. Previously the rise of at the temperature below C was discovered for water in silicate material MCM-41 with cylindrical pores Fedichev et al. (2011) at low frequencies of the order of Hz.
The increment for this case may be found, knowing the specific conductivity () of wetted silicate, determined by the contact layer on the boundary. , here is the electric constant, is the angular frequency of the electromagnetic field. is calculated from the fraction of the volume occupied by the conductive layer with thickness , as well as by area of the pore surface in a unit of volume and — by the conductivity of volume water. If Ohm-1m-1; ; m2, the estimation provides at the frequency of GHz , and at the frequency GHz Bordonskiy et al. (2017). Thus, the computation demonstrates that the increase at the temperatures of C may be explained by the emergence of the ferroelectric state. This mechanism was experimentally tested in Bordonskiy and Orlov (2017) by three different methods: measuring of reflection coefficient from wetted nanoporous silicate, measuring low-frequency dielectric permittivity and hysteresis of electric noise; emergence of anomalies was confirmed for the temperatures below C.
In practical application of Eq. (3) for calculating the loss factor at temperatures below C, it is required to account for the fraction of water which turned into ice and to know parameter , at which the influence of ferroelectric ice and the increase of surface conductivity at the contact of media are observed. This parameter may vary within C, both depending on of the media, the chemical composition of pores and on conductivity , which depend on the temperature and admixtures in water. It may be likely that for water aerosol this effect is insignificant; therefore, in order to determine attenuation of microwave radiation in the atmosphere when (aerosol) particles are cooled down to C, it is sufficient to use only the first addend in Eq. (3).
Conclusions
1. Under certain conditions, pore water in nanoporous silicate materials is close to volume water for its properties, which allows its use as a model of medium in experimental studies of supercooled volume water. An additional supposition consists in the fact that the monomolecular adsorbed layer of water on the pore surface does not affect the microwave parameters of pore water in such materials at the frequencies higher than GHz. It is only necessary to consider its volume fraction in the total mass of water.
2. To find the microwave parameters of volume water from the measurements of wetted nanoporous silicates, a special technique is required. It consists in the following. In freezing of disperse medium, the texture emerges, having macroscopically inhomogeneous electric characteristics. These inhomogeneities essentially change the microwave properties of materials due to the effects of spatial dispersion, which does not allow the parameters of individual components of the medium to be determined. To eliminate the influence of inhomogeneity in determining the characteristics of pore water, a method of measurements was used in averaging the results in space and in a certain band of frequencies. In addition, to rule out the influence of structure inhomogeneity emerging from migration of water, measurements were conducted on specimens of disperse porous material with low moisture content.
3. It was established from the results of determining the attenuation coefficient and the loss factor of pore water close to volume water for its characteristics that there is additional increase of and at the temperatures below C within the frequency range of GHz. In Meissner and Wentz (2004), these values were close to zero at the temperatures below C, which the authors related to impossibility of the existence of liquid water at these temperatures. However, liquid water may exist in solid porous bodies at the temperatures below C.
4. Analysis of the experimental data resulted in the proposal of two mechanisms raising the pore water loss factor at the temperatures below C. The first mechanism is determined by microwave absorption in volume water, while the second mechanism is attributed to the surface effect of rising conductivity at the boundary of medium partition. Extremum at C may be explained by the influence of the second critical point of water on its properties existing at the temperature of C and the pressure of MPa. The Widom lines go from this point in the phase diagram, corresponding to the temperature of C at atmospheric pressure. In the Widom line, the theoretically predicted intense entropy and water density fluctuations were discovered. The microwave measurements of absorption of the radiation of wetted porous medium support the existence of the second critical point of water.
In the range of temperatures near C for nanoporous silicates, we found increase , which we related to the specifics of water freezing at its supercooling below C. In this case, formation of ferroelectric ice 0 is possible. A thin layer of increased conductivity emerges at the boundary between such ice and the pore surface due to the high values of the difference in the static dielectric permittivity. The influence of such layers depending on the type of material and the effects of emergence of ferroelectricity requires further investigations.
5. The microwave properties of supercooled water are of practical interest for determining the parameters of certain objects of the cryosphere at remote sensing. In addition to the known problem of studying cloud formations in the atmosphere, we can mention the problem of the transfer of radiation in solid aerosol particles. The same is true of soils, of snow and vegetation covers. Radiospectroscopy of wetted media may be used to study the structure of porous dielectrics based on the values of the loss factor and the phase transitions in them.
References
- Ellison (2007) W. J. Ellison, J. Chem. Phys. Ref. Data 36, 1 (2007).
- Meissner and Wentz (2004) T. Meissner and F. J. Wentz, IEEE Trans. Geosci. Remote Sens. 42, 1836 (2004).
- Rosenkranz (2015) P. W. Rosenkranz, IEEE Trans. Geosci. Remote Sens. 53, 1387 (2015).
- Kutuza et al. (2016) B. G. Kutuza, M. V. Danilychev, and O. I. Yakovlev, Microwave radiometry of the atmosphere and surface: Satellite monitoring of the Earth (URSS, Moscow, Russia, 2016) p. 336.
- Caddedu and Turner (2011) M. P. Caddedu and D. D. Turner, IEEE Trans. Geosc. Remote Sens. 49, 2999 (2011).
- Bertolini et al. (1982) D. Bertolini, M. Cassettari, and G. Salvetti, J. Chem. Phys. 76, 3285 (1982).
- Hodge and Angell (1978) I. M. Hodge and C. A. Angell, J. Chem. Phys. 68, 1363 (1978).
- Ronne et al. (1997) C. Ronne, L. Thrane, P. O. Astrand, A. Wallqvist, K. V. Mikkelsen, and S. R. Keiding, J. Chem. Phys. 107, 5319 (1997).
- Schreiber et al. (2001) A. Schreiber, I. Kotelsen, and G. H. Findenegy, Phys. Chem. Chem. Phys. 3, 1185 (2001).
- Limmer and Chandler (2012) D. T. Limmer and D. Chandler, J. Chem. Phys. 137, 044509/1 (2012).
- Mtzler et al. (2010) C. Mtzler, P. W. Rosenkranz, and J. Cermak, Journal of Geophysical Research: Atmospheres 115, D23208/1 (2010).
- Bordonsky et al. (2017) G. S. Bordonsky, A. O. Orlov, and K. A. Schegrina, Radiophysics and Quantum Electronics 59, 812 (2017).
- Bordonskiy et al. (2017) G. S. Bordonskiy, A. O. Orlov, and Y. B. Khapin, Sovremennye problemy distantsionnogo zondirovaniya Zemli iz kosmosa 14, 255 (2017).
- Bordonskiy and Orlov (2011) G. S. Bordonskiy and A. O. Orlov, Issledovanie Zemli iz kosmosa , 12 (2011).
- Cerveny et al. (2016) S. Cerveny, F. Mallamace, J. Swenson, M. Vogel, and L. Xu, Chem. Rev. 116, 7608 (2016).
- Bordonskiy and Krylov (2012) G. S. Bordonskiy and S. D. Krylov, Russian Journal of Physical Chemistry A 86, 1682 (2012).
- Castrillon et al. (2009) S. R.-V. Castrillon, N. Giovambattista, I. A. Arsay, and P. G. Debenedetti, J. of Phys. Chem. B 113, 7973 (2009).
- Russo et al. (2014) J. Russo, F. Romano, and H. Tanaka, Nature materials 13, 733 (2014).
- Quigley et al. (2014) D. Quigley, D. Alf, and B. Slater, J. Chem. Phys. 141, 161102/1 (2014).
- Bordonskiy and Orlov (2017) G. S. Bordonskiy and A. O. Orlov, JETP Letters 105, 492 (2017).
- Korobeynikov et al. (2002) S. M. Korobeynikov, A. P. Drozhzhin, G. G. Furin, V. P. Charalambakos, and D. P. Agoris, in Proc. of 2002 IEEE 14th International Conference on Dielectric Liquids (2002) pp. 270–273.
- Korobeynikov et al. (2005) S. M. Korobeynikov, A. V. Melekhov, Y. G. Soloveitchik, M. E. Royak, D. P. Agoris, and E. Pyrgioti, J. Phys. D: Appl. Phys. 38, 915 (2005).
- Sharkov (2003) E. A. Sharkov, Passive Microwave Remote Sensing of the Earth: Physical Foundations (Springer/PRAXIS, Berlin, N.Y., London, Paris, Tokyo, 2003) p. 613.
- Komarov et al. (2005) V. Komarov, S. Wang, and J. Tang, in Encyclopedia of RF and Microwave Engineering, edited by K. Chang (J. Wiley & Sons Inc., 2005) pp. 3693–3711.
- Mtzler and Wegmuller (1987) C. Mtzler and U. Wegmuller, J. Phys. D: Appl. Phys. 20, 1623 (1987).
- Bordonski and Krylov (1998) G. S. Bordonski and S. D. Krylov, IEEE Trans. Geocs. Remote Sens. 36, 678 (1998).
- Benzar’ (1974) V. K. Benzar’, Technique microwave moisture metering (Vysshaya shkola, Minsk, 1974) p. 350.
- Franzese et al. (2009) G. Franzese, A. Hernando-Martinez, P. Kumar, M. G. Mazza, K. Stokely, E. G. Strekalova, F. de los Santos, and H. E. Stanley, arXiv:0912.1666 [cond-mat. soft] , 17 (2009).
- Kim et al. (2017) K. H. Kim, A. Sph, H. Pathak, F. Perakis, D. Mariedahl, K. Amann-Winkel, J. A. Sellberg, J. H. Lee, S. Kim, J. Park, K. H. Nam, T. Katayama, and A. Nilsson, Science 358, 1589 (2017).
- Rosenfeld and Woodley (2000) D. Rosenfeld and W. L. Woodley, Nature 405, 440 (2000).
- Anisimov (2012) M. A. Anisimov, Russian Journal of Physical Chemistry B 6, 861 (2012).
- Widom (1963) B. Widom, J. Chem. Phys. 39, 2808 (1963).
- Franzese and Stanley (2007) G. Franzese and H. E. Stanley, J. Phys.: Condens. Matter 19, 205126/1 (2007).
- Angell et al. (1982) C. A. Angell, W. J. Sichina, and M. Oguni, J. Phys. Chem. 86, 998 (1982).
- Nagoe et al. (2010) A. Nagoe, Y. Kanke, M. Oguni, and S. Namba, J. Phys. Chem. B 114, 13940 (2010).
- Fedichev et al. (2011) P. O. Fedichev, L. I. Menshikov, G. S. Bordonskiy, and A. O. Orlov, JETP Letters 94, 401 (2011).