Sharp-edged geometric obstacles in microfluidics promote deformability-based sorting of cells
Abstract
Sorting cells based on their intrinsic properties is a highly desirable objective, since changes in cell deformability are often associated with various stress conditions and diseases. Deterministic lateral displacement (DLD) devices offer high precision for rigid spherical particles, while their success in sorting deformable particles remains limited due to the complexity of cell traversal in DLDs. We employ mesoscopic hydrodynamics simulations and demonstrate prominent advantages of sharp-edged DLD obstacles for probing deformability properties of red blood cells (RBCs). By consecutive sharpening of the pillar shape from circular to diamond to triangular geometry, a pronounced cell bending around an edge is achieved, serving as a deformability sensor. Bending around the edge is the primary mechanism, which governs the traversal of RBCs through such DLD device. This strategy requires an appropriate degree of cell bending by fluid stresses, which can be controlled by the flow rate, and exhibits good sensitivity to moderate changes in cell deformability. We expect that similar mechanisms should be applicable for the development of novel DLD devices that target intrinsic properties of many other cells.
I Introduction
Deterministic lateral displacement (DLD) is a powerful microfluidic technique capable of continuous size-dependent particle sorting with exceptional resolution Huang et al. (2004); Inglis et al. (2006); McGrath et al. (2014). Due to the extreme precision capabilities, DLDs promise to have great potential for biological and clinical applications. DLD devices have been employed to sort out circulating tumor cells from blood Loutherback et al. (2012); Liu et al. (2013); Karabacak et al. (2014), to process blood cells Davis et al. (2006); Beech et al. (2012); Zeming et al. (2013); Ranjan et al. (2014), and to separate bacteria Ranjan et al. (2014); Beech et al. (2018) and parasites Holm et al. (2011, 2016) from human blood. However, the auspicious precision is directly realizable only for rigid spherical particles, while biological particles (or cells) are generally deformable and non-spherical Zeming et al. (2013); Henry et al. (2016). Therefore, biological cells may attain different flow-induced orientation and deform in response to local flow conditions, making the prediction of their traversal through a DLD device difficult. In fact, the success in several cases above can mainly be attributed to significant size differences between targeted bioparticles and other background cells. Nevertheless, in numerous biological and clinical applications sorting and detection based on intrinsic mechanical properties of cells is highly coveted, since cell’s deformability is recognized as an important biomarker for the state of a cell Bao and Suresh (2003); Di Carlo (2012). For instance, a gradual stiffening of red blood cells (RBCs) is an important indicator for the onset and progression of diseases such as diabetes, sickle cell anemia, and malaria Kaul et al. (1983); Miller et al. (2002); Cranston et al. (1984). This motivates large scientific efforts to facilitate precise sorting in DLDs using intrinsic cell properties such as shape and deformability.
DLD devices usually utilize a row-shifted post (or pillar) array, which divides the laminar flow into several streams with equal volumetric flow rates Inglis et al. (2006). The thickness of the first stream adjacent to a pillar defines a critical radius such that rigid spherical particles with a larger or smaller size than traverse in a displacement or zigzag mode, respectively Inglis et al. (2006); Kulrattanarak et al. (2011a); Kim et al. (2017). Recently, an intermediate traversal mode called ’mixed’ mode has also been demonstrated experimentally Kulrattanarak et al. (2011b); Zeming et al. (2016), theoretically Kulrattanarak et al. (2011a); Kim et al. (2017), and in simulations Henry et al. (2016); Kulrattanarak et al. (2011b); Zhang et al. (2015). Biological cells can attain not only all these modes, but also change their effective critical size depending on the flow conditions Beech et al. (2012); Henry et al. (2016); Krüger et al. (2014); Quek et al. (2011). For example, RBC orientation can be sterically controlled in a shallow DLD device whose depth is smaller than the large diameter of the discocytic shape Beech et al. (2012); Holm et al. (2011); Holmes et al. (2014), and cell deformation can be mediated by different fluid stresses at various flow rates Beech et al. (2012); Krüger et al. (2014); Holmes et al. (2014). However, shallow devices have a low throughput and often suffer from cell sticking at the walls. Recently, an asymmetric deep DLD device (i.e. its depth is larger than the largest particle dimension) with a reduced inter-row gap size Zeming et al. (2016) has been shown to provide a better sorting of RBCs, wherein the underlying mechanism resembles cross-flow filtration Ripperger and Altmann (2002). Different post geometries have also been used to explore their possible advantages. For instance, I-shaped and L-shaped pillars were suggested as good candidates for sorting non-spherical particles, as they can induce a rotational motion Zeming et al. (2013); Ranjan et al. (2014). In our previous work Zhang et al. (2015), we have demonstrated that RBCs exhibit different deformation in arrays with various pillar geometries, since pillar shape influences the flow field in a DLD. Airfoil-like and diamond post shapes have been suggested to be advantageous for handling soft bioparticles, as they minimize device clogging Al-Fandi et al. (2011). Nevertheless, there is no comprehensive understanding what mechanisms and post structures should be employed to establish an efficient sorting scheme which would target cell deformability as a biomarker.
We employ mesoscale simulations to identify robust mechanisms and advantages of different post geometries for deformability-based sorting of RBCs. Our main result is that sharp-edged structures in deep DLDs are able to significantly enhance sensitivity for moderate differences in RBC deformability. Conventional deep DLD arrays based on circular pillars have a poor performance for deformability-based sorting, because the rounded post shapes do not generate distinct enough deformation of cells with different elastic properties. In contrast, diamond and triangular structures with sharp edges induce strong RBC bending around a post, which is the main mechanism for excellent deformability sensitivity, and thus, serves as a sensor for cell’s deformability. In addition, sharp edges result in a bended first stream, whose length along the flow direction is significantly reduced. The relation between the length of the first stream in the flow direction and a deformability-dependent effective length of RBCs significantly influences the traversal of RBCs through the device. This constitutes a novel sorting mechanism, which is important for the separation of deformable and anisotropic particles. It is important to emphasize that optimal sensitivity of different sharp-edged structures is achieved only for an appropriate correspondence between cell deformation and fluid stresses applied by the flow, so that the flow rate has to be carefully selected. Our results provide general design principles for DLD devices, and should thus be useful for the construction of optimized microfluidic devices, which can precisely target intrinsic cell properties.
II Simulation methods and models
II.1 Post geometry and arrangement in DLDs
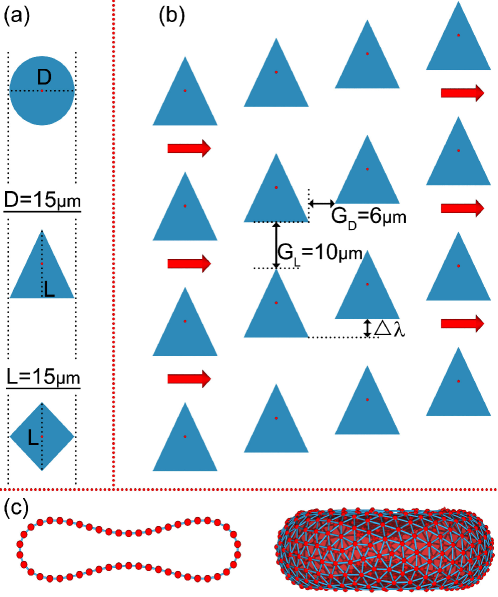
To demonstrate how sharp-edged obstacles in deep DLD devices can dramatically enhance deformability-based sorting of RBCs, we study microfluidic DLD arrays with different post geometries (see Fig. 1). Investigated post shapes include circular, diamond, and triangular obstacles with two characteristic lengths , as depicted in Fig. 1(a). The corresponding array gaps are and with a row shift and the post center-to-center distances are and , as shown in Fig. 1(b). The DLD array we study in simulations is asymmetric (), which leads to a reduced critical size in comparison to a conventional symmetric design with Zeming et al. (2016).
We employ simulations of two-dimensional (2D) and three-dimensional (3D) systems to study RBC behavior in DLD devices for a wide range of parameters. The 2D model is employed for its numerical efficiency; however, we will show that it qualitatively captures RBC behavior in comparison with the 3D model.
II.2 RBC model
In the simulations, a RBC in 2D is represented by a bead-spring chain, incorporating bending rigidity () and length and area conservation, while the membrane in 3D is modeled by a triangular mesh, which represents shear elasticity, bending rigidity, and area and volume conservation, see Fig. 1(c).
In 2D, RBCs are modeled as closed bead-spring chains with beads connected by springs Zhang et al. (2015); Fedosov et al. (2012). The spring potential is given by
| (1) |
where is the length of the spring , is the maximum spring extension, , is the persistence length, and is the spring constant. Note that a balance between the two force terms in Eq. (1) results in a non-zero equilibrium spring length , with . Furthermore, to induce a 2D biconcave cell shape in equilibrium, an additional membrane bending potential and area constraint potential are incorporated as
| (2) |
where and are the bending coefficient and the area-constraint coefficient, respectively. is the instantaneous angle between two adjacent springs having a common vertex , is the instantaneous area, and is the desired cell area. In 2D, is related to the macroscopic bending rigidity as .
Typical values for a healthy RBC are the effective cell diameter and the bending rigidity of about for the physiological temperature C. In 2D, we use , with the cell contour length . All 2D simulation parameters are collected in Table 1. The RBC bending rigidity is characterized by a non-dimensional rigidity factor , where corresponds to the typical bending rigidity of a healthy RBC.
In 3D, the RBC membrane is modeled as a triangulated network of springs Gompper and Kroll (2004); Noguchi and Gompper (2005); Fedosov et al. (2010a, b, 2014). It is constructed from a collection of particles linked by springs with the bonding potential of Eq. (1). The membrane bending rigidity in absence of spontaneous curvature is described by a bending energy
| (3) |
where is the angle between two normal vectors of triangular faces adjacent to the spring . In addition, to represent area-incompressibility of the lipid bilayer and incompressibility of the inner cytosol, the area and volume constraints are introduced by the potentials
| (4) |
where , , and are the global area, local area, and volume constraint coefficients, respectively. and are the instantaneous area and volume of RBCs with the desired values of and , while and are the instantaneous and desired areas of the -th triangle in the network, respectively. Note that the desired values of those parameters are set according to the initial triangulation.
The parameters of the triangulated-network model have been related to the macroscopic membrane properties Seung and Nelson (1988); Gompper and Kroll (1996); Fedosov et al. (2010a, b). For example, the membrane shear modulus is given by
| (5) |
where for all springs. The bending constant can be expressed in terms of the macroscopic bending rigidity of the Helfrich model Helfrich (1973) as . Accordingly, mechanical properties of 3D RBCs can be characterized by both the shear modulus and bending rigidity with a Föppl-von Kármán number . In this study, is fixed and is varied and characterized by , where corresponds to a healthy RBC with . An effective RBC diameter is defined as with , implying that . RBC volume is set to . Table 2 summarizes important parameters used in 3D simulations.
II.3 Mesoscale hydrodynamics approach
We employ the dissipative particle dynamics (DPD) method Hoogerbrugge and Koelman (1992); Español and Warren (1995) in 2D to qualitatively explore physical mechanisms for efficient deformability-based separation. The smoothed dissipative particle dynamics (SDPD) approach Español and Revenga (2003); Müller et al. (2015) is applied in 3D for a detailed quantitative exploration of specific flow conditions and post shapes.
In the DPD method Hoogerbrugge and Koelman (1992); Español and Warren (1995), each individual particle represents a group of molecules. The inter-particle force () acting on particle by particle is a sum of three pairwise forces, conservative (), dissipative (), and random () within a selected cutoff radius .
| (6) |
where , , and . The coefficients , , and determine the strength of the corresponding forces, respectively. and are weight functions, and is a random number generated from a Gaussian distribution with zero mean and unit variance. The dissipative and random forces must satisfy the fluctuation-dissipation theorem given by the conditions and Español and Warren (1995), in order to maintain the system temperature () and generate a correct equilibrium Gibbs-Boltzmann distribution. with is employed in this study. The DPD parameters for 2D simulations are given in Table 1.
| DPD | ||||
|---|---|---|---|---|
| RBC | ||||
In the SDPD method Español and Revenga (2003); Müller et al. (2015), each individual particle represents a small volume of fluid. SDPD is often considered as an improved version of DPD with a direct connection to the Navier-Stokes equation and consistent thermal fluctuations Vázquez-Quesada et al. (2009). The three pairwise forces on particle in SDPD are given by
| (7) |
where and are the trace of a random matrix of independent Wiener increments and its traceless symmetric part, respectively. and are local particle pressures given by the equation of state , where , and are selected parameters. and are the coefficients of dissipative and random forces respectively, such that and with being the desired dynamic viscosity.
| SDPD | ||||
|---|---|---|---|---|
| RBC | ||||
II.4 Simulation characteristics
A simulated system consists of a single suspended RBC, a single pillar, and many fluid particles within the computational domain. Post walls and the ceiling and floor walls in 3D are modeled by a layer of frozen particles with a thickness of and same equilibrium structure as that of the suspending fluid. In addition, to prevent wall penetration, bounce-back reflections are applied to particles at fluid-solid interfaces. An infinite DLD array is represented by applying periodic boundary conditions (BCs) both in the flow (x) and lateral (y) directions. To model a shift in the lateral direction, a shift in the direction is applied for each boundary-crossing event in the direction.
The flow in the direction is driven by a constant force applied to each fluid particle, which is equivalent to a constant pressure gradient , where is the pressure drop over a single post column and is the number density of fluid particles in simulations. To characterize the flow strength, we define a Capillary number as . Here, the average shear rate is in 2D and in 3D, where is the flow rate within a single post section and is the height of a DLD device in 3D. is fluid’s dynamic viscosity. In 3D simulations, another capillary number based on the shear modulus of RBC membrane can be defined as , which is related to the employed Ca number based on the bending rigidity through the Föppl-von Kármán number . Which of these capillary numbers is most relevant depends on the type of deformation. For bending of RBCs around sharp edges considered here, it is , whereas for RBC buckling in shear flow at high shear rates, it is Mauer et al. (2018). It is important to note that an additional adaptive force is applied in direction to ensure no net flow in the lateral direction Henry et al. (2016); Zhang et al. (2015). Both 2D and 3D simulations are performed with a viscosity contrast between the internal () and external () fluid viscosities.
To analyze cell deformation, we employ RBC acircularity in 2D Zhang et al. (2015) and asphericity in 3D Fedosov et al. (2011), which are defined as
| (8) |
| (9) |
where are the square roots of the eigenvalues of the squared radius-of-gyration tensor. Acircularity (or asphericity) characterizes the departure of cell shape from a circular (or spherical) geometry. Thus, the value of is equal to zero for a perfect circular or spherical shape, and approaches for a strongly elongated object. In equilibrium, and correspond to the 2D and 3D biconcave shapes of a RBC, respectively.
III Results
III.1 RBC behavior in circular post arrays
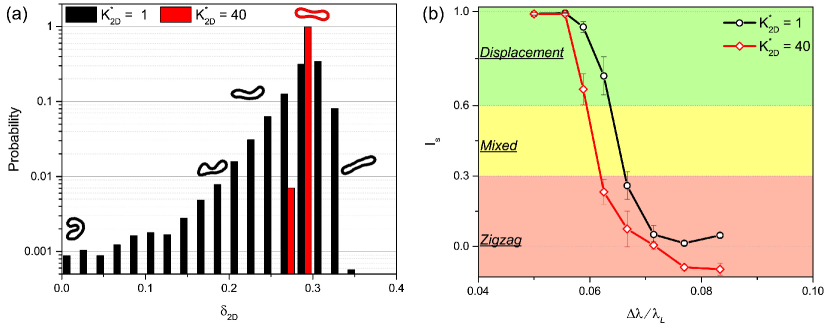
We start with a conventional circular post geometry and investigate its performance for deformability-based sorting of RBCs. Fig.2(a) presents acircularity distributions, which characterize the deviation of cell shape from a circular configuration for the two very different RBC bending rigidities ( and ). The softer RBC with bending rigidity (i.e. ) approximates normal healthy conditions (see Methods) and shows considerable deformations in DLD, documented by a wide acircularity distribution in Fig.2(a). The stiffer cell exhibits a rather narrow acircularity distribution, which is centered around an acircularity value of the RBC biconcave shape in equilibrium, indicating that a RBC with can be considered nearly rigid under these flow conditions with . Such strong differences in the deformation of these two cells should in general strongly affect their traversal through the DLD device and eventually translate into their tangible separation.
To quantitatively characterize the traversal of RBCs through a device, a dimensionless parameter called ”separation index” , defined as the ratio of average lateral displacement of a cell per post and the row shift , is introduced similarly to Ref. Zhang et al. (2015). An ideal displacement mode is characterized by such that cells are laterally displaced at each post. An ideal zigzag mode is generally referred to as without a significant net lateral displacement of cells in the device. In addition, a ”mixed mode” with irregular alternation of zigzag and displacement modes can be also present, for which Zhang et al. (2015), and be used to localize the displacement-to-zigzag transition. Fig. 2(b) shows the separation index for soft and nearly rigid RBCs as a function of . Despite the very strong differences in overall deformation of these two RBCs illustrated in Fig.2(a), displays only a slight shift toward a lower value of with increasing cell rigidity. This results in a very narrow window of values ( nm), where deformability-based sorting should theoretically be possible. However, in practice the use of this narrow separation window would likely lead to a poor performance or inability to efficiently carry out deformability-based cell sorting. Therefore, strong differences in particle deformation within a DLD device do not guarantee good or even moderate sorting efficiency.
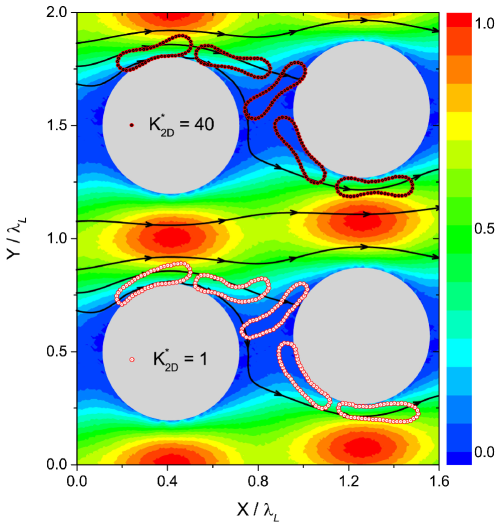
To identify cell deformation which primarily governs the traversal of RBCs through a DLD device, we take a closer look at RBC trajectories (Fig. 3). Such visual analysis reveals that RBC deformation near the top of a pillar determines cell’s trajectory, as it can result in a further displacement motion or initiate a zigzaging event. This is also consistent with previous studies Krüger et al. (2014); Beech et al. (2012); Henry et al. (2016), which demonstrated that strong enough deformation near a post can effectively reduce particle size and alter its traversal through a DLD device. Note that the argument about effective reduction of the particle size due to deformability is not strictly applicable here, since the soft cell displays a slightly larger effective size than the stiff RBC in Fig. 2(b). Figure 3 compares typical motion of soft and stiff RBCs as they experience a zigzagging event. Despite some differences in cell deformation, the motion of both RBCs is quite similar. In fact, significant deformations of soft RBCs represented by the wide acircularity distribution in Fig. 2(a) occur mainly away from the posts, and do not significantly contribute to cell’s traversal through the DLD device. Interestingly, slight deformations of soft RBCs near a post in Fig. 3 aid the RBC to escape from the first stream, leading to a larger effective size and value in Fig.2(b) in comparison to the stiff cell. However, it is apparent that the rounded geometry of circular posts and the resulting flow field do not induce strong enough differences in RBC deformation near a post and thus, result in a poor deformability-based separation.
III.2 Sorting with sharp-edged post structures
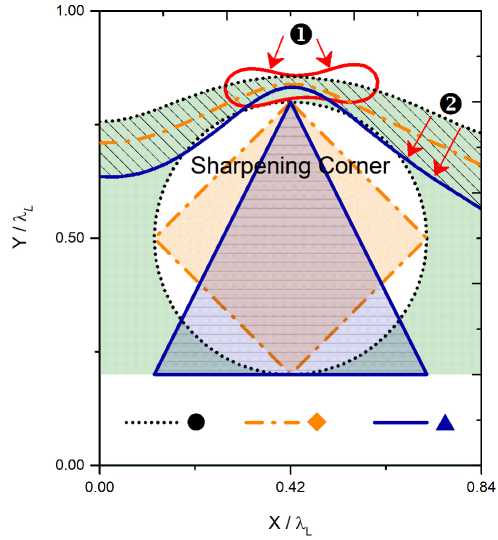
The results for circular posts indicate that a considerable deformation of cells near the top of post structures likely has a strong correlation with the sensitivity of a DLD device for deformability-based sorting. A stronger RBC deformation can be initiated by sharper edges at the post top, which is illustrated by different post geometries in Fig. 4, including circular, diamond, and triangular structures. Sharp edges in post geometry result in two crucial changes for RBC behavior in DLD. First, such structures are able to induce a considerable RBC bending around a post due to steric cell-post interactions and corresponding flow stresses within a flow field with bent streamlines, since a RBC generally deforms along a post edge Zeming et al. (2016). Second, a sharp edge leads to a reduced thickness of the first stream along this edge, as illustrated in Fig. 4. For rigid spherical particles, this reduces the critical size for separation Loutherback et al. (2010); Zhang et al. (2015). Furthermore, Fig. 4 displays that a length of the bent first stream adjacent to the edge is significantly reduced for sharp edges, which is important in comparison to a characteristic RBC length. Note that the length of the bent first stream is also reduced due to the asymmetric post positioning with a smaller gap between consecutive rows. As it will become evident further on, for the separation of non-spherical particles, the stream length instead of its thickness may play a decisive role for particle traversal through a DLD device.
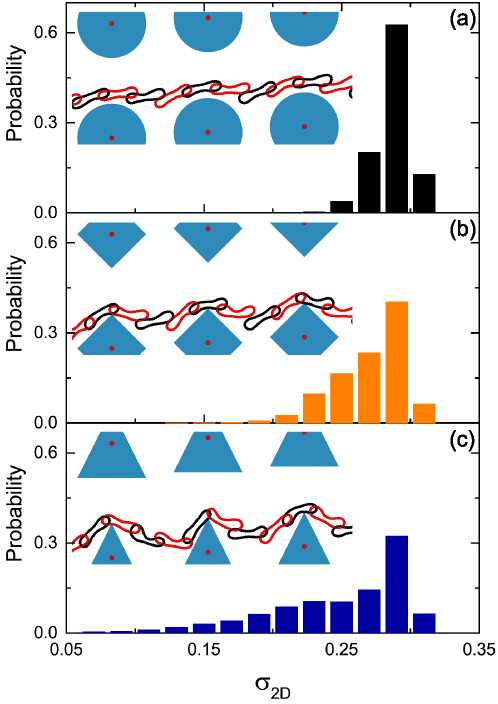
To verify these propositions, we first consider acircularity distributions for a RBC with in DLD arrays with various post geometries, as shown in Fig. 5. For the fixed bending rigidity, a DLD array with triangular posts induces the strongest cell deformations, which is evidenced by the widest acircularity distribution. All three DLD devices here have , such that a RBC remains in the displacement mode. This means that the distributions in Fig. 5 represent RBC deformation around different pillar structures and its subsequent shape relaxation, confirming that sharp-edged post shapes significantly enhance RBC deformation. A stronger cell bending around triangular posts is also directly visible from cell snapshots in Fig. 5 when compared to diamond and circular structures (see also Movie S1).
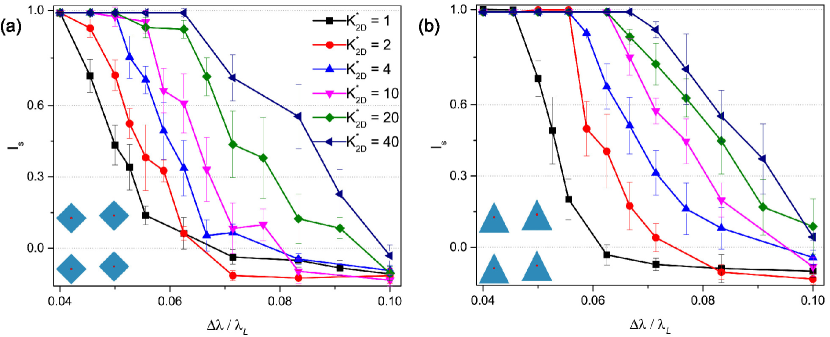
Figure 6 presents separation index for RBCs in diamond and triangular pillar arrays as a function of cell’s rigidity and the row shift . In contrast to a very slight dependence of the displacement-to-zigzag transition on RBC bending rigidity in circular post arrays (Fig. 2(b)), this transition is much more sensitive to in diamond-post arrays and most distinct for the triangular post geometry. Consequently, the diamond and triangular structures result in a clear improvement of the sensitivity and selectivity of a DLD device to subtle differences in RBC bending rigidity. Therefore, sharp-edged structures would likely lead to a practically realizable and efficient DLD design for deformability-based sorting.
Another interesting difference in RBC behavior in DLD arrays with circular and sharp-edged posts is that the displacement-to-zigzag transition shifts to a larger value of with increasing for circular posts, while an opposite trend is observed in arrays with diamond and triangular pillars. This qualitative difference indicates that there are distinct mechanisms at play. As discussed above for the circular-post array, RBC deformation near the top of a pillar aids in cell escaping from the first stream illustrated in Fig. 3 and leads to an effective increase in the critical size. Furthermore, RBC snapshots in Fig. 5 demonstrate that a RBC may not necessarily make a tight contact with circular posts, as a narrow fluid gap between the cell and the posts is clearly visible. This effect likely occurs due to hydrodynamic interactions of a RBC with pillar walls, which is often referred to as a ’lift’ force Abkarian et al. (2002); Messlinger et al. (2009), or possibly due to hydrodynamic slowing down of particles near a surface. The lift force generally acts stronger on soft particles in comparison to rigid particles, and drives a deformable RBC away from a pillar wall, effectively increasing its critical size. In contrast, RBCs in diamond and triangular post arrays often make a tight contact with the posts, as seen in Fig. 5, suggesting that hydrodynamic interactions between RBCs and the posts are weaker than in a circular pillar array.
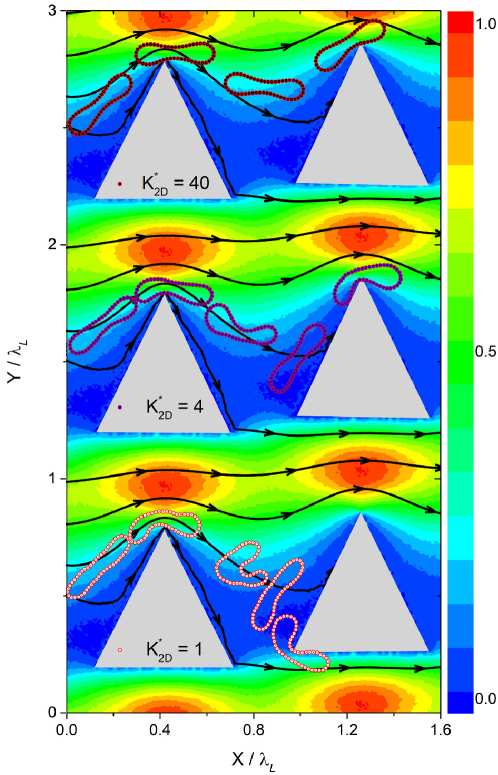
For a closer look at a typical RBC deformation around a triangular post, Fig. 7 shows representative cell morphologies for three bending rigidities (, , and ) in a DLD with (see also Movie S2). The RBC snapshots clearly show that a softer RBC experiences a stronger bending deformation around the triangular pillar in comparison to stiffer cells. In fact, this deformation aids a RBC to remain within the fist stream in a DLD device and leads to an effective reduction of the critical size. Here, the length of the first stream in the flow direction (illustrated in Fig. 4) with respect to the RBC size plays a decisive role. Thus, the stiff cell with , which does not bend much around the triangular post, is forced to leave the first stream due to steric RBC-edge interactions, since its elongated shape exceeds the length of the first stream. In contrast, the soft RBC with is able to bend sufficiently around the triangular post, in order to remain within the first stream and proceed with a zigzagging mode. Therefore, the degree of RBC bending around a sharp edge determines whether the cell proceeds with a displacement or zigzag mode, resulting in different traversal paths in a DLD depending on . This induced deformation around a sharp edge serves as an effective sensor for RBC deformability in the DLD device.
III.3 Effect of flow rate
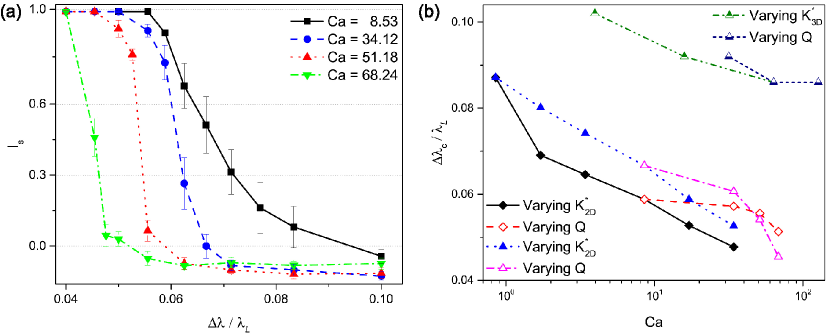
Besides RBC deformability, the flow rate in a DLD device is another important parameter, as it is directly related to applied fluid stresses. Intuitively, an increase in the flow rate should have a similar effect as a decrease in cell’s bending rigidity for a fixed flow rate, as both lead to increased deformation. Figure 8(a) shows the separation index for a RBC with at various flow rates in triangular post arrays. Indeed, an increase in the flow rate results in a gradual shift of the displacement-to-zigzag transition to lower row shifts, analogously to a decrease in cell rigidity. The curves in Fig. 8(a) also indicate that the correspondence between the flow rate (or fluid stresses) and cell’s rigidity needs to be selected with care. For instance, the differences in curves for and are not as large as for and , indicating that the flow rates for are too small to induce significant deformation for a RBC with , which is a key point for deformability-based sorting. Similarly, too high flow rate would likely induce very strong deformations independently of the RBC rigidity, compromising sorting sensitivity. Therefore, the flow rate in a DLD device has to be carefully selected to induce distinguishable deformation for RBCs within a desired range of membrane rigidities.
To examine the discussed similarity of effects of cell’s bending rigidity and the flow rate in DLD device in more detail, we plot in Fig. 8(b) the critical shift (at ) for RBC separation as a function of capillary number . The comparison is performed between the curves “varying ” and the corresponding curves “varying ” for same post shapes. Even though the critical shift decreases with increasing Ca number for both “varying ” and “varying ” cases, the correspondence between these curves is only qualitative. This means that capillary number, although an important parameter, is not the only dimensionless number which determines deformability-based separation. There are several possible reasons that may lead to this complex behavior of RBCs, which cannot be fully characterized by a single Ca number. These include non-linear cell deformation, non-linear relaxation of the cell shape, and complex flow field and distribution of local stresses. As a result, both cell’s rigidity and the flow rate in DLD need to be carefully considered, if a quantitative prediction of is aimed for.
Note that the curves in Fig. 8(b) allow the selection of a proper flow rate for a pre-defined to achieve good sorting efficiency of RBCs whose bending rigidity is close to a targeted value. Similarly, we can determine a range of cell rigidities which can be targeted well for pre-selected and .
III.4 Triangular post arrays in 3D simulations
To verify the discussed effect of sharp-edged structures, simulations of DLDs with triangular posts have been performed in three spatial dimensions. The post geometry and arrangement of DLD are same as in the 2D study, while the height of the device was set to , such that a RBC has full orientational freedom. The post edges were slightly blunted by replacing the corners with short planes of length. This shape modification improves the stability of simulations and mimics better pillar structures in microfluidic devices, since very sharp corners cannot easily be achieved due to fabrication limitations and/or subsequent surface functionalization. As in the 2D simulations, bending rigidity of RBCs is varied such that , where represents a typical bending rigidity of a healthy RBC. The viscosity contrast between RBC cytosol and suspending medium is set to unity, in order to reduce effects from dynamic shape changes at high viscosity contrasts Henry et al. (2016); Lanotte et al. (2016) and focus primarily on cell deformation around a sharp edge. The flow rate is characterized by a Capillary number .
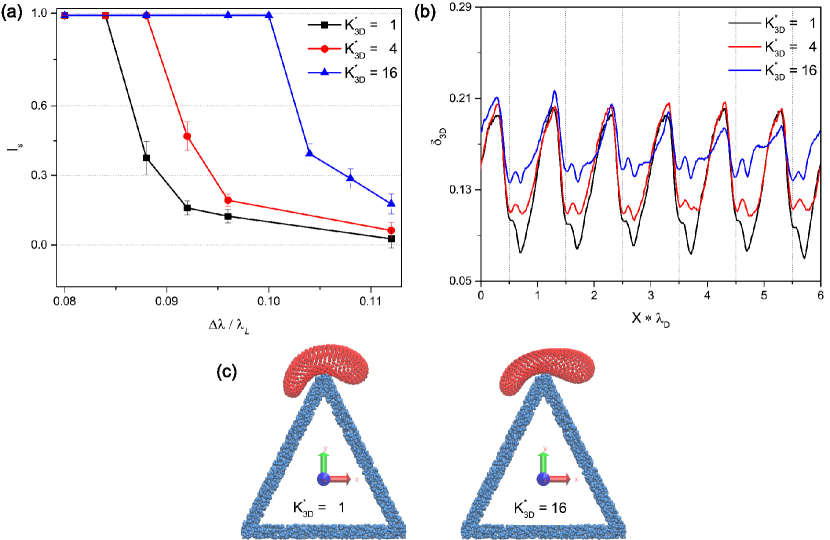
Figure 9(a) shows the separation index for RBCs with different bending rigidities as a function of the row shift . A comparison with Fig. 6(b) demonstrates qualitative similarity between 2D and 3D results. Difference in the displacement-to-zigzag transition for and is quite small ( nm), which is due to a relatively high flow rate such that RBCs strongly deform independently of its bending rigidity. This proposition is corroborated by the instantaneous asphericity in Fig. 9(b), which shows only moderate differences in cell asphericity between and . However, the difference in the displacement-to-zigzag transition for and is large enough ( nm) to achieve deformability-based sorting in practice. Consistently, Fig. 9(b) shows that RBC asphericities for and are quite distinct, indicating an appropriate correspondence between RBC rigidity and applied fluid stresses. Figure 9(c) illustrates RBC snapshots for and , where a noticeable difference in cell bending around the top edge of a triangular post is clearly visible (see also Movies S3 and S4). Finally, critical row shifts for varying bending rigidity and flow rate are plotted in Fig. 8(b) and show a good qualitative correspondence, consistent with the 2D results. In 3D, due to the presence of shear elasticity in RBC membrane, the second capillary number based on the shear modulus (see Section II.4) may contribute to the complex cell behavior in DLDs. In conclusion, the 3D simulation results confirm the relevance of the same separation mechanisms discussed in the context of systems and support encouraging perspectives for efficient deformability-based cell sorting in DLDs with sharp-edged obstacles.
IV Conclusions
Our simulation study demonstrates advantages of sharp-edged post structures in deep DLD devices for deformability-based cell sorting. It is clear that not any deformation can be efficiently exploited for cell separation in DLDs. Only deformations near the posts, which affect the cell positioning with respect to the separatrix between displacement and zigzag modes, are important. This point is best illustrated by RBC acircularity in circular post arrays in Fig. 2(a), which is strongly affected by RBC bending rigidity, but the majority of deformation is due to flow-field inhomogeneity away from the posts, so that deformability-based sorting remains poor. Thus, cell deformation near the top of a pillar (region of highest shear rate) governs cell’s traversal through a DLD device, since it can facilitate or prevent a zigzagging event. Interestingly, this type of deformation is rather insensitive to RBC bending rigidity in circular post arrays. In contrast, DLDs with diamond- and triangular-shaped posts induce a favorable mode of deformation in the critical flow region, so that sharp-edged geometries serve as efficient deformability sensors.
The sorting capabilities of DLD devices are generally characterized by a critical size, which is related to the thickness of the first stream and defines the displacement-to-zigzag transition Huang et al. (2004); Inglis et al. (2006). This single parameter functions perfectly for rigid spherical particles in DLDs with various geometric structures Zhang et al. (2015). Obviously, the behavior of anisotropic and deformable particles in DLDs is much more complex and cannot be described well by a single predefined critical size Zeming et al. (2013); Henry et al. (2016), since particle deformation may alter its effective size and affect the particle trajectory. In addition to the effective particle size in comparison to thickness of the first stream, our simulations show that the relation between effective particle length and the length of the first stream in the flow direction is very important. For example, a stiff RBC in triangular post arrays is not able to bend much around a sharp edge (see Fig. 7), and thus keeps its full length during cell-post interaction. However, this steric interaction forces the stiff RBC to leave the first stream, because its length is smaller than the RBC size. In contrast, soft RBCs, which can bend enough around a sharp edge, effectively reduce their length and remain within the first stream, as illustrated in Fig. 7. This constitutes a new mechanism that is different from the concept of a critical size and can be at play as well for long enough rod-like anisotropic particles.
Cell deformation in a DLD device is directly associated with applied fluid stresses controlled by the device geometry and flow rate. Low flow rates, which do not induce substantial cell deformation, are not very sensitive to deformability differences. Another strong drawback of low flow rates is a low device throughput, which needs to be high enough for practical applications in order to process a required amount of sample within an acceptable time limit. However, too high flow rates can also be problematic, because even though they are advantageous for device’s throughput, the sensitivity of deformability measurements might be compromised, as large fluid stresses can induce very strong cell deformations independent of cell rigidity. Thus, the flow rate (or fluid stress) has to be carefully selected, such that a proper deformation is induced to efficiently differentiate cell rigidities within a range of interest. Furthermore, for a decision about the device throughput, a potential trade-off between device’s throughput and sensitivity needs to be considered.
Another practical limitation of high flow rates and consequently strong cell deformations is potential cell lysis. An average shear stress in our 3D simulations can be estimated as , whose value is smaller than Pa. In fact, RBCs are able to sustain much larger stresses without lysis in microvasculature Popel and Johnson (2005) or in microfluidics Beech et al. (2012). A further concern is whether sharp edges might impose very strong local stresses on RBC membranes. The analysis of simulated RBC deformation within DLD devices with triangular posts shows that RBCs experience the strongest membrane stresses near sharp edges. Interestingly, the largest local stresses are at the top side of a RBC that is opposite to the side of direct contact between the cell and the post. However, the magnitude of these stresses is maximum 40% larger than the average fluid stresses on a RBC within a DLD device. In addition, the fabrication of very sharp edges is not possible in practice, so that they are slightly blunted, which leads to a reduction of local shear stresses. Therefore, we conclude that RBC lysis is unlikely to be a serious issue for flow rates, which represent a good sensitivity for RBC deformability measurements.
In summary, sharp-edged structures in deep DLD devices can be employed as deformability sensors, as they induce a bending-like deformation around a sharp corner. Two different mechanisms contribute to this process. The first corresponds to a relation between the effective cell size and thickness of the first stream, which is the conventional mechanism for the characterization of DLD devices with a critical particle size. The second mechanism is related to the correspondence between effective cell length and the length of the first stream in the flow direction, which is altered during cell bending around a sharp edge. Optimal sensitivity for deformability measurements requires fine tuning of the flow rate in order to induce an appropriate deformation strength. This means that generally there exists a compromise between device throughput and sensitivity for deformability-based sorting. DLD devices with sharp-edged structures are expected to be applicable in situations where cell’s mechanical properties are altered, for instance, in diseases such as diabetes, malaria, and sickle-cell. We hope that our proposition will be tested experimentally in the near future.
Acknowledgments
We would like to thank Kushagr Punyani, Stefan H. Holm, Jason P. Beech, and Jonas O. Tegenfeldt (Lund University, Sweden) for stimulating discussions. We acknowledge the FP7-PEOPLE-2013-ITN LAPASO – ”Label-free particle sorting” for financial support. Dmitry A. Fedosov acknowledges funding by the Alexander von Humboldt Foundation. The authors gratefully acknowledge the computing time granted through JARA-HPC on the supercomputer JURECA at Forschungszentrum Jülich.
References
- Huang et al. (2004) L. R. Huang, E. C. Cox, R. H. Austin, and J. C. Sturm, “Continuous particle separation through deterministic lateral displacement,” Science 304, 987–990 (2004).
- Inglis et al. (2006) D. W. Inglis, J. A. Davis, R. H. Austin, and J. C. Sturm, “Critical particle size for fractionation by deterministic lateral displacement,” Lab Chip 6, 655–658 (2006).
- McGrath et al. (2014) J. McGrath, M. Jimenez, and H. Bridle, “Deterministic lateral displacement for particle separation: a review,” Lab Chip 14, 4139–4158 (2014).
- Loutherback et al. (2012) K. Loutherback, J. D’Silva, L. Liu, A. Wu, R. H. Austin, and J. C. Sturm, “Deterministic separation of cancer cells from blood at 10 ml/min,” AIP Advances 2, 042107 (2012).
- Liu et al. (2013) Z. Liu, F. Huang, J. Du, W. Shu, H. Feng, X. Xu, and Y. Chen, “Rapid isolation of cancer cells using microfluidic deterministic lateral displacement structure,” Biomicrofluidics 7, 011801 (2013).
- Karabacak et al. (2014) N. M. Karabacak, P. S. Spuhler, F. Fachin, E. J. Lim, V. Pai, E. Ozkumur, J. M. Martel, N. Kojic, K. Smith, P. Chen, J. Yang, H. Hwang, B. Morgan, J. Trautwein, T. A. Barber, S. L. Stott, S. Maheswaran, R. Kapur, D. A. Haber, and M. Toner, “Microfluidic, marker-free isolation of circulating tumor cells from blood samples,” Nat. Protoc. 9, 694–710 (2014).
- Davis et al. (2006) J. A. Davis, D. W. Inglis, K. J. Morton, D. A. Lawrence, L. R. Huang, S. Y. Chou, J. C. Sturm, and R. H. Austin, “Deterministic hydrodynamics: taking blood apart,” Proc. Nat. Acad. Sci. USA 103, 14779–14784 (2006).
- Beech et al. (2012) J. P. Beech, S. H. Holm, K. Adolfsson, and J. O. Tegenfeldt, “Sorting cells by size, shape and deformability,” Lab Chip 12, 1048–1051 (2012).
- Zeming et al. (2013) K. K. Zeming, S. Ranjan, and Y. Zhang, “Rotational separation of non-spherical bioparticles using I-shaped pillar arrays in a microfluidic device,” Nat. Commun. 4, 1625 (2013).
- Ranjan et al. (2014) S. Ranjan, K. K. Zeming, R. Jureen, D. Fisher, and Y. Zhang, “Dld pillar shape design for efficient separation of spherical and non-spherical bioparticles,” Lab Chip 14, 4250–4262 (2014).
- Beech et al. (2018) J. P. Beech, B. D. Ho, G. Garriss, V. Oliveira, B. Henriques-Normark, and J. O. Tegenfeldt, “Separation of pathogenic bacteria by chain length,” Anal. Chim. Acta 1000, 223–231 (2018).
- Holm et al. (2011) S. H. Holm, J. P. Beech, M. P. Barrett, and J. O. Tegenfeldt, “Separation of parasites from human blood using deterministic lateral displacement,” Lab Chip 11, 1326–1332 (2011).
- Holm et al. (2016) S. H. Holm, J. P. Beech, M. P. Barrett, and J. O. Tegenfeldt, “Simplifying microfluidic separation devices towards field-detection of blood parasites,” Anal. Methods 8, 3291–3300 (2016).
- Henry et al. (2016) E. Henry, S. H. Holm, Z. Zhang, J. P. Beech, J. O. Tegenfeldt, D. A. Fedosov, and G. Gompper, “Sorting cells by their dynamical properties,” Sci. Rep. 6, 34375 (2016).
- Bao and Suresh (2003) G. Bao and S. Suresh, “Cell and molecular mechanics of biological materials,” Nat. Mater. 2, 715–725 (2003).
- Di Carlo (2012) D. Di Carlo, “A mechanical biomarker of cell state in medicine,” J. Lab. Autom. 17, 32–42 (2012).
- Kaul et al. (1983) D. K. Kaul, M. E. Fabry, P. Windisch, S. Baez, and R. L. Nagel, “Erythrocytes in sickle cell anemia are heterogeneous in their rheological and hemodynamic characteristics,” J. Clin. Invest. 72, 22–31 (1983).
- Miller et al. (2002) L. H. Miller, D. I. Baruch, K. Marsh, and O. K. Doumbo, “The pathogenic basis of malaria,” Nature 415, 673–679 (2002).
- Cranston et al. (1984) H. A. Cranston, C. W. Boylan, G. L. Carroll, S. P. Sutera, J. R. Williamson, I. Y. Gluzman, and D. J. Krogstad, “Plasmodium falciparum maturation abolishes physiologic red cell deformability,” Science 223, 400–403 (1984).
- Kulrattanarak et al. (2011a) T. Kulrattanarak, R. G. M. van der Sman, Y. S. Lubbersen, C. G. P. H. Schroën, H. T. M. Pham, P. M. Sarro, and R. M. Boom, “Mixed motion in deterministic ratchets due to anisotropic permeability,” J. Colloid Interface Sci. 354, 7–14 (2011a).
- Kim et al. (2017) S.-C. Kim, B. H. Wunsch, H. Hu, J. T. Smith, R. H. Austin, and G. Stolovitzky, “Broken flow symmetry explains the dynamics of small particles in deterministic lateral displacement arrays,” Proc. Natl. Acad. Sci. USA 114, E5034–E5041 (2017).
- Kulrattanarak et al. (2011b) T. Kulrattanarak, R. G. M. van der Sman, C. G. P. H. Schroën, and R. M. Boom, “Analysis of mixed motion in deterministic ratchets via experiment and particle simulation,” Microfluid. Nanofluid. 10, 843–853 (2011b).
- Zeming et al. (2016) K. K. Zeming, T. Salafi, C.-H. Chen, and Y. Zhang, “Asymmetrical deterministic lateral displacement gaps for dual functions of enhanced separation and throughput of red blood cells,” Sci. Rep. 6, 22934 (2016).
- Zhang et al. (2015) Z. Zhang, E. Henry, G. Gompper, and D. A. Fedosov, “Behavior of rigid and deformable particles in deterministic lateral displacement devices with different post shapes,” J. Chem. Phys. 143, 243145 (2015).
- Krüger et al. (2014) T. Krüger, D. Holmes, and P. V. Coveney, “Deformability-based red blood cell separation in deterministic lateral displacement devices - a simulation study,” Biomicrofluidics 8, 054114 (2014).
- Quek et al. (2011) R. Quek, D. V. Le, and K.-H. Chiam, “Separation of deformable particles in deterministic lateral displacement devices,” Phys. Rev. E 83, 056301 (2011).
- Holmes et al. (2014) D. Holmes, G. Whyte, J. Bailey, N. Vergara-Irigaray, A. Ekpenyong, J. Guck, and T. Duke, “Separation of blood cells with differing deformability using deterministic lateral displacement,” Interface Focus 4, 20140011 (2014).
- Ripperger and Altmann (2002) S. Ripperger and J. Altmann, “Crossflow microfiltration – state of the art,” Sep. Purif. Technol. 26, 19–31 (2002).
- Al-Fandi et al. (2011) M. Al-Fandi, M. Al-Rousan, M. A. K. Jaradat, and L. Al-Ebbini, “New design for the separation of microorganisms using microfluidic deterministic lateral displacement,” Robot. Com.-Int. Manuf. 27, 237–244 (2011).
- Fedosov et al. (2012) D. A. Fedosov, J. Fornleitner, and G. Gompper, “Margination of white blood cells in microcapillary flow,” Phys. Rev. Lett. 108, 028104 (2012).
- Gompper and Kroll (2004) G. Gompper and D. M. Kroll, “Triangulated-surface models of fluctuating membranes,” in Statistical mechanics of membranes and surfaces, edited by D. R. Nelson, T. Piran, and S. Weinberg (World Scientific, Singapore, 2004) 2nd ed., pp. 359–426.
- Noguchi and Gompper (2005) H. Noguchi and G. Gompper, “Shape transitions of fluid vesicles and red blood cells in capillary flows,” Proc. Natl. Acad. Sci. USA 102, 14159–14164 (2005).
- Fedosov et al. (2010a) D. A. Fedosov, B. Caswell, and G. E. Karniadakis, “A multiscale red blood cell model with accurate mechanics, rheology, and dynamics,” Biophys. J. 98, 2215–2225 (2010a).
- Fedosov et al. (2010b) D. A. Fedosov, B. Caswell, and G. E. Karniadakis, “Systematic coarse-graining of spectrin-level red blood cell models,” Comput. Meth. Appl. Mech. Eng. 199, 1937–1948 (2010b).
- Fedosov et al. (2014) D. A. Fedosov, H. Noguchi, and G. Gompper, “Multiscale modeling of blood flow: from single cells to blood rheology,” Biomech. Model. Mechanobiol. 13, 239–258 (2014).
- Seung and Nelson (1988) H. S. Seung and D. R. Nelson, “Defects in flexible membranes with crystalline order,” Phys. Rev. A 38, 1005–1018 (1988).
- Gompper and Kroll (1996) G. Gompper and D. M. Kroll, “Random surface discretizations and the renormalization of the bending rigidity,” J. Phys. I France 6, 1305–1320 (1996).
- Helfrich (1973) W. Helfrich, “Elastic properties of lipid bilayers: theory and possible experiments,” Z. Naturforschung C 28, 693–703 (1973).
- Hoogerbrugge and Koelman (1992) P. J. Hoogerbrugge and J. M. V. A. Koelman, “Simulating microscopic hydrodynamic phenomena with dissipative particle dynamics,” Europhys. Lett. 19, 155–160 (1992).
- Español and Warren (1995) P. Español and P. Warren, “Statistical mechanics of dissipative particle dynamics,” Europhys. Lett. 30, 191–196 (1995).
- Español and Revenga (2003) P. Español and M. Revenga, “Smoothed dissipative particle dynamics,” Phys. Rev. E 67, 026705 (2003).
- Müller et al. (2015) K. Müller, D. A. Fedosov, and G. Gompper, “Smoothed dissipative particle dynamics with angular momentum conservation,” J. Comp. Phys. 281, 301–315 (2015).
- Vázquez-Quesada et al. (2009) A. Vázquez-Quesada, M. Ellero, and P. Español, “Consistent scaling of thermal fluctuations in smoothed dissipative particle dynamics,” J. Chem. Phys. 130, 034901 (2009).
- Mauer et al. (2018) J. Mauer, S. Mendez, L. Lanotte, F. Nicoud, M. Abkarian, G. Gompper, and D. A. Fedosov, “Flow-induced transitions of red blood cell shapes under shear,” Phys. Rev. Lett. 121, 118103 (2018).
- Fedosov et al. (2011) D. A. Fedosov, W. Pan, B. Caswell, G. Gompper, and G. E. Karniadakis, “Predicting human blood viscosity in silico,” Proc. Natl. Acad. Sci. USA 108, 11772–11777 (2011).
- Loutherback et al. (2010) K. Loutherback, K. S. Chou, J. Newman, J. Puchalla, R. H. Austin, and J. C. Sturm, “Improved performance of deterministic lateral displacement arrays with triangular posts,” Microfluid. Nanofluid. 9, 1143–1149 (2010).
- Abkarian et al. (2002) M. Abkarian, C. Lartigue, and A. Viallat, “Tank treading and unbinding of deformable vesicles in shear flow: determination of the lift force,” Phys. Rev. Lett. 88, 068103 (2002).
- Messlinger et al. (2009) S. Messlinger, B. Schmidt, H. Noguchi, and G. Gompper, “Dynamical regimes and hydrodynamic lift of viscous vesicles under shear,” Phys. Rev. E 80, 011901 (2009).
- Lanotte et al. (2016) L. Lanotte, J. Mauer, S. Mendez, D. A. Fedosov, J.-M. Fromental, V. Claveria, F. Nicoud, G. Gompper, and M. Abkarian, “Red cells’ dynamic morphologies govern blood shear thinning under microcirculatory flow conditions,” Proc. Natl. Acad. Sci. USA 113, 13289–13294 (2016).
- Popel and Johnson (2005) A. S. Popel and P. C. Johnson, “Microcirculation and hemorheology,” Annu. Rev. Fluid Mech. 37, 43–69 (2005).