Physical properties of the X-ray gas as a dynamical diagnosis for galaxy clusters
Abstract
We analysed XMM-Newton EPIC data for 53 galaxy clusters.
Through 2D spectral maps, we provide the most detailed and extended view of the spatial
distribution of temperature (kT), pressure (P), entropy (S)
and metallicity (Z) of galaxy clusters to date with the aim of correlating the dynamical state
of the system to six cool-core diagnoses from the literature.
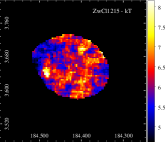
With the objective of building 2D maps and resolving structures in kT, P, S and Z, we divide the data
in small regions from which spectra can be extracted.
Our analysis shows that when clusters are spherically symmetric the
cool-cores (CC) are preserved, the systems are relaxed with little
signs of perturbation, and most of the CC criteria agree. The
disturbed clusters are elongated, show clear signs of interaction in
the 2D maps, and most do not have a cool-core.
However, 16 well studied clusters classified as CC by at least four criteria
show spectral maps that appear disturbed.
All of these clusters but one
show clear signs of recent mergers, with a complex structure and geometry but with
a cool-core that remains preserved.
Thus, although very useful for CC characterization, most diagnoses are too simplistic to reproduce the overall
structure and dynamics of galaxy clusters, and therefore the selection of relaxed systems
according to these criteria may affect mass estimates. The complex structure of galaxy clusters can be
reliably assessed through the 2D maps presented here.
keywords:
galaxies: clusters: general – galaxies: clusters: intracluster medium1 Introduction
Clusters of galaxies are the largest bound structures in the Universe, and in the CDM model they are formed through the mergers of smaller structures. However, halos of comparable mass also occasionally merge. Simulations of the hierarchical scenario show that consequently substructures should be common in galaxy clusters. The degree of substructure therefore provides information on the dynamical state and processes that took place during cluster formation.
A large fraction of galaxy clusters that have been imaged with X-ray telescopes show clear evidence of a centrally peaked surface brightness profile. The central cooling-times for these systems are much shorter than the Hubble time and a temperature drop is observed in the centre, typically reaching one-third of the virial temperature (Peterson et al., 2003; Vikhlinin et al., 2005). These systems, long known as cooling-flow clusters (Fabian, 1994), are now referred to as cool-core (CC, hereafter) clusters (Molendi & Pizzolato, 2001).
A crucial aspect here is a proper definition of a cool-core cluster, since a variety of cooling criteria have been proposed to separate CC and non-cool core (NCC, hereafter) clusters, and results can occasionally diverge. In X-rays, classification attempts are generally based on core properties because cluster centres are more easily accessible. These indicators are typically based on a central temperature drop (e.g., Burns et al., 2008), a central cooling time shorter than the Hubble time (e.g., Bauer et al., 2005), or a significant mass deposition (Chen et al., 2007). Hudson et al. (2010) compared 16 cool-core criteria with the aim of determining a physical property that could unambiguously separate relaxed from disturbed clusters. To segregate CC and NCC clusters, they found that the cooling time () is the best parameter for low redshift clusters with high quality data, and that cuspiness is the best parameter for high redshift clusters. Although these different cooling estimators consider the cool-core phenomenon as a bimodal feature (CC or NCC), several works have distinguished three regimes of cooling (e.g., Bauer et al., 2005; Leccardi et al., 2010), with an intermediate category suggesting a transition from NCC to CC systems.
Angulo et al. (2012) showed that cosmological conclusions based on galaxy cluster surveys depend on the wavelength used for cluster selection. This issue has been addressed in the last few years with the availability of cluster samples selected through the Sunyaev-Zel’dovich effect by the Planck satellite. The signal of thermal SZ (SZ, Sunyaev & Zeldovich, 1972) effect depends on the Compton-y parameter which is proportional to the electron pressure (), while in X-ray selected samples, the surface brightness depends quadratically on the electron number density (). Hence, the fraction of CCs in X-ray samples is likely overestimated. Due to this difference on the gas density, there is currently a debate on whether the two experiments are detecting the same population of clusters, since X-ray surveys are more prone to detect centrally peaked galaxy clusters. Indeed, it has been shown that X-ray flux limited samples have larger fractions of CC clusters in comparison to Planck samples (e.g., Rossetti et al., 2016). This result was interpreted as the CC bias affecting X-ray selection (Eckert et al., 2011).
For galaxy clusters to be used as cosmological probes, they must be dynamically relaxed, since non-gravitational processes can result in the under or overestimation of the mass. The comparison of core properties with morphological properties shows that more disturbed systems tend to have less well defined cores (Buote & Tsai, 1996; Bauer et al., 2005). Thus, there have been attempts to correlate dynamical properties with simple CC diagnoses as those mentioned before.
Recently, Lopes et al. (2018) combined optical and X-ray measurements, and showed that the offset between the brightest cluster galaxy (hereafter BCG) and the X-ray centroid or the magnitude gap between the first and the second BCGs are good and simple measures to assess cluster dynamical states. Another way to separate relaxed from disturbed systems is through the degree of substructures. The presence of substructures is a clear sign of incomplete relaxation in a cluster, and X-ray observations of substructures in galaxy clusters are imprints of the recent and ongoing formation process (Jones & Forman, 1999; Jeltema et al., 2005; Laganá et al., 2010; Andrade-Santos et al., 2012). However, estimates of cluster substructures vary from 20% up to 80% depending on the methods employed for substructure detection (e.g., Kolokotronis et al., 2001).
Although very useful for CC characterisation, the criteria adopted in the literature (e.g., Andrade-Santos et al., 2017; Hudson et al., 2010) account for the overall structure of galaxy clusters in a too simplistic way. Aiming at a full spectral analysis, we show for the first time 2D maps of the spatial distribution of temperature (kT), pseudo-entropy (S), pseudo-pressure (P) and metallicity (Z) for a large sample of 53 galaxy clusters. These clusters belong to SZ and X-ray samples and have been used as cosmological tools. Our aim is to obtain a clear dependence of these maps with the cluster dynamical state, and to correlate these properties with six important CC diagnoses considered in Lopes et al. (2018). We highlight that the maps reveal the detailed and complex structure of galaxy clusters that can be missed in CC diagnoses tools.
A large number of simulations are necessary to account for the variety of properties observed in this large sample, and this will be the topic of a future paper (Machado et al. in preparation). We are also performing a detailed analysis of the dynamical properties of a subsample of these clusters with a large number of galaxy redshifts available (Biviano et al. in preparation).
The paper is organised as follows. In Section 2 we present the sample and data reduction and the method to construct the 2D maps. In Section 3 we show our results, and we discuss them in Section 4. Finally, we conclude on our findings in Section 5. We present notes on individual clusters in Appendix A. In this work, we assume a flat CDM Universe with , and km s-1 Mpc-1. All errors are given at the level.
2 The data
2.1 Sample and data Reduction
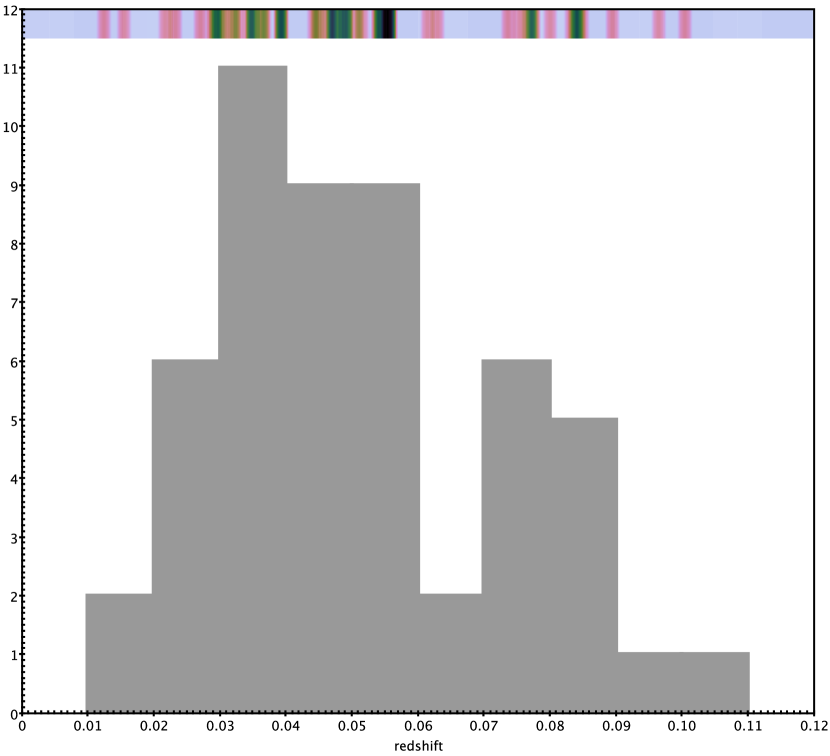
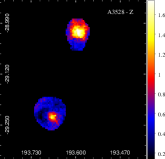
This work is based on a sample of clusters studied in Lopes et al. (2018), limited to , with publicly available XMM-Newton data. Lopes et al. (2018) used SZ and X-ray samples presented in Andrade-Santos et al. (2017) with optical data available. Out of 72 clusters analysed in Lopes et al. (2018), 55 systems had XMM-Newton data in the archive, but the exposure times for two of them were not sufficient to produce 2D maps. Thus, we ended-up with 53 clusters for which we studied the global spatial distribution of the temperature, metal abundance, entropy and pressure through 2D spectral maps. The full list of clusters under study is given in Tab. 1 and the redshift histogram of the sample is shown in Fig. 1. We highlight that there are secondary subclusters, that we kept separately in Tab. 1 as done in Lopes et al. (2018), but most of the times they are in the same X-ray observation as the main cluster and are shown together with the main cluster in some of the Figs. 1-10.
Data reduction was done with SAS version 16.1.0 (July 2017) and calibration files updated to 2017 July. Background flares were identified and rejected by applying a 1.8 clipping method to the count rate histogram of the the light curves in the energy range of [110] keV. Point sources were detected by visual inspection, confirmed in the High Energy Catalogue 2XMMi Source, and excluded from our analysis.
To take into account each detector background contribution, we obtained a background spectrum in an outer annulus of the observation in the [10-12] keV energy band. A corresponding background spectrum was also extracted from the blank sky background file by Read & Ponman (2003) and then rescaled to obtain a normalisation parameter that will be used in the spectral fits.
The spectral analysis was performed in the [0.7-7.0] keV energy band and we also excluded the [1.2-1.9] keV band to avoid any influence from Al and Si lines. For the spectral fits, the spectra were grouped to have at least 15 counts per spectral bin and we used XSPEC v12.10.0 for fitting. In this study the MEKAL XSPEC thermal spectral model (Kaastra & Mewe, 1993) is used to model the emission of an optically-thin plasma, and WABS (Balucinska-Church & McCammon, 1992; Morrison & McCammon, 1983) to model photoelectric absorption. We fixed the redshift and the Galactic absorption values (see Tab. 1), letting all other parameters (e.g. temperature, metallicity and normalization) vary. Abundances were measured assuming the ratios from Asplund et al. (2009).
| Cluster | Planck Name | RA | DEC | z | ObsID | ||
|---|---|---|---|---|---|---|---|
| (J2000) | (J2000) | (s) | () | ||||
| A2734 | 2.84036 | -28.85404 | 0.0613 | 0675470801 | 17519 | 1.39 | |
| A85 | G115.16-72.09 | 10.45996 | -9.30265 | 0.0555 | 0723802101 | 101400 | 2.78 |
| A119 | G125.58-64.14 | 14.06754 | -1.24972 | 0.0441 | 0505211001 | 13916 | 3.54 |
| EXO0422 | 66.46318 | -8.55954 | 0.0392 | 0300210401 | 40507 | 7.86 | |
| A496 | G209.56-36.49 | 68.40797 | -13.26168 | 0.0326 | 0506260401 | 78919 | 3.78 |
| S0540 | 85.02782 | -40.83657 | 0.0365 | 0149420101 | 18217 | 3.16 | |
| A3376 | G246.52-26.05 | 90.42327 | -39.98886 | 0.0461 | 0151900101 | 47206 | 4.82 |
| A3391 | 96.58534 | -53.69329 | 0.0554 | 0505210401 | 27915 | 5.65 | |
| A3395 | G263.20-25.21 | 96.70078 | -54.54923 | 0.0514 | 0400010301 | 29910 | 6.70 |
| bA3395 | 96.90003 | -54.44629 | 0.0505 | 0400010301 | 29910 | 6.70 | |
| A754 | 137.33525 | -9.68431 | 0.0543 | 0556200501 | 92270 | 4.84 | |
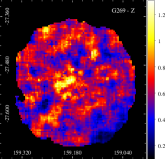
| G269.51+26.42 | 159.17049 | -27.52653 | 0.0124 | 0206230101 | 68554 | 4.90 | |
| USGCS152 | 162.60879 | -12.84501 | 0.0154 | 0146510301 | 40921 | 3.87 | |
| A1367 | G234.59+73.01 | 176.18399 | 19.70444 | 0.0216 | 0061740101 | 33208 | 1.77 |
| ZwCl1215 | G282.49+65.17 | 184.42165 | 3.65612 | 0.0768 | 0300211401 | 29215 | 1.72 |
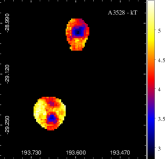
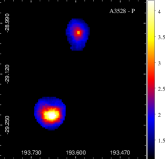
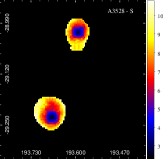
| A3528n | G303.75+33.65 | 193.59252 | -29.01299 | 0.0539 | 0030140101 | 17205 | 6.38 |
| A3528s | 193.66960 | -29.22793 | 0.0539 | 0030140101 | 17205 | 6.38 | |
| A1644n | 194.45546 | -17.27307 | 0.0471 | 0010420201 | 22808 | 4.17 | |
| A1644s | 194.29821 | -17.40932 | 0.0471 | 0010420201 | 22808 | 4.17 | |
| A3532 | 194.34180 | -30.36371 | 0.0558 | 0030140301 | 16895 | 6.43 | |
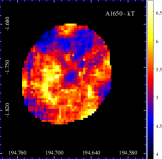
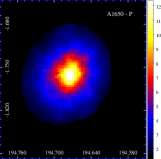
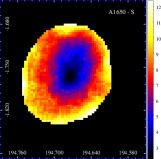
| A1650 | G306.68+61.06 | 194.67264 | -1.76207 | 0.0842 | 0093200101 | 43103 | 1.35 |
| A1651 | G306.80+58.60 | 194.84308 | -4.19592 | 0.0848 | 0203020101 | 26646 | 1.52 |
| Coma | G057.33+88.01 | 194.94856 | 27.95189 | 0.0232 | 0300530301 | 31015 | 0.85 |
| A3558 | G311.99+30.71 | 201.98677 | -31.49551 | 0.0475 | 0107260101 | 44615 | 4.05 |
| bA3558 | 202.44904 | -31.60724 | 0.0490 | 0651590201 | 26917 | 4.05 | |
| A3560 | 203.11565 | -33.14266 | 0.0489 | 0205450201 | 45522 | 4.27 | |
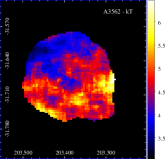
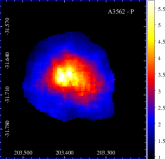
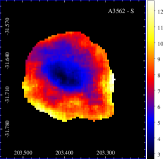
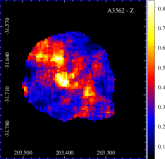
| A3562 | 203.39470 | -31.67291 | 0.0489 | 0105261301 | 47166 | 3.76 | |
| A1775 | 205.45360 | 26.37219 | 0.0754 | 0108460101 | 33021 | 1.04 | |
| A3571 | G316.34+28.54 | 206.86713 | -32.86611 | 0.0393 | 0086950201 | 33642 | 4.25 |
| A1795 | G033.78+77.16 | 207.21963 | 26.59200 | 0.0629 | 0097820101 | 66559 | 1.19 |
| MKW8 | 220.16445 | 3.47031 | 0.0269 | 0300210701 | 23610 | 2.40 | |
| A2029 | G006.47+50.54 | 227.73382 | 5.74455 | 0.0774 | 0551780301 | 46815 | 3.25 |
| A2052 | 229.18537 | 7.02162 | 0.0349 | 0401520501 | 22356 | 2.70 | |
| A2061 | 230.30289 | 30.63350 | 0.0773 | 0721740101 | 50000 | 1.69 | |
| MKW3s | 230.46593 | 7.70879 | 0.0448 | 0723801501 | 119600 | ||
| A2065 | G042.82+56.61 | 230.62280 | 27.70521 | 0.0735 | 0202080201 | 34110 | 3.03 |
| A2063 | 230.77138 | 8.60957 | 0.0344 | 0550360101 | 28615 | 2.66 | |
| A2142 | G044.22+48.68 | 239.58792 | 27.22996 | 0.0894 | 0674560201 | 59440 | 3.78 |
| A2147 | 240.55862 | 15.97118 | 0.0365 | 0505210601 | 11911 | 3.39 | |
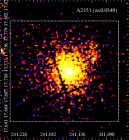
| A2151 | 241.14913 | 17.72143 | 0.0349 | 0147210101 | 29946 | 3.34 | |
| AWM4 | 241.23602 | 23.93268 | 0.0320 | 0093060401 | 21125 | 5.14 | |
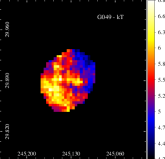
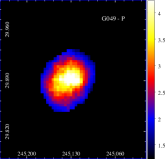
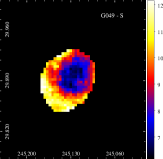
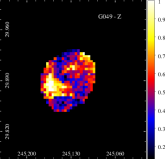
| G049.33+44.38 | 245.12627 | 29.89331 | 0.0964 | 0692930901 | 11917 | 2.58 | |
| A2199 | G062.92+43.70 | 247.15930 | 39.55093 | 0.0306 | 0723801101 | 57000 | 0.89 |
| A2244 | G056.81+36.31 | 255.67738 | 34.06060 | 0.1004 | 0740900101 | 28000 | 1.88 |
| A2249 | G057.61+34.94 | 257.44080 | 34.45566 | 0.0838 | 0827010501 | 27000 | 2.21 |
| A2255 | G093.91+34.90 | 258.18160 | 64.06303 | 0.0799 | 0112260801 | 21051 | 2.50 |
| NGC6338 | 258.84579 | 57.41119 | 0.0290 | 0792790101 | 13600 | 2.23 | |
| bNGC6338 | 258.84653 | 57.43462 | 0.0291 | 0792790101 | 13600 | 2.23 | |
| A2572 | 349.30335 | 18.70286 | 0.0392 | 0762950201 | 26000 | 4.03 | |
| A2597 | 351.33235 | -12.12388 | 0.0831 | 0723801701 | 113170 | 2.48 | |
| A2626 | 354.12631 | 21.14673 | 0.0558 | 0148310101 | 41364 | 5.50 | |
| A4038 | 356.92869 | -28.14290 | 0.0298 | 0723800801 | 67000 | 4.25 | |
| A4059 | 359.25423 | -34.75899 | 0.0494 | 0723800901 | 98093 | 1.21 |
2.2 2D Spectral Maps
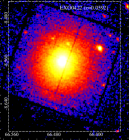
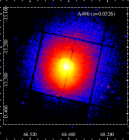
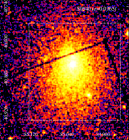
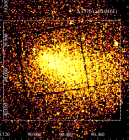
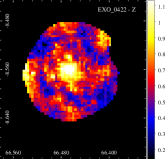
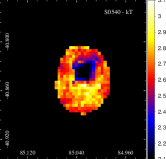
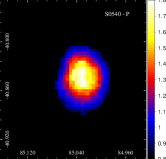
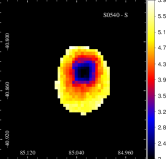
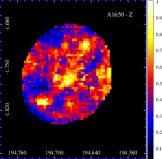
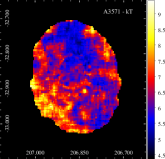
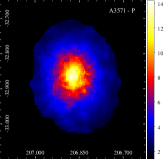
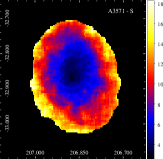
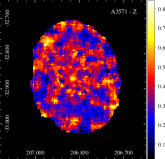
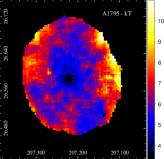
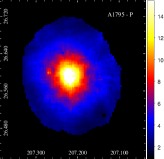
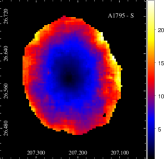
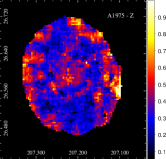
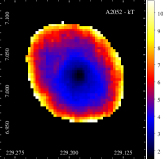
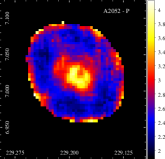
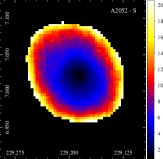
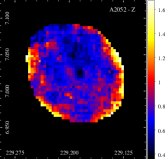
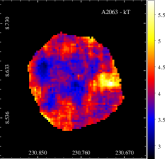
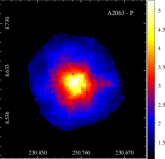
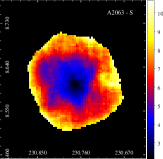
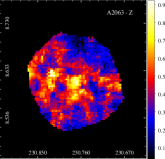
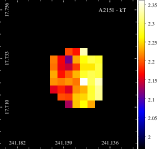
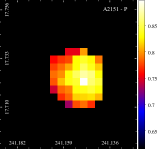
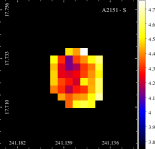
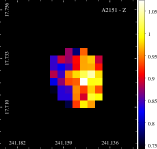
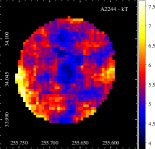
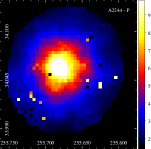
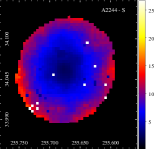
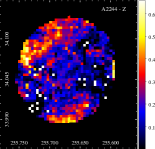
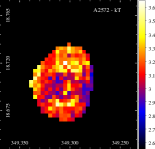
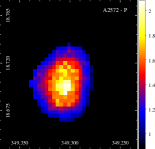
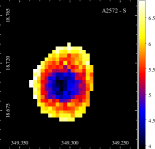
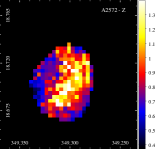
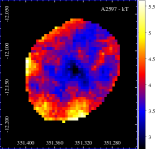
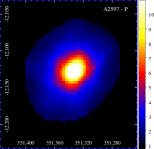
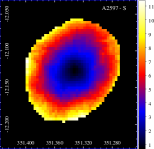
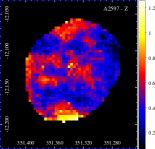
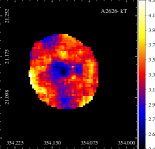
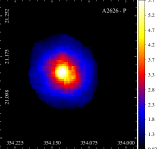
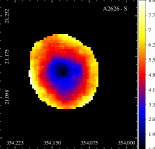
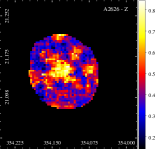
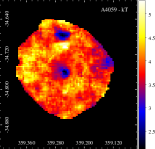
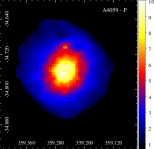
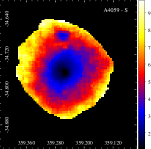
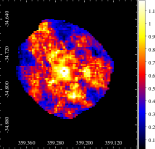
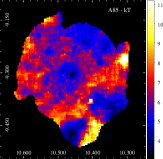
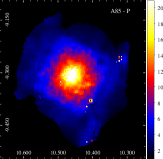
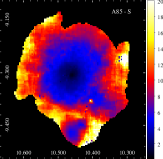
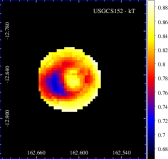
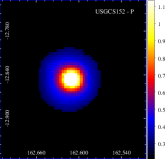
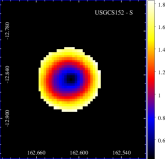
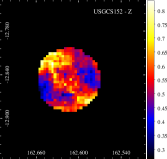
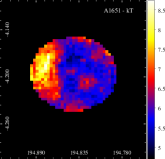
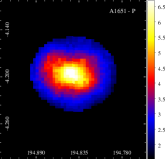
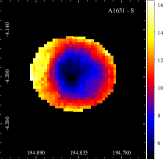
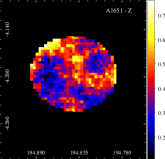
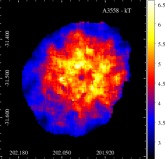
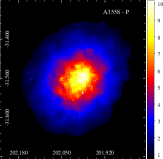
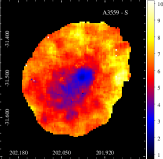
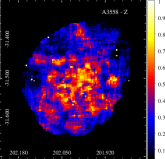
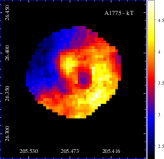
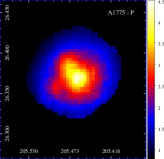
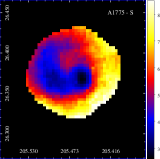
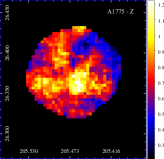
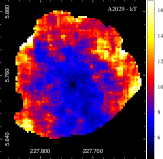
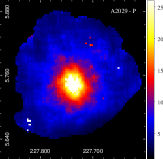
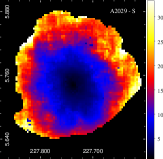
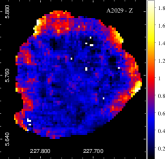
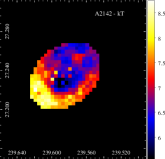
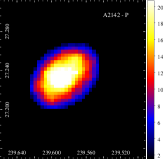
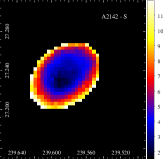
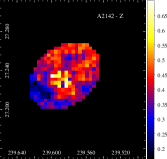
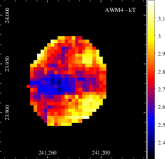
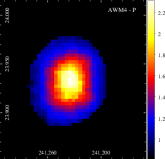
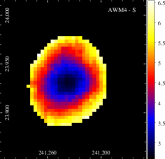
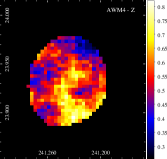
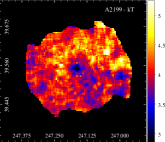
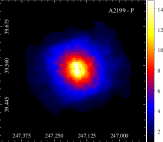
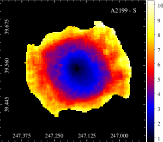
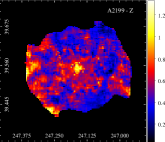
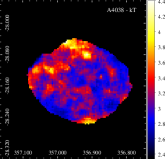
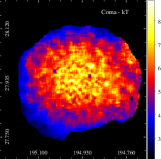
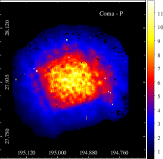
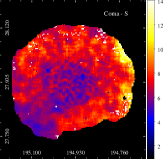
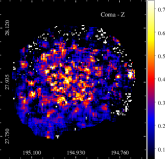
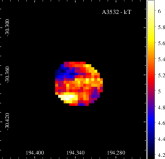
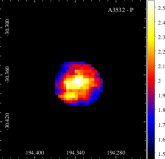
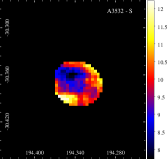
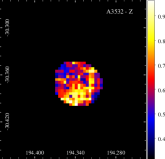
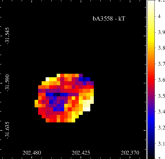
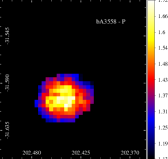
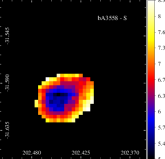
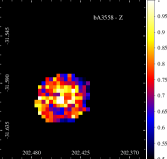
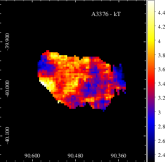
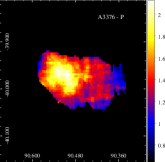
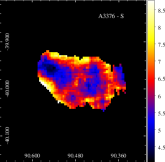
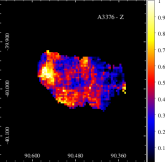
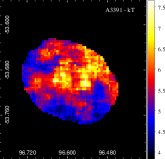
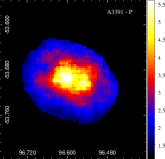
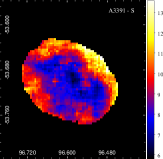
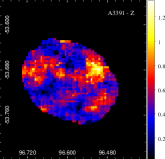
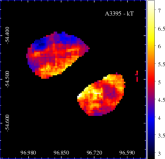
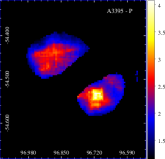
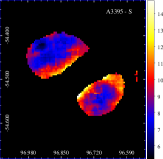
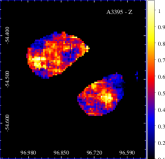
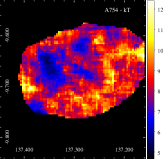
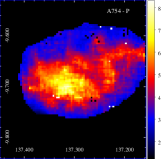
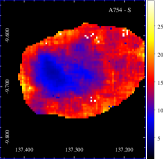
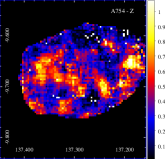
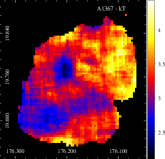
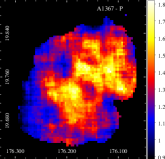
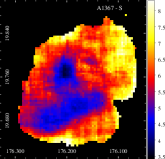
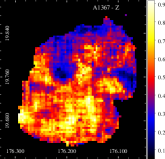
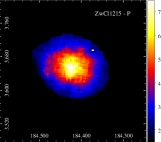
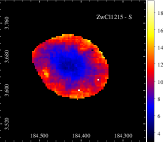
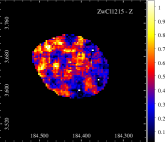
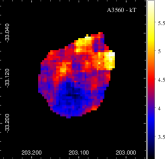
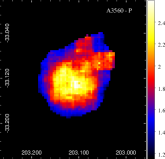
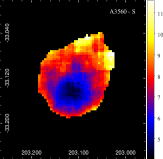
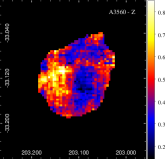
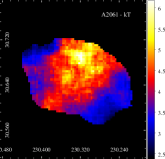
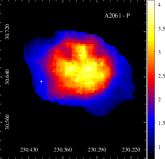
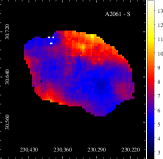
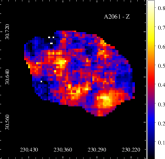
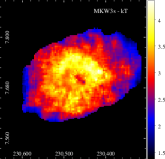
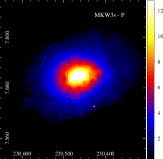
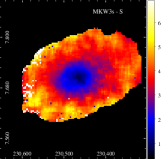
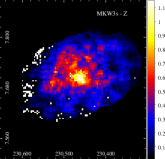
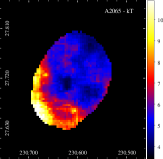
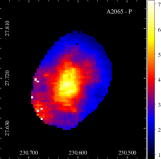
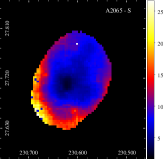
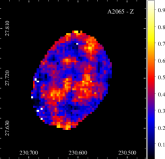
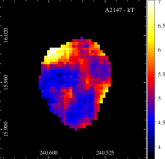
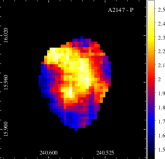
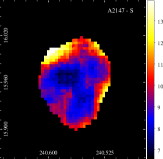
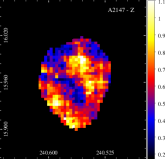
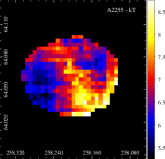
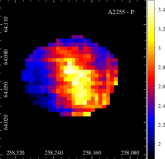
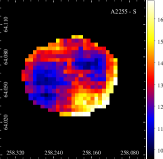
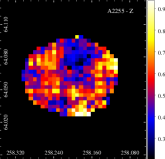
We have derived 2D temperature (kT), metallicity (Z), pseudo-entropy (, where is the Intensity in net counts/arcsec2) and pseudo-pressure () maps for these 53 clusters. This was achieved by dividing the data into small regions from which spectra can be extracted. The 2D maps were made in a grid, where each pixel is 512 512 XMM-Newton EPIC physical pixels. In each pixel we set a minimum count number of 1500 (after background subtraction, corresponding to a S/N of almost 40), necessary for obtaining a spectral fit. If we do not reach the minimum count number in a pixel, we try a square region of 3 3 pixels; and if we still do not have the minimum number of counts, we try a 5 5 pixel region. If we still do not have enough counts, the pixel is ignored and we proceed to the next neighbouring pixel. This is done for all the pixels in the grid. When we have enough counts, the spectra of the three EPIC instruments (MOS1, MOS2 and pn) are then simultaneously fitted as described above, and the best temperature and metallicity values are attributed to the central pixel. This procedure (already described in Durret et al., 2010; Durret et al., 2011; Laganá et al., 2015) allows us to perform a reliable spectral analysis in each spectral bin, in order to derive kT, Z, S and P maps.
3 Results
Besides possible deviations from symmetry, 2D maps can reveal complex structures. The temperature maps are commonly used in studies of galaxy clusters and groups since they trace the recent dynamical history of the system.
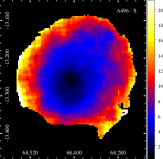
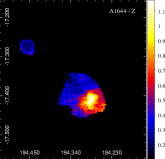
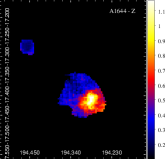
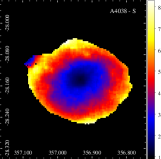
The entropy map for a system in equilibrium should be symmetrical around the centre and exhibit increasing values towards the outskirts of the cluster. Low-entropy gas can be displaced from the centre either due to instabilities like cold-fronts (e.g., Markevitch & Vikhlinin, 2007) or to gas stripping (Finoguenov et al., 2004). Areas of high entropy gas are produced by local heating, most likely AGNs.
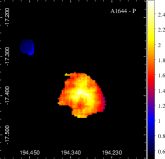
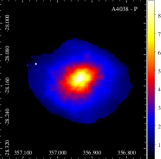
The pressure structure of the ICM is sensitive to the combined action of gravitational and non-gravitational physical processes affecting galaxy clusters.The ICM pressure distribution is directly connected to the cluster potential well, and thus to the cluster total mass. Pressure fluctuations trace departure from local equilibrium, such as that produced by shocks (Markevitch et al., 2002; Simionescu et al., 2009) and pressure waves (Fabian et al., 2003; Schuecker et al., 2004).
To date, X-ray and SZ observations of galaxy clusters, in line with the results from numerical simulations (e.g., Piffaretti & Valdarnini, 2008), suggest that the ICM radial pressure profiles follow a nearly universal shape within (Arnaud et al., 2010).
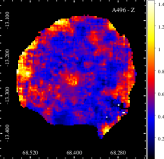
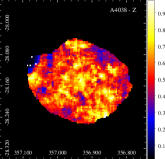
The distribution of heavy elements in the ICM provides important information on the relevance of mergers, AGN outbursts and ram-pressure stripping. In recent years it has been possible to derive metallicity profiles for a number of clusters and those profiles correlate with the CC status. It has been found that CC systems display a centrally peaked metallicity distribution, while NCC clusters are characterised by a nearly flat distribution (De Grandi & Molendi, 2001; Leccardi et al., 2010).
We use four diagnoses from Andrade-Santos et al. (2017) to identify CC clusters: (i) the concentration parameter in the (0.15-1.0) range (CSB), (ii) the ratio of the integrated projected emissivity profile within 40 kpc to that within 400 kpc (i. e., the concentration parameter in the 40-400 kpc range, CSB4), (iii) the cuspiness of the gas density profile (), and (iv) the central gas density (). We also include two more criteria from Lopes et al. (2018): (v) the magnitude gap between the first and second BCG (), and (vi) the BCG offset to the X-ray centre.
Adopting the values presented in Lopes et al. (2018), we consider as CC, as shown in Tab. 2, the systems with:
-
1.
-
2.
-
3.
-
4.
-
5.
-
6.
offset < 0.01
By visual inspection of our 2D maps, we classify the clusters in relaxed versus disturbed systems to correlate this classification with the different methods used to separate clusters in CC or NCC systems. We defined a relaxed cluster as having round or elliptical isophotes, little or no sloshing or cold fronts, and no signs of a recent merger. We thus divided our sample in four different groups, as shown in Tab. 2
-
•
CC-relaxed: systems where at least four out of six criteria classify the cluster as CC and which appear relaxed in our 2D map inspection;
-
•
CC-disturbed: systems where at least four out of six criteria characterize the system as CC, but with spectral maps appearing disturbed;
-
•
NCC-relaxed: systems classified as NCC by at least three of the six criteria and which appear relaxed in our 2D map inspection;
-
•
NCC-disturbed: systems classified as NCC by at least three of the six criteria and showing clear signs of perturbation in the maps.
. Columns list the cluster name, CSB, CSB4, , , , the BCG offset to the X-ray centre (see text), and the dynamical state according to the 2D maps. Cluster CSB CSB4 Offset 2D maps CC - relaxed A2734 CC CC CC CC CC CC relaxed EXO0422 CC CC CC CC CC relaxed S0540 CC CC CC CC CC relaxed G269.51+26.42 CC CC CC CC relaxed A3528n CC CC CC CC CC CC relaxed A3528s CC CC CC CC CC CC relaxed A1650 CC CC CC CC CC CC relaxed A3571 CC CC CC CC CC CC relaxed A1795 CC CC CC CC CC CC relaxed A2052 CC CC CC CC CC CC relaxed A2063 CC CC CC CC CC CC relaxed A2151 CC CC CC CC CC relaxed A2244 CC CC CC CC CC CC relaxed A2572 CC CC CC CC relaxed A2597 CC CC CC CC CC CC relaxed A2626 CC CC CC CC CC CC relaxed A4059 CC CC CC CC CC CC relaxed CC - disturbed A85 CC CC CC CC CC CC disturbed A496 CC CC CC CC CC CC disturbed USGCS152 CC CC CC CC CC CC disturbed A1644n CC CC CC CC CC disturbed A1644s CC CC CC CC CC disturbed A1651 CC CC CC CC disturbed A3558 CC CC CC CC CC CC disturbed A3562 CC CC CC CC disturbed A1775 CC CC CC CC CC CC disturbed A2029 CC CC CC CC CC CC disturbed A2142 CC CC CC CC disturbed AWM4 CC CC CC CC CC CC disturbed A2199 CC CC CC CC CC disturbed NGC6338 CC CC CC CC CC disturbed bNGC6338 CC CC CC CC CC disturbed A4038 CC CC CC CC CC disturbed NCC - relaxed Coma CC relaxed A3532 CC relaxed bA3558 CC CC CC relaxed MKW8 CC CC CC relaxed NCC - disturbed A119 disturbed A3376 disturbed A3391 CC disturbed A3395 CC CC disturbed bA3395 CC CC disturbed A754 CC CC CC disturbed A1367 CC disturbed ZwCl1215 CC CC disturbed A3560 disturbed A2061 disturbed MKW3s CC CC CC disturbed A2065 CC disturbed A2147 disturbed G049.33+44.38 CC disturbed A2249 CC disturbed A2255 disturbed

4 Discussion
Based on the six criteria to classify a system as CC, and on our 2D maps, we discuss our results in this Section, and analyse the dynamical states of the clusters. We give specific details for each of the 53 systems in Appendix A.
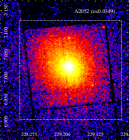
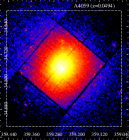
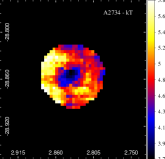
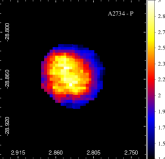
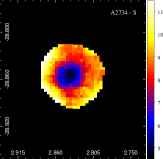
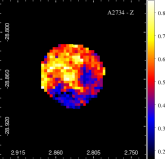
There are 17 CC-relaxed systems, for which the 2D maps are shown in Figs. 3, 4, and 5. Four of them (G269, A3571, A2151, and A2572, ), although classified as CC, don’t show a cool centre in the kT map. For many of these clusters, the cool centre shows a deviation from sphericity. In fact, there are only five clusters that show almost spherical CC: A2734, A3528, A2052, A2626, and A4059. However, looking at their P maps, A2734 and A2052 show signs of interaction. A2734 shows some elongation that is reported in Ramella et al. (2007). The pressure map of A2052 shows a high pressure feature in its centre, very similar to the one presented in Blanton et al. (2011), that may be a shock region due to the central AGN. We highlight that in about 70% of the local CC population the BCG is radio loud, showing non-thermal radio-jets ejected by the central AGN, which is critical to understand the physics of the central region due to perturbation. The very central region shows clear signs of perturbation, but its overall dynamics are relaxed.
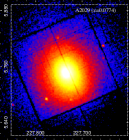
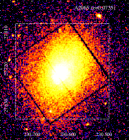
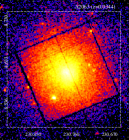
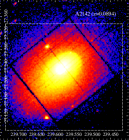
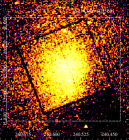
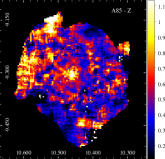
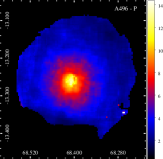
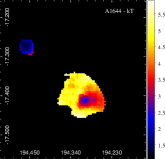
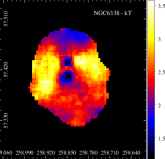
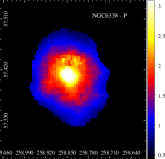
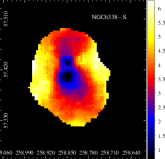
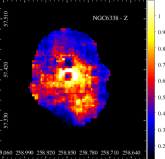
There are 16 CC-disturbed clusters. The maps of these clusters are shown in Figs. 6, 7, and 8. These CC-disturbed clusters are very representative of the details that 2D maps can reveal. They represent 30% of the sample, were characterised as cool-core, and indeed they have a cooler centre, but when analysing their global distribution, the 2D maps show that they have a very complex structure for clusters thought to be globally relaxed, in line with recent numerical simulations from IllustrisTNG (Barnes et al., 2018).
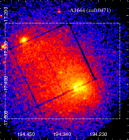
We classify these systems as “disturbed”, and the perturbation is related to merger events and not to AGN feedback. All of them except A2029 are undergoing a merger, are double systems, or have an infalling group. For example, A85 is not spherically symmetric, and Durret et al. (2005) through temperature and metallicity maps, had already shown results of an intense merging activity in the past, revealing that this cluster is not relaxed, even in the central region. A496 has a sloshing spiral arm (Ghizzardi et al., 2014; Laganá et al., 2010; Roediger et al., 2012), indicating a minor merger. The temperature and entropy maps of A1775 also show a cold front as the one reported for A496. A1644 is a double cluster, with a main cluster (A1644s) and a smaller and colder one (A1644n) to the north-east (Johnson et al., 2010). From the comparison with hydrodynamical simulations, these authors suggest that the northern subcluster initiated the core gas sloshing in the main cluster about 700 Myr ago. These 16 systems in our sample show clear signs of recent mergers, with complex structure and geometry but with a CC preserved. We give specific details for each of them, reporting merger events in Appendix A.
This illustrates well the power of 2D X-ray maps to understand in depth the dynamical state of clusters, that can be missed in CC diagnosis tools. For merging clusters, it is possible to go one step further and derive the physical characteristics of the cluster merger (Mach number, age of the merger) by comparing these maps with hydrodynamical numerical simulations. However, to explain well the dynamical history of a cluster, it is necessary to make specific simulations for each object, which is very time-consuming. This was done for several clusters by Machado & Lima Neto (2013, 2015). In a few other cases (see for example the discussion on A85 in the Appendix) there happen to exist simulations that resemble our maps and allow us to interpret the cluster merging history. However, a much larger number of simulations than presently available is needed to account for the variety of properties observed in this large sample. This will be the topic of a future paper (Machado et al. in preparation). A detailed analysis of the dynamical properties of a subsample of these clusters with a large number of galaxy redshifts available is also under development (Biviano et al. in preparation).
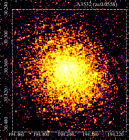
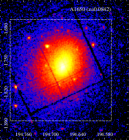
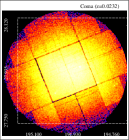
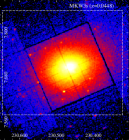
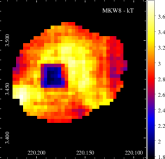
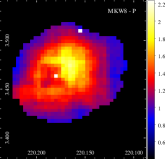
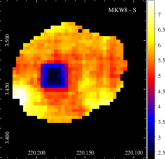
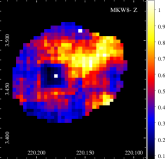
There are only four NCC-relaxed clusters: Coma (G057.33+88.01), A3532, bA3558 and MKW8, shown in Fig. 9. They were classified as non cool-core systems but their maps don’t show any special feature indicating strong signs of perturbation. For two of them (A3532 and bA3558) the observations were not deep enough to produce extended maps, so we cannot draw firm conclusions on these clusters.
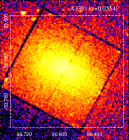
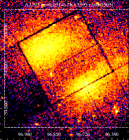
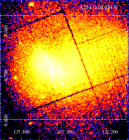
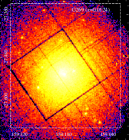
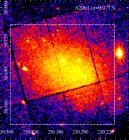
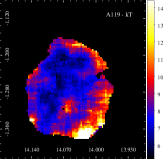
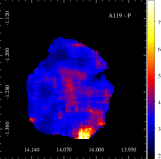
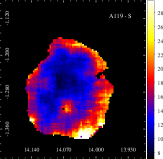
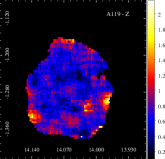
There are 16 systems classified as NCC-disturbed, that are presented in the last part of Tab. 2. We show 2D maps for these clusters in Figs. 10, 11, and 12. They are irregular in shape, elongated, and show clear signs of interaction.
For seven out of these 16 clusters, at least five criteria classify them as NCC (A119, A3376, A3560, A2061, A2065, A2147 and A2255). All of these clusters are merging systems and our maps clearly confirm that these clusters are disturbed and have undergone or are presently undergoing one or several merging events. However, for the other nine clusters, at least one of the criteria give a misleading classification, and for two of them (A754 and MKW3), three criteria (half of the six diagnoses considered in this work) wrongly classify them as CC.
5 Conclusions
In this section we summarize our findings.
-
•
With the aim of comparing the overall dynamical and core properties of a sample of 53 galaxy clusters, the cluster dynamical state was investigated via ICM temperature, pressure, entropy and metallicity maps;
-
•
We compared six simple CC diagnoses with the results derived from our 2D maps, showing that, although very useful for large samples and for CC characterisation, these diagnoses are somewhat too simplistic to account for the overall cluster dynamics;
-
•
We highlight that 2D maps reveal the detailed and complex structure of galaxy clusters that can be missed by CC diagnoses and may affect cluster mass estimates. That is clearly seen in the 16 CC-disturbed systems we discuss in Sect. 4.
-
•
An X-ray analysis provides a unique possibility to measure in detail the ICM showing complex structures;
-
•
2D maps reveal some merging galaxy clusters (A2061, A2255, NGC6338) with shock fronts clearly visible in the sky plane that will be addressed in future numerical simulations with a well defined merger geometry;
-
•
ICM entropy and pressure maps are of great interest because they reveal ICM global properties and record the thermal history of clusters. They are therefore useful quantities for studying the effects of feedback on the cluster environment.
Acknowledgements
We thank the referee for his/her comments on the manuscript. T. F. L. acknowledges financial support from FAPESP and CNPq through grants 2018/02626-8 and 303278/2015-3, respectively. F.D. acknowledges constant support from CNES. PAAL thanks the support of CNPq, grant 308969/2014-6; and CAPES, process number 88881.120856/2016-01.
References
- Akamatsu et al. (2011) Akamatsu H., Hoshino A., Ishisaki Y., Ohashi T., Sato K., Takei Y., Ota N., 2011, PASJ, 63, S1019
- Akamatsu et al. (2017) Akamatsu H., et al., 2017, A&A, 600, A100
- Alvarez et al. (2018) Alvarez G. E., Randall S. W., Bourdin H., Jones C., Holley-Bockelmann K., 2018, ApJ, 858, 44
- Andrade-Santos et al. (2012) Andrade-Santos F., Lima Neto G. B., Laganá T. F., 2012, ApJ, 746, 139
- Andrade-Santos et al. (2017) Andrade-Santos F., et al., 2017, ApJ, 843, 76
- Angulo et al. (2012) Angulo R. E., Springel V., White S. D. M., Jenkins A., Baugh C. M., Frenk C. S., 2012, MNRAS, 426, 2046
- Arnaud et al. (2001) Arnaud M., et al., 2001, A&A, 365, L67
- Arnaud et al. (2010) Arnaud M., Pratt G. W., Piffaretti R., Böhringer H., Croston J. H., Pointecouteau E., 2010, A&A, 517, A92
- Asplund et al. (2009) Asplund M., Grevesse N., Sauval A. J., Scott P., 2009, ARA&A, 47, 481
- Bagchi et al. (2006) Bagchi J., Durret F., Neto G. B. L., Paul S., 2006, Science, 314, 791
- Balucinska-Church & McCammon (1992) Balucinska-Church M., McCammon D., 1992, ApJ, 400, 699
- Bardelli et al. (2002) Bardelli S., Venturi T., Zucca E., De Grandi S., Ettori S., Molendi S., 2002, A&A, 396, 65
- Barnes et al. (2018) Barnes D. J., et al., 2018, MNRAS, 481, 1809
- Bauer et al. (2005) Bauer F. E., Fabian A. C., Sanders J. S., Allen S. W., Johnstone R. M., 2005, MNRAS, 359, 1481
- Blanton et al. (2011) Blanton E. L., Randall S. W., Clarke T. E., Sarazin C. L., McNamara B. R., Douglass E. M., McDonald M., 2011, ApJ, 737, 99
- Böhringer et al. (2000) Böhringer H., et al., 2000, ApJS, 129, 435
- Bourdin et al. (2004) Bourdin H., Sauvageot J.-L., Slezak E., Bijaoui A., Teyssier R., 2004, A&A, 414, 429
- Buote & Tsai (1996) Buote D. A., Tsai J. C., 1996, ApJ, 458, 27
- Burns et al. (1994) Burns J. O., Roettiger K., Ledlow M., Klypin A., 1994, ApJ, 427, L87
- Burns et al. (2008) Burns J. O., Hallman E. J., Gantner B., Motl P. M., Norman M. L., 2008, ApJ, 675, 1125
- Canizares et al. (1983) Canizares C. R., Stewart G. C., Fabian A. C., 1983, ApJ, 272, 449
- Chatzikos et al. (2006) Chatzikos M., Sarazin C. L., Kempner J. C., 2006, ApJ, 643, 751
- Chen et al. (2007) Chen Y., Reiprich T. H., Böhringer H., Ikebe Y., Zhang Y.-Y., 2007, A&A, 466, 805
- Cortese et al. (2004) Cortese L., Gavazzi G., Boselli A., Iglesias-Paramo J., Carrasco L., 2004, A&A, 425, 429
- De Grandi & Molendi (2001) De Grandi S., Molendi S., 2001, ApJ, 551, 153
- Donnelly et al. (2001) Donnelly R. H., Forman W., Jones C., Quintana H., Ramirez A., Churazov E., Gilfanov M., 2001, ApJ, 562, 254
- Durret et al. (2003) Durret F., Lima Neto G. B., Forman W., Churazov E., 2003, A&A, 403, L29
- Durret et al. (2005) Durret F., Lima Neto G. B., Forman W., 2005, A&A, 432, 809
- Durret et al. (2010) Durret F., Laganá T. F., Adami C., Bertin E., 2010, A&A, 517, A94
- Durret et al. (2011) Durret F., Laganá T. F., Haider M., 2011, A&A, 529, A38
- Durret et al. (2013) Durret F., Perrot C., Lima Neto G. B., Adami C., Bertin E., Bagchi J., 2013, A&A, 560, A78
- Ebeling et al. (1995) Ebeling H., Mendes de Oliveira C., White D. A., 1995, MNRAS, 277, 1006
- Eckert et al. (2011) Eckert D., Molendi S., Paltani S., 2011, A&A, 526, A79
- Eckert et al. (2017) Eckert D., et al., 2017, A&A, 605, A25
- Ehlert et al. (2015) Ehlert S., McDonald M., David L. P., Miller E. D., Bautz M. W., 2015, ApJ, 799, 174
- Elkholy et al. (2015) Elkholy T. Y., Bautz M. W., Canizares C. R., 2015, ApJ, 805, 3
- Fabian (1994) Fabian A. C., 1994, ARA&A, 32, 277
- Fabian et al. (2003) Fabian A. C., Sanders J. S., Allen S. W., Crawford C. S., Iwasawa K., Johnstone R. M., Schmidt R. W., Taylor G. B., 2003, MNRAS, 344, L43
- Finoguenov et al. (2004) Finoguenov A., Pietsch W., Aschenbach B., Miniati F., 2004, A&A, 415, 415
- Frank et al. (2013) Frank K. A., Peterson J. R., Andersson K., Fabian A. C., Sanders J. S., 2013, ApJ, 764, 46
- Fukazawa et al. (2004) Fukazawa Y., Makishima K., Ohashi T., 2004, PASJ, 56, 965
- Gastaldello et al. (2003) Gastaldello F., Ettori S., Molendi S., Bardelli S., Venturi T., Zucca E., 2003, A&A, 411, 21
- Ghizzardi et al. (2014) Ghizzardi S., De Grandi S., Molendi S., 2014, A&A, 570, A117
- Giovannini et al. (2009) Giovannini G., Bonafede A., Feretti L., Govoni F., Murgia M., Ferrari F., Monti G., 2009, A&A, 507, 1257
- Gonzalez et al. (2000) Gonzalez A. H., Zabludoff A. I., Zaritsky D., Dalcanton J. J., 2000, ApJ, 536, 561
- Gu et al. (2009) Gu L., et al., 2009, ApJ, 700, 1161
- Hofmann et al. (2016) Hofmann F., Sanders J. S., Nandra K., Clerc N., Gaspari M., 2016, A&A, 585, A130
- Huang & Sarazin (1998) Huang Z., Sarazin C. L., 1998, ApJ, 496, 728
- Hudson et al. (2010) Hudson D. S., Mittal R., Reiprich T. H., Nulsen P. E. J., Andernach H., Sarazin C. L., 2010, A&A, 513, A37
- Ignesti et al. (2018) Ignesti A., Gitti M., Brunetti G., O’Sullivan E., Sarazin C., Wong K., 2018, A&A, 610, A89
- Inoue et al. (2016) Inoue S., Hayashida K., Ueda S., Nagino R., Tsunemi H., Koyama K., 2016, PASJ, 68, S23
- Jeltema et al. (2005) Jeltema T. E., Canizares C. R., Bautz M. W., Buote D. A., 2005, ApJ, 624, 606
- Johnson et al. (2010) Johnson R. E., Markevitch M., Wegner G. A., Jones C., Forman W. R., 2010, ApJ, 710, 1776
- Jones & Forman (1999) Jones C., Forman W., 1999, ApJ, 511, 65
- Kaastra & Mewe (1993) Kaastra J. S., Mewe R., 1993, A&AS, 97, 443
- Kale & Dwarakanath (2012) Kale R., Dwarakanath K. S., 2012, ApJ, 744, 46
- Kolokotronis et al. (2001) Kolokotronis V., Basilakos S., Plionis M., Georgantopoulos I., 2001, MNRAS, 320, 49
- Laganá et al. (2010) Laganá T. F., Andrade-Santos F., Lima Neto G. B., 2010, A&A, 511, A15
- Laganá et al. (2015) Laganá T. F., Lovisari L., Martins L., Lanfranchi G. A., Capelato H. V., Schellenberger G., 2015, A&A, 573, A66
- Lakhchaura et al. (2011) Lakhchaura K., Singh K. P., Saikia D. J., Hunstead R. W., 2011, ApJ, 743, 78
- Lakhchaura et al. (2013) Lakhchaura K., Singh K. P., Saikia D. J., Hunstead R. W., 2013, ApJ, 767, 91
- Leccardi et al. (2010) Leccardi A., Rossetti M., Molendi S., 2010, A&A, 510, A82
- Lee et al. (2015) Lee G.-H., Hwang H. S., Lee M. G., Ko J., Sohn J., Shim H., Diaferio A., 2015, ApJ, 800, 80
- Lopes et al. (2018) Lopes P. A. A., Trevisan M., Laganá T. F., Durret F., Ribeiro A. L. B., Rembold S. B., 2018, MNRAS, 478, 5473
- Macario et al. (2011) Macario G., Markevitch M., Giacintucci S., Brunetti G., Venturi T., Murray S. S., 2011, ApJ, 728, 82
- Machado & Lima Neto (2013) Machado R. E. G., Lima Neto G. B., 2013, MNRAS, 430, 3249
- Machado & Lima Neto (2015) Machado R. E. G., Lima Neto G. B., 2015, MNRAS, 447, 2915
- Marini et al. (2004) Marini F., et al., 2004, MNRAS, 353, 1219
- Markevitch & Vikhlinin (2007) Markevitch M., Vikhlinin A., 2007, Phys. Rep., 443, 1
- Markevitch et al. (1998) Markevitch M., Forman W. R., Sarazin C. L., Vikhlinin A., 1998, ApJ, 503, 77
- Markevitch et al. (2000) Markevitch M., et al., 2000, ApJ, 541, 542
- Markevitch et al. (2002) Markevitch M., Gonzalez A. H., David L., Vikhlinin A., Murray S., Forman W., Jones C., Tucker W., 2002, ApJ, 567, L27
- Matsushita (2011) Matsushita K., 2011, A&A, 527, A134
- Mauduit & Mamon (2007) Mauduit J.-C., Mamon G. A., 2007, A&A, 475, 169
- McNamara et al. (2001) McNamara B. R., et al., 2001, ApJ, 562, L149
- Mernier et al. (2017) Mernier F., et al., 2017, A&A, 603, A80
- Mitsuishi et al. (2012) Mitsuishi I., et al., 2012, PASJ, 64, 18
- Molendi & Pizzolato (2001) Molendi S., Pizzolato F., 2001, ApJ, 560, 194
- Morris & Fabian (2005) Morris R. G., Fabian A. C., 2005, MNRAS, 358, 585
- Morrison & McCammon (1983) Morrison R., McCammon D., 1983, ApJ, 270, 119
- Neumann et al. (2001) Neumann D. M., et al., 2001, A&A, 365, L74
- Nevalainen et al. (2000) Nevalainen J., Markevitch M., Forman W., 2000, ApJ, 536, 73
- Nulsen et al. (2013) Nulsen P. E. J., et al., 2013, ApJ, 775, 117
- O’Sullivan et al. (2007) O’Sullivan E., Vrtilek J. M., Harris D. E., Ponman T. J., 2007, ApJ, 658, 299
- O’Sullivan et al. (2011) O’Sullivan E., Giacintucci S., David L. P., Vrtilek J. M., Raychaudhury S., 2011, MNRAS, 411, 1833
- Oh et al. (2016) Oh S., et al., 2016, ApJ, 832, 69
- Oh et al. (2018) Oh S., et al., 2018, ApJS, 237, 14
- Owers et al. (2011) Owers M. S., Nulsen P. E. J., Couch W. J., 2011, ApJ, 741, 122
- Owers et al. (2017) Owers M. S., et al., 2017, MNRAS, 468, 1824
- Pandge et al. (2012) Pandge M. B., Vagshette N. D., David L. P., Patil M. K., 2012, MNRAS, 421, 808
- Parekh et al. (2015) Parekh V., van der Heyden K., Ferrari C., Angus G., Holwerda B., 2015, A&A, 575, A127
- Peres et al. (1998) Peres C. B., Fabian A. C., Edge A. C., Allen S. W., Johnstone R. M., White D. A., 1998, MNRAS, 298, 416
- Peterson et al. (2003) Peterson J. R., Kahn S. M., Paerels F. B. S., Kaastra J. S., Tamura T., Bleeker J. A. M., Ferrigno C., Jernigan J. G., 2003, ApJ, 590, 207
- Piffaretti & Valdarnini (2008) Piffaretti R., Valdarnini R., 2008, A&A, 491, 71
- Planck Collaboration et al. (2011) Planck Collaboration et al., 2011, A&A, 536, A8
- Planck Collaboration et al. (2013) Planck Collaboration et al., 2013, A&A, 550, A134
- Quintana & de Souza (1993) Quintana H., de Souza R., 1993, A&AS, 101, 475
- Ramella et al. (2007) Ramella M., et al., 2007, A&A, 470, 39
- Read & Ponman (2003) Read A. M., Ponman T. J., 2003, A&A, 409, 395
- Roediger et al. (2012) Roediger E., Lovisari L., Dupke R., Ghizzardi S., Brüggen M., Kraft R. P., Machacek M. E., 2012, MNRAS, 420, 3632
- Roettiger et al. (1998) Roettiger K., Stone J. M., Mushotzky R. F., 1998, ApJ, 493, 62
- Rossetti et al. (2007) Rossetti M., Ghizzardi S., Molendi S., Finoguenov A., 2007, A&A, 463, 839
- Rossetti et al. (2016) Rossetti M., et al., 2016, MNRAS, 457, 4515
- Sakelliou & Ponman (2006) Sakelliou I., Ponman T. J., 2006, MNRAS, 367, 1409
- Sanderson & Ponman (2010) Sanderson A. J. R., Ponman T. J., 2010, MNRAS, 402, 65
- Santos et al. (2010) Santos J. S., Tozzi P., Rosati P., Böhringer H., 2010, A&A, 521, A64
- Schenck et al. (2014) Schenck D. E., Datta A., Burns J. O., Skillman S., 2014, AJ, 148, 23
- Schuecker et al. (2004) Schuecker P., Finoguenov A., Miniati F., Böhringer H., Briel U. G., 2004, A&A, 426, 387
- Simionescu et al. (2009) Simionescu A., Roediger E., Nulsen P. E. J., Brüggen M., Forman W. R., Böhringer H., Werner N., Finoguenov A., 2009, A&A, 495, 721
- Slee & Roy (1998) Slee O. B., Roy A. L., 1998, MNRAS, 297, L86
- Sun & Murray (2002) Sun M., Murray S. S., 2002, ApJ, 576, 708
- Sun et al. (2009) Sun M., Voit G. M., Donahue M., Jones C., Forman W., Vikhlinin A., 2009, ApJ, 693, 1142
- Sunyaev & Zeldovich (1972) Sunyaev R. A., Zeldovich Y. B., 1972, Comments on Astrophysics and Space Physics, 4, 173
- Takahashi & Yamashita (2003) Takahashi S., Yamashita K., 2003, PASJ, 55, 1105
- Tanaka et al. (2010) Tanaka N., Furuzawa A., Miyoshi S. J., Tamura T., Takata T., 2010, PASJ, 62, 743
- Tchernin et al. (2016) Tchernin C., et al., 2016, A&A, 595, A42
- Tittley & Henriksen (2001) Tittley E. R., Henriksen M., 2001, ApJ, 563, 673
- Tremblay et al. (2012) Tremblay G. R., et al., 2012, MNRAS, 424, 1042
- Venturi et al. (2002) Venturi T., Bardelli S., Zagaria M., Prandoni I., Morganti R., 2002, A&A, 385, 39
- Vikhlinin et al. (2005) Vikhlinin A., Markevitch M., Murray S. S., Jones C., Forman W., Van Speybroeck L., 2005, ApJ, 628, 655
- Wong et al. (2008) Wong K.-W., Sarazin C. L., Blanton E. L., Reiprich T. H., 2008, ApJ, 682, 155
- Wong et al. (2016) Wong K.-W., Irwin J. A., Wik D. R., Sun M., Sarazin C. L., Fujita Y., Reiprich T. H., 2016, ApJ, 829, 49
- Yu et al. (2016) Yu H., Diaferio A., Agulli I., Aguerri J. A. L., Tozzi P., 2016, ApJ, 831, 156
- Zhang et al. (2011) Zhang L., Yuan Q., Yang Q., Zhang S., Li F., Zhou X., Jiang Z., 2011, PASJ, 63, 585
- Zhu et al. (2016) Zhu Z., et al., 2016, ApJ, 816, 54
Appendix A Notes on individual clusters
We give here specific details on the clusters studied in this work. They are presented in the same order as in Tab. 2, to easy the comparison with the 2D maps, and for the Planck names the prefix PLCKESZ is omitted.
-
1.
CC-relaxed systems
-
•
Abell 2734: Based on the optical images of the WINGS survey, Ramella et al. (2007) give a map of isodensity contours of A2734 showing a strong elongation in the east-west direction with possibly two separate structures, the BCG being in the east structure. They also indicate the presence of a double substructure south of the main cluster. Our maps only cover a relatively small part of the Ramella et al. (2007) map, but our pressure map suggests that this cluster is perturbed in its centre. The maps are spherically symmetric and they don’t point to an unrelaxed global structure.
-
•
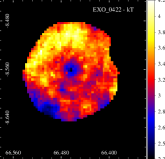
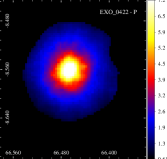
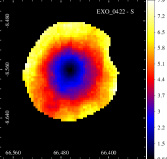
EXO 0422-086: This cluster was reported in the literature among large samples and we can highlight the abundance profile reported by Mernier et al. (2017) that shows central values about 1 decreasing to almost 0.3 around 0.6 , in agreement with our 2D metallicity map.
-
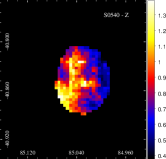
•
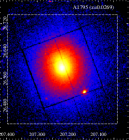
Abell S0540: Sun et al. (2009) include this cluster (also called the ESO 306-G 017 group) in their sample of 43 groups observed with Chandra and classify it as a fossil group. They give a temperature of , a mass of M⊙, and an entropy . From its mass, this object is therefore closer to a cluster than to a group, but according to Wong et al. (2016) it is a dynamically old relaxed fossil group. Our temperature and entropy maps show a displacement of the cluster center towards the north while the metallicity map clearly exhibits a bimodal distribution with the western side having higher values.
-
•
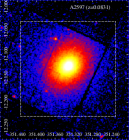
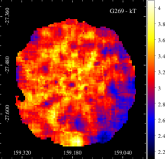
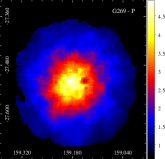
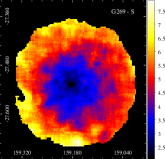
G269.51+26.42: This cluster is also known as the Hydra Cluster, and was previously classified as a non CC system (Sanderson & Ponman, 2010). The X-ray measurements listed in Andrade-Santos et al. (2017) and in Lopes et al. (2018) indicate it is a CC cluster. On the contrary, some optical tests point to a disturbed cluster, although the BCG offset to the X-ray centre does not (Lopes et al., 2018). Our maps indeed suggest that this is a relaxed cluster but without a evident cool-core.
-
•
Abell 3528 (G303.75+33.65): This is a system of two interacting clusters Abell 3528N and Abell 3528S separated by 0.9 Mpc (Gastaldello et al., 2003). Based on XMM-Newton data, these authors describe both subclusters as relaxed. However, our temperature map shows that A3528N looks relaxed, with a cool core, but A3528S does not, since its cool zone is displaced relatively to the cluster centre and the temperature is hotter in the east and west parts of the cluster, indicating that at least one merger must have taken place. Our temperature and metallicity maps are in global agreement with the coarser ones of Gastaldello et al. (2003), who suggest that the two subclusters are moving along the NW/SE and NE/SW directions respectively, the merger having had its closest encounter 1–2 Gyrs ago with an impact parameter of .
-
•
Abell 1650 (G306.68+61.06): According to Takahashi & Yamashita (2003), this cluster presents a non-uniform distribution of temperature and abundance, based on the analysis of XMM-Newton data, which goes in line with our result. However, all maps present a roundish shape. These authors also found cool regions with temperature around 4.0 keV distributed in the outer parts of the cluster, which is exactly what we see in the 2D temperature map.
-
•
Abell 3571 (G316.34+28.54): Lopes et al. (2018) classify this cluster as relaxed for all except one optical substructure test, and it is also classified as relaxed by all the X-ray indicators. In the literature, this system is usually classified as relaxed (Quintana & de Souza, 1993; Nevalainen et al., 2000), but an exception is found in the work of Venturi et al. (2002), suggesting (from radio data) that it is the final stage of a merger event. Our temperature map does not indicate the presence of a cool core, and our metallicity map is quite patchy.
-
•
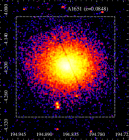
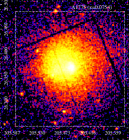
Abell 1795 (G033.78+77.16): All optical substructure classifications (except for the Lee 3D test) from Lopes et al. (2018) indicate this is a relaxed system. The same is true according to the four X-ray CC indicators from that work and from the temperature map we show here. This system has also been previously classified as a CC, but having a very active central region (Ehlert et al., 2015), with the presence of low temperature ICM gas, sometimes coincident with H filaments.
-
•
Abell 2052: Blanton et al. (2011) analysed a Chandra observation of this cluster, revealing detailed structure in the inner part, including bubbles evacuated by radio lobes of the active galactic nucleus (AGN), compressed bubble rims, filaments, and two concentric shock regions. Their 2D maps are very similar to those presented here. Machado & Lima Neto (2015) made simulations that could reproduce the sloshing feature of this cluster by two regimes: the first scenario has a close encounter and corresponds to a recent event (0.8 Gyr since pericentric passage), while the second scenario has a larger impact parameter and is older (almost 2.6 Gyr since pericentric passage). In this second case, the simulation predicts that the perturbing subcluster should be located approximately 2 Mpc from the centre of the major cluster, where the authors were able to identify an optical counterpart at the same redshift. Besides the inner part of the pressure map that shows instabilities probably related to the AGN, this cluster doesn’t show strong signs of mergers.
-
•
Abell 2063: According to Planck Collaboration et al. (2011), this cluster forms a pair with MKW3s but the SZ signal between the two clusters is not significantly detected. Though Frank et al. (2013) classify it as relaxed, Parekh et al. (2015) consider that this is a non-relaxed cluster. We classify A2063 as a CC-relaxed cluster, but our maps show that it is not fully relaxed. The flat temperature profile and the monotonously decreasing metallicity profile found by Matsushita (2011) are not in contradiction with our maps.
-
•
Abell 2151: This cluster is much smaller and cooler than the other ones, and our mean temperature agrees with that of Fukazawa et al. (2004), who give kT= keV, based on ASCA data. On the other hand, these authors find a very low metallicity of Z=Z⊙, while we find an abundance that is in average solar. All our maps suggest that this is a relaxed cluster. There are only few papers in the literature concerning the X-ray emission of this cluster.
-
•
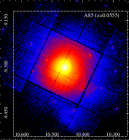
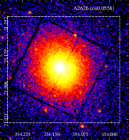
Abell 2244 (G056.81+36.31): This cluster is considered by Parekh et al. (2015) as relaxed, and only small scale temperature substructures have been detected in the central regions of A2244 by Gu et al. (2009), based on Chandra data. In Table 2, we classify A2244 as a CC-relaxed cluster, since its overall spherical shape is preserved.
-
•
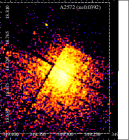
Abell 2572: The core of A2572 is found to be double, consisting of two X-ray peaks of similar intensity separated by about 3 arcmim. The ICM between the two X-ray peaks appears undisturbed (Ebeling et al., 1995). In addition to that, according to these authors, A2572 and HCG94 are falling toward each other at a velocity of about 1000 km s-1 but no clear signs of dynamical interaction are discernible in the ROSAT X-ray data of A2572. Our 2D maps don’t show strong signs of perturbation. The kT map has presents a small range in temperature (from 2.8 to 3.6 keV), and the Z map shows a central elongation of higher metallicity.
-
•
Abell 2597: This is a CC cluster, but McNamara et al. (2001) analysed the central 100 kpc of this cluster and found an irregular X-ray emission (their Fig. 1) very similar to the structure seen in our kT map. Morris & Fabian (2005) showed that EPIC fits to the central region are consistent with a cooling flow of around 100 solar masses per year. The Chandra observations reveal a central ( kpc) X-ray cavity that is not detected in XMM-Newton data due to the PSF (Tremblay et al., 2012). These authors also present evidence that in spite of the presence of a central AGN there is a residual cooling-flow.
-
•
Abell 2626: This cool-core cluster has been well studied due to the presence of a radio source in its centre. Wong et al. (2008) presented a detailed X-ray analysis (XMM-Newton and Chandra) focused on the X-ray and radio interactions. The cD galaxy IC 5338 has two nuclei and one of them has an associated hard X-ray point source. Ignesti et al. (2018) reported a complex system of four symmetric radio arcs without known correlations with the thermal X-ray emission. These symmetric radio arcs together with the presence of two optical cores could be created by pairs of precessing radio jets powered by dual AGNs inside the dominant galaxy. We see a clear metallicity excess in the centre of this cluster in the 2D map.
-
•
Abell 4059: Huang & Sarazin (1998) presented a ROSAT HRI and PSPC X-ray analysis, characterising this galaxy cluster as a compact cD type. The central cD galaxy hosts the strong radio source PKS 2354-35. In our kT, P and S maps we do not see any perturbation produced by this galaxy. However, in the Z map, we clearly see a central enhancement in metal abundance that could be related to the central galaxy.
-
•
-
2.
CC-disturbed
-
•
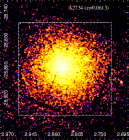
Abell 85 (G115.16-72.09): This cluster has been known for many years to have a cool core, several subtructures (Durret et al., 2005), and an extended filament detected in X-rays (Durret et al., 2003). This filament was interpreted as due to groups falling on to the cluster, the gas in the impact region being hotter. The comparison of the temperature map computed from XMM-Newton data by Durret et al. (2005) (see their Fig. 3) with that obtained from totally independent hydrodynamical numerical simulations by Bourdin et al. (2004) (see their Fig. 9) suggests that an older merger coming from the northwest has also hit the cluster. Temperature maps have also been obtained by Tanaka et al. (2010) and Schenck et al. (2014). The S and SW subclusters described by Schenck et al. (2014) are spatially coincident with regions of low temperatures in our kT map. The dynamical analysis by Yu et al. (2016) shows several groups passing through the cluster core that have disturbed the ICM, one group being associated with a secondary peak of X-ray emission.
-
•
Abell 496 (G209.56-36.49): This cluster is known to be an overall relaxed cluster (Peres et al., 1998) with a cool core, though the comparison of its X-ray sloshing cold fronts with hydrodynamical simulations by Roediger et al. (2012) suggest that a minor merger with an approximate mass of M⊙ has crossed the cluster from the south-west to the north-east, passing the pericentre distance 0.6–0.8 Gyr ago. Our metallicity and entropy maps agree well with those of Ghizzardi et al. (2014) and with the interpretation by Roediger et al. (2012).
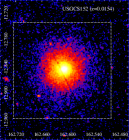
-
•
USGC S152: O’Sullivan et al. (2007) studied this cluster that they call the NGC 3411 group, which is also identified in NED as the NGC 3402 group. Based on several high resolution temperature maps obtained with both XMM-Newton and Chandra data, these authors find a typical abundance distribution, but a clearly atypical temperature distribution, with a hot inner core surrounded by a cool shell of gas, making them conclude that the X-ray gas is not in hydrodynamical equilibrium. They discuss two possible scenarios to account for this cold halo: either the center of a cooling region has been reheated by an AGN outburst, or the cool shell is the product of a merger. Our temperature map fully agrees with theirs, and our metallicity map is clearly in favour of the second scenario: a merger in the northeast-southwest direction is the only explanation to the higher metallicity observed along this direction.
-
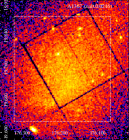
•
Abell 1644: This is a double cluster, with a main cluster (A1644s) and a smaller and colder one (A1644n) to the north-east (Johnson et al., 2010). Surprisingly, these authors give almost similar masses for both clusters, though their intensity map clearly shows the presence of a main cluster and of a much smaller one, as also seen in our maps. Their contours and temperature maps agree with ours and show that the main cluster itself seems double, or at least appears strongly perturbed by a merger. From the comparison with hydrodynamical simulations, Johnson et al. (2010) suggest that the northern subcluster initiated the core gas sloshing in the main cluster about 700 Myr ago. We produced the temperature map assuming a minimum count number of 1000 counts (see Fig. 13) and we can see the shock between these two systems.
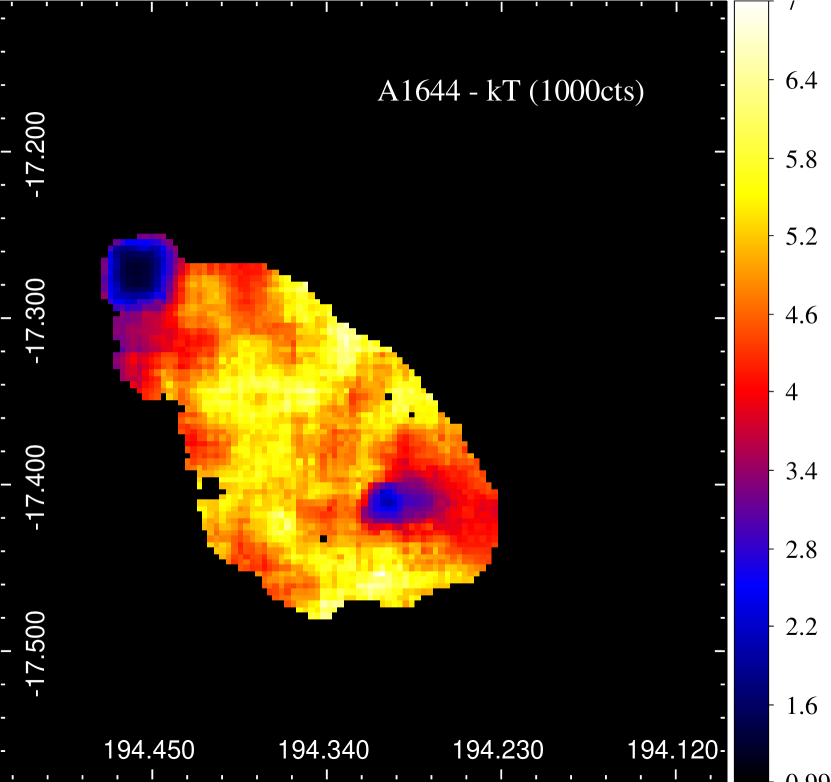
Figure 13: temperature map for A1644 using a minimum count of A1644 to show the shock between the systems. -
•
Abell 1651 (G306.80+58.60): An almost isothermal profile around 5 keV was found in this cluster based on ASCA data (Markevitch et al., 1998), but our temperature map suggests that there is a hotter eastern region, with keV. A study of the diffuse optical light around the BCG of Abell 1651 suggested a color and shape of the profile consistent with relatively little evolution in the past 5 Gyr (Gonzalez et al., 2000). However our X-ray maps, in particular the temperature and metallicity maps, rather seem to suggest that at least one (possibly several) merger(s) has taken place.
-
•
Abell 3558 (G311.99+3071): Rossetti et al. (2007) made a detailed analysis of A3558 based on Chandra and XMM-Newton data and showed that its cool core has survived a merger. However, we hardly detect any cooler gas in the center. As stressed by Ramella et al. (2007), this cluster is elongated in the southeast-northwest direction. According to Frank et al. (2013) and Parekh et al. (2015), A3558 is unrelaxed, and linked by hot gas (2 keV) to A3556 (Mitsuishi et al., 2012). Our maps roughly agree with the temperature and Fe abundance profiles calculated by Matsushita (2011), and strongly suggest that at least one merger has taken place.
-
•
Abell 3562: As A3558, this cluster is also a member of the Shapley supercluster. According to Frank et al. (2013) and Parekh et al. (2015), it is unrelaxed, as also suggested by its radio halo (Giovannini et al., 2009). Matsushita (2011) classifies it as a non-cD cluster with a large deviation from symmetry and a rather large Fe abundance of solar, as for A3558, but we do not measure such a high abundance in either of the two clusters. Matsushita (2011) also finds that A3562 has a flat temperature profile and a uniformly decreasing metallicity profile, in contradiction with our maps.
-
•
Abell 1775: According to Lopes et al. (2018), this cluster is classified as relaxed. However, our temperature map clearly shows an extremely sharp cold front (sloshing arm), particularly visible in the entropy map. At optical wavelengths, Zhang et al. (2011) studied this cluster in 15 bands (SDSS + BATC), and the galaxy redshift histogram suggests a bimodal structure composed by a poor subcluster at lower redshift, located 14 arcmin southeast of the main concentration. This is confirmed by the luminosity function analysis of the galaxies belonging to each subcluster. Probably these two clusters have merged and produced the spiral sloshing arm seen in the 2D maps.
-
•
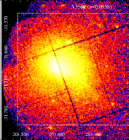
Abell 2029 (G006.47+50.54): This system is classified as disturbed by the Dressler & Shectman (DS or ) and Anderson-Darling (AD) statistics in Lopes et al. (2018), but is classified as relaxed according to the magnitude gap and to the offset between the BCG and X-ray centroid. In that paper all four X-ray measurements indicate this is a CC cluster. This is in agreement with previous studies, such as Santos et al. (2010) and Hudson et al. (2010), who classify it as a strong cool core system. On the contrary, from our current analysis we consider it as disturbed, with a cool centre, but very asymmetric.
-
•
Abell 2142 (G044.22+48.68): This cluster was one of the first to show a cold front (Markevitch et al., 2000), a phenomenon interpreted as due to a merger by Owers et al. (2011), based on galaxy redshifts. Though A2142 is considered as relaxed by Frank et al. (2013), Tchernin et al. (2016) have shown that this cluster has rather bumpy temperature, metallicity, and entropy profiles, while the pressure profile is quite smooth. Akamatsu et al. (2011) obtained a temperature profile up to a large distance of 30 arcmin from the cluster center towards the northwest, showing a steady decrease of the temperature consistent with our temperature map. All these results overall agree with our maps, but illustrate again the fact that profiles do not allow to derive the full physical properties of the X-ray gas, for which 2D maps are necessary. The temperature and metallicity maps of A2142 clearly show that at least one merger has occurred along the southeast to northwest direction. We can note that another merger is presently occurring, with a group falling on to A2142 (Eckert et al., 2017).
-
•
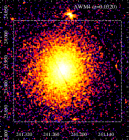
AWM4: This is a poor cluster, for which Fukazawa et al. (2004) give kT= keV and Z=Z⊙, based on ASCA data. O’Sullivan et al. (2011) computed high spatial resolution temperature and density maps of AWM4, based on Chandra data, revealing a high degree of structure. They concluded that it is unlikely that large scale sloshing occurs in AWM4. However, at larger scale, though our entropy and pressure maps suggest that the cluster is relaxed, our temperature and metallicity maps imply that at least one merging event has taken place, probably originating from the southwest, to explain the fact that in this zone the gas is hotter and more metal-rich. We can note that our mean metallicity roughly agrees with that of Fukazawa et al. (2004), but our temperature is notably lower.
-
•
Abell 2199 (G062.92+43.70): According to Lee et al. (2015) and references therein, A2199 is at the centre of a supercluster. Deep Chandra observations by Nulsen et al. (2013) have revealed evidence for a minor merger Myr ago. However, also based on Chandra data, Hofmann et al. (2016) suggest that A2199 is an overall relaxed cluster (a result also found by Frank et al. (2013) and Parekh et al. (2015)) with a cool core and AGN feedback structures at its centre. These authors find a large scale asymmetry in the temperature distribution between the north and the south, which is also clearly visible in our temperature map. Otherwise, Hofmann et al. (2016) find that the perturbations in entropy, pressure, temperature and density are those expected for an overall relaxed system.
-
•
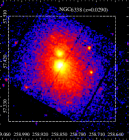
NGC6338: This is a double cluster. There are X-ray cavities in the central 6 kpc detected through the analysis of Chandra data (Pandge et al., 2012). In addition to these cavities, these authors detected a set of X-ray bright filaments which are spatially coincident with the H filaments over an extent of 15 kpc. The orientations of these filaments (NW-SE) are spatially coincident with the hotter regions in the kT maps and with the higher entropy values in the S map.
-
•
Abell 4038: In the work of Lopes et al. (2018) this cluster is considered as disturbed by all optical tests, except the Lee 3D and . Though it is considered as cool-core by the four X-ray substructure parameters used here, our temperature map does not point to a CC cluster. The unrelaxed nature of this cluster also agrees with the fact that the central part of the cluster shows the presence of two bright galaxies, and that a radio relic is reported by Slee & Roy (1998) and Kale & Dwarakanath (2012).
-
•
-
3.
NCC-relaxed
-
•
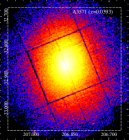
Coma Cluster (G057.33+88.01): Coma is one of the most well studied clusters, known for having two bright galaxies at its center. In Lopes et al. (2018) we derived a mass estimate of 14.6 1014 M⊙ and classifed it as non-relaxed with all substructure tests (in the optical and X-rays), except for the ncore measurement. However, we find no indication of perturbation from the maps derived here. Our temperature map is fully consistent (in shape and absolute values) with the monotonously decreasing temperature profile obtained by Matsushita (2011) (based on XMM-Newton data), that show no cool core. It also agrees with the much coarser temperature map obtained by Arnaud et al. (2001). Our metallicity is also fully consistent with the monotonously decreasing metallicity profile of Matsushita (2011). The fact that we see no trace of the influence of the infall of the NGC 4839 group into the main cluster (Neumann et al., 2001) strongly suggests that this group is only approaching Coma for the first time. If this group had already crossed the cluster, as it had been suggested long ago by Burns et al. (1994), this should had left an imprint in the temperature and metallicity maps.
-
•
Abell 3532: This cluster forms a possibly bound pair with Abell 3530, and both clusters belong to the Abell 3528 complex of the Shapley Supercluster (SSC), as presented by Lakhchaura et al. (2013) in their detailed introduction. Both are non cool core clusters (Chen et al., 2007). The radio continuum emission from galaxies in the SSC core seems to indicate that the Abell 3532/3530 pair of clusters is approaching for the first time (Mauduit & Mamon, 2007). The Abell 3532/3530 pair of clusters was observed and analysed in detail in X-rays with Chandra and XMM-Newton (Lakhchaura et al., 2013). Their pressure and entropy maps agree with ours and confirm that the cluster is not at all relaxed.
-
•
bA3558: the observation was not deep enough to produce extended maps, so we cannot draw firm conclusions on this cluster.
-
•
MKW8: This cluster is classified as relaxed according to all optical substructure tests in Lopes et al. (2018), but only CSB4 (out of the four X-ray metrics) indicates this is a CC cluster. From our current maps we also classify it as disturbed. Hudson et al. (2010) and Eckert et al. (2011) also classify it as a NCC system, corroborating the discrepancy between the optical and X-ray classifications. We have also noticed that its nearby companion (bMKW8) aligns in projection with two background clusters, WHL J143821.9+034013 and Abell 1942, and it is not clear if the X-ray emission could be associated with those background systems.
-
•
-
4.
NCC-disturbed
-
•
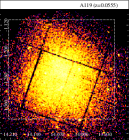
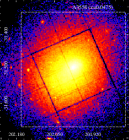
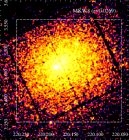
Abell 119 (G125.58-64.14): Oh et al. (2016) showed that A119 is a dynamically young cluster with unrelaxed groups within the virial radius implying a disturbed morphology. This was confirmed by Owers et al. (2017), based on a large number of galaxy redshifts from the SAMI cluster redshift survey. They found that A119 has a small substructure associated with a bright galaxy about 1 Mpc to the north-east of the cluster centre. Our maps clearly confirm that this cluster is disturbed and has undergone or is presently undergoing one or several merging events. In X-rays, Elkholy et al. (2015) showed that the entropy profile slightly increases outwards, in agreement with our entropy map. On the other hand, they find that the metallicity profile of A119 decreases by a factor between 0.15R500 and R500, a result which is not consistent with our metallicity map.
-
•
Abell 3376 (G246.52-26.05): The bullet shape of this cluster suggests it has undergone a recent collision (Durret et al., 2013). The temperature and metallicity maps obtained by Bagchi et al. (2006) show patches of hotter gas and a higher metallicity in the southeast half of the cluster. Hydrodynamical simulations by Machado & Lima Neto (2013) computed to match the X-ray properties suggest a collision of two clusters with mass ratio between 1:6 and 1:8, the subcluster having a gas density four times that of the main cluster. The merger seems to correspond to a small impact parameter ( kpc), with a collision axis inclined by with respect to the plane of the sky, and having taken place 0.5 Gyr ago, with a large Mach number of .
-
•
Abell 3391: This cluster is classified as relaxed by all except one optical indicator (magnitude gap) in Lopes et al. (2018), as there are two bright galaxies near the center of the system. However, all four X-ray parameters, point to a NCC object, and our temperature map indicates that this is the case. It has also been suggested that there is a filamentary structure linking Abell 3391 and Abell 3395, with the ESO-161-IG006 group between the two clusters (Tittley & Henriksen, 2001; Alvarez et al., 2018).
-
•
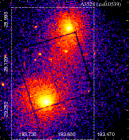
Abell 3395 (G263.20-25.21): This cluster is an example of a double system, close to bA3395 (bG2263.20-25.21), previously classified as a merging system (Lakhchaura et al., 2011). According to Donnelly et al. (2001) the system appears to be nearly at first core passage. Lopes et al. (2018) found that the BCG of the second cluster is coincident with the X-ray centroid. As in Donnelly et al. (2001) we found evidence that the gas between the two systems is heated.
-
•
Abell 754: This cluster has been studied at various wavelengths (Inoue et al., 2016, and references therein) and is undergoing a recent major merger that has been quantified by several studies. First, the comparison with hydrodynamic simulations (Roettiger et al., 1998) has suggested a recent ( Gyr) off-axis merger between two subclusters of mass ratio 2.1:1. Then, the presence of a third subcluster was suggested (Markevitch et al., 2002) and a “shock-SE” region was identified by a temperature jump at the southeast part of the cluster coinciding with a radio relic (Macario et al., 2011).
-
•
Abell 1367 (G234.59+73.01): In agreement with Hudson et al. (2010) and references therein, this is a very well-studied merging cluster, observed for a long time in X-rays (Sun & Murray, 2002) as well as optical wavelengths, where evidence was found for an infalling starburst group (Cortese et al., 2004). In view of the asymmetry of this cluster, particularly well seen in our maps, radial profiles such as those of Matsushita (2011) are obviously not well adapted, since they average values of the temperature and metallicity in regions where these quantities are quite different. Our X-ray maps indeed appear rather disturbed, with mean temperature and metallicity values agreeing with those previously derived by Fukazawa et al. (2004) and Hudson et al. (2010), but slightly larger than the temperature given by Frank et al. (2013).
-
•
ZwCl121510400 (G282.49+65.17): This cluster was not studied individually and was only reported in the literature among large samples. Our maps clearly show that it is a disturbed NCC cluster.
-
•
Abell 3560: This is a rich cluster at the southern periphery of the A3558 complex, a chain of interacting clusters in the central part of the Shapley supercluster. Based on a ROSAT-PSPC map, Bardelli et al. (2002) found that its surface brightness distribution is described by two components, indicating that this cluster is experiencing a merger event. They also mentioned that the main component, corresponding to the cluster, has an elongation towards the A3558 complex, which is located northwest of A3560. This is also what we found in the 2D maps presented in this work. From VLA radio data Bardelli et al. (2002) found a peculiar bright extended radio source (J1332-3308).
-
•
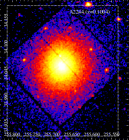
Abell 2061: This cluster forms a pair with A2067. Based on BeppoSAX data, Marini et al. (2004) obtained temperature maps for three clusters in the Corona Borealis supercluster: A2061, A2067, and A2124. Their image shows that A2061 is elongated towards A2067, with a “plume” pointing towards the second cluster, but no other clear sign of interaction. We also detect an elongation towards A2067. Marini et al. (2004) find an overall decreasing temperature profile, with a hotter region (10.7 keV) in the 2-4 arcmin bin northwest of the cluster center. This agrees with our temperature map, where the hottest gas is in the northwest zone. Marini et al. (2004) suggest a scenario where a group is falling into A2061 and forms a shock in the cluster. However, the sketch of the merger that they give in their Fig. 17 does not seem consistent with our temperature map. Planck Collaboration et al. (2013) confirmed that no filament is detected between A2061 and A2067.
-
•
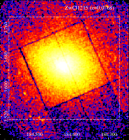
MKW3s: According to Planck Collaboration et al. (2013), this cluster forms a pair with A2063 but the SZ signal between the two clusters is not significantly detected. There is a dominant central galaxy at the center of MKW3s, namely NGC 5920. Our kT map shows that the central temperature is higher than the overall temperature, in contradiction with previous studies that reported MKW3s as a cooling-flow system (Canizares et al., 1983).
-
•
Abell 2065 (G042.82+56.61): Chatzikos et al. (2006) presented the Chandra analysis of this merging cluster, with cool gas displaced from the more luminous southern cD galaxy. They argue that A2065 is an unequal mass merger in which the more massive southern cluster has driven a shock into the ICM of the infalling northern cluster, which has disrupted the cool core of the latter. The spatial distribution of the temperature presented in Fig. 12 is very similar to their Fig. 6(a), showing a cold front with temperatures around 5-6 keV and a shock front with temperatures reaching 10 keV.
-
•
Abell 2147: This cluster forms a close pair with A2152 which is about 40 arcmin away (Planck Collaboration et al., 2011). It is classified as disturbed by Frank et al. (2013), and this is obviously the case, as seen in our maps, which are all very inhomogeneous and suggest that several mergers must have taken place.
-
•
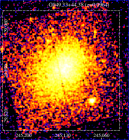
G049.33+44.38: This cluster is part of the NORAS survey (Northern ROSAT All-Sky Survey Böhringer et al., 2000) but very little is known on it in X-rays. Our maps show that this cluster is obviously disturbed.
-
•
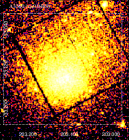
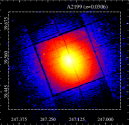
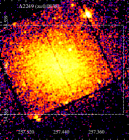
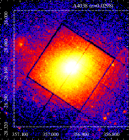
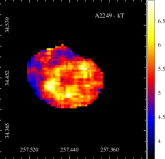
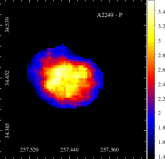
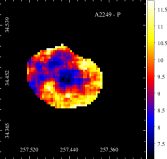
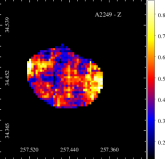
Abell 2249 (PLCKESZ G057.61+34.94): The temperature profile presented in Zhu et al. (2016) based on Chandra data suggests a central temperature of 8.0 keV, reaching its maximum of almost 10 keV around 1000 kpc. Our temperature map does not show such high values, since kT ranges from 4.0 keV up to 7.0 keV. Using the KASI-Yonsei Deep Imaging Survey of Clusters (KYDISC), Oh et al. (2018) found more than 400 spectroscopic members, and the redshift histogram is well fit by a gaussian distribution, showing no evidence of merging. What calls our attention is the higher temperature “ring” in the center, which is associated with AGNs, although we found no indication for this in the literature. Lopes et al. (2018) also classify the velocity distribution as normal (according to the Anderson-Darling statistics), but the cluster is considered as disturbed in 3D, according to the Dressler & Shectman (DS or ) test.
-
•
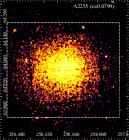
Abell 2255 (G093.91+34.90): This is a merging cluster and our kT and S maps show two regions of lower temperature and entropy while the pressure map shows a region of shock between the systems. Using 140 ks Suzaku X-ray data, Akamatsu et al. (2017) analysed this merging system almost out to the virial radius (1.9 Mpc), confirming that the temperature drops from 6 keV around the cluster centre to 3 keV at the outskirts. In a previous XMM-Newton data analysis, Sakelliou & Ponman (2006) reported an asymmetric temperature distribution that has been assembled recently by the merging of smaller subunits that have collided some 0.1-0.2 Gyrs ago.
-
•