A new class of flares from accreting supermassive black holes
Abstract
Accreting supermassive black holes (SMBHs) can exhibit variable emission across the electromagnetic spectrum and over a broad range of time-scales. The variability of active galactic nuclei (AGN) in the ultra-violet (UV) and optical is usually at the few tens of percent level over time-scales of hours to weeks[2]. Recently, rare, more dramatic changes to the emission from accreting SMBHs have been observed, including tidal disruption events (TDEs)[3, 4, 5, 6], “changing look” AGN[7, 8, 9, 10], and other extreme variability objects[11, 12]. The physics behind the “re-ignition”, enhancement, and “shut-down” of accretion onto SMBHs is not entirely understood. Here we present a rapid increase in ultraviolet-optical emission in the centre of a nearby galaxy marking the onset of sudden increased accretion onto a SMBH. The optical spectrum of this flare, dubbed AT 2017bgt, exhibits a mix of emission features. Some are typical of luminous, unobscured AGN, but others are likely driven by Bowen fluorescence - robustly linked here, for the first time, with high-velocity gas in the vicinity of the accreting SMBH. The spectral features and increased UV flux show little evolution over a period of at least 14 months. This disfavours the tidal disruption of a star as their origin, and instead suggests a longer-term event of intensified accretion. Together with two other recently reported events with similar properties, we define a new class of SMBH-related flares. This has important implications for the classification of different types of enhanced accretion onto SMBHs.
Department of Physics, ETH Zurich, Wolfgang-Pauli-Strasse 27, CH-8093 Zurich, Switzerland.
School of Physics and Astronomy, Tel Aviv University, Tel Aviv 69978, Israel.
Department of Physics, University of California, Santa Barbara, CA 93106-9530, USA.
Las Cumbres Observatory, 6740 Cortona Drive, Suite 102, Goleta, CA 93117-5575, USA.
Núcleo de Astronomía de la Facultad de Ingeniería, Universidad Diego Portales, Av. Ejército Libertador 441, Santiago, Chile
Chinese Academy of Sciences South America Center for Astronomy and China-Chile Joint Center for Astronomy, Camino El Observatorio 1515, Las Condes, Santiago, Chile.
Kavli Institute for Astronomy and Astrophysics, Peking University, Beijing 100871, China.
Harvard-Smithsonian Center for Astrophysics, 60 Garden St, Cambridge, MA 02138, USA.
Jet Propulsion Laboratory, California Institute of Technology, 4800 Oak Grove Drive, MS 169-224, Pasadena, CA 91109, USA.
SRON Netherlands Institute for Space Research, Sorbonnelaan 2, 3584 CA Utrecht, The Netherlands.
Department of Astrophysics / Institute for Mathematics, Astrophysics and Particle Physics, Radboud University, P.O. Box 9010, 6500GL Nijmegen, The Netherlands.
Racah Institute of Physics, Hebrew University, Jerusalem 91904, Israel.
European Southern Observatory, Casilla 19001, Santiago 19, Chile
Cahill Center for Astronomy and Astrophysics, California Institute of Technology, Pasadena, CA 91125, USA.
Institute of Astronomy, University of Cambridge, Madingley Road, Cambridge, CB3 0HA, UK.
Warsaw University Astronomical Observatory, Al. Ujazdowskie 4, 00-478 Warszawa, Poland.
Astrophysics Science Division, NASA Goddard Space Flight Center, Greenbelt, MD 20771, USA.
Joint Space-Science Institute, University of Maryland, College Park, MD 20742, USA.
Department of Astronomy and Steward Observatory, University of Arizona, 933 N. Cherry Avenue, Tucson, AZ 85721, USA.
Department of Physics, Florida State University, 77 Chieftan Way, Tallahassee, FL 32306, USA.
Carnegie Observatories, Las Campanas Observatory, Casilla 601, La Serena, Chile.
MIT Kavli Institute for Astrophysics and Space Research, 70 Vassar Street, Cambridge, MA 02139, USA.
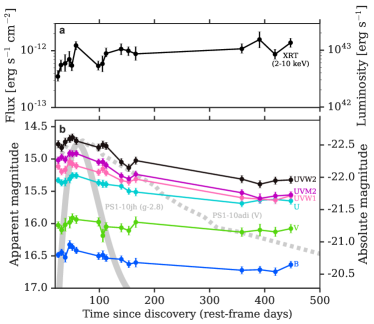
AT 2017bgt was discovered by the All Sky Automated Survey for Supernovae (ASAS-SN[13]) as ASASSN-17cv on 2017 February 21 in the early-type galaxy 2MASX J16110570+0234002, at (ref. 14; see Methods §Detection and Photometric Monitoring Observations). The long-term ASAS-SN optical data show that the total emission from the galaxy brightened by a factor of 50% over a period of about two months, with half of the rise occurring within three weeks (see Supplementary Fig. 1). Follow-up Swift observations show that the UV emission increased by a factor of 75 compared to GALEX data from 2004, reaching a luminosity of , and that the X-ray emission increased by a factor of compared to ROSAT data from 1990 August (see ‘Detection and photometric monitoring’ and ’Archival multi-wavelength data’ in Methods for details on all new and archival data). The archival X-ray luminosity, of , and the archival UV to X-ray luminosity ratio are consistent with what is commonly observed in AGN (that is, a UV-to-X-ray spectral slope of ; see Methods §Archival multi-wavelength data). Archival detections in the radio (from 1998; obtained by the Very Large Array) and in the mid-infrared (from 2010; obtained with the Wide-field Infrared Survey Explorer) can be accounted for by star formation in the host galaxy. Thus, AT 2017bgt experienced a dramatic increase in its UV emission, accompanied by a smaller increase in optical and X-ray emission, sometime between 2004 and 2017.
The X-ray spectral energy distribution of AT 2017bgt, as determined from our new observations over the energy range of 0.3-24 keV, using Swift/XRT, NuSTAR, and NICER, is broadly consistent with an unobscured AGN, dominated by a power-law with a photon index of (see ’New X-ray data’ in Methods and Supplementary Fig. 2). During the current UV-bright state, AT 2017bgt exhibits UV-to-X-ray and UV-to-optical luminosity ratios that are much larger than what is typically seen in unobscured AGN. The ratio of monochromatic UV-to-X-ray luminosities, , is higher than the norm by a factor of at least 50 (i.e., ; see ref. 15). The corresponding UV-to-optical ratio is 3.5, which is higher than the norm by a factor of at least 5.5 (ref. 16). Over the first 14 months after discovery the UV and optical flux of AT 2017bgt have shown very limited variability (Fig. 1), with a mild decline of 0.7 mag (factor of 2) in the UV, and 0.2 mag in the optical (without removal of an unknown amount of host contamination). The X-ray emission from AT 2017bgt has been roughly constant during this period (Fig. 1a).
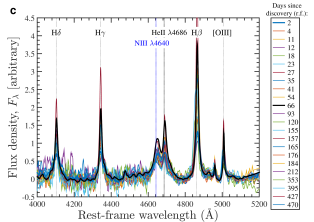
We obtained repeated optical spectroscopy of AT 2017bgt, starting two days after discovery. The spectra display many features typical of unobscured AGN, but also some features that have never been clearly identified in such systems before (see ’Optical spectroscopy’ in Methods and Fig. 2). Among the features typical of AGN, the spectra exhibit prominent, symmetrical, single-peaked hydrogen Balmer emission lines, with full-width at half-maximum of . In unobscured, broad-line AGN (i.e., quasars), such emission lines are thought to originate from partially ionized gas with densities of order . AT 2017bgt also exhibits weaker and narrower, -wide, forbidden emission lines of [O iii] and [N ii] , which are also common in AGN. Indeed, these forbidden narrow lines are already present in the earliest optical spectra, obtained within days from the transient detection, and indicate the presence of an AGN-like ionizing source (see Supplementary Figs. 3 and 4, and ’Optical spectroscopy’ in Methods). Given that the light-travel time to the corresponding (narrow) line-emitting region is of order 100 years[17, 18], and the fact that the archival UV and X-ray data are consistent with AGN-like continuum emission, the system was most likely harbouring an actively accreting supermassive black hole (SMBH) well before the optical flux increase that triggered the transient detection.
Assuming that the optical and X-ray continuum emission from AT 2017bgt indeed originates from the vicinity of a standard accretion flow onto a SMBH, as in AGN, and using standard AGN scaling relations, we infer a mass accretion rate of ; a broad line region (BLR) size of light-days ( pc); and, combined with an H line width of , a SMBH mass of , which in turn results in an Eddington ratio of (see ’Determination of key SMBH properties’ in Methods for details and Supplementary Fig. 5; key measured and derived properties are listed in Supplementary Table 1). The intense UV luminosity, on the other hand, could imply , and further suggests that the line-emitting region does not necessarily follow standard AGN scaling relations (see ’Determination of key SMBH properties’ in Methods for details). Given the width of the Balmer lines and the high accretion rates suggested by the UV-based rough estimates of and , the currently observed AGN-related properties of AT 2017bgt are consistent with those of many narrow-line Seyfert 1 (NLSy1) galaxies.
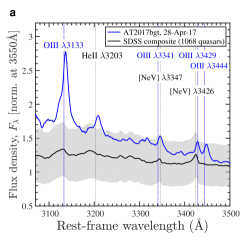
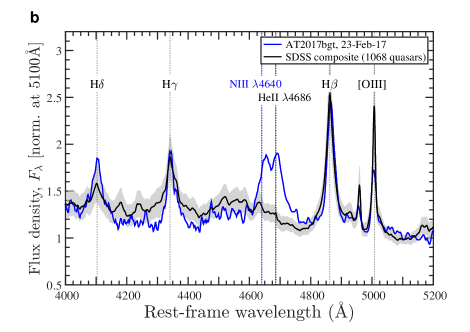
Most importantly, the optical spectroscopy of AT 2017bgt presents several strong emission features that are not seen in AGN (Fig. 2), namely the strong O iii emission line and the double-peaked emission feature near 4680Å, all with widths consistent with that of the broad component of the H emission line. The redder of the two peaks near 4680 Å coincides with the He ii transition, which in AGN typically exhibits line intensity ratios relative to H of , but here is seen with (see ref. 16). The width and intensity of these spectral features remain roughly constant during our follow-up spectroscopic observations spanning over 14 months from discovery (Fig. 1c and Supplementary Fig. 3).
The second feature, centred at 4651.6 Å, cannot be associated with a second peak of He ii emission, originating from a disk-like configuration of the He ii-emitting gas, since the other optical and near-IR (NIR) emission lines, including several He ii transitions, are single-peaked (the NIR helium lines are also exceptionally strong compared to typical AGN; see ’NIR spectroscopy’ in Methods and Supplementary Fig. 6). This feature may instead be associated with the N iii emission line. Some recent studies have suggested that weak emission from this transition (sometimes noted as a “Wolf-Rayet” feature) may be present in the spectra of some TDEs[19, 20, 21], although significant line blending in those cases makes the identification less secure there. While the N iii line is not seen in AGN spectra (Fig. 2), it can be significantly enhanced by Bowen fluorescence, which would also produce O iii and other O iii lines, as seen in our spectra. In Bowen fluorescence (BF), photons emitted from the Lyman-like transition of He ii, at 303.783 Å, excite certain states of O iii and N iii, due to the wavelength proximity between the corresponding energy transitions[22, 23]. The excited O iii and N iii states lead to a cascade of transitions, that may be observed as emission lines in the UV-optical regime. This process, and particularly strong O iii , N iii , and He ii emission, is well established to occur in some planetary nebulae and X-ray binaries[24, 25]. It is, however, generally not seen in AGN, and only a few Seyfert galaxies were reported to have narrow (1,000 km s-1-wide) O iii BF lines[26, 27]. Here we present a case where BF emission lines from the BLR are associated with a (steadily) accreting SMBH, and specifically robust identification of broad O iii BF lines, and of the N iii line (and indeed the N iii BF cascade) in such a system, which were first predicted decades ago[28].
Comparing the and line intensity ratios seen in AT 2017bgt to those predictions[28] suggests that the line-emitting gas is dense, with hydrogen number density of , and has a high abundance of metals – and in particular of nitrogen (likely exceeding 4 times solar). These gas densities are consistent with what is expected for the BLR in AGN, and high metallicities may be expected in extremely high luminosity and/or high AGN[29]. Thus, AT 2017bgt suggests that the key missing ingredient for broad BF lines in accreting SMBHs is extremely intense UV continuum emission. However, more detailed radiative transfer calculations are required to reproduce the line ratios seen in AT 2017bgt, and to link them to the enhanced UV emission.
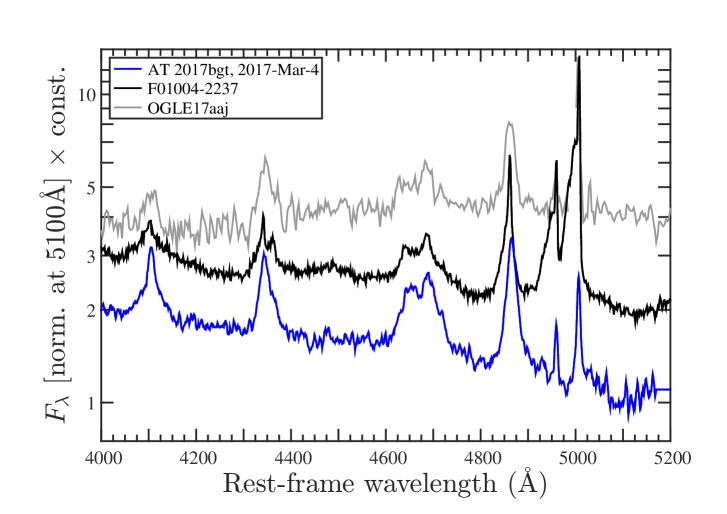
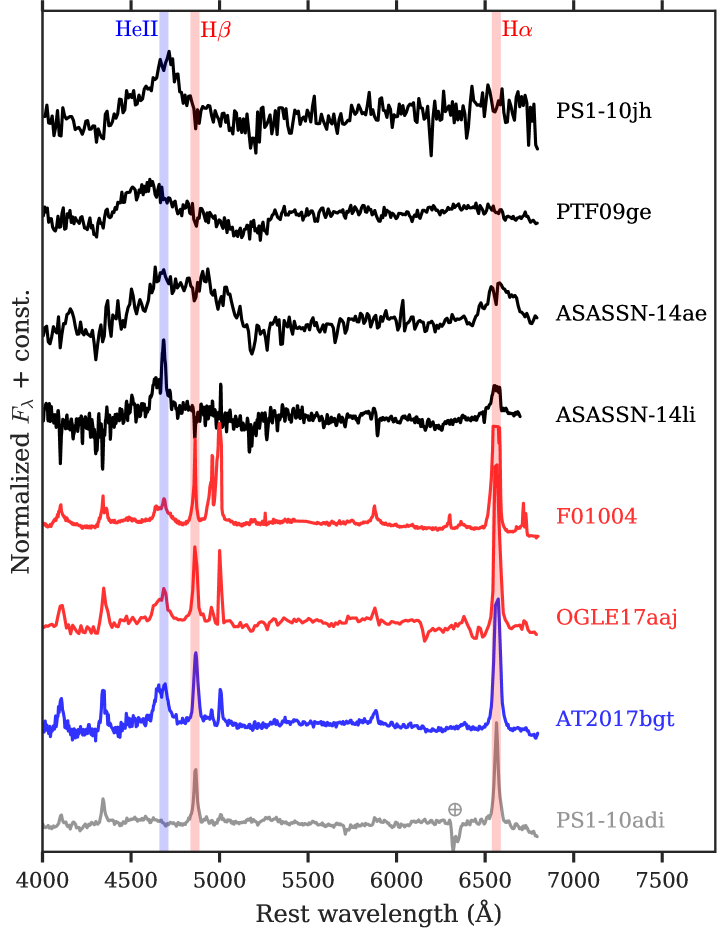
AT 2017bgt joins two recently reported transient events in galaxy centres that also exhibit a prominent, broad and double-peaked emission feature near 4680 Å (Fig. 3). The first event was recently claimed to be a TDE in the active nucleus of the ultra-luminous infrared galaxy F01004-2237 (ref. 30). The classification of this event as a TDE mainly relied on the association of this spectral feature with He ii , a line also seen in a class of optical and UV-bright TDEs[3, 4], though the line profile in F01004-2237 is different from that of known TDEs (see below). Another recently reported event, OGLE17aaj, shows hints of a persistent double-peaked emission feature on top of an otherwise normal optical AGN spectrum[31, 32, 33] (M.G. et al., manuscript in preparation). In both these cases, the dramatic increase in optical continuum emission was followed by a period of rather persistent continuum and line emission, over time-scales of several months – similarly to AT 2017bgt. Moreover, the width of the Balmer emission lines in all three sources classifies them as NLSy1 AGN, which are commonly thought to be powered by highly accreting SMBHs (in terms of ). Two other recently reported nuclear transients showed slowly-evolving light curves: PS16dtm, which was claimed to be a TDE in a NLSy1 AGN[34]; and PS1-10adi, which was interpreted as a likely peculiar kind of supernova[35]. However, these two events showed no BF-related lines in their spectra. Moreover, PS1-10adi (and similar events) show a significant flux decrease over periods of a few months, not seen in AT 2017bgt. We therefore consider these two latter events to be unrelated to the new class identified here, that is: unobscured AGN-like spectra with extremely strong UV, He ii , N iii , and O iii emission, and long-term persistence of these flare features. We caution that, given the data in hand, we cannot rule out the possibility that these events may all be driven by rather similar SMBH fueling mechanisms. Determining why some events show BF features and some do not requires more detailed modelling.
We propose that AT 2017bgt, and likely similar events, are “rejuvenated” SMBHs that experienced a sudden increase in their UV-optical emission. This, in turn, enhanced the He ii Ly line and initiated the BF cascades of He ii, N iii, and O iii. The extreme UV and BF emission differentiates such events from “changing look” AGN. Given the likely light-travel timescales to the region emitting the broad Balmer lines (of order a few weeks), and the fact that they are seen in the earliest optical spectra we obtained, it is most likely that the BF emission features originate in a pre-existing BLR which was suddenly exposed to the intense ionizing UV emission whose spectral energy distribution is very different from those of normal AGN. It is therefore possible that, once the intense UV continuum emission would settle back to “normal AGN” levels, the BF features would disappear. This can be tested with on-going spectroscopic monitoring. Alternatively, the BF features may be related to a newly launched outflow, perhaps driven by the sudden increase in accretion rate (see ’Relevant mechanisms for the long-lived UV flare’ in Methods). In either case, the enhanced metallicity suggested by the strong N iii line may or may not be related to the fast increase in UV luminosity.
The nature of the sudden UV and optical brightening event remains open. The evidence for AGN-like activity in AT 2017bgt (and the other events in this proposed class), both before and after the UV-optical event, draws attention to processes related to (thin) accretion disks that feed SMBHs. Given the very little time evolution of the continuum and line emission in AT 2017bgt-like events, as well as their spectral properties, they are unlikely to be be driven by TDEs (at least not ones similar to those reported thus far; see Fig. 4). We discuss the relevance of the TDE interpretation, and mention several other possibly relevant mechanisms, in the Methods (’Relevant mechanisms for the long-lived UV flare’). Regardless of the nature of the dramatic increase in UV flux, the properties of AT 2017bgt, and other similar transient events in galaxy nuclei, demonstrate that prominent, a broad Bowen fluorescence N iii emission feature may be confused with the He ii feature commonly seen in TDEs. Such sources thus highlight the importance of long-term, multi-wavelength monitoring campaigns, in order to identify SMBH accretion that is driven purely by TDEs, and to distinguish it from other cases of SMBHs that experience a sudden enhancement, or indeed “re-ignition”, of their accretion. We suspect that the discovery of AT 2017bgt-like events might have been hampered so far, due to their possible association with previously-known AGN (see discussion in ref. 35). Long term monitoring of AT 2017bgt-like events, and indeed the discovery of additional events of this sort, could help illuminate their nature, as well as their role in SMBH growth.
References
References
- [1]
- [2] Caplar, N., Lilly, S. J. & Trakhtenbrot, B. Optical variability of AGN in the PTF/iPTF survey. ApJ 834, 111 (2017).
- [3] Gezari, S. et al. An ultraviolet-optical flare from the tidal disruption of a helium-rich stellar core. Nature 485, 217–220 (2012).
- [4] Arcavi, I. et al. A continuum of H- to He-rich tidal disruption candidates with a preference for E+A galaxies. ApJ 793, 38 (2014).
- [5] Holoien, T. W. et al. ASASSN-14ae: A tidal disruption event at 200 Mpc. MNRAS 445, 3263–3277 (2014).
- [6] Holoien, T. W.-S. et al. Six months of multiwavelength follow-up of the tidal disruption candidate ASASSN-14li and implied TDE rates from ASAS-SN. MNRAS 455, 2918–2935 (2016).
- [7] LaMassa, S. M. et al. The discovery of the first “changing look” quasar: new insights into the physics and phenomenology of active galactic nuclei. ApJ 800, 144 (2015).
- [8] MacLeod, C. L. et al. A systematic search for changing-look quasars in SDSS. MNRAS 457, 389–404 (2016).
- [9] Ricci, C. et al. IC 751: A new changing look agn discovered by NuSTAR. ApJ 820, 5 (2016).
- [10] Runnoe, J. C. et al. Now you see it, now you don’t: the disappearing central engine of the quasar J1011+5442. MNRAS 455, 1691–1701 (2016).
- [11] Lawrence, A. et al. Slow-blue nuclear hypervariables in PanSTARRS-1. MNRAS 463, 296–331 (2016).
- [12] Graham, M. J. et al. Understanding extreme quasar optical variability with CRTS – I. Major AGN flares. MNRAS 470, 4112–4132 (2017).
- [13] Shappee, B. J. et al. The man behind the curtain: X-rays drive the UV through NIR variability in the 2013 active galactic nucleus outburst in NGC 2617. ApJ 788, 48 (2014).
- [14] Kiyota, S. et al. ASASSN-17cu and ASASSN-17cv: discovery of two probable supernovae. Astron. Telegr. 10113 (2017).
- [15] Lusso, E. & Risaliti, G. The tight relation between X-ray and ultraviolet luminosity of quasars. ApJ 819, 154 (2016).
- [16] Vanden Berk, D. E. et al. Composite quasar spectra from the Sloan Digital Sky Survey. AJ 122, 549–564 (2001).
- [17] Bennert, N., Falcke, H., Schulz, H., Wilson, A. S. & Wills, B. J. Size and Structure of the Narrow-Line Region of Quasars. ApJ 574, L105–L109 (2002).
- [18] Mor, R., Netzer, H. & Elitzur, M. Dusty Structure Around Type-I Active Galactic Nuclei: Clumpy Torus Narrow-Line Region and Near-Nucleus Hot Dust. ApJ 705, 298–313 (2009).
- [19] Gezari, S. et al. PS1-10jh Continues to follow the fallback accretion rate of a tidally disrupted star. ApJ 815, L5 (2015).
- [20] Brown, J. S. et al. The ultraviolet spectroscopic evolution of the low-luminosity tidal disruption event iPTF16fnl. MNRAS 473, 1130–1144 (2018).
- [21] Brown, J. S. et al. The Long Term Evolution of ASASSN-14li. MNRAS 446, 4904–4916 (2017).
- [22] Bowen, I. S. The origin of the nebular lines and the structure of the planetary nebulae. ApJ 67, 1 (1928).
- [23] Weymann, R. J. & Williams, R. E. The bowen fluorescence mechanism in planetary nebulae and the nuclei of Seyfert galaxies. ApJ 157, 1201 (1969).
- [24] Schachter, J., Filippenko, A. V. & Kahn, S. M. Bowen fluorescence in Scorpius X-1. ApJ 340, 1049 (1989).
- [25] Kastner, S. O. & Bhatia, A. K. The Bowen fluorescence lines: overview and re-analysis of the observations. MNRAS 279, 1137–1156 (1996).
- [26] Williams, R. E. & Weymann, R. J. Proceedings of the conference on Seyfert galaxies and related objects: 35. Calculated line intensities for models of Seyfert galaxy nuclei. AJ 73, 895 (1968).
- [27] Schachter, J., Filippenko, A. V. & Kahn, S. M. Bowen fluorescence in a sample of Seyfert nuclei. ApJ 362, 74 (1990).
- [28] Netzer, H., Elitzur, M. & Ferland, G. J. Bowen fluorescence and He II lines in active galaxies and gaseous nebulae. ApJ 299, 752 (1985).
- [29] Shemmer, O. et al. Near-Infrared spectroscopy of high-redshift active galactic nuclei. I. A metallicity–accretion rate relationship. ApJ 614, 547–557 (2004).
- [30] Tadhunter, C., Spence, R., Rose, M., Mullaney, J. & Crowther, P. A tidal disruption event in the nearby ultra-luminous infrared galaxy F01004-2237. Nat. Astron. 1, 0061 (2017).
- [31] Wyrzykowski, L. et al. OGLE-IV real-time transient search. Acta Astronomica 64, 197–232 (2014).
- [32] Gromadzki, M., Hamanowicz, A. & Wyrzykowski, L. VLT/FORS2 spectroscopic classification of an unusual nuclear transient OGLE17aaj. Astron. Telegr. 9977 (2017).
- [33] Wyrzykowski, L. et al. OGLE-IV transient search report 25 September 2017 part 1. Astron. Telegr. 10776 (2017).
- [34] Blanchard, P. K. et al. PS16dtm: A tidal disruption event in a narrow-line Seyfert 1 galaxy. ApJ 843, 106 (2017).
- [35] Kankare, E. et al. A population of highly energetic transient events in the centres of active galaxies. Nat. Astron. 1, 865–871 (2017).
B.T. is a Zwicky Fellow.
I.A. is an Einstein fellow.
E.K. is a Hubble Fellow.
We thank N. Caplar, J. Guillochon, Z. Haiman, E. Lusso, and K. Schawinski for useful discussions.
We thank C. Tadhunter for providing the spectrum of the F01004-2237 transient and his helpful comments.
Part of this work was inspired by discussions within International Team #371, “Using Tidal Disruption Events to Study Super-Massive Black Holes”, hosted at the International Space Science Institute in Bern, Switzerland.
We thank all the participants of the team meeting for their beneficial comments.
Support for I.A. was provided by NASA through the Einstein Fellowship Program, grant PF6-170148.
C.R. acknowledges support from the CONICYT+PAI Convocatoria Nacional subvencion a instalacion en la academia convocatoria a\a no 2017 PAI77170080.
P.G.J. acknowledges support from European Research Council Consolidator Grant 647208.
A. Horesh acknowledges support by the I-Core Program of the Planning and Budgeting Committee and the Israel Science Foundation.
G.H., D.A.H., and C.M. acknowledge support from NSF grant AST-1313484.
M.B. acknowledges support from the Black Hole Initiative at Harvard University, which is funded by a grant from the John Templeton Foundation.
G.B.L. acknowledges support from a Herchel Smith Research Fellowship of the University of Cambridge.
Ł.W., M.G. and A.Hamanowicz acknowledge Polish National Science Centre grant OPUS no 2015/17/B/ST9/03167 to Ł.W.
Research by D.J.S. is supported by NSF grants AST-1412504 and AST-1517649.
E.Y.H. acknowledges the support provided by the National Science Foundation under Grant No. AST-1613472 and by the Florida Space Grant Consortium.
This work makes use of observations from the Las Cumbres Observatory network.
This publication also makes use of data products from the Wide-field Infrared Survey Explorer.
WISE and NEOWISE are funded by the National Aeronautics and Space Administration.
This work made use of data from the NuSTAR mission, a project led by the California Institute of Technology, managed by the Jet Propulsion Laboratory, and funded by the National Aeronautics and Space Administration.
We thank the NuSTAR Operations, Software and Calibration teams for support with the execution and analysis of these observations.
This research made use of the NuSTAR Data Analysis Software (NuSTARDAS) jointly developed by the ASI Science Data Center (ASDC, Italy) and the California Institute of Technology (USA).
We thank the Swift, NuSTAR, and NICER teams for scheduling and performing the target-of-opportunity observations presented here
on short notice.
The LRIS spectrum presented herein was obtained at the W. M. Keck Observatory, which is operated as a scientific partnership among the California Institute of Technology, the University of California, and the National Aeronautics and Space Administration.
The Observatory was made possible by the generous financial support of the W. M. Keck Foundation.
We recognize and acknowledge the very significant cultural role and reverence that the summit of Mauna Kea has always had within the indigenous Hawaiian community.
We are most fortunate to have the opportunity to conduct observations from this mountain.
These results made use of the Discovery Channel Telescope at Lowell Observatory.
Lowell is a private, non-profit institution dedicated to astrophysical research and public appreciation of astronomy and operates the DCT in partnership with Boston University, the University of Maryland, the University of Toledo, Northern Arizona University and Yale University.
The upgrade of the DeVeny optical spectrograph has been funded by a generous grant from John and Ginger Giovale.
The FLAMINGOS-2 spectrum was obtained at the Gemini Observatory under program GS-2017A-Q-33 (PI: Sand), which is operated by the Association of Universities for Research in Astronomy, Inc., under a cooperative agreement with the NSF on behalf of the Gemini partnership: the National Science Foundation (United States), the National Research Council (Canada), CONICYT (Chile), Ministerio de Ciencia, Tecnología e Innovación Productiva (Argentina), and Ministério da Ciência, Tecnologia e Inovaç\a ao (Brazil).
B.T. and I.A. led the data collection, analysis and interpretation, as well as the manuscript preparation. C.R. performed the analysis and modelling of archival and new X-ray data. S.T. performed the morphological and SED modelling of the host galaxy. D.S., M.B., M.H., N.K., and G.B.L. took part in obtaining and calibrating the Palomar and Keck spectra. H.N. contributed to the identification and interpretation of the Bowen fluorescence spectral features. P.G.J. and A. Horesh contributed to the interpretation of multi-wavelength data and to pursuing follow-up observations. J.E.M-R. contributed to the analysis of optical spectra. G.H., V.H., and C.M. contributed to collecting, calibrating and analysing the Las Cumbres Observatory and Swift/UVOT data. D.A.H. helped schedule and monitor the data from the Las Cumbres Observatory. Ł.W., M.G., and A. Hamanowicz contributed to NIR line identification and provided the optical spectrum of OGLE17aaj. S.B.C. provided the the DCT spectrum. D.S. provided the the Gemini-South/FLAMINGOS-2 NIR spectrum. E.Y.H., M.M.P., and T.D.D. provided the Magellan/FIRE NIR spectrum. E.K. contributed to the X-ray data analysis and interpretation. K.C.G., Z.A., and R.R. contributed to the NICER data acquisition and calibration.
Supplementary information is available for this paper.
Correspondence and requests for materials should be addressed to B.T. (email: benny@astro.tau.ac.il).
The authors declare that they have no competing financial interests.
Methods
Detection and Photometric Monitoring Observations
The source AT 2017bgt (J2000.0 coordinates 16:11:05.696, +02:34:00.52) was first detected by the ASAS-SN survey, using the ASASSN-Brutus telescope, on 2017 February 21, 15:07:12 (; see refs. 14, 2).
The nuclear source was discovered at a host-galaxy-subtracted -band Vega magnitude of .
The previous 5- non-detection from February 13 was at a magnitude of 17.5.
Supplementary Fig. 1 presents the long-term ASAS-SN -band light-curve of the position of AT 2017bgt, obtained using the ASAS-SN Light-Curve Server[13, 3].
We note that the ASAS-SN -band flux measurements are derived from apertures and calibration procedures that are significantly different from the Swift/UVOT measurements presented in Fig. 1 (and described below).
In particular, the ASAS-SN Light-Curve Server uses a large aperture, with a radius of 16′′(compared to the 3.75′′ radius used for our new Swift/UVOT data; see below).
As such, they mainly illustrate the transient nature of AT 2017bgt, and can otherwise provide only combined flux measurements of the nuclear source and its host galaxy (with possible additional blending from nearby sources).
Evidently, a consistent trend of brightening began over one month prior to the detection of AT 2017bgt. The automated ASAS-SN data suggest that the pre-event ASAS-SN -band magnitude of the host galaxy was 15.85, from which we deduce that the nuclear event itself represented a brightening by a (peak) flux density corresponding to 16.7 magnitudes, or by . After reaching peak brightness, the transient began fading at a slow rate, dimming by roughly 0.3 mag at about 200 days after discovery (in the rest-frame). Later photometry, spanning 300-400 days after discovery, reveals brightness levels that are consistent with the peak. This limited evidence for any significant post-flare flux variability is consistent with what is seen in the Swift/UVOT photometric monitoring observations (Fig. 1).
Shortly after detection, we initiated a monitoring campaign of AT 2017bgt using the UV Optical Telescope[4] on board the Neil Gehrels Swift observatory[5], which covers the wavelength range Å. The most relevant band for comparison with the archival GALEX data (see below) is UVM2, with Å. AT 2017bgt was initially observed over 12 epochs, separated by 5.5-43 days. Four additional visits, separated by about a month, took place roughly a year after the transient detection (see Fig. 1b). For each of these visits, we measured the flux in all bands through circular apertures with a diameter of 7.5′′, to match the archival GALEX data (see below). We subtracted the sky flux using the same size aperture from an empty region near the transient. For host-galaxy subtraction, we assumed the archival GALEX flux measurement, discussed below. A more up-to-date measurement of the host contribution will only be available once the transient fades completely. Intrinsic UV luminosities were calculated by taking into account a Milky Way extinction with a colour excess of and assuming a Cardelli et al. extinction law (ref. 6; see also ref. 7). This resulted in a correction of 0.6 magnitudes (or a factor of 1.74). We note that the Milky Way dust correction, and the host light subtraction were not applied to the UV-optical data shown in Fig. 1, which instead shows the raw measured fluxes of AT 2017bgt. Similarly to what is seen in the optical light-curve, the UV emission fades very slowly over the 14 months of our Swift/UVOT monitoring, from about 14.9 to 15.6 AB magnitudes (i.e., about 50% drop in flux). After correcting for Milky Way extinction, this corresponds to a drop of in luminosity, from to .
The fading seen in both the UV and optical emission is much slower than what is typically seen in TDEs. The only way in which the 0.7 magnitude decline in the UV light can be accounted for with a TDE light-curve of the form , is if the disruption time was about two years before the discovery of AT 2017bgt (observed frame, thus about 23 months in rest-frame), and is therefore inconsistent with the data.
Archival multi-wavelength data
The host galaxy of AT 2017bgt is clearly detected in over 9 separate visits of the Panoramic Survey Telescope and Rapid Response System (Pan-STARRS), in all the 5 filters (; with 9, 18, 26, 11, and 13 detections in each of these filters). The stacked images, which have “mean epochs” ranging 2011 August 17 to 2013 June 8, and are publicly available through the Pan-STARRS database, reveal an early-type host galaxy, with no obvious sign of a central point source.
A full GALFIT analysis[8] of the stacked -band image, which has a mean epoch of 2011 August 17 (i.e., about 5.5 years before the transient detection), suggests a bulge-dominated morphology. For a single Sérsic fit, we find a Sérsic index of . The uncertainties are estimated by varying the centre of the light profile within a box of 22 pixels, following the approach described in ref. 9. Performing a bulge-disk decomposition with a fixed disk Sérsic index of (pure exponential profile) gives a bulge-to-total ratio of with a bulge Sérsic index of . We further used GALFIT to assess the possible presence of a central point source. Integrating over the residuals of the disk+bulge fit provides an -band magnitude of . Alternatively, adding a central point source component to the GALFIT model results in , again much fainter than the bulge and disk components, which now have and , respectively (and ). We conclude that the publicly available archival Pan-STARRS data shows no indication of a central point source.
AT 2017bgt is associated with the ROSAT source 1RXS J161105.2+023350. The archival X-ray detection was obtained as part of the ROSAT All Sky Survey (RASS)[10], on 1990 August 9, when the source had a count rate of . The ROSAT count rate can be converted into an observed keV flux assuming that the photon index of the X-ray emission is within this band. This implies that the observed flux is . The hydrogen line-of-sight column density of the Milky Way in the direction of the source is , which provides an intrinsic flux of . The corresponding archival intrinsic luminosity in the same band is , and in the 2–10 keV range is (all luminosities and related quantities were calculated assuming a cosmological model with dark energy and matter densities of and , and a Hubble constant of ). Considering the relation between emission and star formation[11], a star formation rate of would be required to fully account for the X-ray emission in AT 2017bgt. This extremely high value, which is two orders of magnitude larger than what we deduce from the archival data for the host galaxy of AT 2017bgt (see below), means that ROSAT detected an AGN in this object.
The position of AT 2017bgt was observed in the 1.4 GHz band, as part of the FIRST radio survey, on 1998 July 17. The reported peak and integrated flux densities are mJy, and mJy (ref. 12). This translates to a monochromatic radio luminosity of Such a low radio luminosity can originate purely from SF, with a corresponding star formation rate of about (ref. 13, 14), which is consistent with the UV-based SFR estimate derived from archival GALEX data (see below). Indeed, the large majority of sources with such low radio luminosities are star-forming galaxies[15, 16]. However, the aforementioned archival X-ray detection suggests that this may not be the case.
The area around AT 2017bgt was also observed in the UV as part of the GALEX All-sky Imaging (AIS) survey, on 2004 May 17. The catalogued measured brightness of the corresponding source (GALEX J161105.7023359) is in the NUV band ( Å), and in the FUV band ( Å). These are measured through a circular aperture with a diameter of 7.5′′, which is preferable since it can be consistently applied to other imaging data for this source. After correcting for Milky-Way extinction, the NUV brightness translates to a luminosity density of . Associating this luminosity with star formation in the host galaxy would translate to a star formation rate of (for a Salpeter initial mass function; ref. 17), which is within the range expected for a galaxy with the stellar mass of the host (see below; ref. 18). Alternatively, the UV continuum emission observed with GALEX can also be interpreted as originating from accretion onto the SMBH (i.e., an AGN). Assuming no variability between the ROSAT and GALEX observations, we can calculate a UV-to-X-ray spectral slope, commonly defined through :
| (1) |
This value is in excellent agreement with what is expected from AGN with similar (UV) luminosities[19, 15].
Combining the GALEX data with the Pan-STARRS stacked optical images and 2MASS near-IR images, we obtain a UV-optical-near-IR spectral energy distribution (SED) of the host galaxy. All fluxes have been measured with the same aperture. The SED is fit assuming the stellar population synthesis templates of ref. 20, and an exponentially declining star formation history (, where is a model parameter denoting a typical timescale). This resulted in a stellar mass of , a star formation rate of , and a dust attenuation in the -band of . Since the stellar mass does not depend on the UV-blue emission, we obtain an essentially identical mass estimate when refitting the SED but ignoring the GALEX data (i.e., if the archival UV detection is due to SMBH activity). However, the corresponding SFR drops to .
We finally note that the area around AT 2017bgt was observed with the The Wide-field Infrared Survey Explorer (WISE)[21], during 2010 February and August. The host galaxy is clearly detected in multiple scans, with Vega magnitudes of (12.283,11.857,8.881,6.511), and no clear evidence for variability. These suggest mid-IR colours that are consistent with star-forming galaxies[21, 22].
New X-ray data
Swift/XRT observations and data. Our Swift monitoring campaign of AT 2017bgt provided X-ray measurements with the X-Ray Telescope (XRT; ref. 23), covering the energy range . The individual effective exposure times ranged between s. The Swift/XRT data obtained in each of the 16 visits was analysed using the xrtpipeline v0.13.4 within heasoft v6.24 following standard guidelines, to provide a time-series of observed X-ray fluxes and SEDs.
The XRT SEDs were fitted with a simple power-law model. This resulted in photon indices in the range – consistent with what is seen in low-redshift AGN[24]. The X-ray flux in the 0.1–2.4 keV band measured in these Swift/XRT observations, , is times brighter than that recorded by ROSAT in the same energy range (), back in 1990. The new XRT measurements translate to (0.1–2.4) keV luminosities of . By assuming power-law continuum X-ray emission, we obtain 2–10 keV luminosities in the range . We adopt a nominal value of , corresponding to the 2017 April 24 Swift/XRT observation (see Supplementary Table 1). Combining the series of Swift/XRT and UVOT measurements, we obtain UV-to-X-ray spectral slopes in the range , with being both the value obtained for the April 24 Swift observation, and the median value.
We have also constructed a stacked X-ray SED from the first 12 epochs of Swift/XRT observations, corresponding to an effective exposure time of 20 ks. While a model including a power-law and a blackbody component can adequately describe this stacked SED (resulting in a Cash statistic of for 318 degrees of freedom), it shows clear residuals around the Fe K line region. Adding a Gaussian component (’zgauss’ in XSPEC) with the redshift fixed to systemic () improves the fit ( for 316 d.o.f.), and results in a photon index of and a blackbody temperature of eV. The emission line has an energy consistent with the Fe K fluorescent feature ( keV), and is remarkably strong for an unobscured AGN, with an equivalent width of eV. This is comparable with some of the strongest Fe K lines known to date, for example, the NLSy1 galaxies IRAS 132243809 (; ref. 25) and 1H 0707495 (; ref. 26), and the obscured AGN IRAS 005217054 (; ref. 27). We note, however, that the line strength significantly decreases in the higher-flux observations of AT 2017bgt. Indeed, the emission line is not robustly detected in a stacked XRT SED that includes all epochs during which the flux was higher than the median, that is . It is also not seen in the higher quality and much broader energy coverage X-ray spectrum we obtain using other facilities (see below).
NuSTAR observations and data. We observed AT 2017bgt in the 3-24 keV energy range using the Nuclear Spectroscopic Telescope Array (NuSTAR; ref. 28), on 2018 June 25 (starting UT16:11:09), for a total of 44 ks. The NuSTAR data were processed using the NuSTAR Data Analysis Software nustardas v1.7.1 within heasoft v6.24, adopting the latest calibration files[29]. A circular region of 50′′was used for source extraction, while the background was extracted from an annulus centred on the X-ray source, with an inner and outer radii of 60 and 120′′, respectively.
NICER observations and data. The Neutron star Interior Composition ExploreR (NICER; ref. 30), mounted aboard the International Space Station, observed AT 2017bgt on 2018 June 25 (ObsIDs: 1100440108, 1100440109; starting UT15:53:07 and 23:35:46, respectively) for the entirety of the NuSTAR observation, but was heavily affected by high background rates, leaving 18 ks of Good Time Intervals. The data were processed using the standard NICER data analysis software (’DAS’) v2018-03-01_V003 and were cleaned using standard calibration with ’nicercal’ and standard screening with ’nimaketime’. To filter out high background regions, we made a cut on magnetic cut-off rigidity (COR_SAX 2) and selected events that were detected outside the SAA. We selected events that were not flagged as “overshoots” or “undershoots” (EVENT FLAGSbxxxx00). We also omitted forced triggers. We required pointing directions to be at least 30∘ above the Earth limb and 40∘ above the bright Earth limb. The cleaned events use standard “trumpet” filtering to eliminate additional known background events (using the tool nicermergeclean). We estimated in-band background from the and trumpet-rejected count-rates, and used this to select the appropriate background model from observations of a blank field. NICER robustly detected AT 2017bgt above the background level in the energy range .
Combined X-ray spectral analysis.
The combined, quasi-simultaneous spectrum, including the NuSTARand NICER data of AT 2017bgt, and a special short (400 s) Swift/XRT observation taken on 2018 June 26 (UT11:13:14), is shown in Supplementary Fig. 2.
We fitted this spectrum with a spectral model consisting of a primary power-law and a blackbody component to account for the soft excess[31, 32], as well as Galactic absorption (i.e., tbabs(zpo+zbb) in XSPEC).
This provides a good fit to the data, with -Stat/ for 918 degrees of freedom, and results in a blackbody temperature of eV and a photon index of . This slope is in very good agreement with that obtained by fitting the NuSTAR data alone ().
We also considered a cross-calibration constant () between the different instruments, which was fixed to 1 for NuSTAR Focal Plan Module A (FPMA), and was left free to vary for the other instruments.
For NuSTAR/FPMB and Swift/XRT we obtained and , respectively, while for NICER we found a larger value (), possibly due, at least in part, to variability, since the NuSTAR/Swiftand NICER observations were not completely overlapping.
Both of these measurements are consistent with what is found in local AGN[33, 34].
We adopt the spectral parameters obtained from our fit to the combined, high-quality X-ray spectrum.
We note that this combined spectrum shows no clear sign of a Fe K emission line, which is rather expected given that it was obtained when AT 2017bgt was in a relatively high-flux state (see above).
Optical spectroscopy.
Optical spectroscopic observations. Shortly after obtaining our classification spectrum, we initiated an intensive follow-up campaign using the Las Cumbres Observatory network of telescopes[35]. The spectra were obtained using the twin FLOYDS spectrographs mounted on the Las Cumbres Observatory 2-meter telescopes in the Haleakala, Hawaii,USA, and Siding Spring, Australia, observatories. These spectra cover a wavelength range of Å with a spectral resolution of , and were obtained using 2′′slits and 45-minute-long observations. The spectra were reduced using the PyRAF-based floydsspec pipeline (https://github.com/svalenti/FLOYDS_pipeline/).
Additional, higher-resolution and higher-S/N optical spectra were obtained on several occasions during the first six months of monitoring AT 2017bgt through the spring and summer of 2017. These include a March 3 spectrum taken with the DoubleSpec instrument on the Hale 200-inch telescope at the Palomar observatory (CA, USA); a March 16 spectrum taken with the DeVeny instrument on the Discovery Channel Telescope, at the Lowell observatory (AZ, USA); an April 28 spectrum taken with the LRIS instrument on the W. M. Keck telescope (HI, USA); and another Palomar/DoubleSpec spectrum taken on July 28. These spectra correspond to 10, 23, 66, and 157 days after the transient discovery, and are shown in Supplementary Fig. 3. All these optical spectra were reduced following standard procedures. The higher-resolution spectra show the same features as seen in the ones obtained with the Las Cumbres Observatory, specifically the AGN-like Balmer, [O iii], and [N ii] emission lines, as well as the prominent, broad, and double-peaked emission feature near 4640 Å.
To correct for the varying observing conditions during spectroscopic observations, we scaled all of our spectra to match the optical Swift/UVOT photometry, linearly interpolating the UVOT -band data to the spectroscopic epochs and using standard synthetic photometry. All our spectra are publicly available on the Weizmann Interactive Supernova data REPository (WISeREP[36]).
Spectral analysis of the complex. We decomposed the H spectral region of the 2017 March 4 optical spectrum of AT 2017bgt, taken with the DoubleSpec instrument mounted on the Hale 200-inch telescope at the Palomar observatory, following the methodology of ref. 37, with necessary adaptations. Specifically, we allowed for a much stronger broad He ii emission line, and for an additional broad emission line to account for the blue peak seen in the optical spectra. Each of these broad emission features is modelled by two Gaussian profiles, with widths forced to match those fit for the broad H line, and within the range or . The centres of these Gaussians are free to vary by relative to those of the broad H profile. This procedure resulted in a satisfactory fit, shown in Supplementary Fig. 5, which indicates that the rest-frame equivalent widths of the broad He ii and N iii emission lines are and 24.0 Å, respectively. We stress that the spectral decomposition procedure accounts for the much weaker, blended emission from ionized iron (see ref. 37 for details).
Composite spectrum construction. The SDSS composite shown in Fig. 2 was constructed from 1068 quasars at , drawn from the large sample analysed in ref. 37. The redshift range was chosen to assure that the spectral complexes surrounding both the H and O iii lines is within the SDSS coverage. We further selected only those quasars for which the width of the broad component of the H line is in the range , comparable with what is measured in AT 2017bgt. The composite was then constructed by computing the geometrical mean in each 1 Å (rest-frame) bin.
Strong emission line ratio diagnostics. We used the four high-resolution spectra discussed above (Supplementary Fig. 3) to measure strong emission line ratio diagnostics, and specifically [O iii] /H vs.[N ii] /H narrow line ratios. Supplementary Fig. 4a presents the measured line ratios, in addition to widely used classification schemes[38, 39, 40] – that is, the so-called Baldwin, Phillips & Terlevich (BPT) diagram[41]. The emission line ratios we measure, and specifically those measured from the earliest high-resolution spectrum of AT 2017bgt taken 10 days after discovery (in the rest-frame), are consistent with being driven by ionizing radiation from a “composite” emission source, which includes radiation from an accreting SMBH (that is, an AGN) in addition to young stars (that is, star-forming regions). The light-curve of the [O iii]/H line ratio, which includes all the available spectra where we could perform our spectral decomposition (that is., among the Las Cumbres Observatory spectra), is shown in Supplementary Fig. 4b. The light-curve shows essentially no real variability in the line ratio, which is expected given the long recombination time-scale in the low-density narrow-line emission region (of order 100 years; ref. 42) and the long light travel time-scales (100 years; refs. [17, 18]).
We caution that, with a broad line width of about 2000 km s-1, and given the limited spectral resolution of the Las Cumbres data, it becomes challenging to properly decompose the narrow H line emission from the entire line profile. This is the reason why many measurements are so close to the constraint that is inherent to our spectral decomposition procedure.
Near-IR spectroscopy.
We obtained two NIR spectra of AT 2017bgt. The first spectrum was obtained on 2017 April 21 (i.e., 2 months after the transient detection), with the FIRE instrument on the Magellan-Baade telescope at the Las Campanas observatory[43]. The second spectrum was obtained on May 31 (99 days after detection), with the FLAMINGOS-2 instrument on the Gemini-South telescope[44]. Both spectra are shown in Supplementary Fig. 6, compared to a NIR composite spectrum of 27 quasars, taken from ref. 45. They exhibit a number of broad hydrogen emission lines (for example, , , , ,), as well as strong helium lines, such as and . Importantly, in AT 2017bgt all these emission lines are single-peaked, while the helium features are relatively strong. This is also the case for other helium emission lines across the optical regime, including He ii (see Supplementary Fig. 3). This rules out the possibility that the blue peak within the broad optical emission feature (near 4640 Å) originates in a disk-like He ii emitting region.
Determination of key SMBH properties
The range of mass accretion rates is derived from bolometric luminosities, that are in turn estimated by assuming the X-ray and optical bolometric corrections of ref. 46. For the UV bolometric correction, we assume a value of 3.5, which reflects the range of values reported in the literature[47, 48], and the expectation that the bolometric correction at Å (observed with Swift/UVOT) would be larger than those calibrated for AGN continuum emission at 1450 Å (following a general AGN SED of ; for example, ref. 16). We stress that the UV-based bolometric luminosity, of , is probably an overestimate, since the rest of the SED of AT 2017bgt does not scale with the UV emission as in normal AGN[15]. To obtain mass accretion rates (), we finally assume a radiative efficiency of , where (and is the velocity of light).
The estimate of the size of the H-emitting region, , and of the BH mass, , relies on the results of reverberation mapping experiments of broad-line AGN, which provide a way to link the observed optical continuum luminosity and the size of the line-emitting region and to obtain single-epoch, “virial” mass estimates[49, 50, 51, 52]. For AT 2017bgt, the working assumption of a virialized BLR (or H-emitting region) can be justified by the (persistent) shapes of the broad Balmer emission lines, which resemble those of normal broad-line AGN. Moreover, the optical luminosities measured from our spectroscopy place AT 2017bgt at the heart of the range of luminosities probed by reverberation mapping experiments of low-redshift AGN, and of the corresponding BLR size – luminosity relations[53]. In what follows, we rely on the best-fit spectral model for the 2017 March 4, Palomar/DoubleSpec spectrum (described in ’Optical spectroscopy’ above). The monochromatic luminosity at 5100 Å, of , translates to an H-emitting region size of or light-days, following the prescriptions given in refs. 37 and 53, respectively. Combining the former value with an H line width of , and the mass prescription given in ref. 37, we obtain . The larger (latter) estimate would increase this estimate by about 0.1 dex, which is much smaller than the systematic uncertainties on , which are of order 0.3-0.4 dex (ref. 50). Given the extremely intense UV continuum emission and the fact that the size of the H-emitting region is driven by the ionizing UV (rather than optical) continuum, we further caution that the BLR size, and thus , could be considerably larger, perhaps by as much as a factor of (see, for example, refs. 54, 55).
Relevant mechanisms for the long-lived UV flare
Here We discuss some of the mechanisms that may be considered relevant for driving the intense UV brightening in AT 2017bgt and the other events we associate with this proposed class. As noted in the main text, given the evidence for AGN-like activity in AT 2017bgt (and the other events) both before and after the UV-optical event, we focus our brief discussion here on processes related to (thin) accretion disks that feed SMBHs. In this context, we note that the transient optical rise time of a few weeks is only slightly longer than the dynamical timescale in a thin disk, given our estimate (4 days; see §Typical timescales in thin accretion disks around SMBHs below). The longevity of the enhanced UV emission, of over a year, is considerably longer than the thermal timescale (50 days, at most), and is instead starting to be comparable with the time-scales over which heating fronts may propagate through the disk (3 years).
Tidal disruption events. Some TDEs, which are generally thought to be powered by a newly formed, transient accretion disk, show a fast increase in UV continuum emission, accompanied by strong He ii emission[3, 4, 56, 6, 57, 58]. However, the temporal evolution of AT 2017bgt, F01004-2237 and OGLE17aaj is much slower than what is seen in TDEs (see Fig. 1 and Supplementary Fig. 1). In addition, the He ii line seen in these three transients is much narrower than in TDEs (see Fig. 4). Although the TDE ASASSN-14li displays emission lines that are narrower than other TDEs (in a late-time spectrum, 86-days from discovery; ref. 6), it still exhibits a very broad base of the He ii line, not seen in our class of events. Tidal disruptions of giant stars can produce slowly-evolving light curves [59], but in that case both the rise and decline of the light curve are expected to last several years, whereas the rise in our class of events is much more sudden. Recently, two events claimed to be TDEs were reported to have long-lived light curves. One is interpreted to be a TDE around an intermediate-mass BH[60] and the other is a dust-reprocessed TDE “echo” in a merging starburst galaxy[61]. Neither of these cases relate to AT 2017bgt (nor to the two sources we associate with it). Moreover, the strong [O iii] line emission seen in all three events suggests that the SMBHs were not completely dormant prior to the sudden (UV/optical) brightening, further weakening the case for a TDE. Given these stark differences, we conclude that a TDE is unlikely to be driving AT 2017bgt (and by association, the F01004-2237 event and OGLE17aaj).
An interaction between an outflow and the BLR. A recently published model describes the interaction of an outflow launched from the vicinity of a SMBH with the BLR gas[66]. According to this model, an outflow with may account for the 1 year-long enhanced emission we observe in AT 2017bgt. Such an outflow would, however, require a period of several months () to reach the BLR, and it is unclear how this mechanism would provide favourable conditions for extreme UV and BF emission. If the broad H line is also emitted from an out-flowing region, then this may have implications for our estimates of and , as they assumed a virialized H line emitting region (see ref. 67 for a detailed discussion).
Other mechanisms. There are several other physical mechanisms that have been proposed to give rise to dramatic increase in (UV-optical) emission from accreting SMBHs. Periodic tidal interactions between the SMBH and an orbiting binary pair of stars may account for recurring “outbursts” of accretion-driven X-ray and optical emission, separated by several years, like those observed in some AGN[62, 63]. In each interaction episode some of the gas in the star envelope is accreted onto the SMBH through a transient disk, perhaps masquerading as a TDE[64]. A stellar origin for the gas may explain the high metallicity and density of the BF line-emitting gas in AT 2017bgt. However, it is unclear how this scenario would explain the persistence of the current episode of enhanced accretion (and UV emission) lasting over a year or, more importantly, the emission line profiles, which indicate an extended distribution of highly-ionized gas. Some models suggest that binary SMBHs may also exhibit sudden enhancement of SMBH accretion, accompanied by increased UV emission, driven by occasional shocks and events of drastic angular momentum loss in the dense circum-binary accretion flow[65]. As these episodes are expected to last over periods that are several times the binary orbital period, the prolonged enhanced UV emission can be accounted for, unless the binary separation is extremely tight (that is pc). Given the data in hand, however, it is impossible to determine the real state of accretion onto the SMBH in AT 2017bgt over the periods required to test any of these scenarios, and particularly between the archival detections (in the X-rays and UV) and the recent increase in UV-optical flux.
Typical timescales in thin accretion disks around SMBHs
For the sake of completeness, we recall here several key timescales in geometrically-thin, optically-thick accretion disks around AGN (and SMBHs). These timescales are derived in many references (for example, refs. 68, 69). Here we follow the recent discussion of these timescales in the context of changing look AGN, provided in ref. 70. The timescales are commonly parametrized in terms of the BH mass, (which for AT 2017bgt we estimate to be ); the distance from the BH, in terms of the gravitational radius, (where ); the disk scaled height , which in thin disks is of order 0.05; and the pseudo-viscosity parameter , which in thin disks is of order 0.03. The dynamical timescale is the typical timescale for (azimuthal) Keplerian motion of the disk material around the BH, and is given by:
| (2) |
The thermal timescale is the typical timescale for the disk cooling or heating, and thus further depends on the viscosity parameter:
| (3) |
Cooling or heating fronts may travel throughout the disk on longer timescales, accounting for the disk geometry:
| (4) |
Finally, the viscous timescale, over which material travels radially from a radius to the BH, is yet longer:
| (5) |
We recall that the radius within the disk that is relevant for the continuum emission is both wavelength- and accretion rate- dependent, so that the dynamical timescale can be expressed as: (with given in and in Å). Given the derived properties of AT 2017bgt, the near-UV data (with Å) would correspond to .
Data availability
The data that support the findings of this study are available from the corresponding author upon reasonable request. All of our spectra are publicly available on the Weizmann Interactive Supernova data REPository (WISeREP)[36]. The data used to prepare Supplementary Fig. 1 are available from the ASAS-SN Light Curve Server (https://asas-sn.osu.edu/).
Additional References
References
- [1]
- [2] Stanek, K. Z. ASAS-SN transient discovery report for 2017-02-22. Transient Name Server Discovery Report, No. 2017-223 (2017).
- [3] Kochanek, C. S. et al. The All-Sky Automated Survey for Supernovae (ASAS-SN) light curve server v1.0. PASP 129, 104502 (2017).
- [4] Roming, P. W. A. et al. The Swift ultra-violet/optical telescope. Space Sci. Rev. 120, 95–142 (2005).
- [5] Gehrels, N. et al. The Swift gamma ray burst mission. ApJ 611, 1005–1020 (2004).
- [6] Cardelli, J. A., Clayton, G. C. & Mathis, J. S. The relationship between infrared, optical, and ultraviolet extinction. ApJ 345, 245 (1989).
- [7] Wyder, T. K. et al. The ultraviolet galaxy luminosity function in the local universe from GALEX data. ApJ 619, L15 (2005).
- [8] Peng, C. Y., Ho, L. C., Impey, C. D. & Rix, H. Detailed decomposition of galaxy images. II. Beyond axisymmetric models. AJ 139, 2097–2129 (2010).
- [9] Tacchella, S. et al. The SINS/zC-SINF survey of galaxy kinematics: Rest-frame morphology, structure, and colors from near-infrared Hubble Space Telescope imaging. ApJ 802, 101 (2015).
- [10] Voges, W. et al. Circular - Central Bureau for Astronomical Telegrams, International Astronomical Union. IAU Circ., Edited by Green, D. W. E., 7432 (2000).
- [11] Ranalli, P., Comastri, A. & Setti, G. The 2-10 keV luminosity as a star formation rate indicator. A&A 399, 39–50 (2003).
- [12] Helfand, D. J., White, R. L. & Becker, R. H. The last of FIRST: the final catalog and source identifications. ApJ 801, 26 (2015).
- [13] Yun, M. S., Reddy, N. A. & Condon, J. Radio properties of infrared‐selected galaxies in the IRAS 2 Jy sample. ApJ 554, 803–822 (2001).
- [14] Hopkins, A. M. et al. Star formation rate indicators in the Sloan Digital Sky Survey. ApJ 599, 971–991 (2003).
- [15] Heckman, T. M. & Best, P. N. The coevolution of galaxies and supermassive black holes: insights from surveys of the contemporary universe. ARA&A 52, 589–660 (2014).
- [16] Padovani, P. The faint radio sky: radio astronomy becomes mainstream. A&A Rev. 24, 1–61 (2016).
- [17] Kennicutt, R. C. Star formation in galaxies along the Hubble sequence. ARA&A 36, 189–231 (1998).
- [18] Salim, S. et al. UV Star Formation Rates in the Local Universe. ApJS 173, 267–292 (2007).
- [19] Just, D. W. et al. The X‐Ray properties of the most luminous quasars from the Sloan digital sky survey. ApJ 665, 1004–1022 (2007).
- [20] Bruzual, G. & Charlot, S. Stellar population synthesis at the resolution of 2003. MNRAS 344, 1000 (2003).
- [21] Wright, E. L. et al. The Wide-field Infrared Survey Explorer (WISE): Mission description and initial on-orbit performance. AJ 140, 1868–1881 (2010).
- [22] Stern, D. et al. Mid-infrared selection of active galactic nuclei with the Wide-field Infrared Survey Explorer . I. characterizing WISE-selected active galactic nuclei in COSMOS. ApJ 753, 30 (2012).
- [23] Burrows, D. N. et al. The Swift X-Ray telescope. Space Sci. Rev. 120, 165–195 (2005).
- [24] Trakhtenbrot, B. et al. BAT AGN Spectroscopic Survey (BASS) – VI. The X–L/LEdd relation. MNRAS 470, 800–814 (2017).
- [25] Fabian, A. C. et al. Long XMM observation of the narrow-line Seyfert 1 galaxy IRAS 13224-3809: Rapid variability, high spin and a soft lag. MNRAS 429, 2917–2923 (2013).
- [26] Fabian, A. C. et al. Broad line emission from iron K- and L-shell transitions in the active galaxy 1H 0707-495. Nature 459, 540–542 (2009).
- [27] Ricci, C. et al. Suzaku observation of IRAS 00521-7054, a peculiar type-II AGN with a very broad feature at 6 keV. ApJ 795, 147 (2014).
- [28] Harrison, F. A. et al. The Nuclear Spectroscopic Telescope Array (NuSTAR) high-energy X-ray mission. ApJ 770, 103 (2013).
- [29] Madsen, K. K. et al. Calibration of the NuSTAR High-energy Focusing X-ray Telescope. ApJS 220, 8 (2015).
- [30] Gendreau, K. C., Arzoumanian, Z. & Okajima, T. The Neutron star Interior Composition ExploreR (NICER): an Explorer mission of opportunity for soft x-ray timing spectroscopy. In Space Telescopes and Instrumentation 2012: Ultraviolet to Gamma Ray, vol. 8443 of Proc. SPIE, 844313 (2012).
- [31] Gierliński, M. & Done, C. Is the soft excess in active galactic nuclei real? MNRAS 349, L7–L11 (2004).
- [32] Crummy, J., Fabian, A. C., Gallo, L. & Ross, R. R. An explanation for the soft X-ray excess in active galactic nuclei. MNRAS 365, 1067–1081 (2005).
- [33] Winter, L. M., Veilleux, S., McKernan, B. & Kallman, T. R. The Swift burst alert telescope detected Seyfert 1 galaxies: X-ray broadband properties and warm absorbers. ApJ 745, 107 (2012).
- [34] Ricci, C. et al. BAT AGN Spectroscopic Survey – V. X-ray properties of the Swift/BAT 70-month AGN catalog. ApJS 233, 17 (2017).
- [35] Brown, T. M. et al. Las Cumbres observatory global telescope network. PASP 125, 1031–1055 (2013).
- [36] Yaron, O. & Gal-Yam, A. WISeREP – an interactive supernova data repository. PASP 124, 668–681 (2012).
- [37] Trakhtenbrot, B. & Netzer, H. Black hole growth to - I. Improved virial methods for measuring and . MNRAS 427, 3081–3102 (2012).
- [38] Kewley, L. J., Heisler, C. A., Dopita, M. A. & Lumsden, S. Optical Classification of Southern Warm Infrared Galaxies. ApJS 132, 37–71 (2001).
- [39] Kauffmann, G. et al. The host galaxies of active galactic nuclei. MNRAS 346, 1055–1077 (2003).
- [40] Schawinski, K. et al. Observational evidence for AGN feedback in early-type galaxies. MNRAS 382, 1415–1431 (2007).
- [41] Baldwin, J. A., Phillips, M. M. & Terlevich, R. Classification parameters for the emission-line spectra of extragalactic objects. PASP 93, 5 (1981).
- [42] Peterson, B. M. et al. The size of the narrow-line-emitting region in the Seyfert 1 galaxy NGC 5548 from emission-line variability. ApJ 779, 109 (2013).
- [43] Simcoe, R. A. et al. FIRE: a near-infrared cross-dispersed echellette spectrometer for the Magellan telescopes. Proc. SPIE 7014, 70140U (2008).
- [44] Eikenberry, S. S. et al. FLAMINGOS-2: the facility near-infrared wide-field imager and multi-object spectrograph for Gemini. Proc. SPIE 5492, 1196–1207 (2004).
- [45] Glikman, E., Helfand, D. J. & White, R. L. A near-infrared spectral template for quasars. ApJ 640, 579–591 (2006).
- [46] Marconi, A. et al. Local supermassive black holes, relics of active galactic nuclei and the X-ray background. MNRAS 351, 169–185 (2004).
- [47] Runnoe, J. C., Brotherton, M. S. & Shang, Z. Updating quasar bolometric luminosity corrections. MNRAS 422, 478–493 (2012).
- [48] Netzer, H. et al. Star formation black hole growth and dusty tori in the most luminous AGNs at . ApJ 819, 123 (2016).
- [49] Kaspi, S. et al. Reverberation Measurements for 17 Quasars and the Size-‐Mass-‐Luminosity Relations in Active Galactic Nuclei. ApJ 533, 631–649 (2000).
- [50] Shen, Y. The mass of quasars. Bull. Astron. Soc. Ind. 41, 61–115 (2013).
- [51] Peterson, B. M. Measuring the Masses of Supermassive Black Holes. Space Sci. Rev. 183, 253–275 (2014).
- [52] Mejía-Restrepo, J. E., Trakhtenbrot, B., Lira, P., Netzer, H. & Capellupo, D. M. Active galactic nuclei at – II. Black hole mass estimation by means of broad emission lines. MNRAS 460, 187–211 (2016).
- [53] Bentz, M. C. et al. The low-luminosity end of the radius-luminosity relationship for active galactic nuclei. ApJ 767, 149 (2013).
- [54] Kaspi, S. et al. The relationship between luminosity and broad‐line region size in active galactic nuclei. ApJ 629, 61–71 (2005).
- [55] Pei, L. et al. Space telescope and optical reverberation mapping project. V. Optical spectroscopic campaign and emission-line analysis for NGC 5548. ApJ 837, 131 (2017).
- [56] Holoien, T. W.-S. et al. ASASSN-15oi: a rapidly evolving, luminous tidal disruption event at 216 Mpc. MNRAS 463, 3813–3828 (2016).
- [57] Blagorodnova, N. et al. iPTF16fnl: A faint and fast tidal disruption event in an E+A galaxy. ApJ 844, 46 (2017).
- [58] Hung, T. et al. Revisiting optical tidal disruption events with iPTF16axa. ApJ 842, 29 (2017).
- [59] MacLeod, M., Guillochon, J. & Ramirez-Ruiz, E. The tidal disruption of giant stars and their contribution to the flaring supermassive black hole population. ApJ 757, 134 (2012).
- [60] Lin, D. et al. A luminous X-ray outburst from an intermediate-mass black hole in an off-centre star cluster. Nat. Astron. 2, 656–661 (2018).
- [61] Mattila, S. et al. A dust-enshrouded tidal disruption event with a resolved radio jet in a galaxy merger. Science 361, 482–485 (2018).
- [62] Campana, S. et al. Multiple tidal disruption flares in the active galaxy IC 3599. A&A 581, A17 (2015).
- [63] Grupe, D., Komossa, S. & Saxton, R. IC 3599 did it again: a second outburst of the X-ray transient Seyfert 1.9 galaxy. ApJ 803, L28 (2015).
- [64] Metzger, B. D. & Stone, N. C. Periodic accretion-powered flares from colliding EMRIs as TDE imposters. ApJ 844, 75 (2017).
- [65] Farris, B. D., Duffell, P., MacFadyen, A. I. & Haiman, Z. Characteristic signatures in the thermal emission from accreting binary black holes. MNRAS 446, L36–L40 (2015).
- [66] Moriya, T. J., Tanaka, M., Morokuma, T. & Ohsuga, K. Superluminous Transients at AGN Centers from Interaction between Black Hole Disk Winds and Broad-line Region Clouds. ApJ 843, L19 (2017).
- [67] Netzer, H. & Marziani, P. The Effect of Radiation Pressure on Emission-Line Profiles and Black Holes Mass Determination in Active Galactic Nuclei. ApJ 724, 318–328 (2010).
- [68] Frank, J., King, A. R. & Raine, D. J. Accretion power in astrophysics. (Cambridge University Press, 2002), 3rd edn.
- [69] Netzer, H. The Physics and Evolution of Active Galactic Nuclei (Cambridge University Press, Cambridge, 2013).
- [70] Stern, D. et al. A Mid-IR Selected Changing-Look Quasar and Physical Scenarios for Abrupt AGN Fading. ApJ 864, 27 (2018).
See pages - of SI_AT2017bgt_arxiv.pdf