Quasiparticle self-consistent electronic band structures of Be-IV-N2 compounds
Abstract
The electronic band structures of BeSiN2 and BeGeN2 compounds are calculated using the quasiparticle self-consistent method. The lattice parameters are calculated for the wurtzite based crystal structure commonly found in other II-IV-N2 compounds with the space group. They are determined both in the local density approximation (LDA) and generalized gradient approximation (GGA), which provide lower and upper limits. At the GGA lattice constants, which gives lattice constants closer to the experimental ones, BeSiN2 is found to have an indirect band gap of 6.88 eV and its direct gap at is 7.77 eV, while in BeGeN2 the gap is direct at and equals 5.03 eV. To explain the indirect gap in BeSiN2 comparisons are made with the parent III-N compound w-BN band structure. The effective mass parameters are also evaluated and found to decrease from BeSiN2 to BeGeN2.
I Introduction
BeSiN2 and BeGeN2 form part of a larger family of II-IV-N2 nitrides, which can be viewed as derived from the III-N family by replacing two of the group-III atoms in each tetrahedron surrounding the N by a group-II atom and two by a group-IV atom. By expanding the family of group-III nitrides including these heterovalent ternaries, significant new opportunities for band structure engineering and materials property design are opened. The occurrence of two different valence cations in these structures presents new challenges in terms of stoichiometry control, understanding the possible disorder effects, and more complex defect physics but also offers new possibilities in combination with existing nitrides exploiting band-offsets between lattice matched pairs of compounds. For an overview of this materials family and related recent work, see Refs. Lambrecht and Punya, 2013; Martinez et al., 2017; Lyu et al., 2018.
The special interest in Be as group II element arises from it being a second row element in the periodic table. This makes the related compounds closely related to BN, the III-N parent compound. BN itself is an interesting material usually found in a layered form similar to graphite, and knows as hexagonal or h-BN. However, at high pressures a tetrahedrally bonded form exists, which is usually found in the cubic zincblende polytype. Nonetheless there also exists a hexagonal tetrahedrally bonded form with the wurtzite structure. Both these forms are considered extremely hard materials comparable to diamond in their properties. The atmospheric pressure form however is graphite like and involves trigonal bonding because of -bonding between the second row elements B and N. By replacing B with Be and Si or Be and Ge we may preserve some of the unique properties of BN and at the same time favor the tetrahedral bonding resulting in extremely hard and wide band gap materials.
BeSiN2 and BeGeN2 are expected to have among the highest band gaps in this family of materials and could thus be useful for optical devices with wavelengths in the ultraviolet region. Synthesis of BeSiN2 and its crystal structure were reported by Eckerlin et al. in 1967.Eckerlin et al. ; Eckerlin The structural properties and electronic band structures at the level of density functional theory (DFT) of BeSiN2 and BeGeN2 were reported by Huang et al. Huang et al. (2001) and Shaposhnikov et al. Shaposhnikov et al. (2008). However, DFT in the local density approximation (LDA) is well known to underestimate the band gaps for semiconductors. A more accurate method is needed to predict the electronic properties of the Be-IV-N2 compounds, which have not yet been determined experimentally. Here we present a study of the band structures using the quasiparticle self-consistent method, van Schilfgaarde et al. (2006) which provides excellent agreement with experimental band gaps for most tetrahedrally bonded semiconductors. The goals of this work are to predict accurate band gaps, valence band fine structure and effective masses of these materials and to provide and understanding of the direct or indirect nature of the gaps. The details of the computational methodology used here can be found in section II. The structural properties are given in section III.1, and the discussion on stability is in III.2. The electronic band structures are shown in section III.3, and the effective masses in section III.4. We summarize the main results in section IV.
II Computational method
The structural properties are obtained via the Broyden-Fletcher-Goldfarb-Shanno (BFGS) minimization method Schlegel (1982) using the ABINIT packageGonze et al. (0211) in both local density approximation(LDA) and generalized-gradient approximation in the Perdew-Burke-Ernzerhof form(PBE-GGA)Perdew et al. (1996) within the general context of density functional theory. The BFGS method allows one to optimize the cell shape and atomic positions simultaneously because it makes use of the stress tensor and hence gradients are available for the total energy with respect to atomic displacements as well as the lattice constants defining the shape and volume of the unit cell. The interaction between valence electrons and ions are described using a pseudopotential. To be more specific, we used the Hartwigsen-Goedecker-Hutter (HGH) Hartwigsen et al. (1998) pseudopotentials in LDA and Fritz-Haber-Institute (FHI)Fuchs and Scheffler (1999) pseudopotentials in GGA. The wave functions are expanded in a plane wave (PW) basis set with energy cutoff of 100 Hartree and a k-point mesh sampling of the Brillouin zone is used. The forces are relaxed to be less than Hartree/Bohr.
Next, the density functional theory (DFT) Kohn and Sham (1965) band structures are calculated using the full-potential linearized muffin-tin orbital (FP-LMTO) all-electron method.Methfessel et al. (2000); Kotani and van Schilfgaarde (2010); lms This provides a check on the pseudopotential band structures with a method that does not require pseudopotentials. In the FP-LMTO calculations, we used a double- basis set where denotes the decay length of the spherical wave basis function envelopes, which are smoothed Hankel functions. These are then augmented inside the spheres in spherical harmonics up to times radial functions and their energy derivatives corresponding to the actual all-electron potential inside the spheres. Specifically, on Be atom and on other atoms are included in the basis set. The Ge- were treated as bands using local orbitals. The Brillouin zone was sampled using a k-point mesh.
This DFT band structure is used as the starting point for the quasiparticle self-consistent (QS) method.van Schilfgaarde et al. (2006); Kotani et al. (2007) The method is a many-body perturbation theoretical method first introduced by Hedin.Hedin (1965); Hedin and Lundqvist (1969) In this method, the complex and energy dependent self-energy describes the dynamic interaction effects beyond the DFT level self-consistent field. In the approximation it is given in terms of the one-electron Green’s function and the screened Coulomb interaction, , as , where is a short hand for the position, spin and time of particle 1 and indicates a time infinitesimally after . The screened Coulomb interaction is itself obtained from the Green’s function via and , where is the bare Coulomb interaction and the screened one. All of these equations are in fact solved after Fourier transformation to k-space and energy and in a basis set of auxiliary Bloch functions, which consists of product functions of muffin-tin orbitals inside the spheres and interstitial plane waves. But the above real-space and time notation just provides the most concise way of stating the method’s approximations. Details of the basis set implementation in terms of muffin-tin orbitals are provide in Ref.Kotani et al., 2007
In the QS method,Kotani et al. (2007) the energy dependent self-energy matrix in the basis of the independent electron Hamiltonian (LDA) eigenstates is replaced by an energy averaged and Hermitian matrix
| (1) |
This then replaces the starting LDA (or GGA) exchange-correlation potential and defines a new independent particle Hamiltonian whose eigenvalues and eigenstates provide a new and through the next calculation the next . The process is then iterated till the self-energy is self-consistent at which point the Kohn-Sham eigenvalues of coincide with the quasiparticle excitation energies of the many-body theory. Hence the name quasiparticle self-consistent . Note that in the process the eigenfunctions are recalculated in each step by rediagonalizing the of that iteration which includes the instead of the original from the previous step. The details of the implementation of the QS method and various technical aspects can be found in Ref. Kotani et al., 2007. In the present QS calculation, the is calculated up to Ry, and is approximated by a diagonal average matrix when it is above 2 Ry before calculating the quasiparticle shifts in the next step. A cut-off of 3.5 Ry is used for the interstitial plane-waves and for the Coulomb interactions auxiliary basis set. The k-point mesh over which the self-energy is evaluated was set as . The is at this point known as a matrix in the basis of eigenstates . Expanding these in the basis set of muffin-tin orbital Bloch functions , and subsequently each of these into by an inverse Bloch sum (or discrete Fourier transform) the is then obtained in real space up to a certain range. Here, denotes the site in the unit cell, the angular momentum and other indices needed to specify the specific basis function centered at this site, and the lattice vectors. This can now be converted back by a direct Bloch sum to the k-point set used for the charge self-consistency iterations of and eventually also to the k-points along symmetry lines of the Brillouin zone for the band structure plots. This effective interpolation scheme allows us to obtain the bands at the level at any k-point and hence also accurate effective masses. It is essentially equivalent to a Wannier function interpolation scheme, except that in the LMTO approach we do not need to construct Wannier functions because we already have a relatively short-range atom centered basis set.
Finally, we note that in the QS approximation, the screening of the Coulomb interactions is usually found to be underestimated by about 20 %,Deguchi et al. (2016); Bhandari et al. (2018) resulting in band gaps being overestimated. This can be corrected by mixing 80% of the with 20 % of the original LDA and is referred to as the approximation. We note that this may sound similar to a hybrid functional but is in practice quite different because there is no adjustment of this fraction involved and this represents in effect going beyond standard by including additional diagrams in the calculation of which could now in fact be done explicitly following the Bethe-Salpeter Equation (BSE) approach,Cunningham et al. (2018) but at a much higher cost than the standard QS + 80 % renormalization. In other words, where the calculations have been done at this beyond standard level, for example using a time dependent DFT (TDDFT) approach with an exchange correlation kernel in the screening of extracted from BSE,Shishkin et al. (2007); Chen and Pasquarello (2015) they tend to confirm the 80% renormalization approach as analyzed in Ref. Bhandari et al., 2018.
III Results
III.1 Crystal structure
| Compound | method | (Å) | (Å) | (Å) | (Å3) | ||
|---|---|---|---|---|---|---|---|
| BeSiN2 | LDA | 5.67 | 4.92 | 4.62 | 128.9 | 1.74 | 1.63 |
| GGA | 5.75 | 4.98 | 4.68 | 134.0 | 1.73 | 1.63 | |
| Expt.111From EckerlinEckerlin | 5.747 | 4.977 | 4.674 | 133.7 | 1.73 | 1.63 | |
| LDA222From Shaposhnikov et al. Shaposhnikov et al. (2008) | 5.697 | 4.939 | 4.639 | 133.7 | 1.73 | 1.63 | |
| GGA b | 5.772 | 4.999 | 4.699 | 135.6 | 1.73 | 1.63 | |
| BeGeN2 | LDA | 5.81 | 5.07 | 4.77 | 140.5 | 1.75 | 1.64 |
| GGA | 5.93 | 5.17 | 4.86 | 149.0 | 1.74 | 1.64 | |
| LDAb | 5.856 | 5.105 | 4.803 | 143.6 | 1.74 | 1.64 | |
| GGAb | 5.972 | 5.204 | 4.894 | 152.1 | 1.74 | 1.64 |
The calculated lattice constants for BeSiN2 and BeGeN2 in both LDA and GGA are given in Table 1. The space group is and the order of the lattice constants is chosen so that . The relation of the lattice constants in the idealized orthorhombic structure to those in the wurtzite structure is given by , and . The optimized ratio indicates how far the structure is from the idealized wurtzite structure. From the results in Table 1 we can see that BeSiN2 is closer to the idealized wurtzite structure than BeGeN2. The GGA lattice constants are systematically larger than the LDA ones which is commonly found. We also compare our relaxed lattice constants with those reported in literature and with the experimental values for BeSiN2. Good agreement is found. Only the experimental lattice constants of BeSiN2 are available. In this case, we can see that GGA lattice constants are more accurate than LDA ones. Both LDA and GGA produce nearly the same and ratios in both materials studied here. The crystal structure of BeSiN2 is shown in Fig. 1 and BeGeN2 has a similar structure.
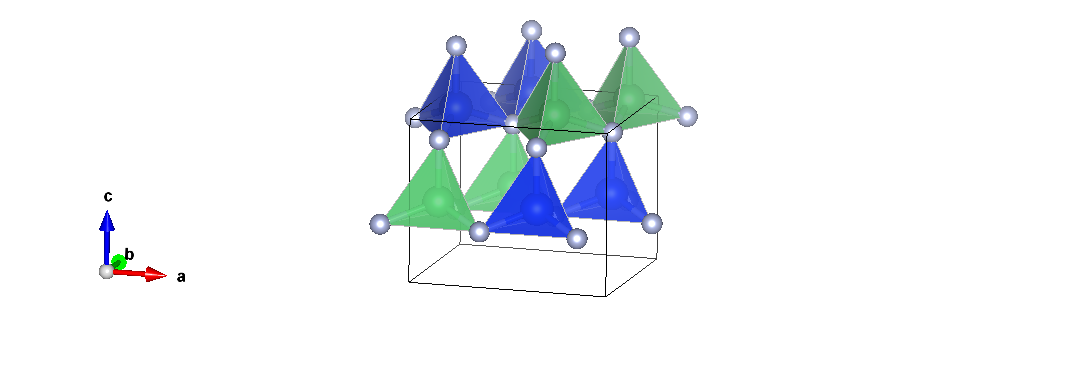
The atomic positions of the atoms in the unit cell are given in terms of Wyckoff 4a positions in Table 2. The origin is set at the position of the 2-fold screw axis in the plane. We may note that the nitrogen atoms are sitting nearly on top of the Be and group-IV atoms which shows that BeSiN2 has its orthorhombic crystal structure very close to the supercell of wurtzite without much distortion.
| Compound | atom | |||
|---|---|---|---|---|
| BeSiN2 | Be | 0.125 | 0.083 | -0.013 |
| Si | 0.625 | 0.086 | -0.014 | |
| NBe | 0.127 | 0.084 | 0.365 | |
| NSi | 0.623 | 0.080 | 0.362 | |
| BeGeN2 | Be | 0.125 | 0.080 | -0.013 |
| Ge | 0.624 | 0.091 | -0.013 | |
| NBe | 0.115 | 0.072 | 0.351 | |
| NGe | 0.634 | 0.091 | 0.375 |
III.2 Formation energy and stability
We next check the thermodynamic stability. The energies of formation are calculated from the cohesive energies as given in Table 3 which are calculated in the GGA approximation by subtracting the atomic energies from the solid’s total energy. The atomic energies include the spin-polarization energy. The N2 molecule was calculated in a large unit cell using the FP-LMTO method and including additional augmented plane wave basis functionsKotani and van Schilfgaarde (2010) to well represent the region outside the molecule, which is important to obtain total energies which are not sensitive to the choice of muffin-tin radii. The energies of formation of both compounds are negative, meaning that they are stable relative to the elements in their respective phases at standard conditions (room temperature and atmospheric pressure). They are also found to be stable relative to the competing binary compounds. The formation energies of the latter were calculated for the phases already found to be the minimum energy structures in the Materials Project mp and compared with the data in that database in Table 3. They show that the BeSiN2 is stable against the reaction
| (2) |
by 0.136 eV/atom and similarly for the Ge case by 0.176 eV/atom.
| ours | MP333Material Projectmp | |
|---|---|---|
| Be | 3.44 | |
| Si | 4.49 | |
| Ge | 3.39 | |
| N | 5.17 | |
| Be3N2 | -1.24 | -1.225 |
| Si3N4 | -1.04 | -1.312 |
| Ge3N4 | -0.08 | -0.26 |
| BeSiN2 | -1.26 | -1.412 |
| BeGeN2 | -0.74 | -0.813 |
III.3 Energy bands and density of states
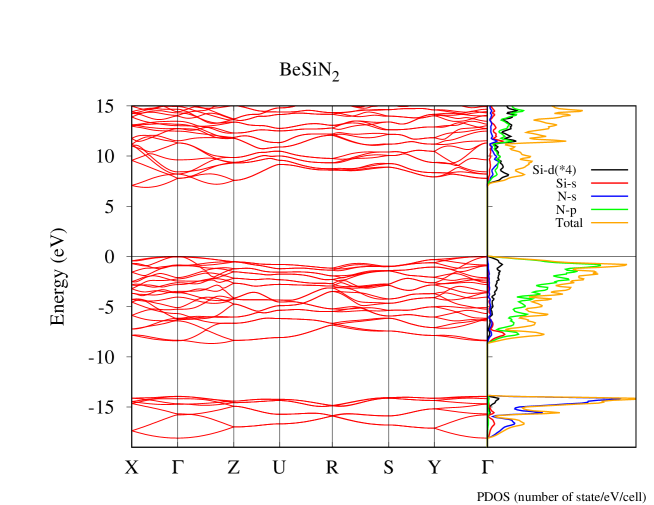
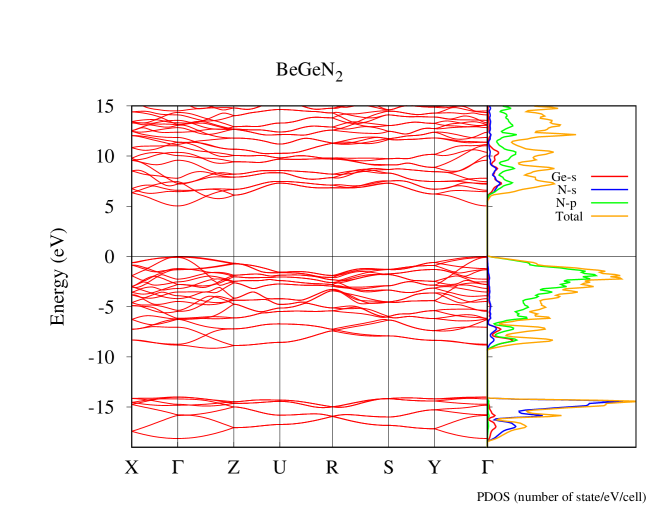
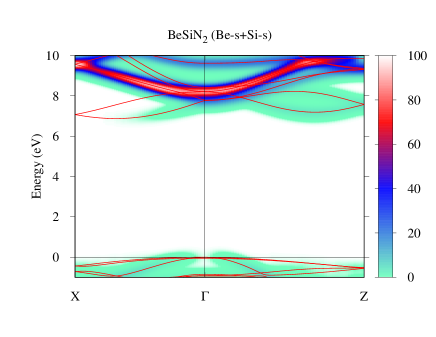
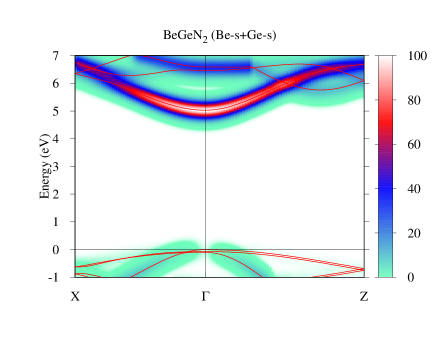
The band structures and partial densities of states (PDOS) in the 0.8 QS approximation at GGA lattice constants are shown in Fig. 2. The PDOS show that, as expected, the lowest set of 8 valence bands near eV are dominated by N- and the next set of valence bands (between eV and the VBM set at 0), by N- orbitals. The conduction bands have more cation character but also N- and N- because the cation states are antibonding with the N-orbitals. In the case of BeSiN2, we see it has even a strong Si- character. The conduction band orbital character will be analyzed in more detail in a k-resolved manner below.
BeGeN2 is found to be a direct band gap semiconductor while BeSiN2 has an indirect band gap. In BeGeN2, both the CBM and VBM occur at the point. An indirect band gap was previously also found for ZnSiN2,Punya et al. (2011) MgSiN2Jaroenjittichai and Lambrecht (2016) and CdSiN2Lyu and Lambrecht (2017). However, in those cases, the CBM is at and the VBM near one of the Brillouin zone edges. On the other hand, in BeSiN2, the VBM is at but the CBM is located between the and points. In Ref. Shaposhnikov et al., 2008, the CBM for BeSiN2 occurs between and which is simply because of the difference in labeling. Their is actually labeled as in the present work because the and axes are interchanged. This location of the CBM is robust and in agreement between LDA, GGA and QS calculations. The CBM position is at 2/3 of the line irrespective of whether we use the LDA or GGA lattice constants.
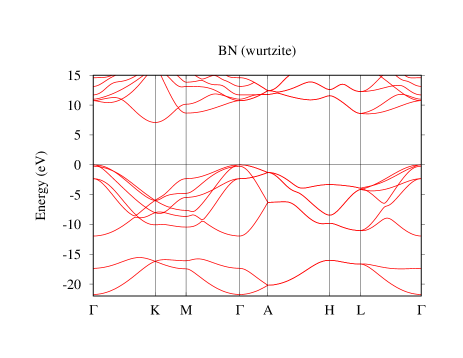
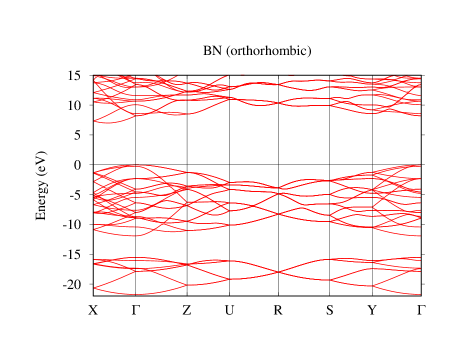
To further investigate the origin of the indirect gap in BeSiN2, we compare it with the band structure of wurtzite BN, which is shown in Fig. 3. Note that wurtzite BN is the most closely related III-N parent compound of the II-IV-N2 compounds considered here because B is adjacent to Be in the periodic table. We first show it in the standard wurtzite hexagonal Brillouin zone and then in the Brillouin zone corresponding to the orthorhombic supercell for easier comparison to the II-IV-N2 materials whose primitive cell corresponds to this supercell of the underlying wurtzite type lattice.
We can understand these relations in terms of band folding. The relation between the hexagonal Brillouin zone and the orthorhombic Brillouin zone is shown in Fig. 3 of Ref. Lambrecht et al., 2005. The wurtzite line is folded in two along the -direction and becomes the direction in the orthorhombic structure. The is also folded along the direction but the point lies at along the direction and the orthorhombic about which we fold the bands lies at . So, the wurtzite w-BN conduction band minimum which occurs at of the hexagonal Brillouin zone ends up at 2/3 in the orthorhombic Brillouin zone. This is very close to the CBM location also in BeSiN2.
The band structure of w-BN in the CB is rather complex when folded in the orthorhombic zone and is itself not so well known because w-BN is a rare form of BN. In its tetrahedrally bonded modification which occur at high pressure, the zincblende form has lower energy than the wurtzite. So, we next address the relation between zincblende and wurtzite BN. First, in z-BN, the CBM occurs at of the fcc Brillouin zone and in w-BN it occurs at of the hexagonal Brillouin zone. Both of these states are mixtures of and -like atomic orbitals and also have a strong component in the interstitial region, in particular the large open channel of wurtzite. A similar situation has recently been pointed out for SiC.Matsushita et al. (2012) But here we are concerned with the states at . Even in z-BN the -like lies below the -like . In wurtzite, the splits into (-like) and (-like) states. So at in w-BN, the conduction band ordering of states is , , and only the third band is the -like . Now after folding into the orthorhombic BZ, the lowest three conduction bands at all arise from the folding of the and bands, the next two, a degenerate and nondegenerate band near about 10-11 eV are derived from the wurtzite B--like states and the band a little below 12 eV is the B--like state.
Comparing this with BeSiN2, it becomes clear that here the derived states lie higher than the -like . This is because the Si- like states lie at higher energy than B- like states. The CBM at is a folded state but the next band already has a strong -like character on both Be and Si. This can be seen in Fig. 4. In this figure we show the band colored according to their weight on muffin-tin orbital basis functions of specific angular momentum character centered on the different atoms. We recognize the typical strongly dispersing mixed cation -like conduction band in both materials, but while this is the lowest conduction band in BeGeN2, it lies just a bit higher in the BeSiN2 case above the folded bands discussed above. Additional colored band structures reflecting their other atomic orbital characters are given in Supplementary Material.sup The CBM has contributions from Be-, Si- antibonding with N- and N-. This is also clear from the PDOS except that the k-resolved analysis of the orbital character provides more detailed information. So, in summary, the reason for the indirect band structure and the CBM location in the Brillouin zone is explained by its relation to w-BN parent compound of which we can view BeSiN2 to be a perturbation. In turn the w-BN band structure is related to that of z-BN by band folding effects. The ordering of these bands depends sensitively on the ordering of atomic and -orbitals in the second row of the periodic table elements Be an B and the larger splitting of and valence orbitals in Ge than Si.
In BeGeN2, the conduction band has a stronger dispersion near its minimum at , while the valence bands are quite flat. Nonetheless the lowest conduction band dispersion near its minimum is less pronounced than in MgGeN2, ZnGeN2 or CdGeN2. This is because the Be- states lie less deep on an absolute scale.
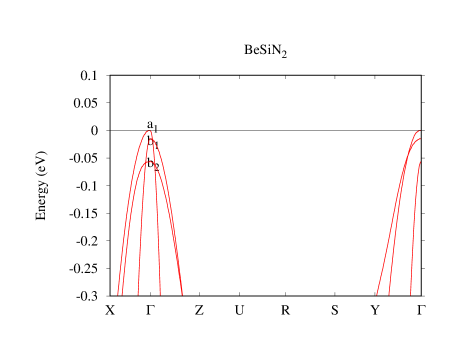
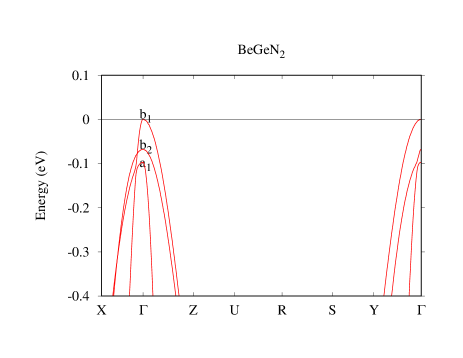
A zoom-in of the electronic band structure near the VBM region for BeSiN2 and BeGeN2 is shown in Fig. 5. Here, the energy levels at point are labeled by their related irreducible representation of point group . The states , , , correspond to basis function , respectively. These symmetry labels are helpful to understand whether the optical transitions from the valence bands to the conduction band minimum at point are dipole-allowed or not. In the case of BeGeN2, the CBM has symmetry, so the dipole-allowed optical transitions are from valence states when , when , and when , respectively. The crystal field splitting of the energy levels near the VBM at the point are given in Table 4. In both cases, the top three valence bands have and symmetries but they occur in different order in the two compounds. The dispersion of this manifold of three bands near the VBM can be represented by a Kohn-Luttinger type Hamiltonian further discussed in the next section.
The typical automated plotting program only connects the bands according to their band number in terms of increasing energy does not take into account which bands are allowed to cross or not. Therefore to obtain the correct band connectivity a very fine mesh is needed. We here used about 100 points along each direction. We can somewhat further inspect which bands cross or have avoided crossings. For example, for along the direction, the group of only contains the identity and the mirror plane. Now, and are even with respect to this mirror plane but is odd. Therefore the band emanating from can cross the one from but the ones from and have an avoided crossing because they are allowed to interact having he same even symmetry. Similarly along , the remaining group consists of the identity and the mirror plane. With respect to this mirror plane and are even but is odd. Therefore we see that the and band do not cross.
The band gaps of BeSiN2 and BeGeN2 calculated by DFT and 0.8 QS at LDA and GGA lattice constants are summarized in Table 5. For comparison, the band gaps in w-BN are 7.09 eV (indirect ) and 10.76 eV (direct at ). For BeGeN2, the change in the gap from LDA to GGA lattice constants is as expected for tetrahedrally bonded materials: larger lattice constants relaxed in GGA gives rise to smaller band gaps. The change in gap with respect to the unit cell volume can be quantified by the deformation potential, . The deformation potential of BeSiN2 is eV from finite difference calculation, and for BeGeN2 is eV. The large difference between the two reflects the fact that the orbital character of the CBM is different in both materials. In BeGeN2, we see that the smaller lattice volume of LDA gives rise to a larger gap already at the DFT level and this is maintained in the QS approximation. For BeSiN2, we give both the lowest indirect gap and the direct gap at . In this case, surprisingly, the QS gaps at the GGA lattice constants are slightly larger than those at the LDA lattice constants, even though the lattice constants are larger in GGA. This results from the different orbital character of the CBM in this material. Apparently the deformation potentials of the indirect CBM and even the CBM at states are different from the usual (or -symmetry) CBM in BeGeN2 or other II-IV-N2 materials.
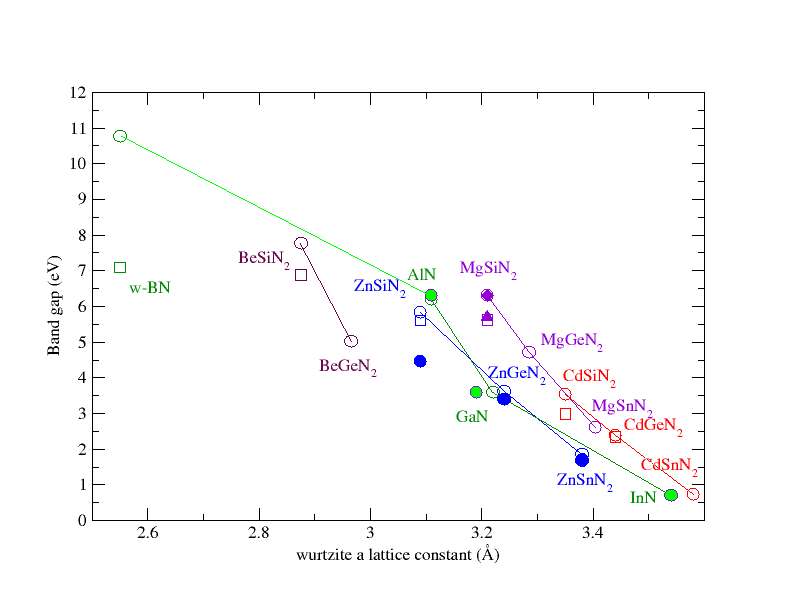
To compare the band gaps of these materials with related III-N and other II-IV-N2 semiconductors, it is useful to show them in a band gap versus lattice constant diagram as shown in in Fig. 6. The lines here are just guides to the eye and do not include alloy band gap bowing effects. We can see from this plot that these materials fall somewhere in between w-BN and the other III-N or II-IV-N2 materials.
The direct band gap of BeGeN2 of 5.03 eV corresponds to a wave length of the emitted or absorbed light of 246 nm in the UV region. The gap is still somewhat lower than in AlN (6.3 eV) but still possibly useful to push LEDs toward deep UV compared with GaN or ZnGeN2. The gap however is only slightly larger than in MgGeN2, another direct gap material but occurs at a much smaller lattice constant, so it will be more difficult to integrate with GaN or ZnGeN2 in heterostructures. The direct band gap of BeSiN2 of 7.77 eV corresponds to 159 nm and is even higher than that in AlN but the indirect nature makes it somewhat less attractive for such applications. It might still be a useful material for UV detectors.
| BeSiN2 | BeGeN2 | ||
|---|---|---|---|
| Sym. | Sym. | ||
| BeSiN2 | BeGeN2 | |||
|---|---|---|---|---|
| indirect | direct | direct | ||
| Ref. Huang et al.,2001 | DFT LDA | 5.08 | 5.7444estimated from the band structure figure | 5.24555Their lattice constants are smaller than that in this work |
| Ref. Shaposhnikov et al.,2008 | DFT LDA | 4.95 | 5.82 | 3.69 |
| DFT GGA | 5.19 | 5.93 | 3.37 | |
| This work | DFT LDA | 4.96 | 5.80 | 4.12 |
| DFT GGA | 5.13 | 5.95 | 3.45 | |
| GW LDA | 6.82 | 7.74 | 5.88 | |
| GW GGA | 6.88 | 7.77 | 5.03 | |
III.4 Effective masses
| BeSiN2 | BeGeN2 | |
|---|---|---|
| 0.54 | 0.44 | |
| 0.68 | 0.54 | |
| 0.36 | 0.33 | |
| 2.59 | 2.00 | |
| 2.91 | 2.03 | |
| 0.25 | 0.22 | |
| 0.37 | 0.26 | |
| 4.52 | 2.09 | |
| 2.33 | 1.89 | |
| 5.77 | 2.15 | |
| 0.33 | 0.27 | |
| 2.54 | 1.88 |
| BeSiN2 | BeGeN2 | |
|---|---|---|
| -4.00 | -4.55 | |
| 3.59 | 4.01 | |
| 0.02 | -0.001 | |
| -0.36 | -0.50 | |
| -1.17 | -1.63 | |
| -0.07 | 0.04 | |
| -0.02 | -0.004 | |
| 0.12 | -0.03 | |
| 1.33 | 1.65 |
Finally, we determined the effective masses. As mentioned in the computational section, these include the corrections to the bands. The CBM and VBM effective masses are given in Table 6. These correspond to the actual CBM between X and in BeSiN2 and to the CBM at in BeGeN2. The effective masses here can be seen to be significantly larger than in ZnGeN2 or CdGeN2 or even MgGeN2. As already mentioned, this corresponds to the lower dispersion of these bands and the less deep Be- atomic energy levels on an absolute scale. The VBM is nearly degenerate but we give here the masses in the three Cartesian directions for the three highest VB states. We can see that for both materials and for each state, there is one direction with a small mass and two with a large mass . The direction of the small mass is the same in the two materials. In this case of orthorhombic crystal structure, the Cartesian axes coincide with crystal axes, i.e., . The effective masses decrease from BeSiN2 to BeGeN2, which is consistent with the trend found in other II-IV-N2 compounds. The three upper valence bands can be best described by a Luttinger-like effective Hamiltonian.Punya et al. (2011) The inverse mass parameters in such a Hamiltonian for the three top valence bands in BeSiN2 and BeGeN2 are derived from the masses given in Table 6 and given in Table 7.
IV Conclusion
In this paper we considered the Be-IV-N2 compounds, BeSiN2 and BeGeN2, of which only the former has been synthesized in the past. This study should be viewed in the context of the until now underexplored broader family of II-IV-N2 semiconductors. We determined their optimized lattice parameters and internal structural parameters and found them to be in good agreement with previous DFT calculations and the limited available experimental data. Their band structures were determined with the accurate and predictive QS method and indicate these materials have gaps in the deep UV. The indirect nature of the band gap of BeSiN2 is confirmed at the QS level. Effective masses were determined as well as band gap deformation potentials and details of the valence band splittings, which are necessary for future exploitation of these materials in heterostructure devices. In a band gap versus lattice constant plot, they fall in a quite well separated area from the other III-N or II-IV-N2 semiconductors, with a lattice volume closer to those of the ultra wide band gap and extremely hard materials, diamond and tetrahedrally bonded cubic and wurtzite BN. We discussed the relation of their band structure to that of wurtzite BN in terms of band folding, which helps to explain the indirect nature of the gap of BeSiN2 ad the location of its CBM at 2/3 .
Acknowledgements.
This work was supported by the National Science Foundation, Division of Materials Research under grant No. 1533957 and the DMREF program. Calculations made use of the High Performance Computing Resource in the Core Facility for Advanced Research Computing at Case Western Reserve University.References
- Lambrecht and Punya (2013) W. R. L. Lambrecht and A. Punya, in III-Nitride Semiconductors and their Modern Devices, edited by B. Gill (Oxford University Press, 2013) Chap. 15, pp. 519–585.
- Martinez et al. (2017) A. D. Martinez, A. N. Fioretti, E. S. Toberer, and A. C. Tamboli, J. Mater. Chem. A 5, 11418 (2017).
- Lyu et al. (2018) S. Lyu, D. Skachkov, E. W. Blanton, K. Kash, and W. R. L. Lambrecht, “Band gaps, band-offsets, disorder, stability region and point defects in ii-iv-n2 semiconductors,” (2018), submitted to Phys. Status Solidi(a) special issue.
- (4) P. Eckerlin, A. Rabenau, and H. Nortmann, Zeitschrift für anorganische und allgemeine Chemie 353, 113.
- (5) P. Eckerlin, Zeitschrift für anorganische und allgemeine Chemie 353, 225.
- Huang et al. (2001) J. Y. Huang, L.-C. Tang, and M. H. Lee, Journal of Physics: Condensed Matter 13, 10417 (2001).
- Shaposhnikov et al. (2008) V. L. Shaposhnikov, A. V. Krivosheeva, F. A. D’Avitaya, J.-L. Lazzari, and V. E. Borisenko, physica status solidi (b) 245, 142 (2008).
- van Schilfgaarde et al. (2006) M. van Schilfgaarde, T. Kotani, and S. Faleev, Phys. Rev. Lett. 96, 226402 (2006).
- Schlegel (1982) H. B. Schlegel, J. Comp. Chem. 3, 214 (1982).
- Gonze et al. (0211) X. Gonze, J. M. Beuken, R. Caracas, F. Detraux, M. Fuchs, G. M. Rignanese, L. Sindic, M. Verstraete, G. Zerah, and F. Jollet, Computational Materials Science 25,3, 478 (2002/11).
- Perdew et al. (1996) J. P. Perdew, K. Burke, and M. Ernzerhof, Phys. Rev. Lett. 77, 3865 (1996).
- Hartwigsen et al. (1998) C. Hartwigsen, S. Goedecker, and J. Hutter, Phys. Rev. B 58, 3641 (1998).
- Fuchs and Scheffler (1999) M. Fuchs and M. Scheffler, Comput. Phys. Commun. 119, 67 (1999).
- Kohn and Sham (1965) W. Kohn and L. J. Sham, Phys. Rev. 140, A1133 (1965).
- Methfessel et al. (2000) M. Methfessel, M. van Schilfgaarde, and R. A. Casali, in Electronic Structure and Physical Properties of Solids. The Use of the LMTO Method, Lecture Notes in Physics, Vol. 535, edited by H. Dreyssé (Berlin Springer Verlag, 2000) p. 114.
- Kotani and van Schilfgaarde (2010) T. Kotani and M. van Schilfgaarde, Phys. Rev. B 81, 125117 (2010).
- (17) http://www.questaal.org/.
- Kotani et al. (2007) T. Kotani, M. van Schilfgaarde, and S. V. Faleev, Phys.Rev. B 76, 165106 (2007).
- Hedin (1965) L. Hedin, Phys. Rev. 139, A796 (1965).
- Hedin and Lundqvist (1969) L. Hedin and S. Lundqvist, in Solid State Physics, Advanced in Research and Applications, Vol. 23, edited by F. Seitz, D. Turnbull, and H. Ehrenreich (Academic Press, New York, 1969) pp. 1–181.
- Deguchi et al. (2016) D. Deguchi, K. Sato, H. Kino, and T. Kotani, Jap. J. Appl. Phys. 55, 051201 (2016).
- Bhandari et al. (2018) C. Bhandari, M. van Schilgaarde, T. Kotani, and W. R. L. Lambrecht, Phys. Rev. Materials 2, 013807 (2018).
- Cunningham et al. (2018) B. Cunningham, M. Grüning, P. Azarhoosh, D. Pashov, and M. van Schilfgaarde, Phys. Rev. Materials 2, 034603 (2018).
- Shishkin et al. (2007) M. Shishkin, M. Marsman, and G. Kresse, Phys. Rev. Lett. 99, 246403 (2007).
- Chen and Pasquarello (2015) W. Chen and A. Pasquarello, Phys. Rev. B 92, 041115 (2015).
- (26) https://materialsproject.org/.
- Punya et al. (2011) A. Punya, W. R. L. Lambrecht, and M. van Schilfgaarde, Phys. Rev. B 84, 165204 (2011).
- Jaroenjittichai and Lambrecht (2016) A. P. Jaroenjittichai and W. R. L. Lambrecht, Phys. Rev. B 94, 125201 (2016).
- Lyu and Lambrecht (2017) S. Lyu and W. R. L. Lambrecht, Phys. Rev. Materials 1, 024606 (2017).
- Lambrecht et al. (2005) W. R. L. Lambrecht, E. Alldredge, and K. Kim, Phys. Rev. B 72, 155202 (2005).
- Matsushita et al. (2012) Y.-i. Matsushita, S. Furuya, and A. Oshiyama, Phys. Rev. Lett. 108, 246404 (2012).
- (32) The supplementary material contains figures of the colored band structures which indicate the atomic orbital character of the bands for BeSiN2 and BeGeN2.
- Quirk et al. (2014) J. B. Quirk, M. Råsander, C. M. McGilvery, R. Palgrave, and M. A. Moram, Applied Physics Letters 105, 112108 (2014), http://dx.doi.org/10.1063/1.4896134.